
Morphology of Dome- and Tepee-Like Landforms Generated by Expansive Hydration of Weathering Anhydrite: A Case Study at Dingwall, Nova Scotia, Canada


Abstract
:1. Introduction
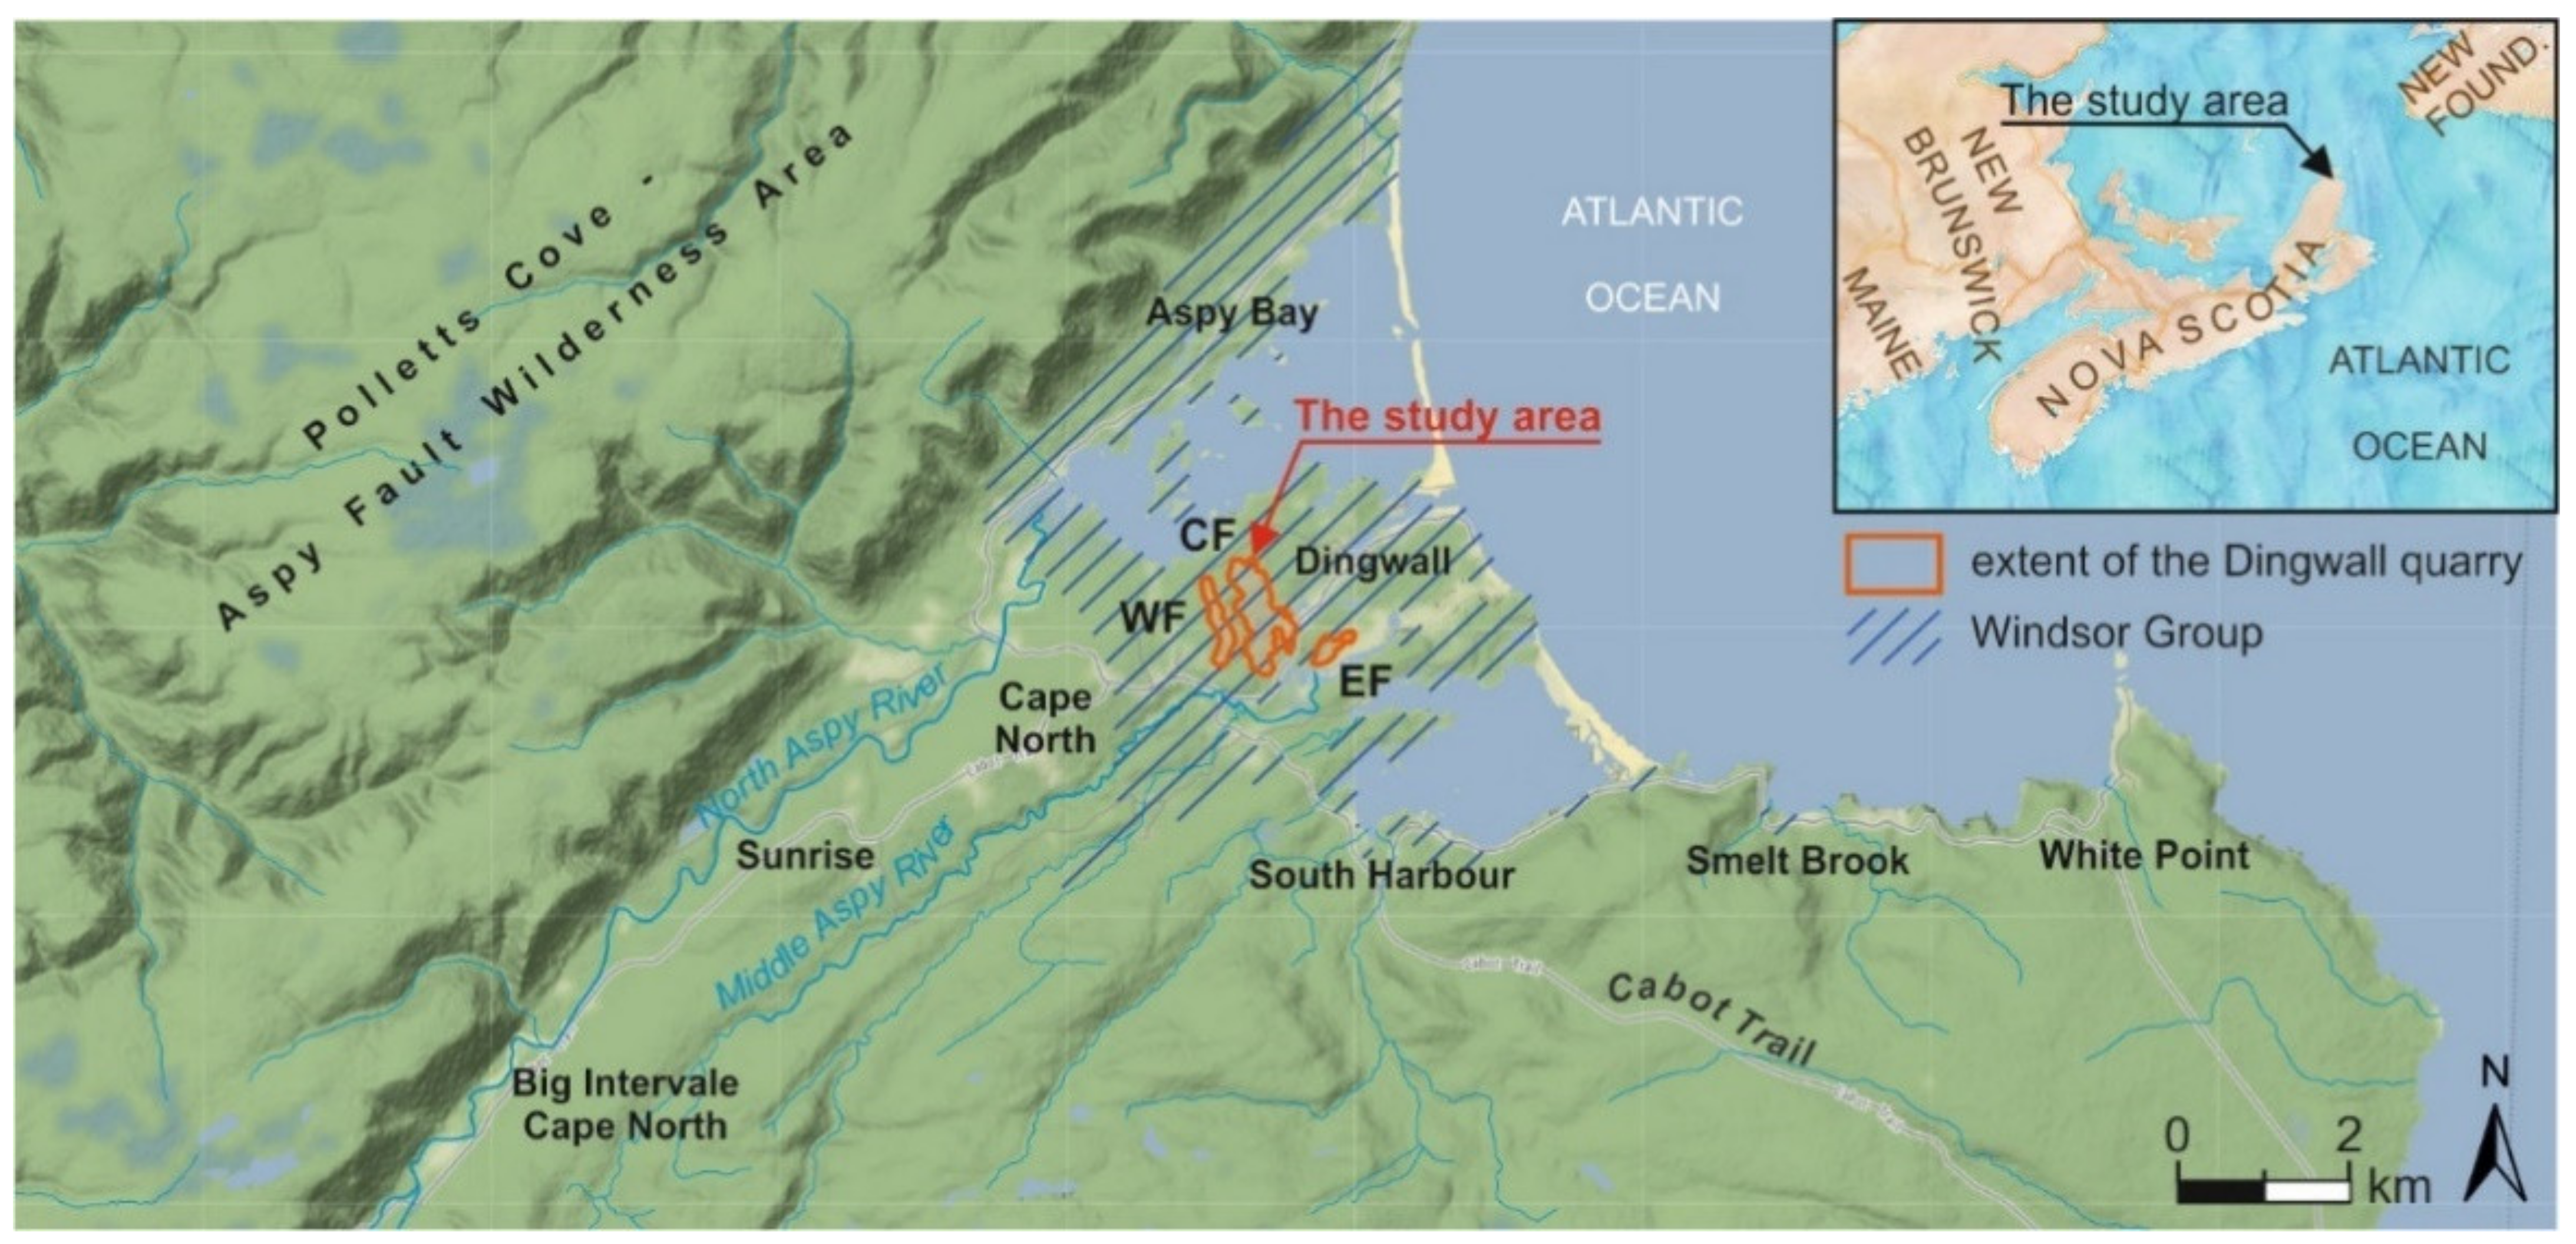
2. Study Area
3. Materials and Methods
3.1. Field and Laboratory Photogrammetric Works
3.2. Methodology of Dataset Analysis
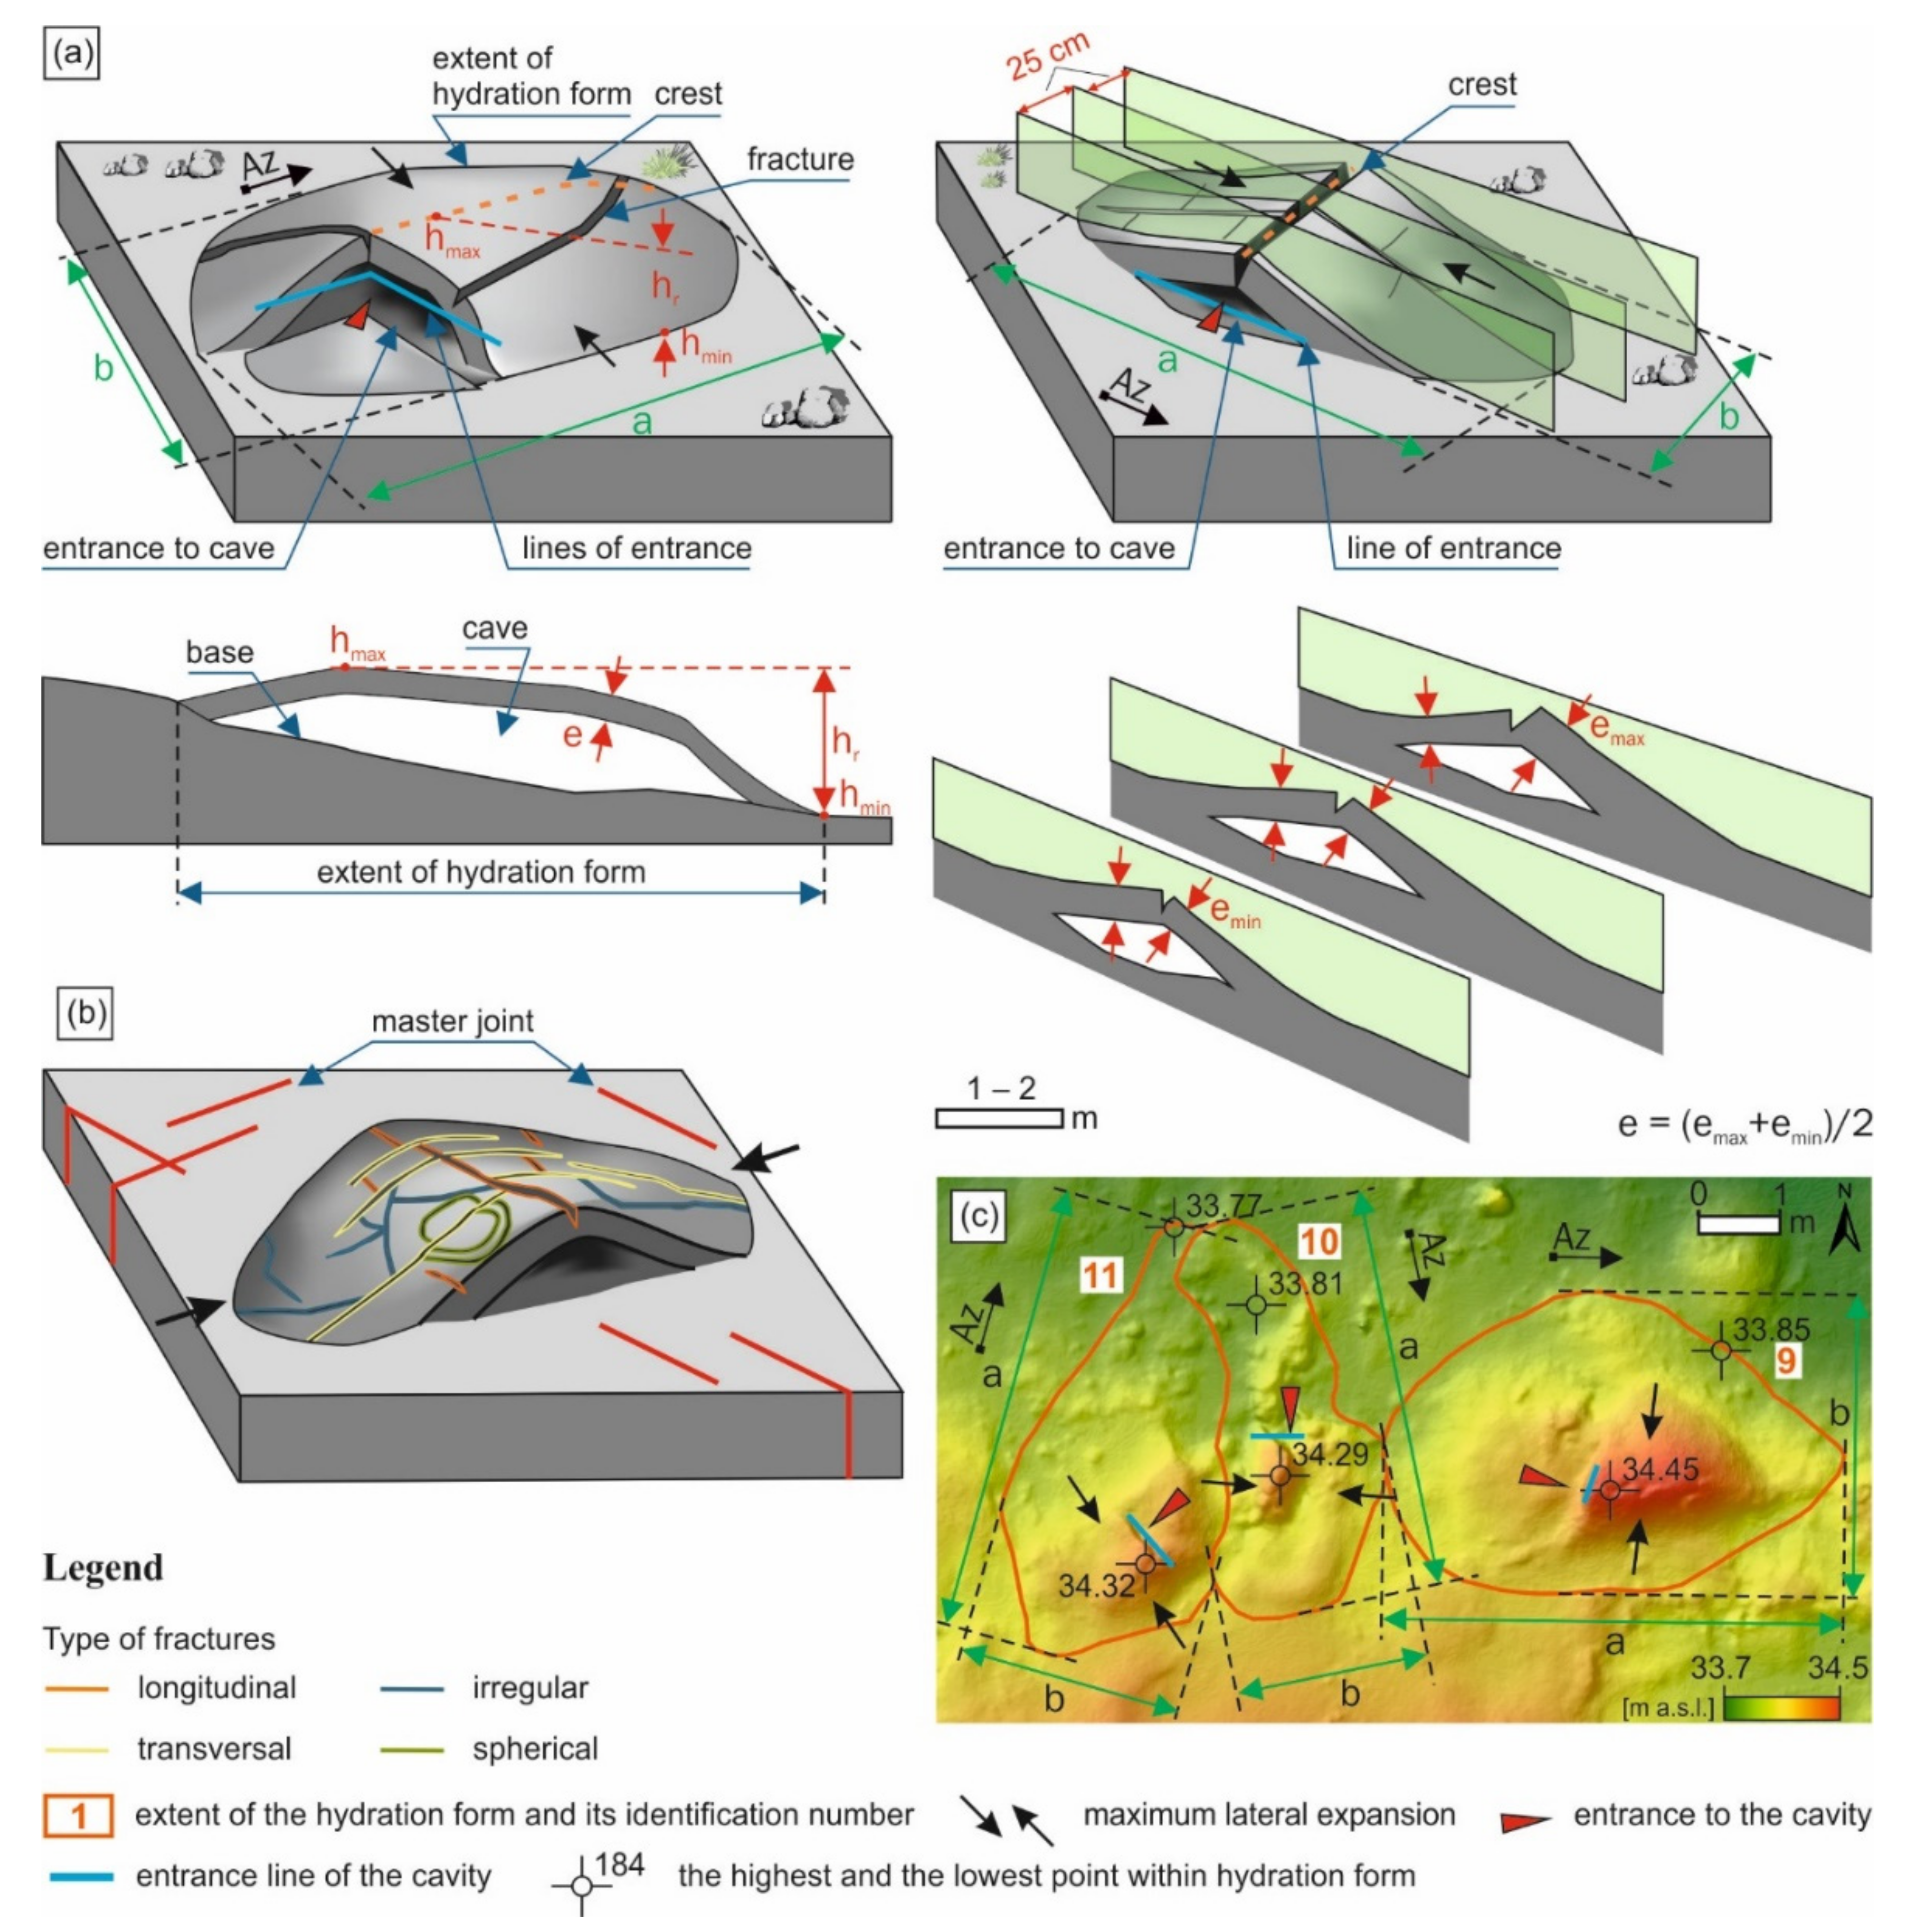
3.2.1. Analysis of Morphology and Morphometry
3.2.2. Analysis of Structural Elements
- Σls—sum of the length of the fracture traces within the hydration form surface measured in 3D (m)
- P—surface area of hydration form (m2)
4. Results
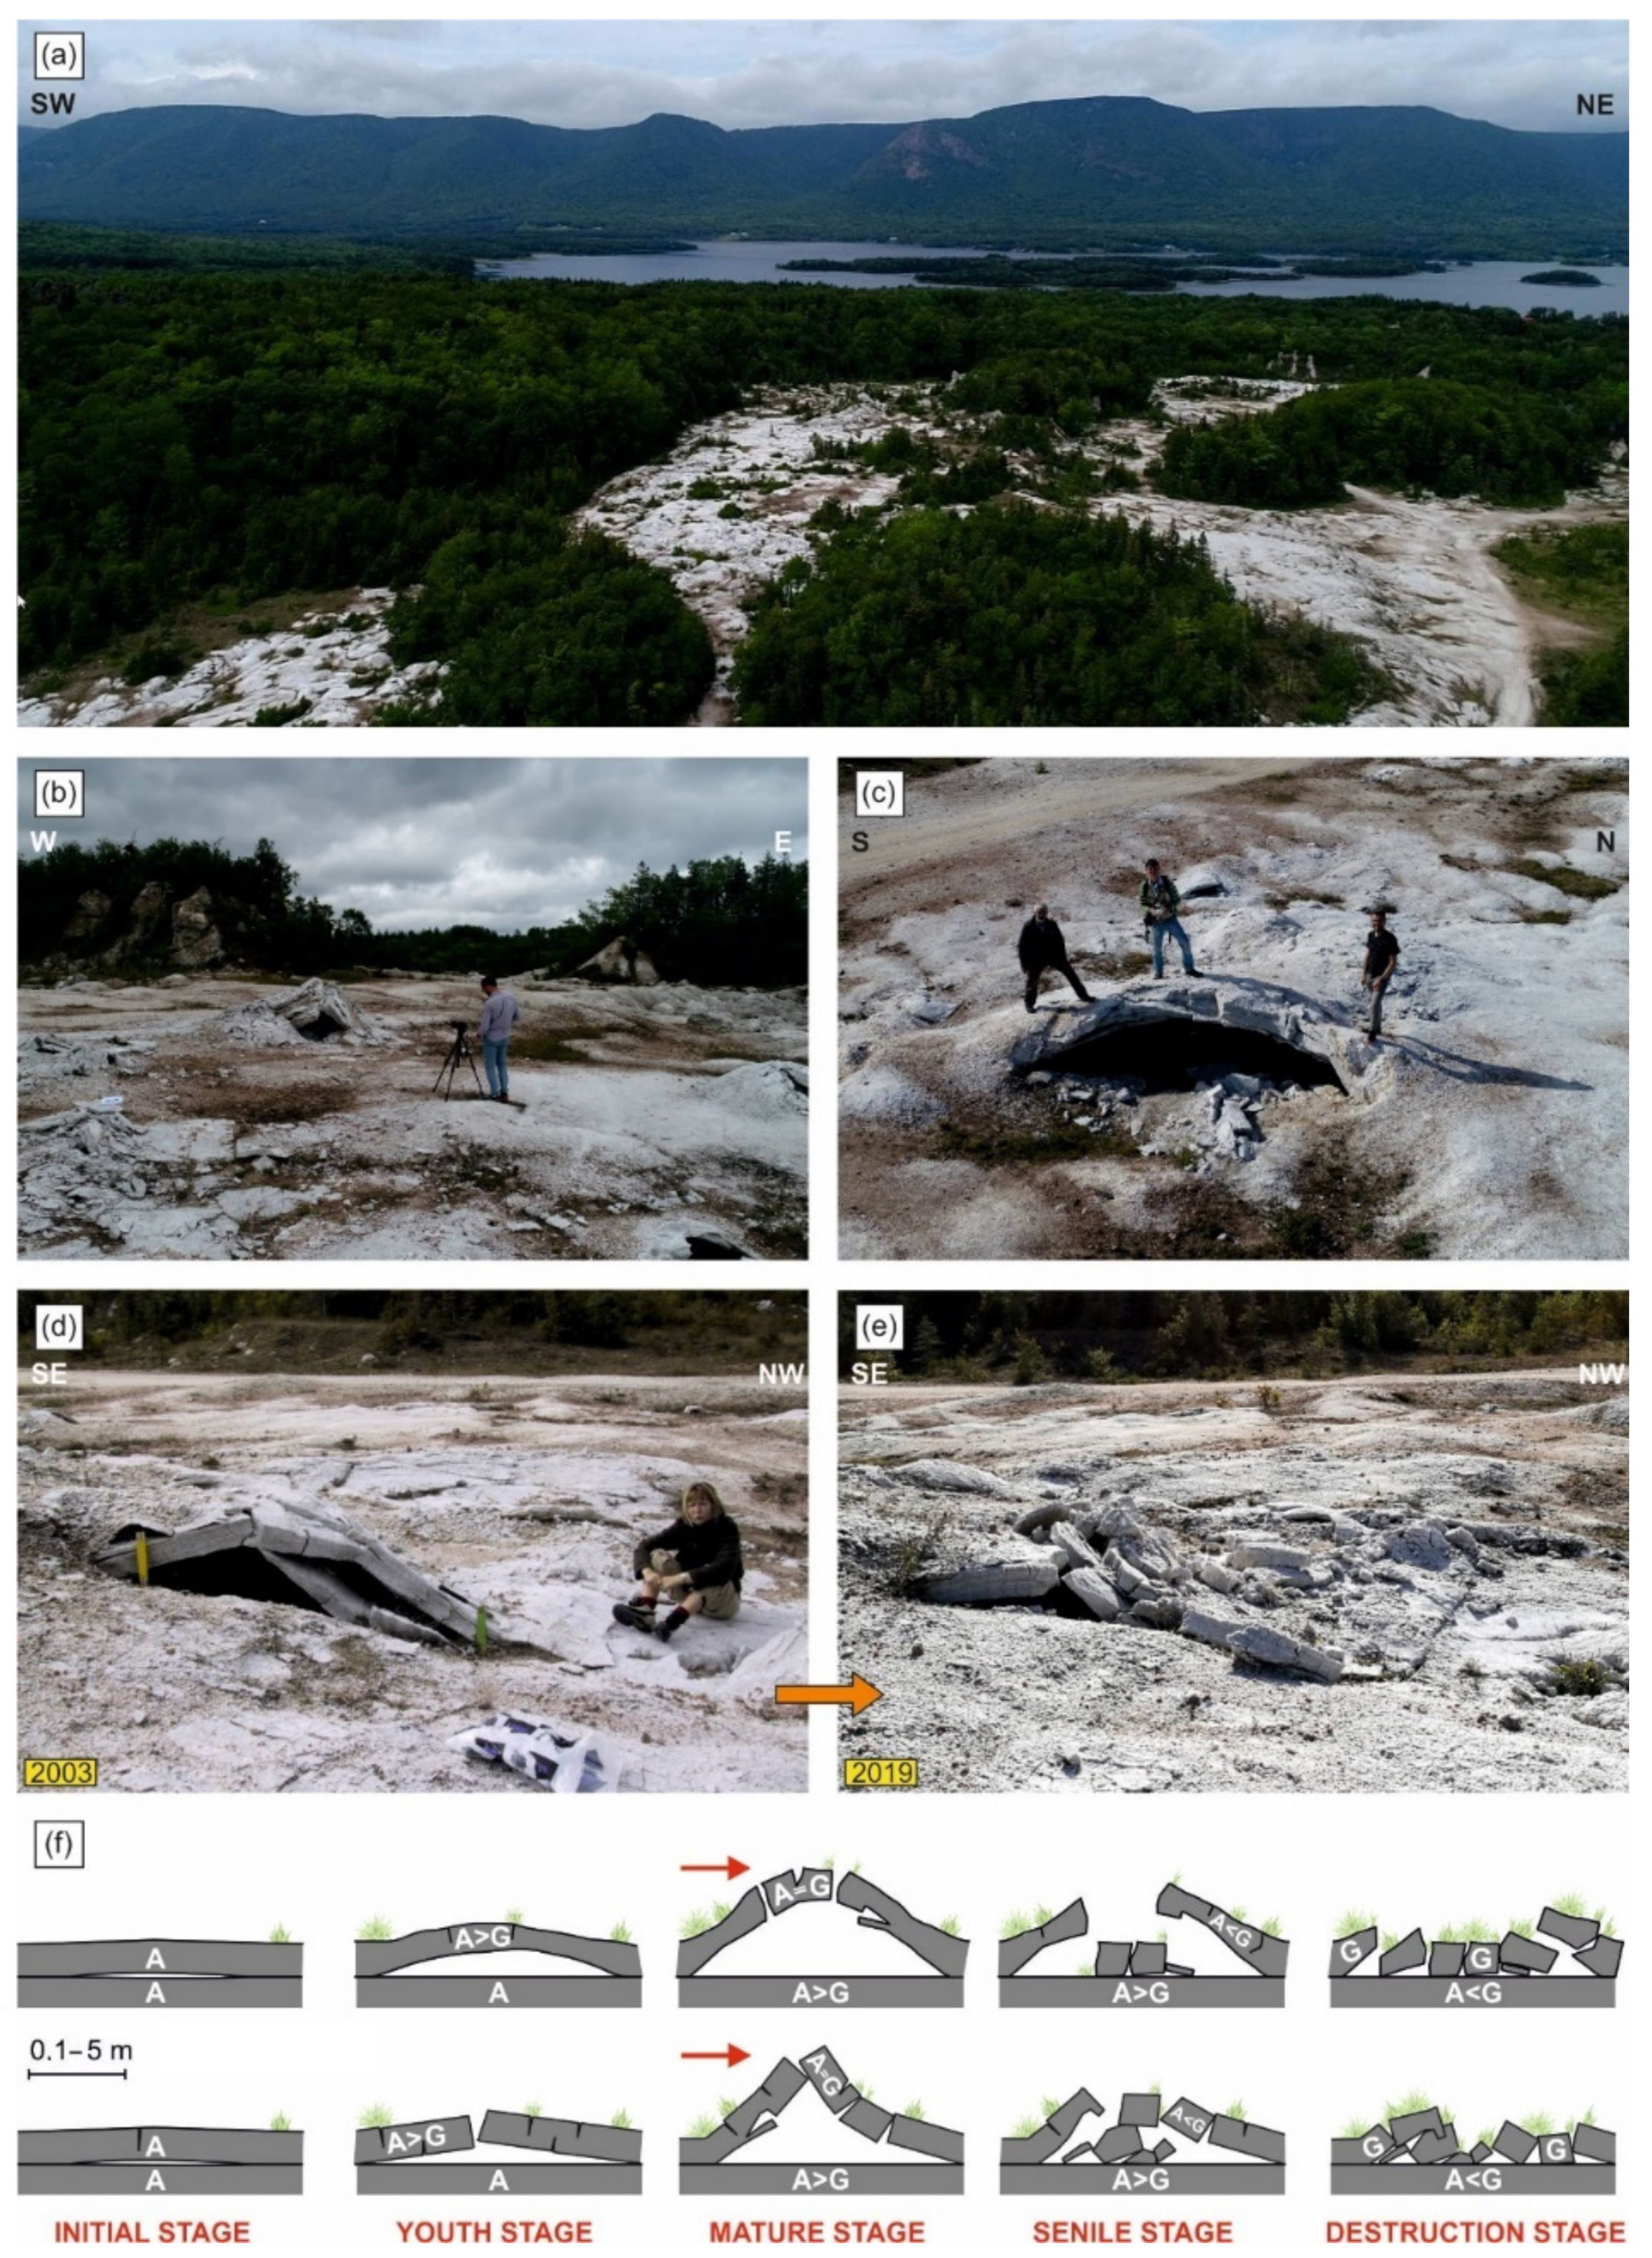
4.1. Morphology of the Quarry Bottom
4.2. Distribution of Hydration Landforms
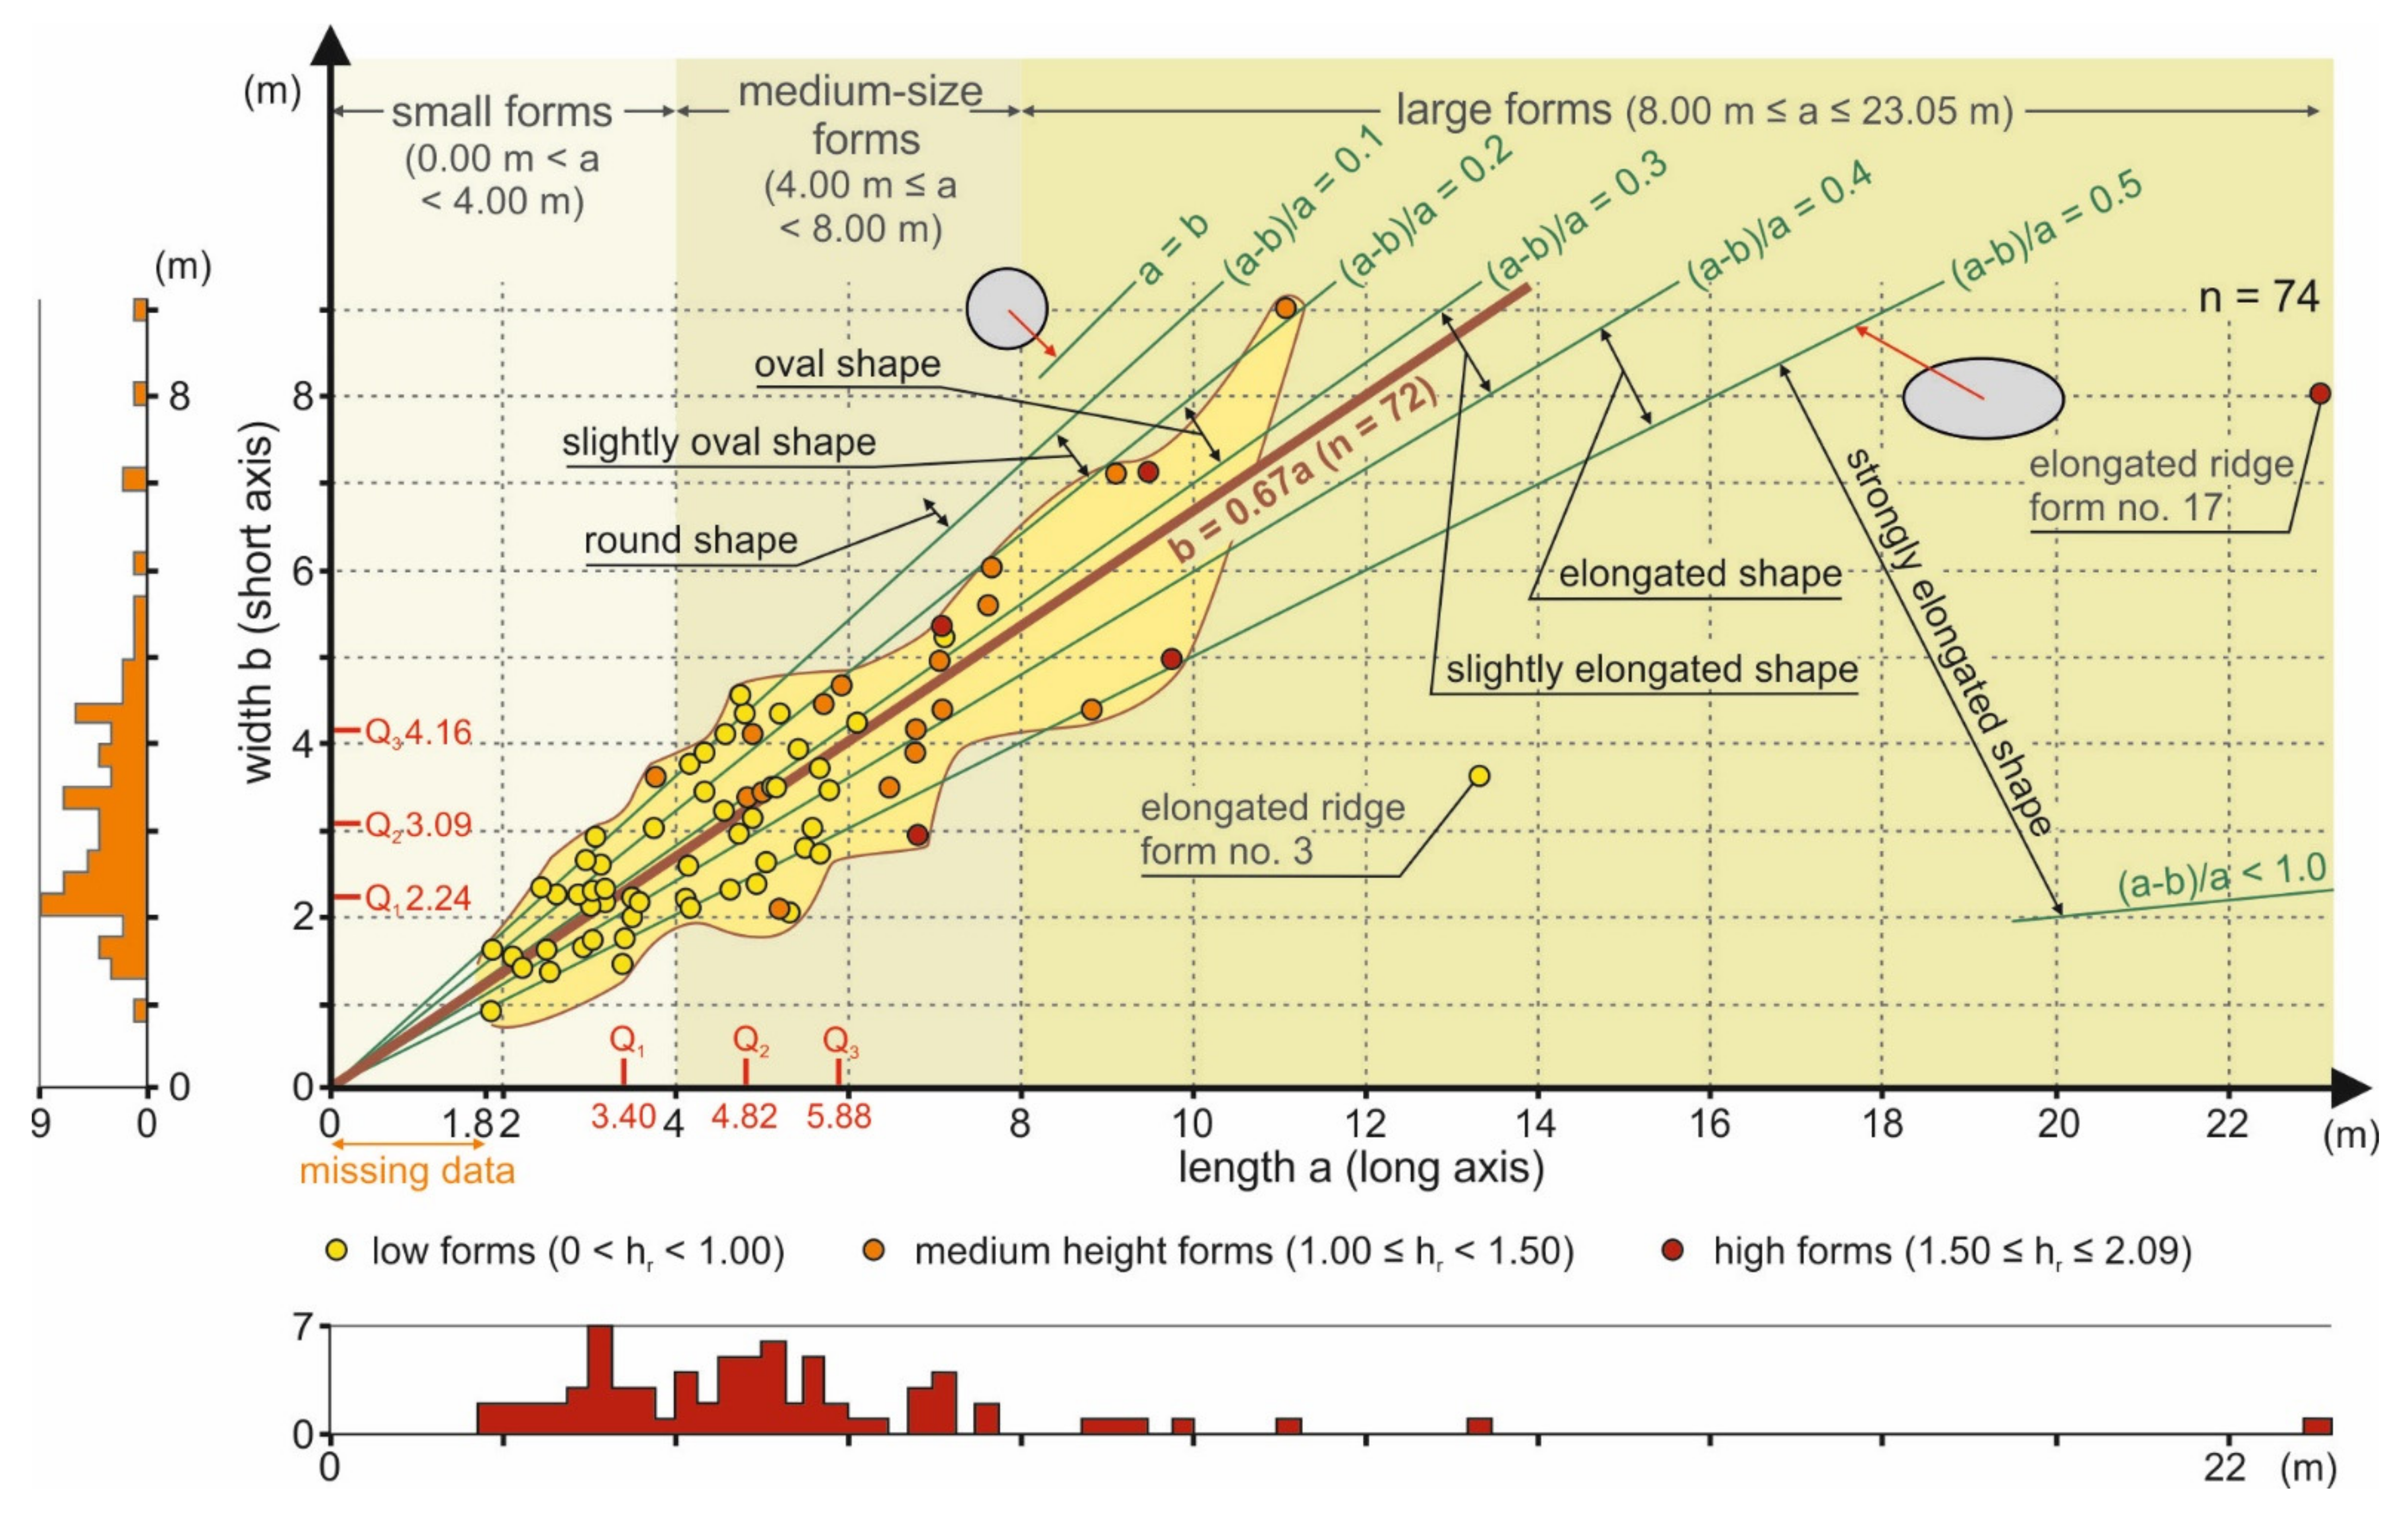
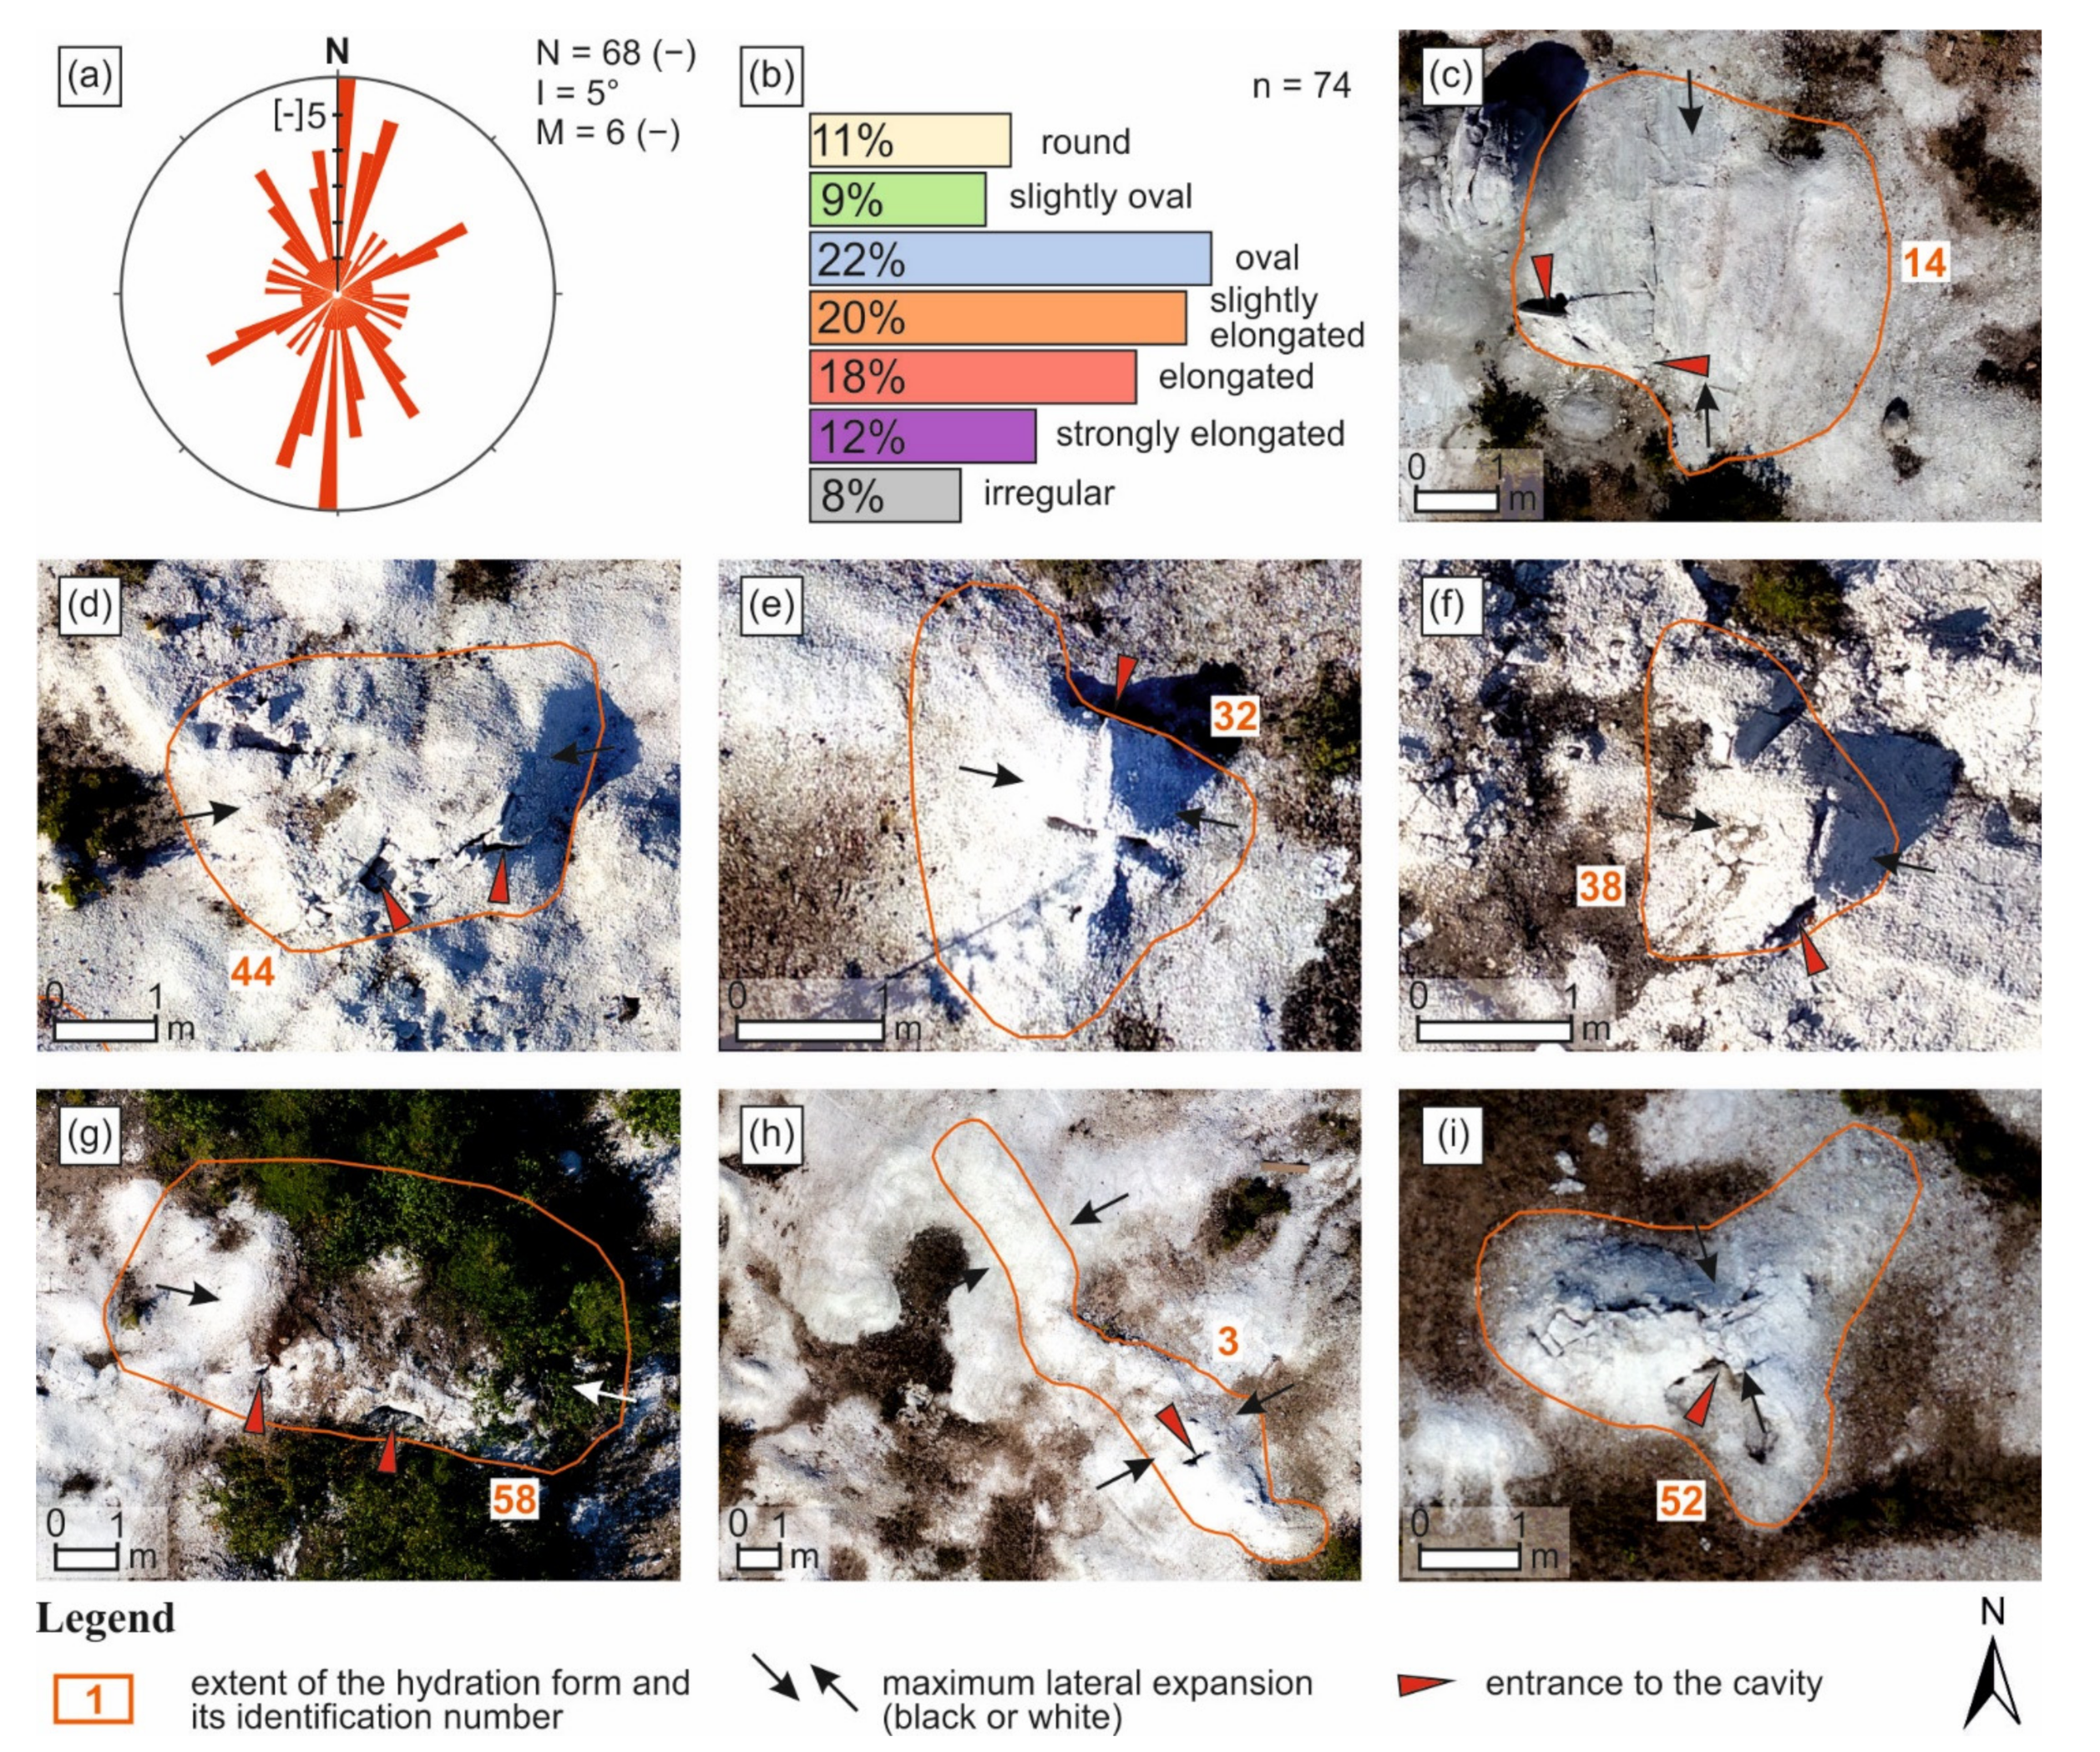
4.3. Shape and Morphometry of Hydration Landforms
4.4. Detached Layer
4.5. Inner Cavity
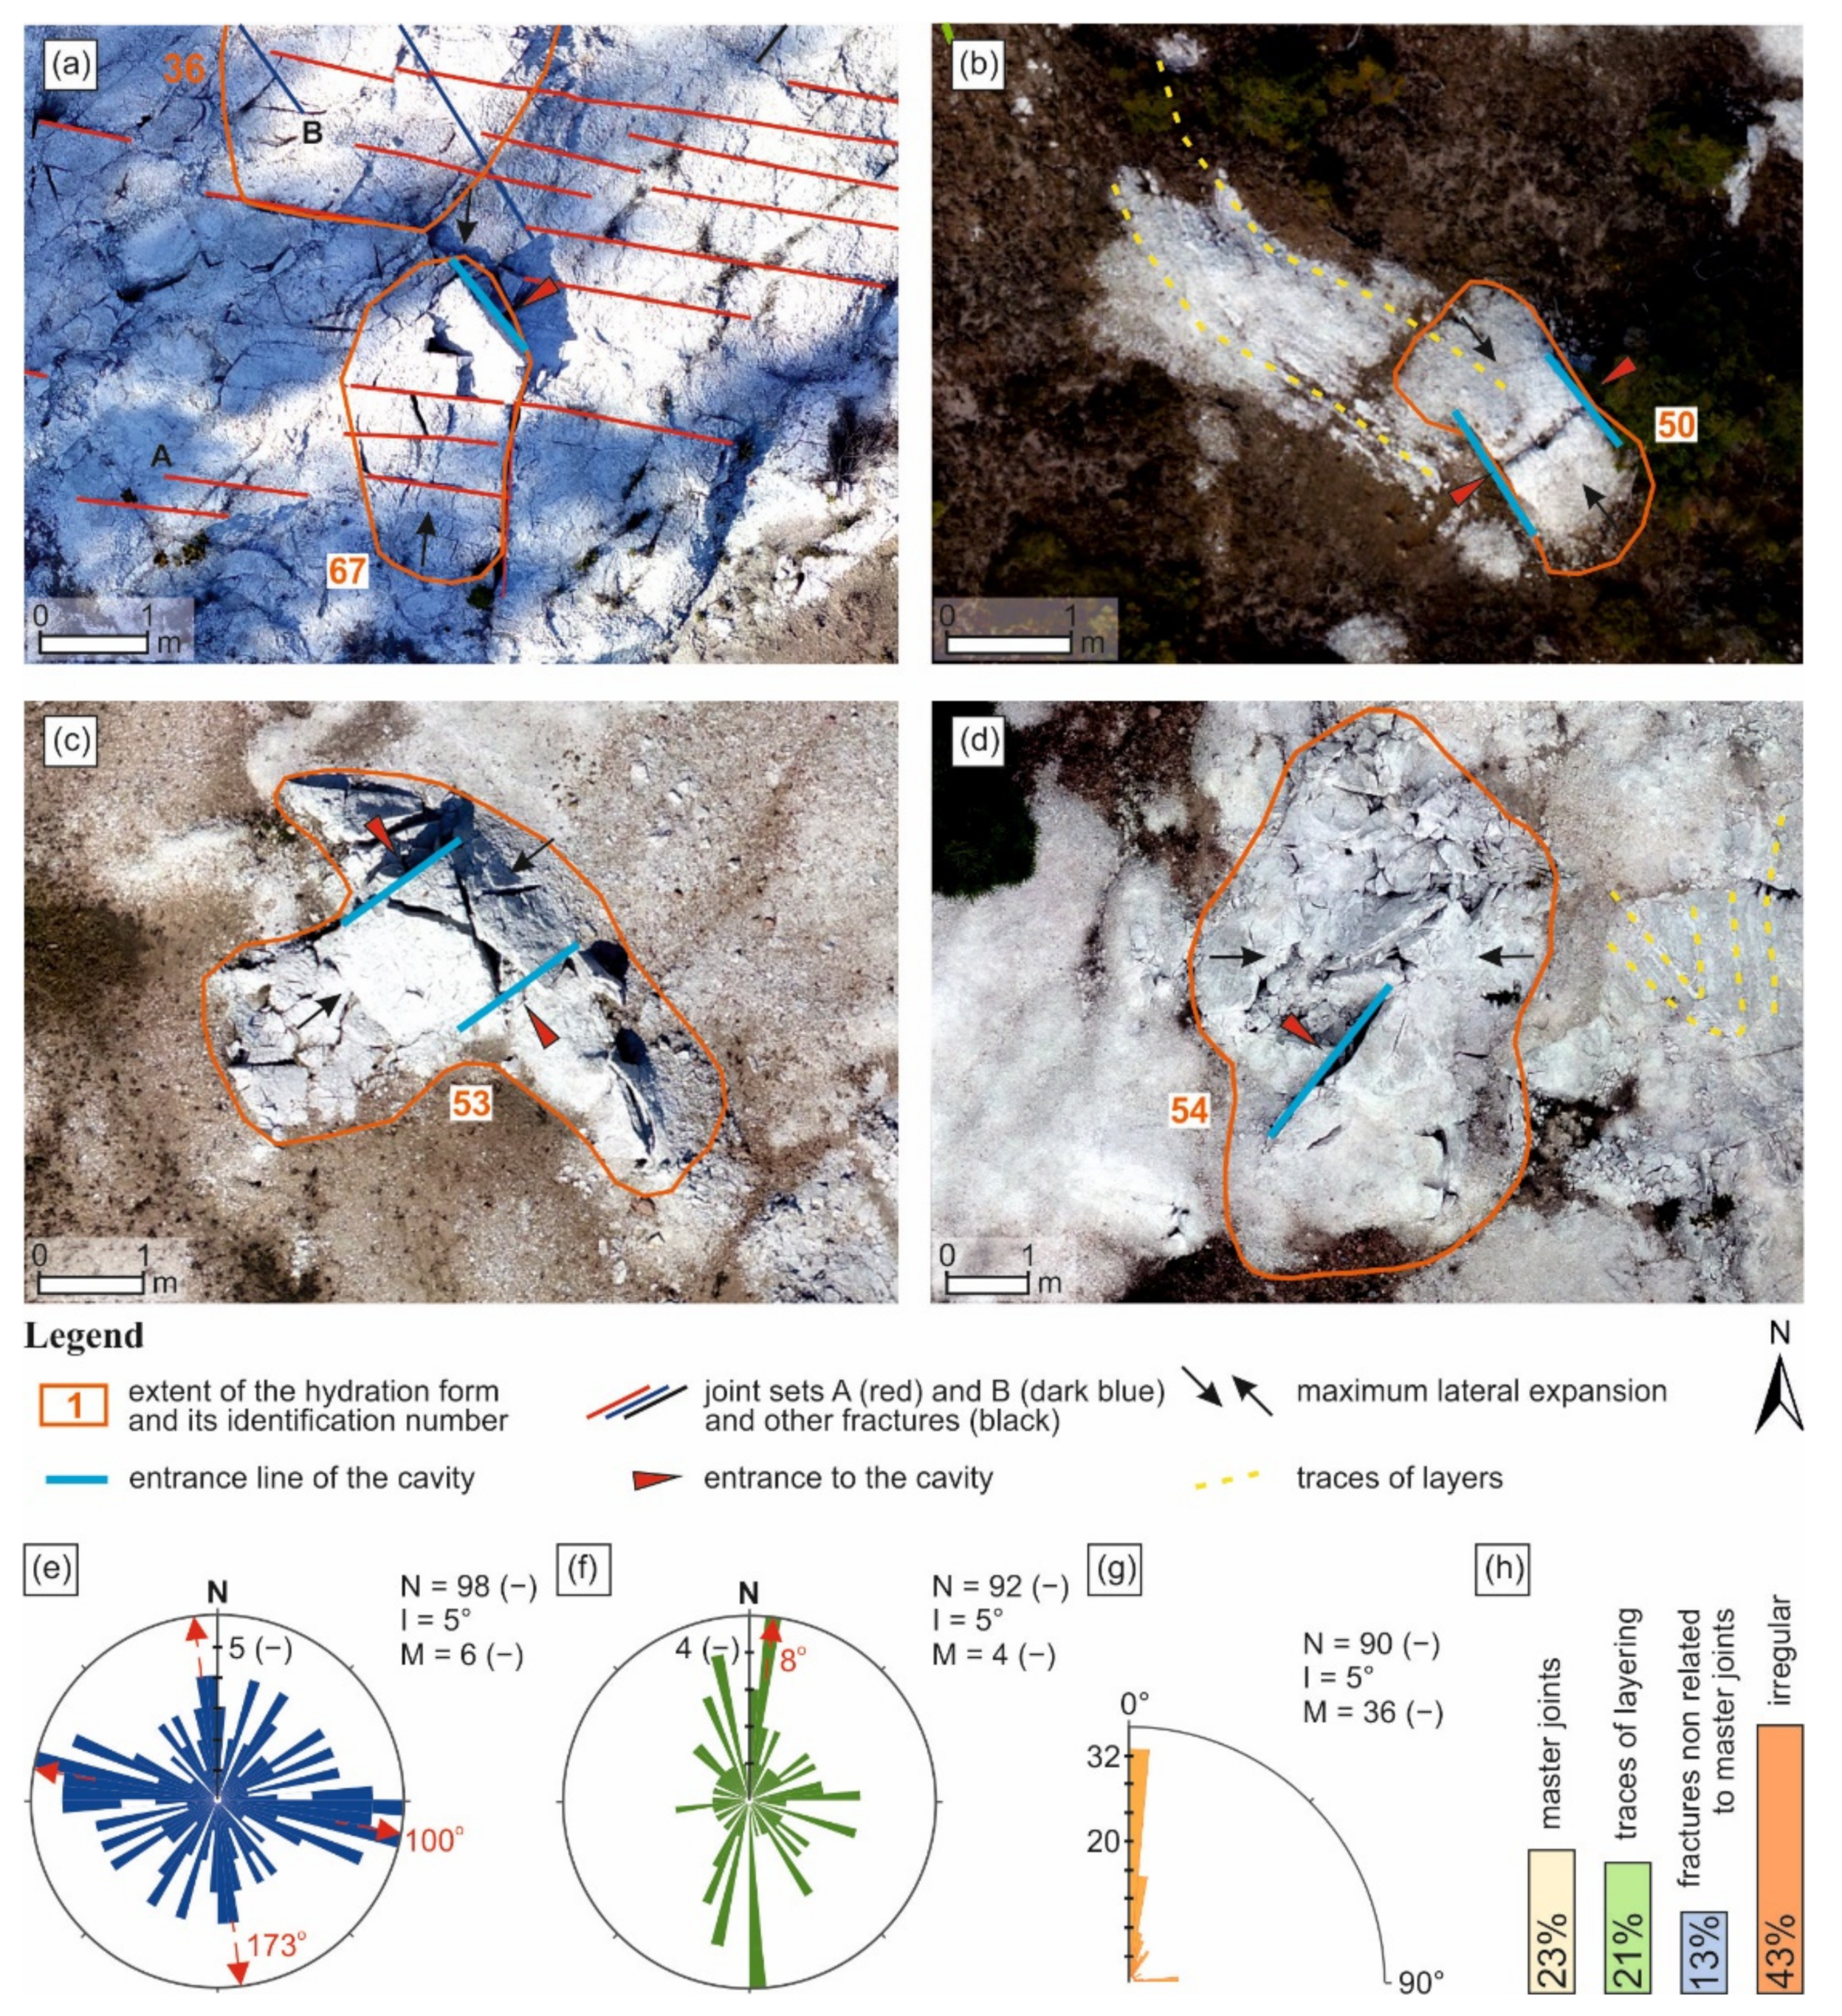
4.6. Fractures and Layers
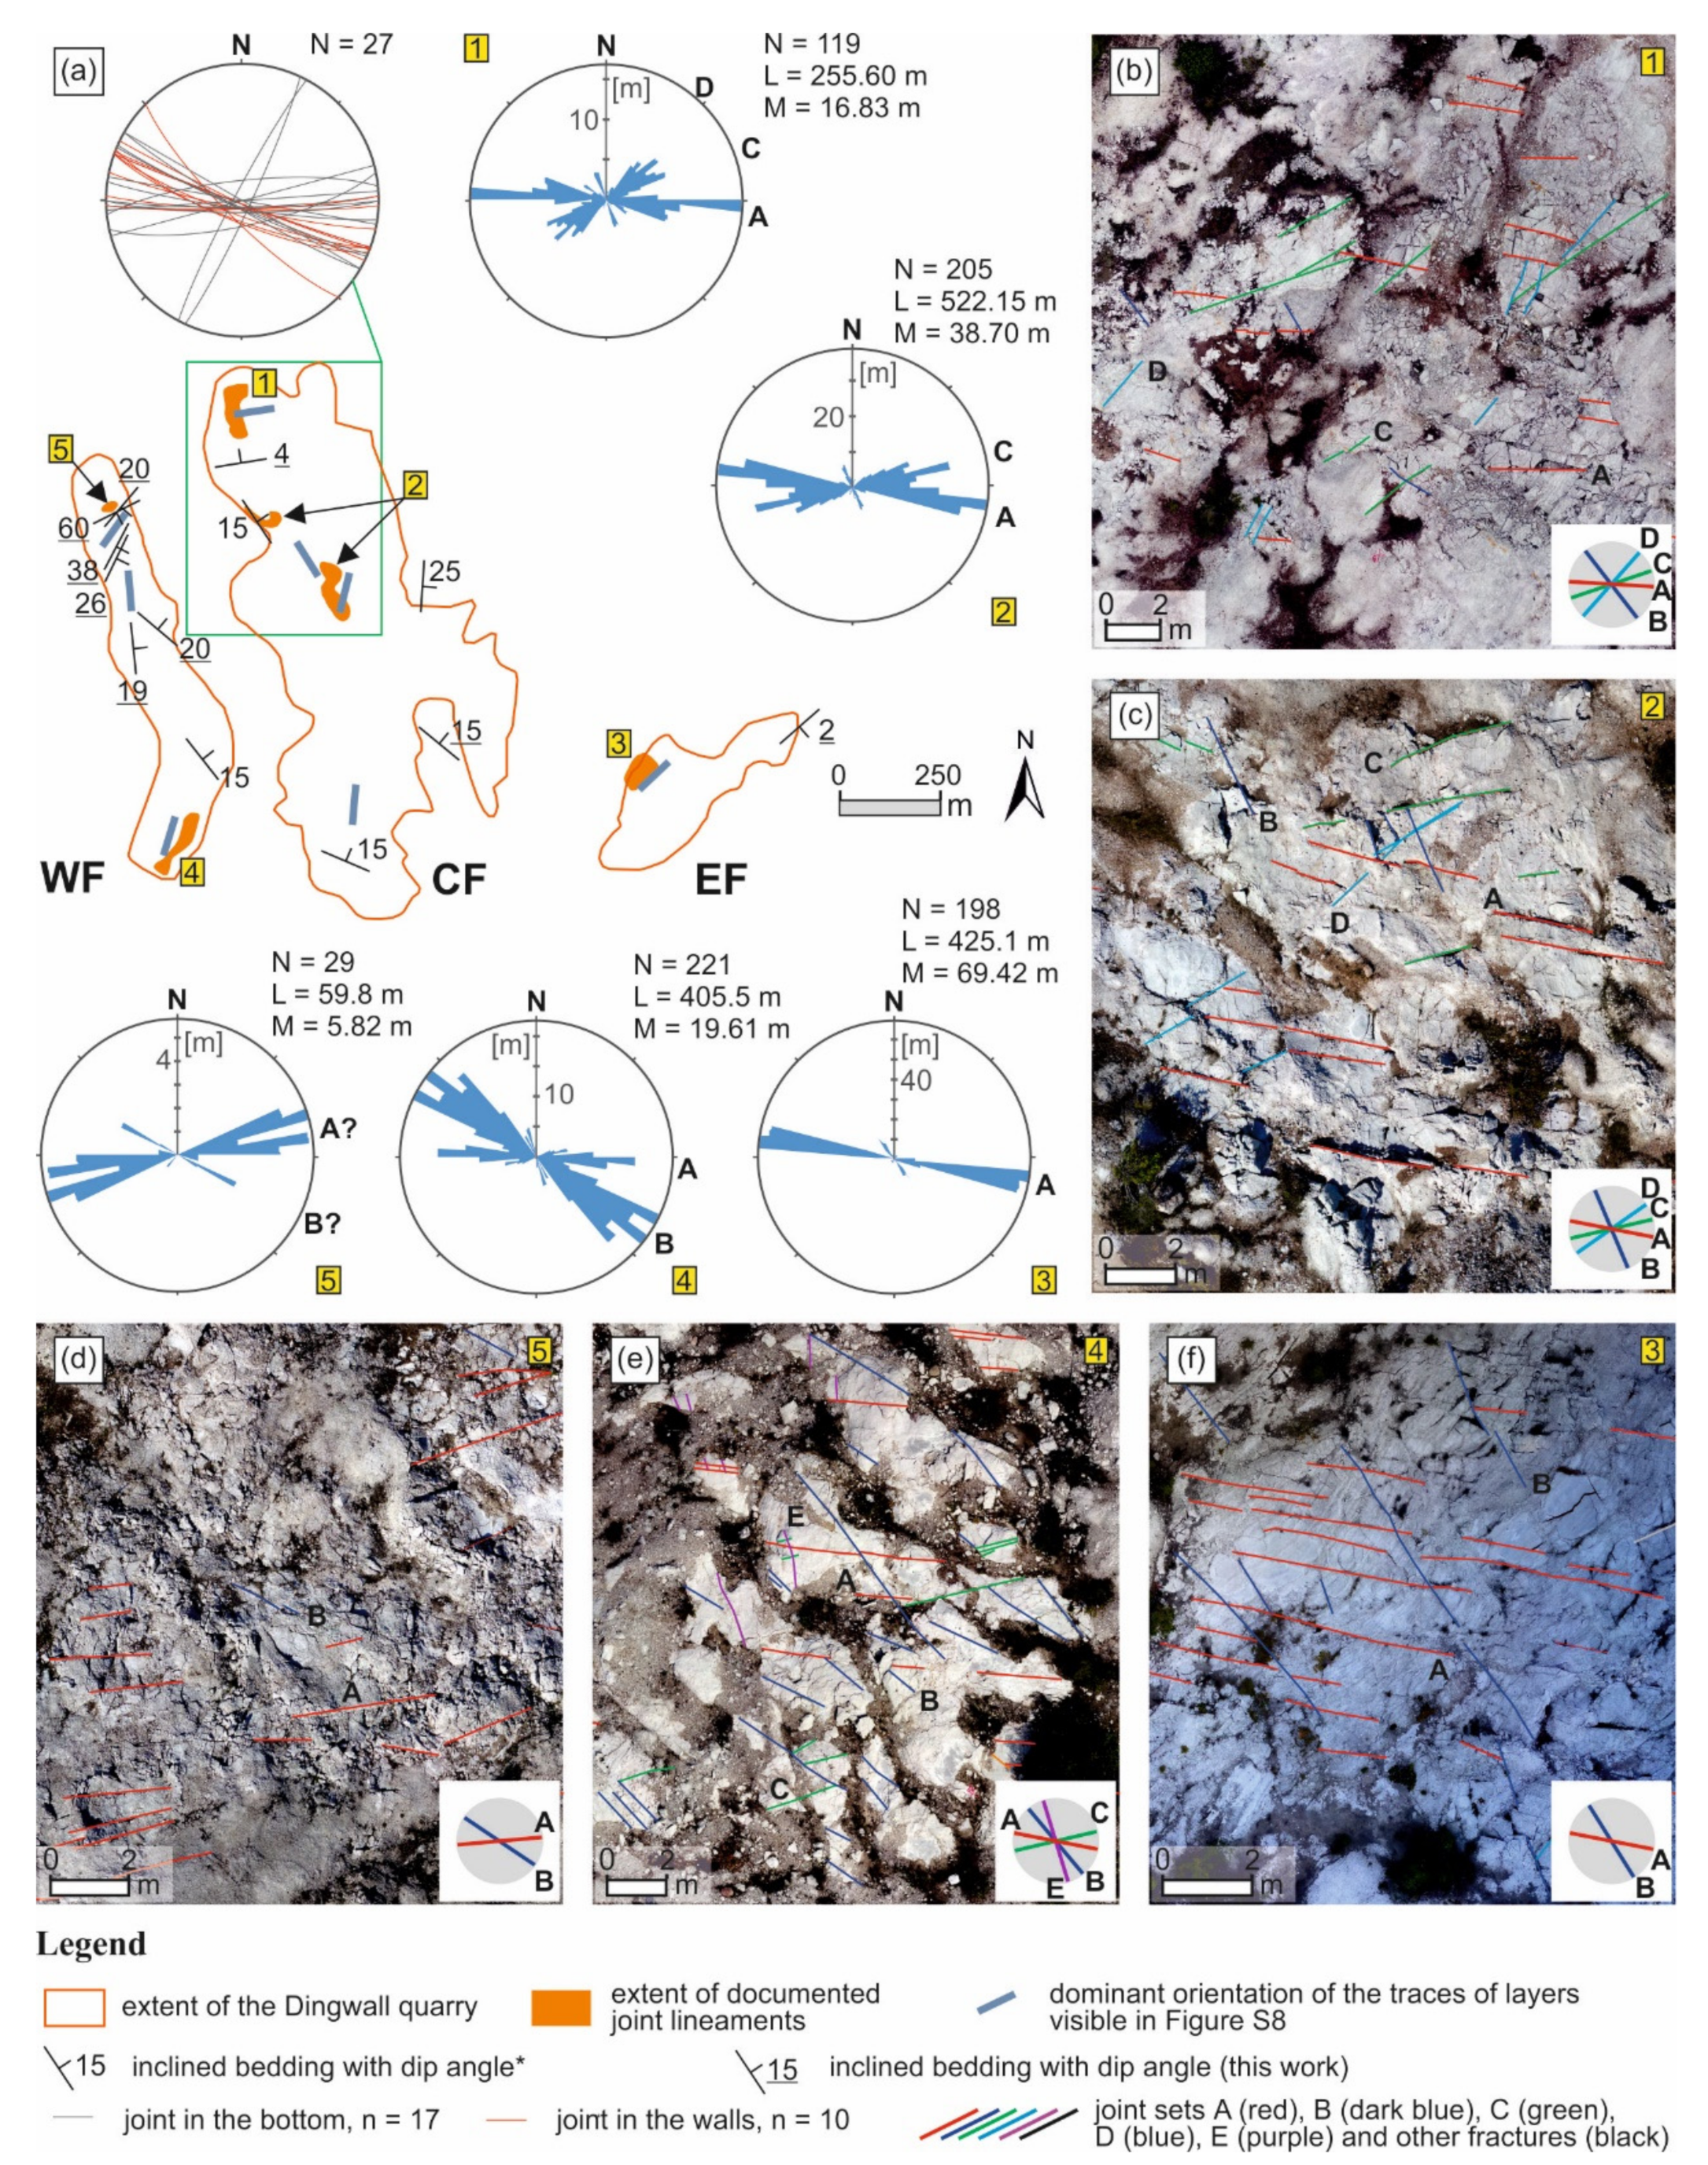
4.6.1. System of Master Joints and Fractures
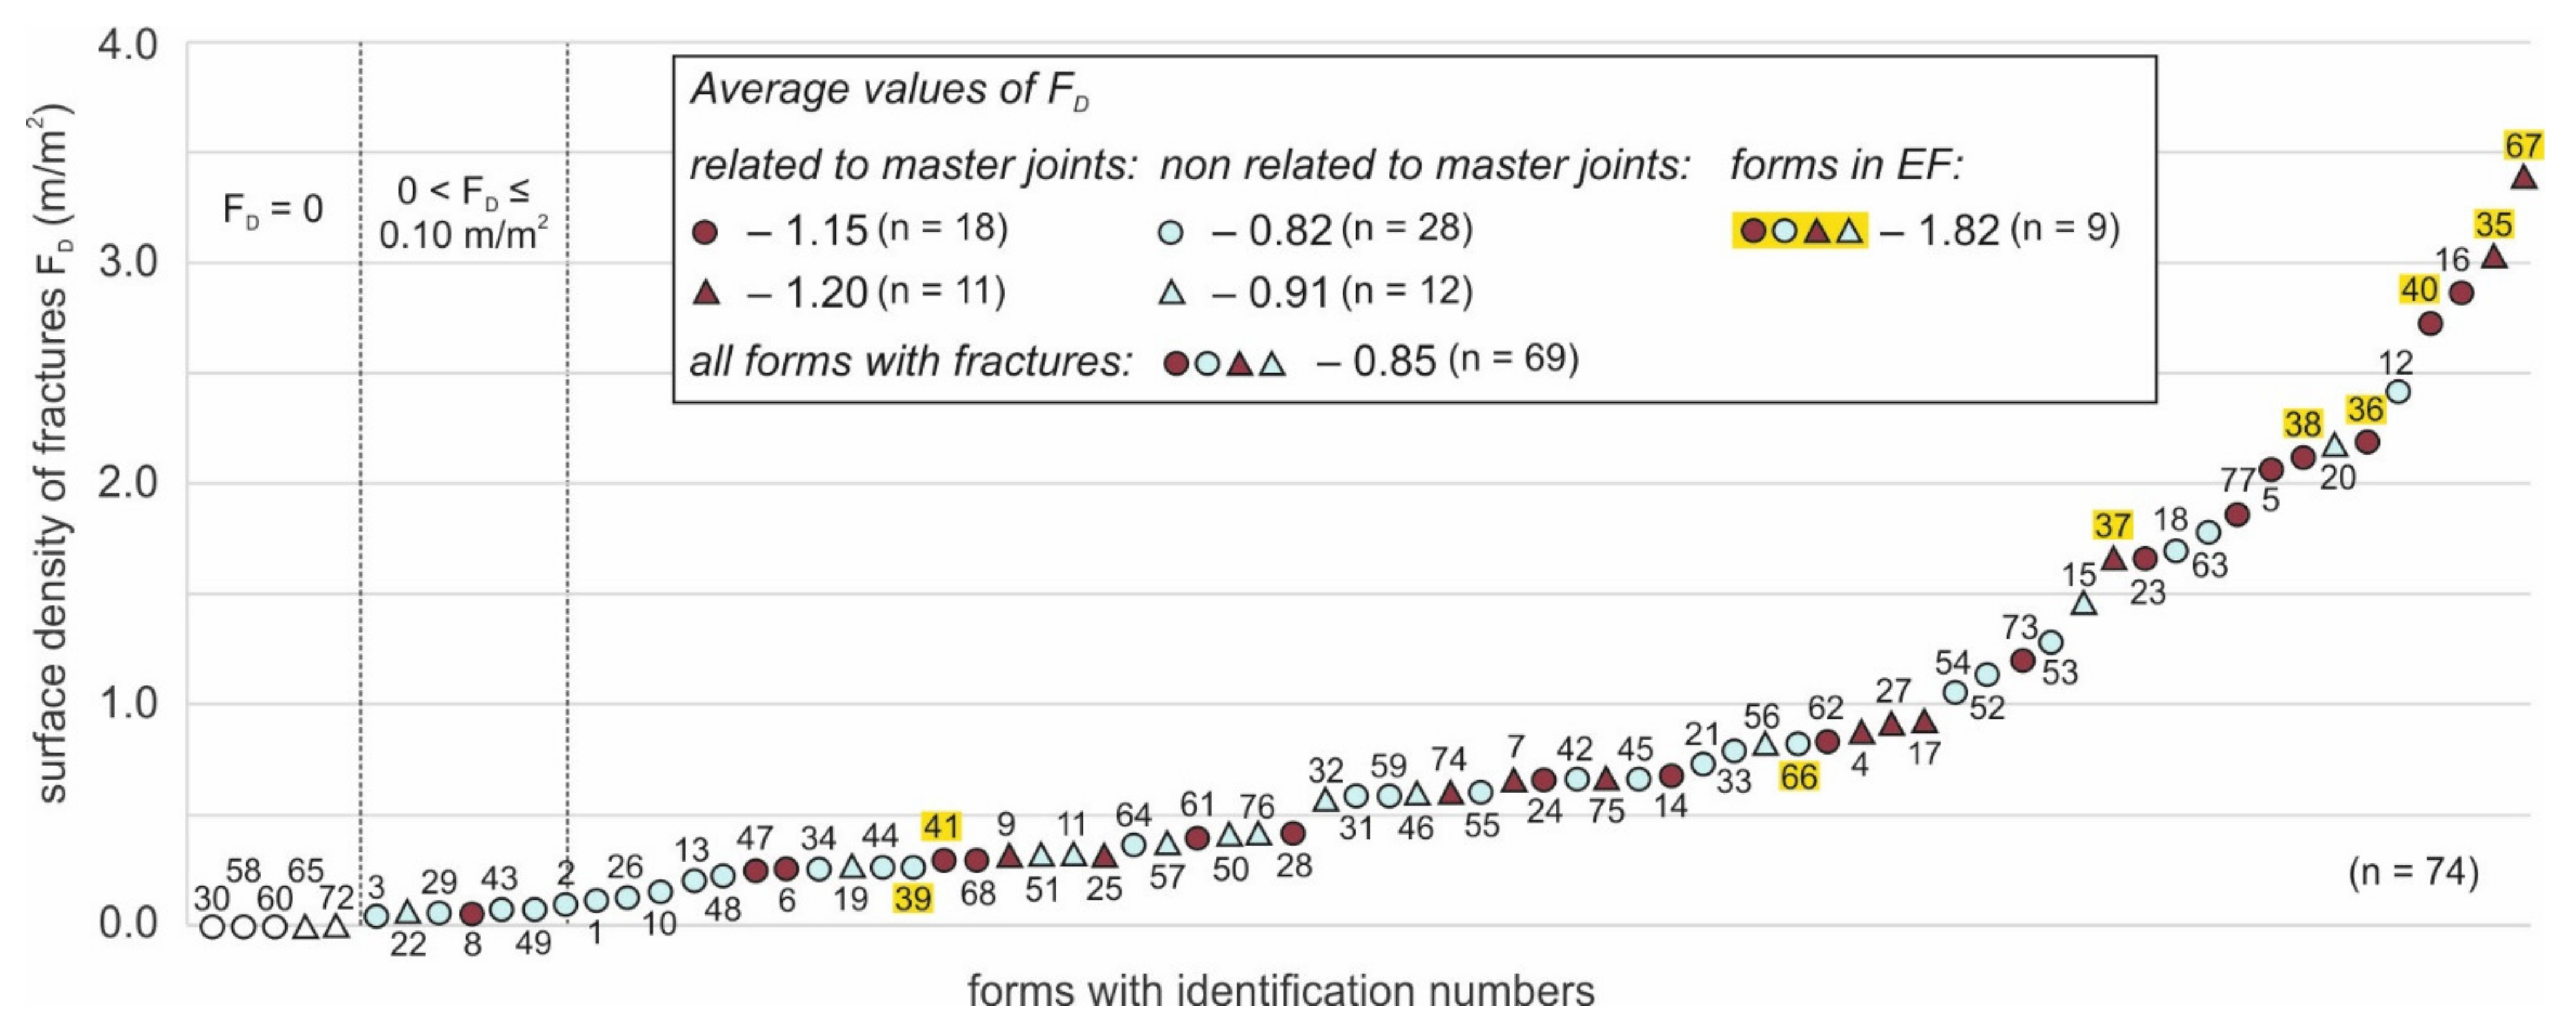
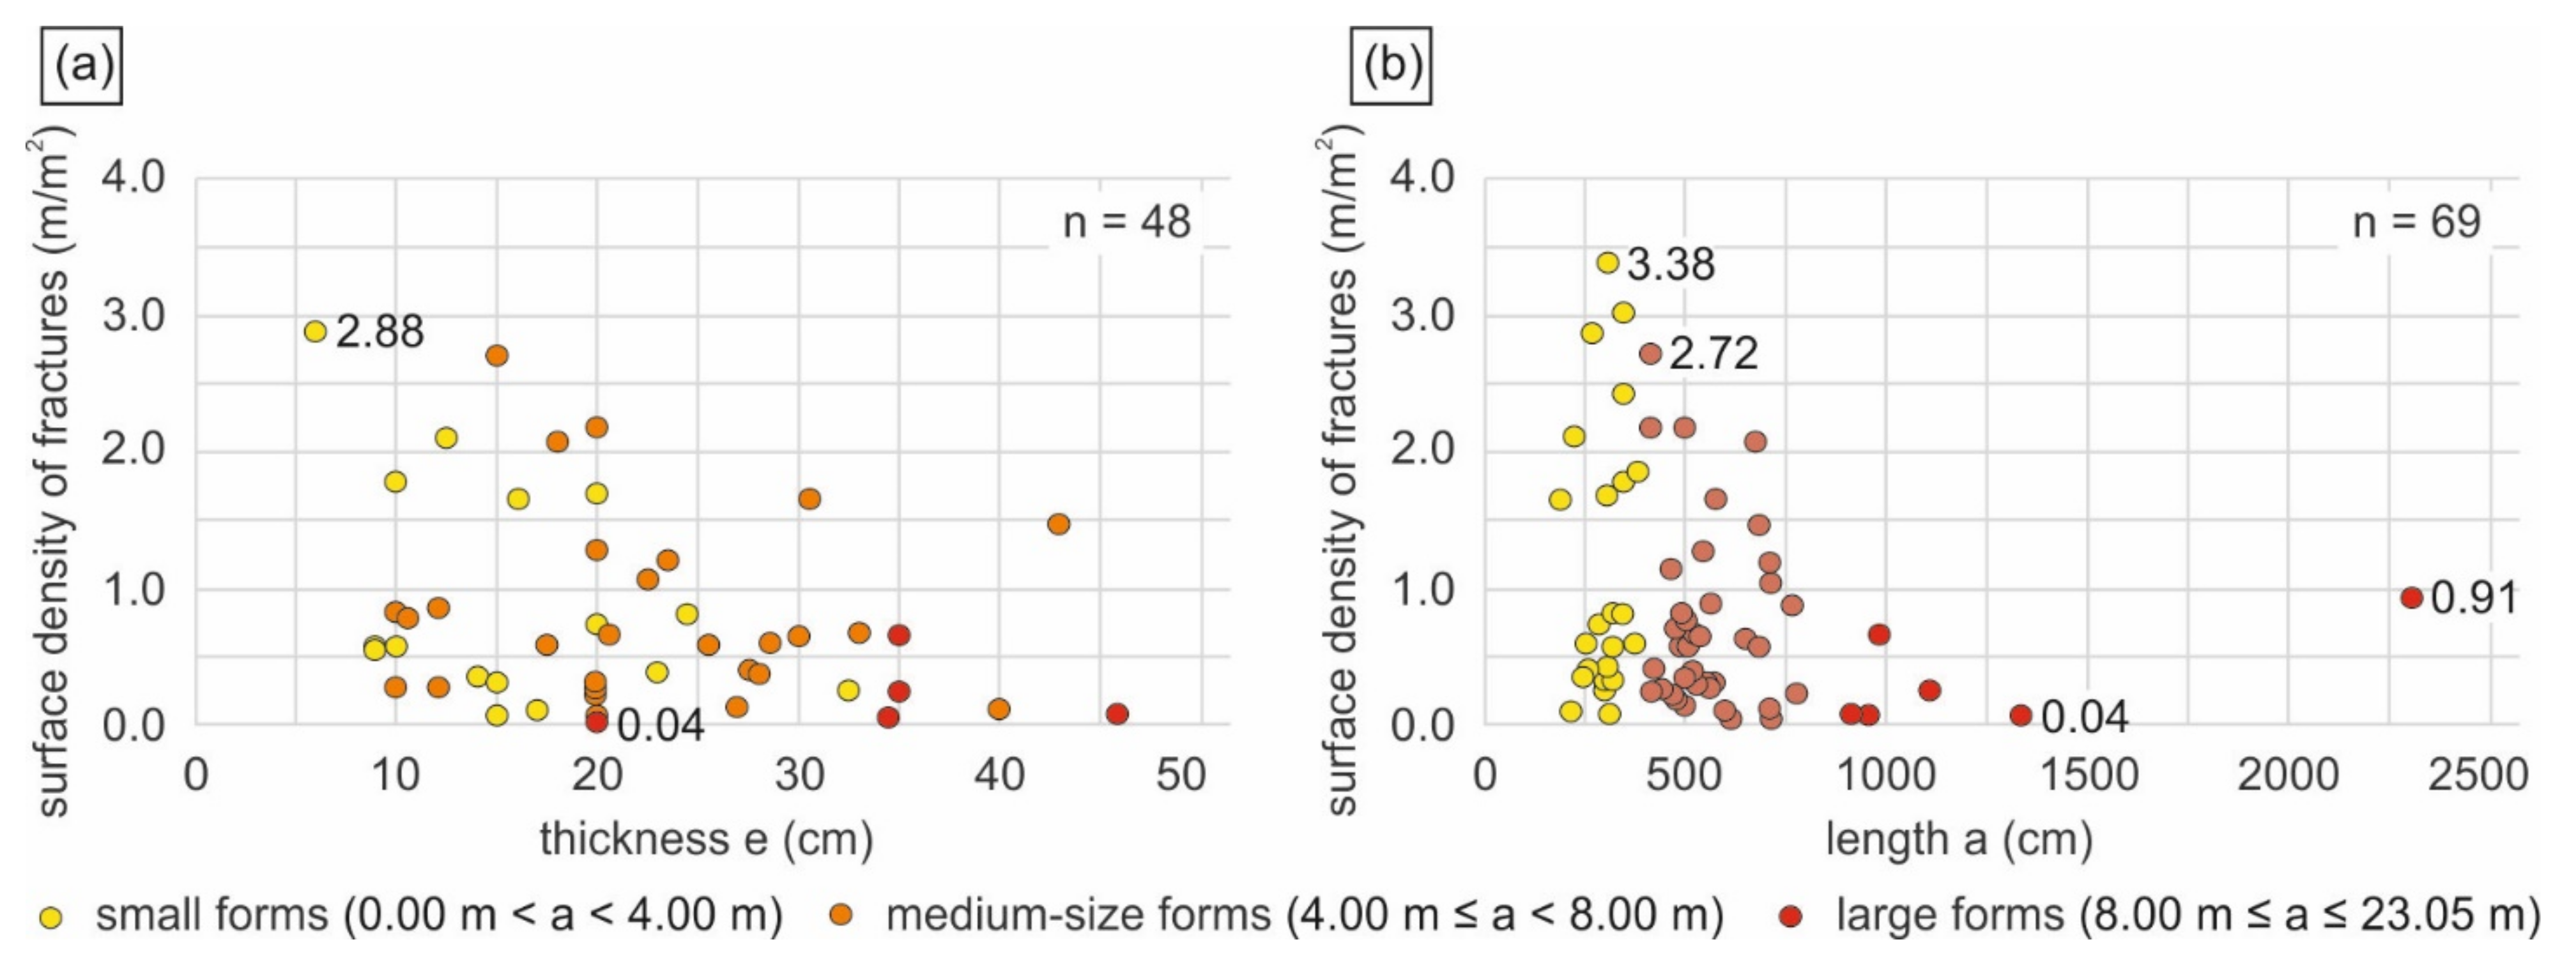
4.6.2. Fractures of Hydration Forms
4.6.3. Strike and Dip of Layers
4.7. Morphological Relationships and Structural Characteristics of Hydration Forms
4.7.1. Distribution
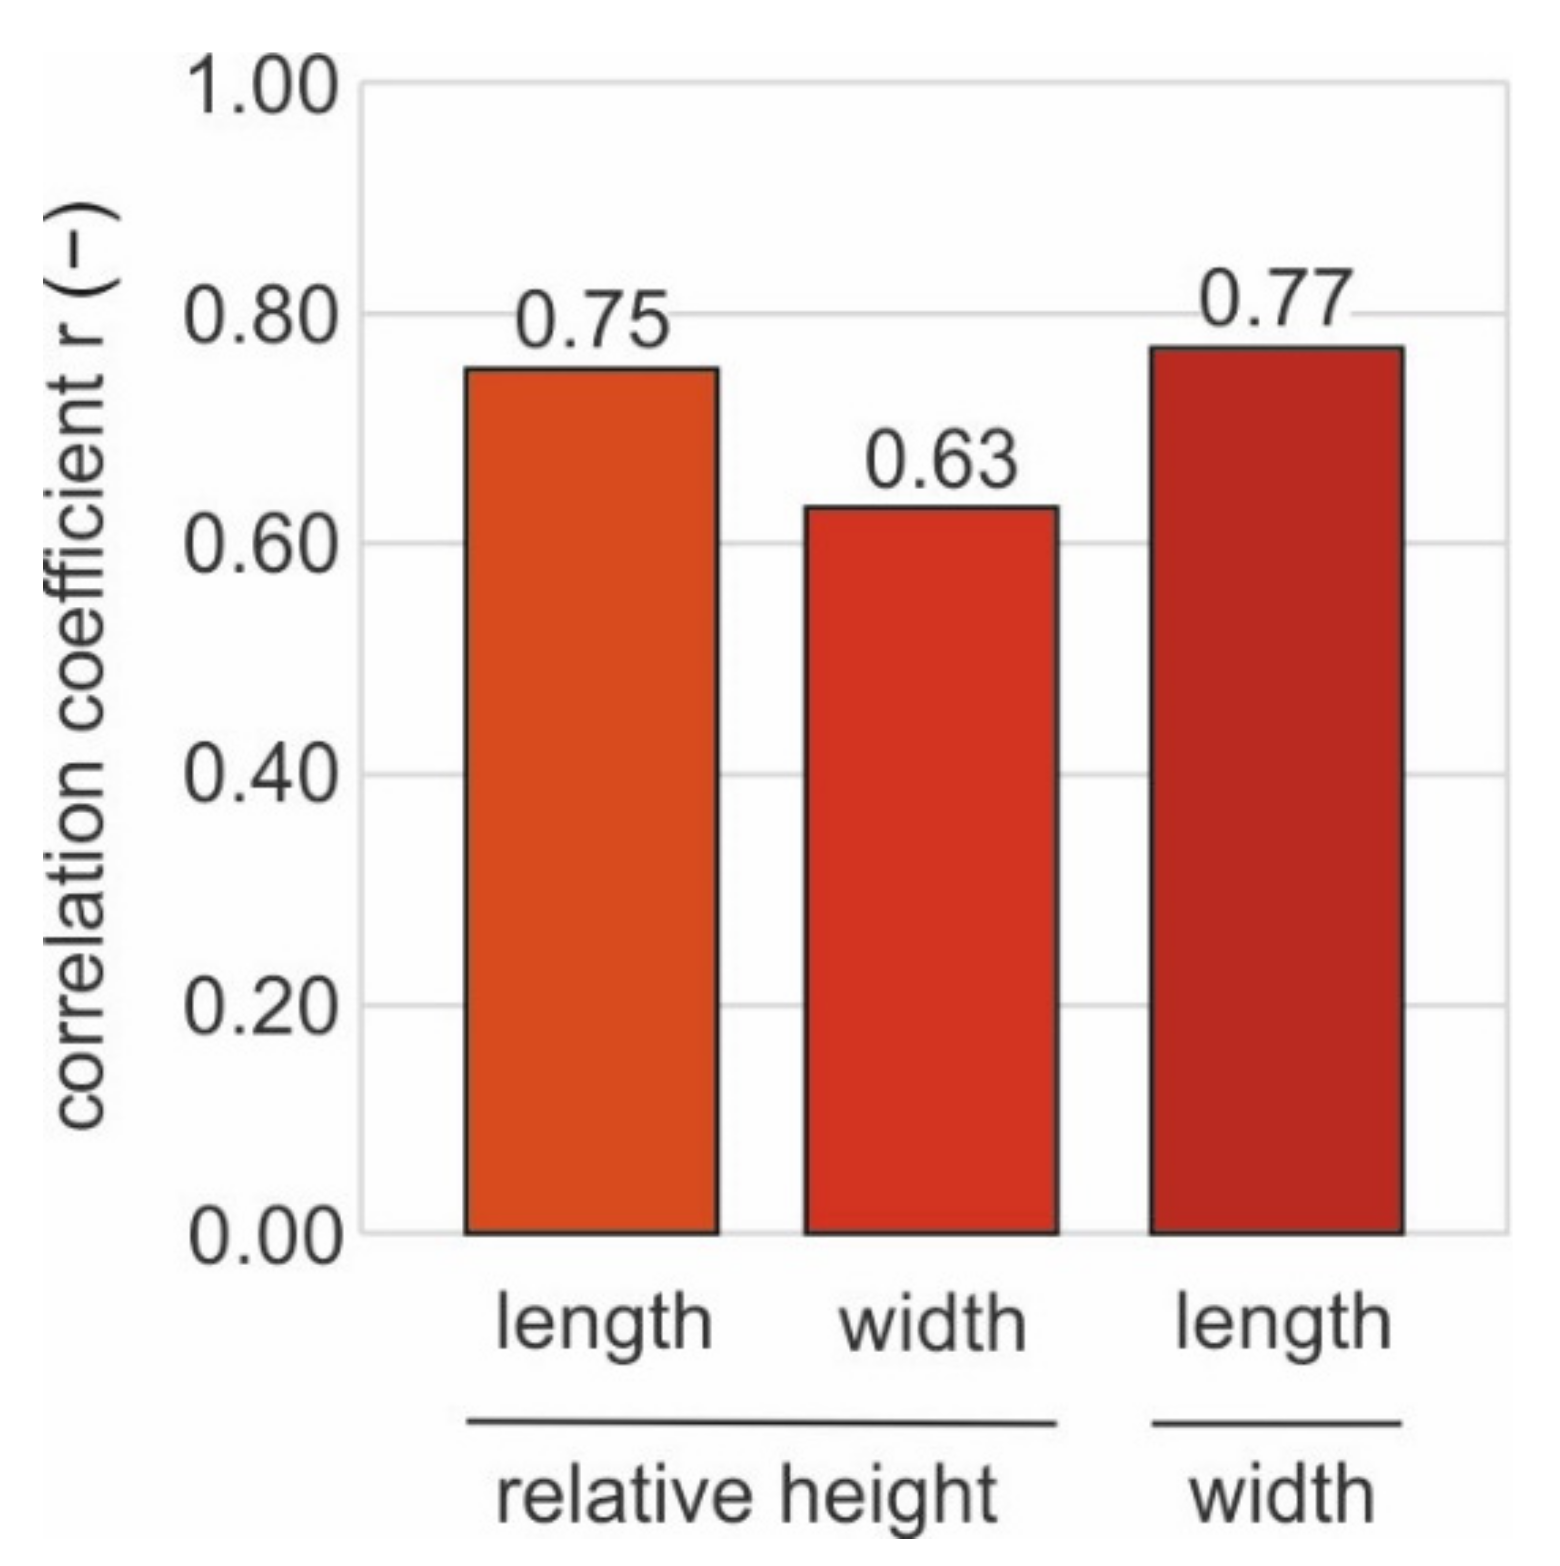
4.7.2. Sizes
4.7.3. Shape
4.7.4. Entrance to Internal Caves or Cavities
4.7.5. Relation to Gypsum Tumuli
4.7.6. Structural Characteristic
4.8. Bedrock Structure Impact for Hydration Forms
4.8.1. Master Joints
4.8.2. Strike of Layers
4.8.3. Master Joints and Strike of Layers
5. Conclusions and Final Remarks
Supplementary Materials
Author Contributions
Funding
Institutional Review Board Statement
Informed Consent Statement
Data Availability Statement
Acknowledgments
Conflicts of Interest
References
- Reinboth, F. Die Waldschmiede bei Walkenried eingestüzt. Mitt. Verb. dt. Höhlen-u. Karstf. 1967, 13, 68. [Google Scholar]
- Reinboth, F. Die Zwerglöcher bei Walkenried am Südharz–Bemerkungen zur Frage der Quellungshöhlen. Die Höhle Z. für Karst–und Höhlenkunde 1997, 48, 1–13. [Google Scholar]
- Hunt, C.O.; Gale, S.J.; Gilbertson, D.D. The UNESCO Libyan Valley Survey IX: Anhydrite and limestone karst of the Tripolita-nian pre-desert. Libyan Stud. 1985, 16, 1–13. [Google Scholar] [CrossRef]
- Reimann, M. Geologisch–lagerstättenkundliche und mineralogische Untersuchungen zur Vergipsung und Volumenzunahme der Anhydrite verschiedener geologischer Formationen unter natürlichen und labormäßigen Bedingungen. Geol. Jahrb. 1991, D97, 21–125. [Google Scholar]
- Yushkin, N.P. Supergenesis of Carboniferous anhydrites of Novaya Zemlya. Polar. Geogr. Geol. 1994, 18, 33–43. [Google Scholar] [CrossRef]
- Reimann, M.; Vladi, F. Zur Entwicklung der sog. Zwergenkirche am Sachsenstein bei Walkenried, Landkreis Osterode am Harz, Niedersachsen und vergleichende Beobachtungen zur rezenten Entstehung von Quellungshöhlen in einem aufgelassenen Gipssteinbruch bei Dingwall, Nova Scotia, Kanada. Mitt. Verb. dt. Höhlen-u. Karstforscher 2003, 49, 75–77. [Google Scholar]
- Jarzyna, A.; Bąbel, M.; Ługowski, D.; Vladi, F.; Yatsyshyn, A.; Olszewska-Nejbert, D.; Nejbert, K.; Bogucki, A. Unique hydration caves and recommended photogrammetric methods for their documentation. Geoheritage 2020, 12, 27. [Google Scholar] [CrossRef] [Green Version]
- Vladi, F.; Bąbel, M. Recent growth and decay of the hydration (swelling) caves in the former gypsum quarry of Dingwall in Cape Breton, Nova Scotia, Canada. In The Weathering of Anhydrite and Gypsum Rocks; Bąbel, M., Olszewska-Nejbert, D., Nejbert, K., Eds.; GIMPO Agencja Wydawniczo-Poligraficzna: Warsaw, Poland, 2020; pp. 223–232. [Google Scholar] [CrossRef]
- Vladi, F.; Bąbel, M.; Jarzyna, A. Wachstum und Zerfall rezenter Quellungshöhlen im ehemaligen Gipssteinbruch von Dingwall in Cape Breton, Nova Scotia, Kanada, nebst Anmerkungen zum dortigen Sulfatkarst und dem Forschungsstand. Abh. Zur Karst-und Höhlenkunde 2022, 40, 119–134. [Google Scholar]
- Mossop, G.D.; Shearman, D.J. Origin of secondary gypsum rocks. Trans. Inst. Min. Metall. Sec. B Appl. Earth Sci. 1973, 82, B147–B154. [Google Scholar]
- Zanbak, C.; Arthur, R.C. Geochemical and engineering aspects of anhydrite/gypsum phase transition. Bull. Assoc. Eng. Geol. 1986, 23, 419–433. [Google Scholar] [CrossRef]
- James, A.N. Soluble Materials in Civil Engineering; Ellis Horwood: New York, NY, USA, 1992; pp. 1–434. [Google Scholar]
- Bąbel, M.; Olszewska-Nejbert, D.; Ługowski, D.; Nejbert, K.; Jacyszyn, A. Petrogenesis of the zone of present day anhydrite weathering at Pisky near Lviv. In The Weathering of Anhydrite and Gypsum Rocks; Bąbel, M., Olszewska-Nejbert, D., Nejbert, K., Eds.; GIMPO Agencja Wydawniczo-Poligraficzna: Warsaw, Poland, 2020; pp. 145–213. (In Polish with English Summary). [Google Scholar] [CrossRef]
- Jarzyna, A.; Bąbel, M.; Ługowski, D.; Vladi, F. Petrographic record and conditions of expansive hydration of anhydrite in the recent weathering zone at the abandoned Dingwall gypsum quarry, Nova Scotia, Canada. Minerals 2022, 12, 58. [Google Scholar] [CrossRef]
- Biese, W. Über Höhlenbildung, Teil 1. Entstehung der Gipshöhlen am südlichen Harzrand und am Kyffhäuser. Abh. Preußischen Geol. Landesanst. Neue Folge 1931, 137, 1–71. [Google Scholar]
- Myers, A.J. Geology of the Alabaster Cavern area. In Guide to Alabaster Cavern and Woodward County, Oklahoma; Guidebook 15; Myers, A.J., Gibson, A.M., Glass, B.P., Patrick, C.R., Eds.; Oklahoma Geological Survey: Norman, OK, USA, 1969; pp. 6–16. [Google Scholar]
- Breisch, R.L.; Wefer, F.L. The shape of gypsum bubbles. In Proceedings of the 8th International Congress of Speleology; Beck, B.F., Ed.; National Speleological Society: Huntsville, AL, USA, 1981; Volume 2, pp. 757–759. [Google Scholar]
- Jarzyna, A.; Ługowski, D.; Olszewska-Nejbert, D.; Jacyszyn, A.; Bąbel, M. Inventory of the dome-shaped hydration landforms from the area of weathering anhydrite rocks at Pisky near Lviv. In The Weathering of Anhydrite and Gypsum Rocks; Bąbel, M., Olszewska-Nejbert, D., Nejbert, K., Eds.; GIMPO Agencja Wydawniczo-Poligraficzna: Warsaw, Poland, 2020; pp. 47–77. (In Polish with English Summary). [Google Scholar] [CrossRef]
- Tsui, P.C.; Cruden, D.M. Deformation associated with gypsum karst in the Salt River Escarpment, northeastern Alberta. Can. J. Earth Sci. 1984, 21, 949–959. [Google Scholar] [CrossRef]
- Bąbel, M.; Yatsyshyn, A.; Ługowski, D.; Nejbert, K.; Olszewska-Nejbert, D.; Bogucki, A.; Kremer, B. Swelling caves from the weathering zone of anhydrite rocks in western Ukraine. In Sedimentology at the Crossroads of New Frontiers, Proceedings of the 19th International Sedimentological Congress, Geneva, Switzerland, 18–22 August 2014, Abstracts Book; Université de Genève: Geneva, Switzerland, 2014; p. 35. [Google Scholar]
- Kraus, E.H. Hydration caves. Sci. New Ser. 1905, 22, 502–503. [Google Scholar]
- Gorbunova, K.A. Caves of hydration. Peshchery 1978, 17, 61–63. (In Russian) [Google Scholar]
- Bögli, A. Karst Hydrology and Physical Speleology; German Edition, Karsthydrographie und Physische Speläologie, 1978; Schmid, J.C., Translator; Springer: Berlin, Germany, 1980; pp. 1–270. [Google Scholar] [CrossRef]
- Kempe, S. Gypsum karst of Germany. Int. J. Speleol. 1996, 25, 209–224. [Google Scholar] [CrossRef]
- Bella, P. Genetické Typy Jaskýň; Speleologia Slovaca 2; Verbum: Ružomberok, Slovakia, 2011; pp. 1–220, (In Slovak with English Summary). [Google Scholar]
- Bella, P.; Gaál, L. Genetic types of non-solution caves. In Proceedings of the 16th International Congress of Speleology, Brno, Czech Republic, 21–28 July 2013; Filippi, M., Bosák, P., Eds.; Speleological Society: Praha, Czech Republic, 2013; Volume 3, pp. 237–242. [Google Scholar]
- White, W.B.; Culver, D.C. Cave, definition of. In Encyclopedia of Caves, 3rd ed.; White, W.B., Culver, D.C., Pipan, T., Eds.; Elsevier: Amsterdam, The Netherlands, 2019; pp. 255–259. [Google Scholar] [CrossRef]
- Ługowski, D.; Bąbel, M. Distribution of gypsum content in anhydrite hydration dome from Pisky near Lviv and its development. In The Weathering of Anhydrite and Gypsum Rocks; Bąbel, M., Olszewska-Nejbert, D., Nejbert, K., Eds.; GIMPO Agencja Wydawniczo-Poligraficzna: Warsaw, Poland, 2020; pp. 135–144, (In Polish with English Summary). [Google Scholar] [CrossRef]
- Evans, I.S. Scale-specific landforms and aspects of the land surface. In Concepts and Modelling in Geomorphology: International Perspectives; Evans, I.S., Dikau, R., Tokunaga, E., Ohmori, H., Hirano, M., Eds.; TERRAPUB: Tokyo, Japan, 2003; pp. 61–84. [Google Scholar]
- MacMillan, R.A.; Shary, P.A. Landforms and landform elements in geomorphometry. Dev. Soil Sci. 2009, 33, 227–254. [Google Scholar] [CrossRef]
- Mokarram, M.; Sathyamoorthy, D. A review of landform classification methods. Spat. Inf. Res. 2018, 26, 647–660. [Google Scholar] [CrossRef]
- Mark, D.M. Geomorphometric parameters: A review and evaluation. Geogr. Ann. 1975, 57, 165–177. [Google Scholar] [CrossRef]
- Pike, R.J. Geomorphometry—Diversity in quantitative surface analysis. Prog. Phys. Geogr. 2000, 24, 1–20. [Google Scholar] [CrossRef] [Green Version]
- Pike, R.J.; Evans, I.; Hengl, T. Geomorphometry: A brief guide. Dev. Soil Sci. 2009, 33, 227–254. [Google Scholar] [CrossRef]
- Muzirafuti, A.; Boualoul, M.; Barreca, G.; Allaoui, A.; Bouikbane, H.; Lanza, S.; Crupi, A.; Randazzo, G. Fusion of remote sensing and applied geophysics for sinkholes identification in Tabular Middle Atlas of Morocco (the Causse of El Hajeb): Impact on the protection of water resource. Resources 2020, 9, 51. [Google Scholar] [CrossRef]
- Calaforra, J.M.; Pulido-Bosch, A. Genesis and evolution of gypsum tumuli. Earth Surf. Proc. Land. 1999, 24, 919–930. [Google Scholar] [CrossRef]
- Jarzyna, A.; Bąbel, M.; Ługowski, D. Morphological diversity and form evolution of the gypsum tumuli from Sorbas region in Spain. In The Weathering of Anhydrite and Gypsum Rocks; Bąbel, M., Olszewska-Nejbert, D., Nejbert, K., Eds.; GIMPO Agencja Wydawniczo-Poligraficzna: Warsaw, Poland, 2020; pp. 233–269, (In Polish with English Summary). [Google Scholar] [CrossRef]
- Gutiérrez, F.; Gutiérrez, M. Landforms of the Earth: An Illustrated Guide; Springer: Berlin/Heidelberg, Germany, 2016; pp. 1–270. [Google Scholar] [CrossRef] [Green Version]
- Breisch, R.L. The truth about gypsum caves. Natl. Speleol. Soc. News 1978, 36, 183–185. [Google Scholar]
- Kraus, E.H. On the origin of the caves of the island of Put-in-Bay, Lake Erie. Am. Geol. 1905, 35, 167–171. [Google Scholar]
- Cottingham, K. The origin of the caves at Put-in-Bay, Ohio. Ohio J. Sci. 1919, 20, 38–42. [Google Scholar]
- Muir, J.L. Anhydrite–gypsum problem of Blaine Formation, Oklahoma. Am. Assoc. Petr. Geol. B. 1934, 18, 1310–1311, The text discussion by Griley. [Google Scholar] [CrossRef]
- Verber, J.L.; Stansbury, D.H. Caves in Lake Erie Islands. Ohio J. Sci. 1953, 53, 358–362. [Google Scholar]
- Kes, A.S. Gypsum domes in a desert. Priroda 1961, 2, 114–115. (In Russian) [Google Scholar]
- Herrmann, A. Vergipsung und oberflächenformung im gipskarst. In Proceedings of the Third International Congress of Speleology, Vienna, Austria, 1963; Trimmel, H., Ed.; Verband Österreichischer Höhlenforscher: Vienna, Austria, 1966; Volume 5, pp. 99–108. Available online: http://uis-speleo.org/wp-content/uploads/2020/07/3rd_Kongress_fuer_Spelaeologie_Band_V.pdf (accessed on 13 July 2022).
- Gorbunova, K.A. Exogenetic karst tectonics. In Proceedings of the 7th International Speleological Congress, Sheffield, 1977; Ford, T.D., Ed.; BCRA: Bridgwater, UK, 1977; pp. 222–223. Available online: http://uis-speleo.org/wp-content/uploads/2020/08/Proceedings-of-The-7th-International-Speleological-Congress-Sheffield-England-September-1977.pdf (accessed on 13 July 2022).
- Völker, C.; Völker, R. Gipskuppen und Gipsbuckel—Elemente der Sulfatkarstlandschaft. Mitt. Karstmus. Heimkehle 1988, 19, 1–19. [Google Scholar]
- Stenson, R.E. The Morphometry and Spatial Distribution of Surface Depressions in Gypsum, with Examples from Nova Scotia, Newfoundland and Manitoba. Master’s Thesis, McMaster University, Hamilton, ON, Canada, 1990; pp. 1–134. [Google Scholar]
- Reimann, M. Quellungshöhlen am südharz, landschaftsprägende auswirkung der vergipsung von anhydritstein. In Proceedings of the Zechstein 1987—International Symposium—Abstracts, Posters, Program, Kassel, Hannover, Germany, 28 April–9 May 1987; Bernd, K., Schröder, B., Eds.; Poster, MS of the Summary. p. 9. [Google Scholar]
- Stafford, K.W.; Ehrhart, J.; Majzoub, A.; Shields, J.; Brown, W. Unconfined hypogene evaporite karst: West Texas and southeastern New Mexico, USA. Int. J. Speleol. 2018, 47, 293–305. [Google Scholar] [CrossRef] [Green Version]
- Beyrich, E. Erläuterungen zur Geologischen Specialkarte von Preussen und den Thüringischen Staaten; No. 255, Blatt Ehrlich, Bande 6, Blatt 2; Verlag von J.H. Neumann: Berlin, Germany, 1870; pp. 1–18. [Google Scholar]
- Behrens, G.H. Hercynia Curiosa Oder Curiöser Hartz-Wald; Verlegts Carl Chriſtian Neuenhahn: Nordhausen, Germany, 1703; pp. 1–216. Available online: http://www.deutschestextarchiv.de/book/show/behrens_hercynia_1703 (accessed on 6 May 2022).
- Stolberg, F. Die Höhlen des Harzes, Bd. 1. Einleitung und Südharzer Zechsteinhöhlen. Sonderausgabe der illustrierten Monatsschrift "Der Harz", Heft 2; Eilers-Verlag G.m.b.H.: Magdeburg, Germany, 1926; pp. 1–40. [Google Scholar]
- Bąbel, M.; Jacyszyn, A.; Olszewska-Nejbert, D.; Nejbert, K.; Bogucki, A.; Maksymiw, I.; Mik, W.; Bermes, A.; Ługowski, D.; Kacprzak, K.; et al. Jaskinie z pęcznienia (ang. swelling caves) w strefie współczesnego wietrzenia anhydrytów w kamieniołomie Pisky w okolicach Lwowa. In Od Czarnohory po Góry Świętokrzyskie—Geologiczne Peregrynacje, Polsko–Ukraińska Sesja Naukowa, Warszawa, Bocheniec, 15–19 Października 2013; Bąbel, M., Dzierżek, J., Olszewska-Nejbert, D., Eds.; Instytut Geologii Podstawowej WG UW: Warsaw, Poland, 2013; pp. 19–26. [Google Scholar] [CrossRef]
- Bąbel, M.; Yatsyshyn, A.; Bogucki, A.; Jarzyna, A.; Ługowski, D.; Olszewska-Nejbert, D.; Nejbert, K.; Kotowski, J.; Przybylik, G.; Bermes, A.; et al. Development of the unique landforms in the zone of weathering gypsum-anhydrite rocks at Pisky (Shchyrka river valley, Dnister basin). In Scientific Principles of Conservation Management of Ecosystems in the Dniester Canyon Area, Proceedings of the Second International Scientific and Practical Conference Dedicated to the 170th Anniversary of Publication of Rudolf Kner’s Work Which Marked the Beginning of the Profound Paleontological Investigations in the Dniester Canyon, Zalishchyky, Ternopil, Ukraine, 14–15 September 2017; Skilsky, I.V., Vikyrchak, O.K., Eds.; Druk Art: Chernivtsi, Ukraine, 2017; pp. 23–25. [Google Scholar] [CrossRef]
- Ługowski, D.; Jarzyna, A. The map of the site of weathering anhydrites and hydration caves at Pisky at environs of Lviv. In The Weathering of Anhydrite and Gypsum Rocks; Bąbel, M., Olszewska-Nejbert, D., Nejbert, K., Eds.; GIMPO Agencja Wydawniczo-Poligraficzna: Warsaw, Poland, 2020; pp. 21–48. (In Polish with English Summary). [Google Scholar] [CrossRef]
- Jarzyna, A. Geological Setting and Morphology of the Site of the Weathering Miocene Anhydrites at Pisky near Lviv. Master’s Thesis, University of Warsaw, Warsaw, Poland, 2021; pp. 1–131, (In Polish with English Summary). [Google Scholar]
- Bąbel, M.; Bogucki, A.; Jacyszyn, A.; Ługowski, D.; Olszewska-Nejbert, D.; Nejbert, K.; Jarzyna, A.; Bermes, A.; Przybylik, G.; Tomeniuk, O. Weathering anhydrites at Pisky quarry, Part I. General characteristic. In Weathering of Gypsum and Anhydrite Rocks, Proceedings of the Polish-Ukrainian Scientific Seminar, Warsaw, Poland, 19–21 January 2017; Bąbel, M., Olszewska-Nejbert, D., Nejbert, K., Eds.; IGP WG UW: Warszaw, Poland, 2017; pp. 18–22. (In Polish) [Google Scholar] [CrossRef]
- Maksymiw, I.P. Geomorphological Effects of the Hydration Processes in the Gypsum Layer of the “Pisky” Section. Master’s Thesis, Faculty of Geography, University of Lviv, Lviv, Ukraine, 2013; pp. 1–70. (In Ukrainian). [Google Scholar]
- Ługowski, D.; Jarzyna, A.; Bąbel, M.; Nejbert, K. Data collecting methods used in the field study of weathering anhydrites at Pisky near Lviv. Biul. Państwowego Inst. Geol. 2016, 466, 201–214. [Google Scholar] [CrossRef]
- Jarzyna, A.; Bąbel, M.; Ługowski, D.; Vladi, F. Preliminary morphological analysis of the anhydrite hydration forms at Dingwall (Canada, Nova Scotia) on the base of photogrammetric documentation. In Forum GIS UW. GIS na Uniwersytecie Warszawskim. Materiały Pokonferencyjne z 5. i 6. Forum GIS na UW; Chyla, J., Lechnio, J., Stępień, M., Zaszewski, D., Eds.; UW WG, WGiSR, IAWH: Warsaw, Poland, 2019; pp. 92–102. (In Polish with English Summary). [Google Scholar] [CrossRef]
- Twidale, C.R.; Bourne, J.A. On the origin of A-tents (pop-ups), sheet structures, and associated forms. Prog. Phys. Geogr. 2009, 33, 147–162. [Google Scholar] [CrossRef]
- Demicco, R.V.; Hardie, L.A. Sedimentary Structures and Early Diagenetic Features of Shallow Marine Carbonate Deposits; SEPM Atlas Series; SEPM: Tulsa, OK, USA, 1994; pp. 1–255. [Google Scholar] [CrossRef]
- Jennings, J.N.; Twidale, C.R. Origin and implications of the A-tent, a minor granite landform. Aust. Geogr. Stud. 1971, 9, 41–53. [Google Scholar] [CrossRef]
- Folk, R.L.; Begle Patton, E. Buttressed expansion of granite and development of grus in Central Texas. Z. Geomorphol. Neue Folge 1982, 26, 17–32. [Google Scholar]
- Ericson, K.; Olvmo, M. A-tents in the Central Sierra Nevada, California: A geomorphological indicator of tectonic stress. Phys. Geogr. 2004, 25, 291–312. [Google Scholar] [CrossRef]
- Pulido-Bosch, A. Le karst dans le gypses de Sorbas (Almeria). Aspects morphologiques et hydrogéologiques. In Karst et Cavités d’Andalousie, Cordillères Bétiques Centrales et Occidentales; Karstologia, Mémoires, 1; Association Française de Karstologie: Nîmes, France, 1986; pp. 27–35. [Google Scholar]
- Von Gaertner, H.-R. Petrographie und paläogeographische Stellung der Gipse vom Südrande des Harzes. Jahrb. Preußischen Geol. Landesanst. Berl. 1933, 53, 655–694. [Google Scholar]
- Hargitai, H.; Kereszturi, A. Encyclopedia of Planetary Landforms; Springer: New York, NY, USA, 2015; pp. 1–2460. [Google Scholar] [CrossRef] [Green Version]
- Bishop, J.L.; Yeşilbaş, M.; Hinman, N.W.; Burton, Z.F.M.; Englert, P.A.J.; Toner, J.D.; McEwen, A.S.; Gulick, V.C.; Gibson, E.K.; Koeberl, C. Martian subsurface cryosalt expansion and collapse as trigger for landslides. Sci. Adv. 2021, 7, eabe4459. [Google Scholar] [CrossRef]
- Neale, E.R.W. Geology, Dingwall, Nova Scotia, Map 1124A; Geological Survey of Canada, Department of Mines and Technical Surveys: Ottawa, ON, Canada, 1963. [Google Scholar]
- Adams, G.C. Gypsum and anhydrite resources in Nova Scotia. Econ. Geol. Ser. 1991, 91, 1–293. [Google Scholar]
- Wiebe, R.A. Igneous and tectonic events in northeastern Cape Breton Island, Nova Scotia. Can. J. Earth Sci. 1972, 9, 1262–1277. [Google Scholar] [CrossRef]
- Lynch, G.; Tremblay, C. Late Devonian–Carboniferous detachment faulting and extensional tectonics in western Cape Breton Island, Nova Scotia, Canada. Tectonophysics 1994, 238, 55–69. [Google Scholar] [CrossRef]
- Grant, D.R. Quaternary geology, Cape Breton Island, Nova Scotia. Geol. Surv. Can. 1994, 482, 1–159. [Google Scholar] [CrossRef]
- Moseley, M. Genesis of schlottenkarren on the Avon Peninsula of Nova Scotia (Canada) with implications for the geochronology of evaporate karsts and caves of Atlantic Canada. Int. J. Speleol. 2017, 46, 267–276. [Google Scholar] [CrossRef] [Green Version]
- Ford, D. Principal features of evaporite karst in Canada. Carbonate Evaporite 1997, 12, 15–23. [Google Scholar] [CrossRef]
- Stenson, R.E.; Ford, D.C. Rillenkarren on gypsum in Nova Scotia. Geogr. Phys. Quatern. 1993, 47, 239–243. [Google Scholar] [CrossRef] [Green Version]
- Climate-Data.org. Available online: https://en.climate-data.org/north-america/canada/nova-scotia/dalem-lake-98946/ (accessed on 18 September 2021).
- Zepner, L.; Karrasch, P.; Wiemann, F.; Bernard, L. ClimateCharts.net—An interactive climate analysis web platform. Int. J. Digit. Earth 2021, 14, 338–356. [Google Scholar] [CrossRef]
- Clark, C.D.; Hughes, A.L.C.; Greenwood, S.L.; Spagnolo, M.; Ng, F.S.L. Size and shape characteristics of drumlins, derived from a large sample, and associated scaling laws. Quatern. Sci. Rev. 2009, 28, 677–692. [Google Scholar] [CrossRef] [Green Version]
- Spagnolo, M.; Clark, C.D.; Hughes, A.L.C.; Dunlop, P.; Stokes, C.R. The planar shape of drumlins. Sediment. Geol. 2010, 232, 119–129. [Google Scholar] [CrossRef]
- Maclachlan, J.C.; Eyles, C.H. Quantitave geomorphological analysis of drumlins in the Peterborough Drumlin Field, Ontario, Canada. Geogr. Ann. Ser. A Phys. Geogr. 2013, 95, 125–144. [Google Scholar] [CrossRef]
- Spagnolo, M.; Clark, C.D.; Hughes, A.L.C. Drumlin relief. Geomorphology 2012, 153–154, 179–191. [Google Scholar] [CrossRef] [Green Version]
- Dadlez, R.; Jaroszewski, W. Tektonika; Wydawnictwo Naukowe PWN: Warsaw, Poland, 1994; pp. 1–743. [Google Scholar]
- Mathumaniraja, C.K.; Anbazhagan, S.; Jothibasu, A.; Chinnamuthu, M. Remote sensing and fuzzy logic approach for artificial recharge studies in hard rock terrain of South India. In GIS and Geostatistical Techniques for Groundwater Science; Senapathi, V., Viswanathan, P.M., Chung, S.Y., Eds.; Elsevier: Amsterdam, The Netherlands, 2019; pp. 91–112. [Google Scholar] [CrossRef]
- Triggs, B.; Mclauchlan, P.; Hartley, R.; Fitzgibbon, A. Bundle adjustment—A modern synthesis. In Vision Algorithms: Theory and Practice; IWVA 1999, Lecture Notes in Computer Science; Triggs, B., Zisserman, A., Szeliski, R., Eds.; Springer: Berlin/Heidelberg, Germany, 2000; Volume 1883, pp. 1–71. [Google Scholar] [CrossRef] [Green Version]
- Snavely, K.N. Scene Reconstruction and Visualization from Internet Photo Collections. Ph.D. Thesis, University of Washington, Seattle, WA, USA, 2008; pp. 1–192. [Google Scholar]
- Westoby, M.J.; Brasington, J.; Glasser, N.F.; Hambrey, M.J.; Reynolds, J.M. ‘Structure-from-motion’ photogrammetry: A low-cost, effective tool for geoscience applications. Geomorphology 2012, 179, 300–314. [Google Scholar] [CrossRef] [Green Version]
- Agisoft. Agisoft PhotoScan User Manual Professional Edition, Version 1.2; Agisoft LLC: St. Petersburg, Russia, 2016; pp. 1–97. [Google Scholar]
- Randazzo, G.; Italiano, F.; Micallef, A.; Tomasello, A.; Cassetti, F.P.; Zammit, A.; D’Amico, S.; Saliba, O.; Cascio, M.; Cavallaro, F.; et al. WebGIS Implementation for dynamic mapping and visualization of coastal geospatial data: A case study of BESS project. Appl. Sci. 2021, 11, 8233. [Google Scholar] [CrossRef]
- Rose, J.; Letzer, J.M. Drumlin measurements: A test of the reliability of data derived from 1:25,000 scale topographic maps. Geol. Mag. 1975, 112, 361–371. [Google Scholar] [CrossRef]
- Turner, K. What’s the Difference among 2-D, 2.5-D, 3-D and 4-D? Applied Geoscience Forum, GIS World Article. 1997. Available online: http://dusk.geo.orst.edu/gis/gis_world_article.pdf (accessed on 13 July 2022).
- Price, M.H. Mastering ArcGIS, 7th ed.; McGraw-Hill Education: New York, NY, USA, 2016; pp. 1–606. [Google Scholar]
- Devore, J.L. Probability and Statistics for Engineering and the Sciences, 9th ed.; Cengage Learning: Boston, MA, USA, 2016; pp. 1–715. [Google Scholar]
- Curl, R.L. On the definition of a cave. NSS Bull. 1964, 26, 1–6. [Google Scholar]
- Curl, R.L. Entranceless and fractal caves revisited. In Karst Modeling, Proceedings of the Symposium, Charlottesville, VA, USA, 24–27 February 1999; Karst Waters Institute Special Publication 5; Palmer, A.N., Palmer, M.V., Sasowsky, I.D., Eds.; Karst Waters Institute Inc.: Charles Town, WV, USA, 1999; pp. 183–185. [Google Scholar]
- Twiss, R.J.; Moores, E.M. Structural Geology, 2nd ed.; W.H. Freeman and Company: New York, NY, USA, 2007; pp. 1–736. [Google Scholar] [CrossRef]
- Potter, P.E.; Pettijohn, F.J. Paleocurrents and Basin Analysis, 2nd ed.; Springer: Berlin/Heidelberg, Germany, 1977; pp. 1–425. [Google Scholar] [CrossRef]
- Peacock, D.C.P.; Sanderson, D.J.; Rotevatn, A. Relationship between fractures. J. Struct. Geol. 2017, 106, 41–53. [Google Scholar] [CrossRef]
- Hancock, P.L. Brittle microtectonics: Principles and practice. J. Struct. Geol. 1985, 7, 437–457. [Google Scholar] [CrossRef]
- Laslett, G.M. Censoring and edge effects in areal and line transect sampling of rock joint traces. Math. Geol. 1982, 14, 125–140. [Google Scholar] [CrossRef]
- Hydration Caves. Available online: http://hydrationcaves.com/en/77-hydration-forms/ (accessed on 8 May 2022).
- Beales, F.W.; Oldershaw, A.E. Evaporite-solution brecciation and Devonian carbonate reservoir porosity in Western Canada. Am. Assoc. Petr. Geol. B. 1969, 53, 503–512. [Google Scholar] [CrossRef]
- Curl, R.L. Caves as a measure of karst. J. Geol. 1966, 74, 798–830. [Google Scholar] [CrossRef]
- Webb, T.C. Geology and economic development of early Carboniferous marine evaporates, southeastern New Brunswick. In Lands, Minerals and Petroleum Division; Field Guide No. 6; Lands, Minerals and Petroleum Division, Department of Natural Resources: Tracadie-Sheila, NB, Canada, 2010; pp. 1–71. [Google Scholar]
- Ball, P. The Self-Made Tapestry: Pattern Formation in Nature; Oxford University Press: Oxford, UK, 2001; pp. 1–312. [Google Scholar]
- Ferrarese, F.; Macaluso, T.; Madonia, G.; Palmeri, A.; Sauro, U. Solution and recrystallisation processes and associated landforms in gypsum outcrops of Sicily. Geomorphology 2002, 49, 25–43. [Google Scholar] [CrossRef]
- Macaluso, T.; Sauro, U. Aspects of weathering and landforms evolution on gypsum slopes and ridges of Sicily. Suppl. Geogr. Fis. Dinam. Quat. 1998, 3, 91–99. [Google Scholar]
- Scott, D.N.; Wohl, E.E. Bedrock fracture influence on geomorphic process and form across process domains and scales. Earth Surf. Proc. Land. 2018, 44, 27–45. [Google Scholar] [CrossRef]
- Narr, W.; Suppe, J. Joint spacing in sedimentary rocks. J. Struct. Geol. 1991, 13, 1037–1048. [Google Scholar] [CrossRef]
- Shaocheng, J.; Zheming, Z.; Zichao, W. Relationship between joint spacing and bed thickness in sedimentary rocks: Effects of interbed slip. Geol. Mag. 1998, 135, 637–655. [Google Scholar] [CrossRef]
- Butscher, C.; Mutschler, T.; Blum, P. Swelling of clay-sulfate rocks: A review of processes and controls. Rock Mech. Rock Eng. 2016, 49, 1533–1549. [Google Scholar] [CrossRef]
- Fleuchaus, P.; Blum, P. Damage event analysis of vertical ground source heat pump systems in Germany. Geotherm. Energy 2017, 5, 1–15. [Google Scholar] [CrossRef] [Green Version]
- Hou, Z.; Wu, J. A practical swelling constitutive model of anhydrite and its application on tunnel engineering. Res. Sq. 2022. [Google Scholar] [CrossRef]


| Site Name/ Province/ Country | Pisky/ Lviv Oblast/ Ukraine | Walkeried/ Lower Saxony/ Germany | Alebastrovyye Islands/ Novaya Zemlya/Russia | Dingwall/ Nova Scotia/ Canada |
|---|---|---|---|---|
| References | [7,13,18,20,28,54,55,56,57,58,59,60] | [1,2,4,6,7,49,51,68] | [5] | [6,7,8,9,14,48,61] |
| Number of documented hydration forms | 99 | 26 | unknown number | 69 * |
| Area with hydration relief | 200 × 300 m | 1300 × 600 m | 800 × 150 m | 1800 × 1400 m |
| Range of dimensions of hydration forms | length: 0.58–18.1 m width: 0.32–15.5 m height: 0.05–3.0 m | length: <10 m width: 7.0 m height: <3 m | length: 3–15 m width: 1–10 m height: 0.5–1.5 m | length: <25 m width: 0.8–8.2 m height: 0.1–2.4 m |
| Range of dimensions of inner hydration caves | length: <9.5 m. width: <7.8 m height: <2.4 m | length: <10 m width: <7.5 m height: <2.3 m | length: unknown width: unknown height: <1.5 m | length: <10.7 m width: <6.6 m height: <1.32 m |
| Name of Parameter | Symbol, Unit and Formula (If Applied) | Maximum–Minimum; Average Value | Number of Measurements | References | Simplified Frequency Distribution Diagrams |
|---|---|---|---|---|---|
| Length * | a (m) | 1.86–23.05; 5.25 | 74 | [36] modified; [67] modified; [81] modified; [82,83] | 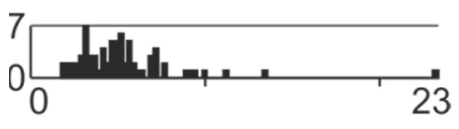 |
| Width | b (m) | 0.92–9.01; 8.38 | 74 | [36] modified; [67] modified; [81] modified; [82,83] | 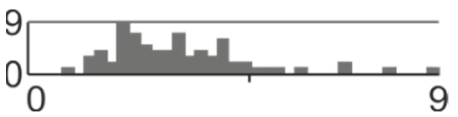 |
| Relative height | hr (m) | 0.33–2.09; 0.83 | 74 | [84] modified | 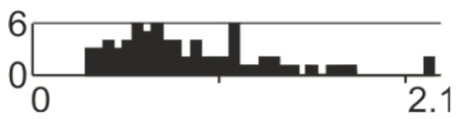 |
| Thickness of detached layer | e (m) | 0.06–0.46; 0.21 | 54 | [18,36,64] | 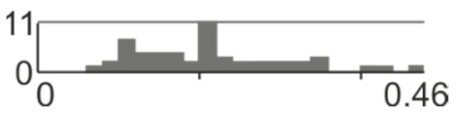 |
| Coefficient of circularity | C (–) (a − b)/a | 0.04–0.73; 0.33 | 74 | [18,36,67] | 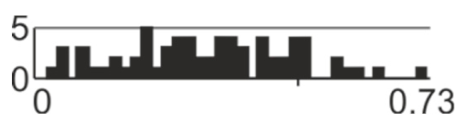 |
| Azimuth of elongation orientation | Az (°) | 0–176 ****; 84 | 68 | New |  |
| Bulge degree | B (–) b/hr | 1.82–8.58; 4.28 | 74 | [84] | 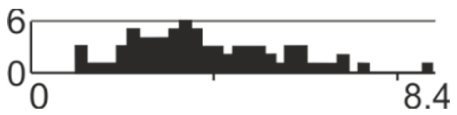 |
| Fracture density | FD (m/m2) ΣLs/P *** | 0.04–3.38; 0.85 | 69 | [85,86] modified |  |
| Length of the entrance line ** | — (m) | 0.30–4.52; 1.21 | 98 | New | 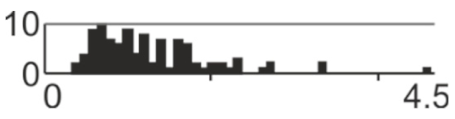 |
| Azimuth of the entrance line ** | — (°) | 0–177 ****; 92 | 98 | New | 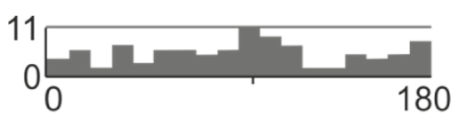 |
| Azimuth of entrance ** | — (°) | 0–350 ****; 92 | 92 | [18] | 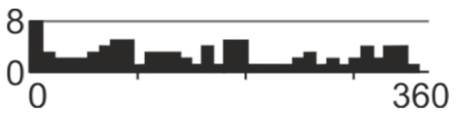 |
| Direction of maximum lateral expansion | — (°) | 3–67, 80–115, 130–176 ****; 83 | 66 | [66] modified | 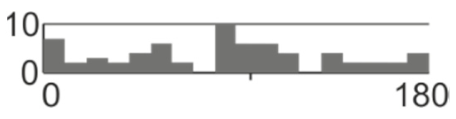 |
Publisher’s Note: MDPI stays neutral with regard to jurisdictional claims in published maps and institutional affiliations. |
© 2022 by the authors. Licensee MDPI, Basel, Switzerland. This article is an open access article distributed under the terms and conditions of the Creative Commons Attribution (CC BY) license (https://creativecommons.org/licenses/by/4.0/).
Share and Cite
Jarzyna, A.; Bąbel, M.; Ługowski, D.; Vladi, F. Morphology of Dome- and Tepee-Like Landforms Generated by Expansive Hydration of Weathering Anhydrite: A Case Study at Dingwall, Nova Scotia, Canada. Appl. Sci. 2022, 12, 7374. https://doi.org/10.3390/app12157374
Jarzyna A, Bąbel M, Ługowski D, Vladi F. Morphology of Dome- and Tepee-Like Landforms Generated by Expansive Hydration of Weathering Anhydrite: A Case Study at Dingwall, Nova Scotia, Canada. Applied Sciences. 2022; 12(15):7374. https://doi.org/10.3390/app12157374
Chicago/Turabian StyleJarzyna, Adrian, Maciej Bąbel, Damian Ługowski, and Firouz Vladi. 2022. "Morphology of Dome- and Tepee-Like Landforms Generated by Expansive Hydration of Weathering Anhydrite: A Case Study at Dingwall, Nova Scotia, Canada" Applied Sciences 12, no. 15: 7374. https://doi.org/10.3390/app12157374
APA StyleJarzyna, A., Bąbel, M., Ługowski, D., & Vladi, F. (2022). Morphology of Dome- and Tepee-Like Landforms Generated by Expansive Hydration of Weathering Anhydrite: A Case Study at Dingwall, Nova Scotia, Canada. Applied Sciences, 12(15), 7374. https://doi.org/10.3390/app12157374