Article

Hydro Statistical Assessment of TRMM and GPM Precipitation Products against Ground Precipitation over a Mediterranean Mountainous Watershed (in the Moroccan High Atlas)

by
Myriam Benkirane
1,*,
Nour-Eddine Laftouhi
1,
Saïd Khabba
2,3 and
África de la Hera-Portillo
4
1
GeoSciences Laboratory, Geology Department, Faculty of Sciences Semlalia, Cadi Ayyad University (UCA), Marrakech 40000, Morocco
2
LMFE, Faculty of Sciences Semlalia, University Cadi Ayyad, Marrakech 40000, Morocco
3
Center for Remote Sensing Applications (CRSA), Mohammed VI Polytechnic University (UM6P), Benguerir 43150, Morocco
4
Centro Nacional Instituto Geológico y Minero de España (CSIC), Ríos Rosas 23, 28003 Madrid, Spain
*
Author to whom correspondence should be addressed.
Appl. Sci. 2022, 12(16), 8309; https://doi.org/10.3390/app12168309
Submission received: 19 July 2022 / Revised: 16 August 2022 / Accepted: 17 August 2022 / Published: 19 August 2022
(This article belongs to the Special Issue Geomorphology in the Digital Era)

Abstract

:
The tropical Rainfall Measuring Mission TRMM 3B42 V7 product and its successor, the Global Precipitation Measurement Integrated Multi-satellitE Retrievals for GPM IMERG high-resolution product GPM IMERG V5, have been validated against rain gauges precipitation in an arid mountainous basin where ground-based observations of precipitation are sparse, or spatially undistributed. This paper aims to evaluate hydro-statically the performances of the TRMM 3B42 V7 and GPM IMERG V05 satellite precipitations products SPPs, at multiple temporal scales, from 2014 to 2017. SPPs are compared with the gauge station and show good results for both statistical and contingency metrics with notable values R > 0.94. Moreover, the rainfall-runoff events implemented on the hydrological model were performed at 3-hourly time steps and showed satisfactory results based on the obtained Nash–Sutcliffe criteria ranging from 94.50% to 57.50%, and from 89.3% to 51.2%, respectively. The TRMM product tends to underestimate and not capture extreme precipitation events. In contrast, the GPM product can identify the variability of precipitation at small time steps, although a slight underestimation in the detection of extreme events can be corrected during the validation steps. The proposed method is an interesting approach for solving the problem of insufficient observed data in the Mediterranean regions.

1. Introduction

Precipitation is a major force in global climate change and plays a vital role in hydrological and meteorological applications [1]. As a significant phenomenon in nature, precipitation has complex characteristics of spatiotemporal variations. It is one of the critical components of the global exchange of the surface material, the hydrological cycle, and disaster prevention [2,3].
The variability of precipitation in mountainous areas directly affects local agriculture and the ecological environment [4,5]. Moreover, the heavy precipitation events that occurred in mountainous areas frequently generate flash floods [6]. Therefore, the acquisition of reliable precipitation information in mountainous areas is of great significance to social and economic development and related scientific research [7]. Rain gauge observation could provide a moderately accurate method for a point-based precipitation measurement. However, rain gauges in mountainous regions are often scarce, irregular, and sometimes unavailable [4,8]. Thus, in the applications that need high spatiotemporal resolution precipitation data, such as flood disaster forecasts, gauge data are regularly insufficient [9,10]. Contrary to rain gauge precipitations, satellite remote sensing has the advantages of thoroughly scanning the entire study region and convenient access to the data [11], providing an alternate way to monitor precipitation at regional and global scales [12,13].
In recent decades, a series of high spatiotemporal resolutions satellite precipitation products (SPPs), have been produced with the development of various space-borne and related satellite-based precipitation retrieval algorithms, such as Artificial Neural Networks (PERSIANN) [14], National Oceanic and the Atmospheric Administration/Climate Prediction Center (NOAA/CPC) morphing technique (CMORPH) [15,16], as well as the Climate Hazards Group InfraRed Precipitation with Station data (CHIRPS) [17], the Tropical Rainfall Measuring Mission (TRMM) Multi-satellite Precipitation Analysis (TMPA) [18], and the Integrated Multi-satellitE Retrievals for (GPM) mission (IMERG) [19].
Compared to these satellite precipitation products, the TRMM 3B42V7 precipitation product performance is higher than other products, especially in estimating extreme precipitation events in several areas worldwide [20,21]. TRMM was launched in November 1997 by the National Aeronautics and Space Administration (NASA) with the Japanese Aerospace Exploration Agency (JAXA) collaboration. The TRMM Version-7 offers quasi-global coverage (50° N–50° S) precipitation estimates at a high spatial resolution of (0.25° × 0.25°) and temporal resolution of 3 h [18].
Given the excellent successes of the TRMM, the GPM Core Observatory satellite was set in motion by NASA and JXAX as a successor of TRMM in February 2014. Compared with TRMM, the potential of GPM to detect liquid and solid precipitation is improved by carrying a space-borne dual-frequency precipitation radar [22]. Additionally, the GPM Core Observatory carrying a conical scanning multichannel microwave imager offers a wider measurement range [19]. The lately released IMERG further expands quasi-global coverage from (50° N–50° S) to (60° N–60° S) and provides precipitation estimates with a more satisfactory spatial resolution of (0.1° × 0.1°) and temporal resolution of 30 min [23].
Since the deliverance of IMERG products, many studies have been conducted to evaluate and compare the performance of TMPA and IMERG products regarding rain gauges observations in many regions, such as the USA [24], Brazil [25], Japan [26], China [27], South Korea [28], Malaysia [29], Pakistan [30], South America [31], Cyprus [32], Egypt [33], and Morocco [34,35]. However, most of these studies indicate that (IMERGV5) had greater performance in the characterization of precipitation variability and precipitation detection aptitude, with only slight improvements compared to TMPA products.
This study evaluated statistically and hydrologically the precipitation estimates of the (3B42 V7) and (IMERG V05) satellites regarding ground-based precipitation monitoring over the Zat Mountain semi-arid watershed located in the Moroccan High Atlas. The purpose of this study is to solve a major problem due to the unavailability of precipitation measurement stations, which leads to a considerable lack of data, and therefore difficulties to work on scientific aspects such as flood forecasting and water management. The aims of this paper are (1) to evaluate and statistically compare the performance of the precipitation products (3B42 V7) and (IMERG V05) at several temporal scales in the Zat basin, and (2) to assess the precipitation detection capability of the satellite sensors (3B42 V7) and (IMERG V05), and (3) to be able to evaluate the ability of the SPPSs to reproduce rainfall events and to demonstrate their ability to provide meaningful information in hydrological modeling and flood forecasting.

2. Materials and Methods
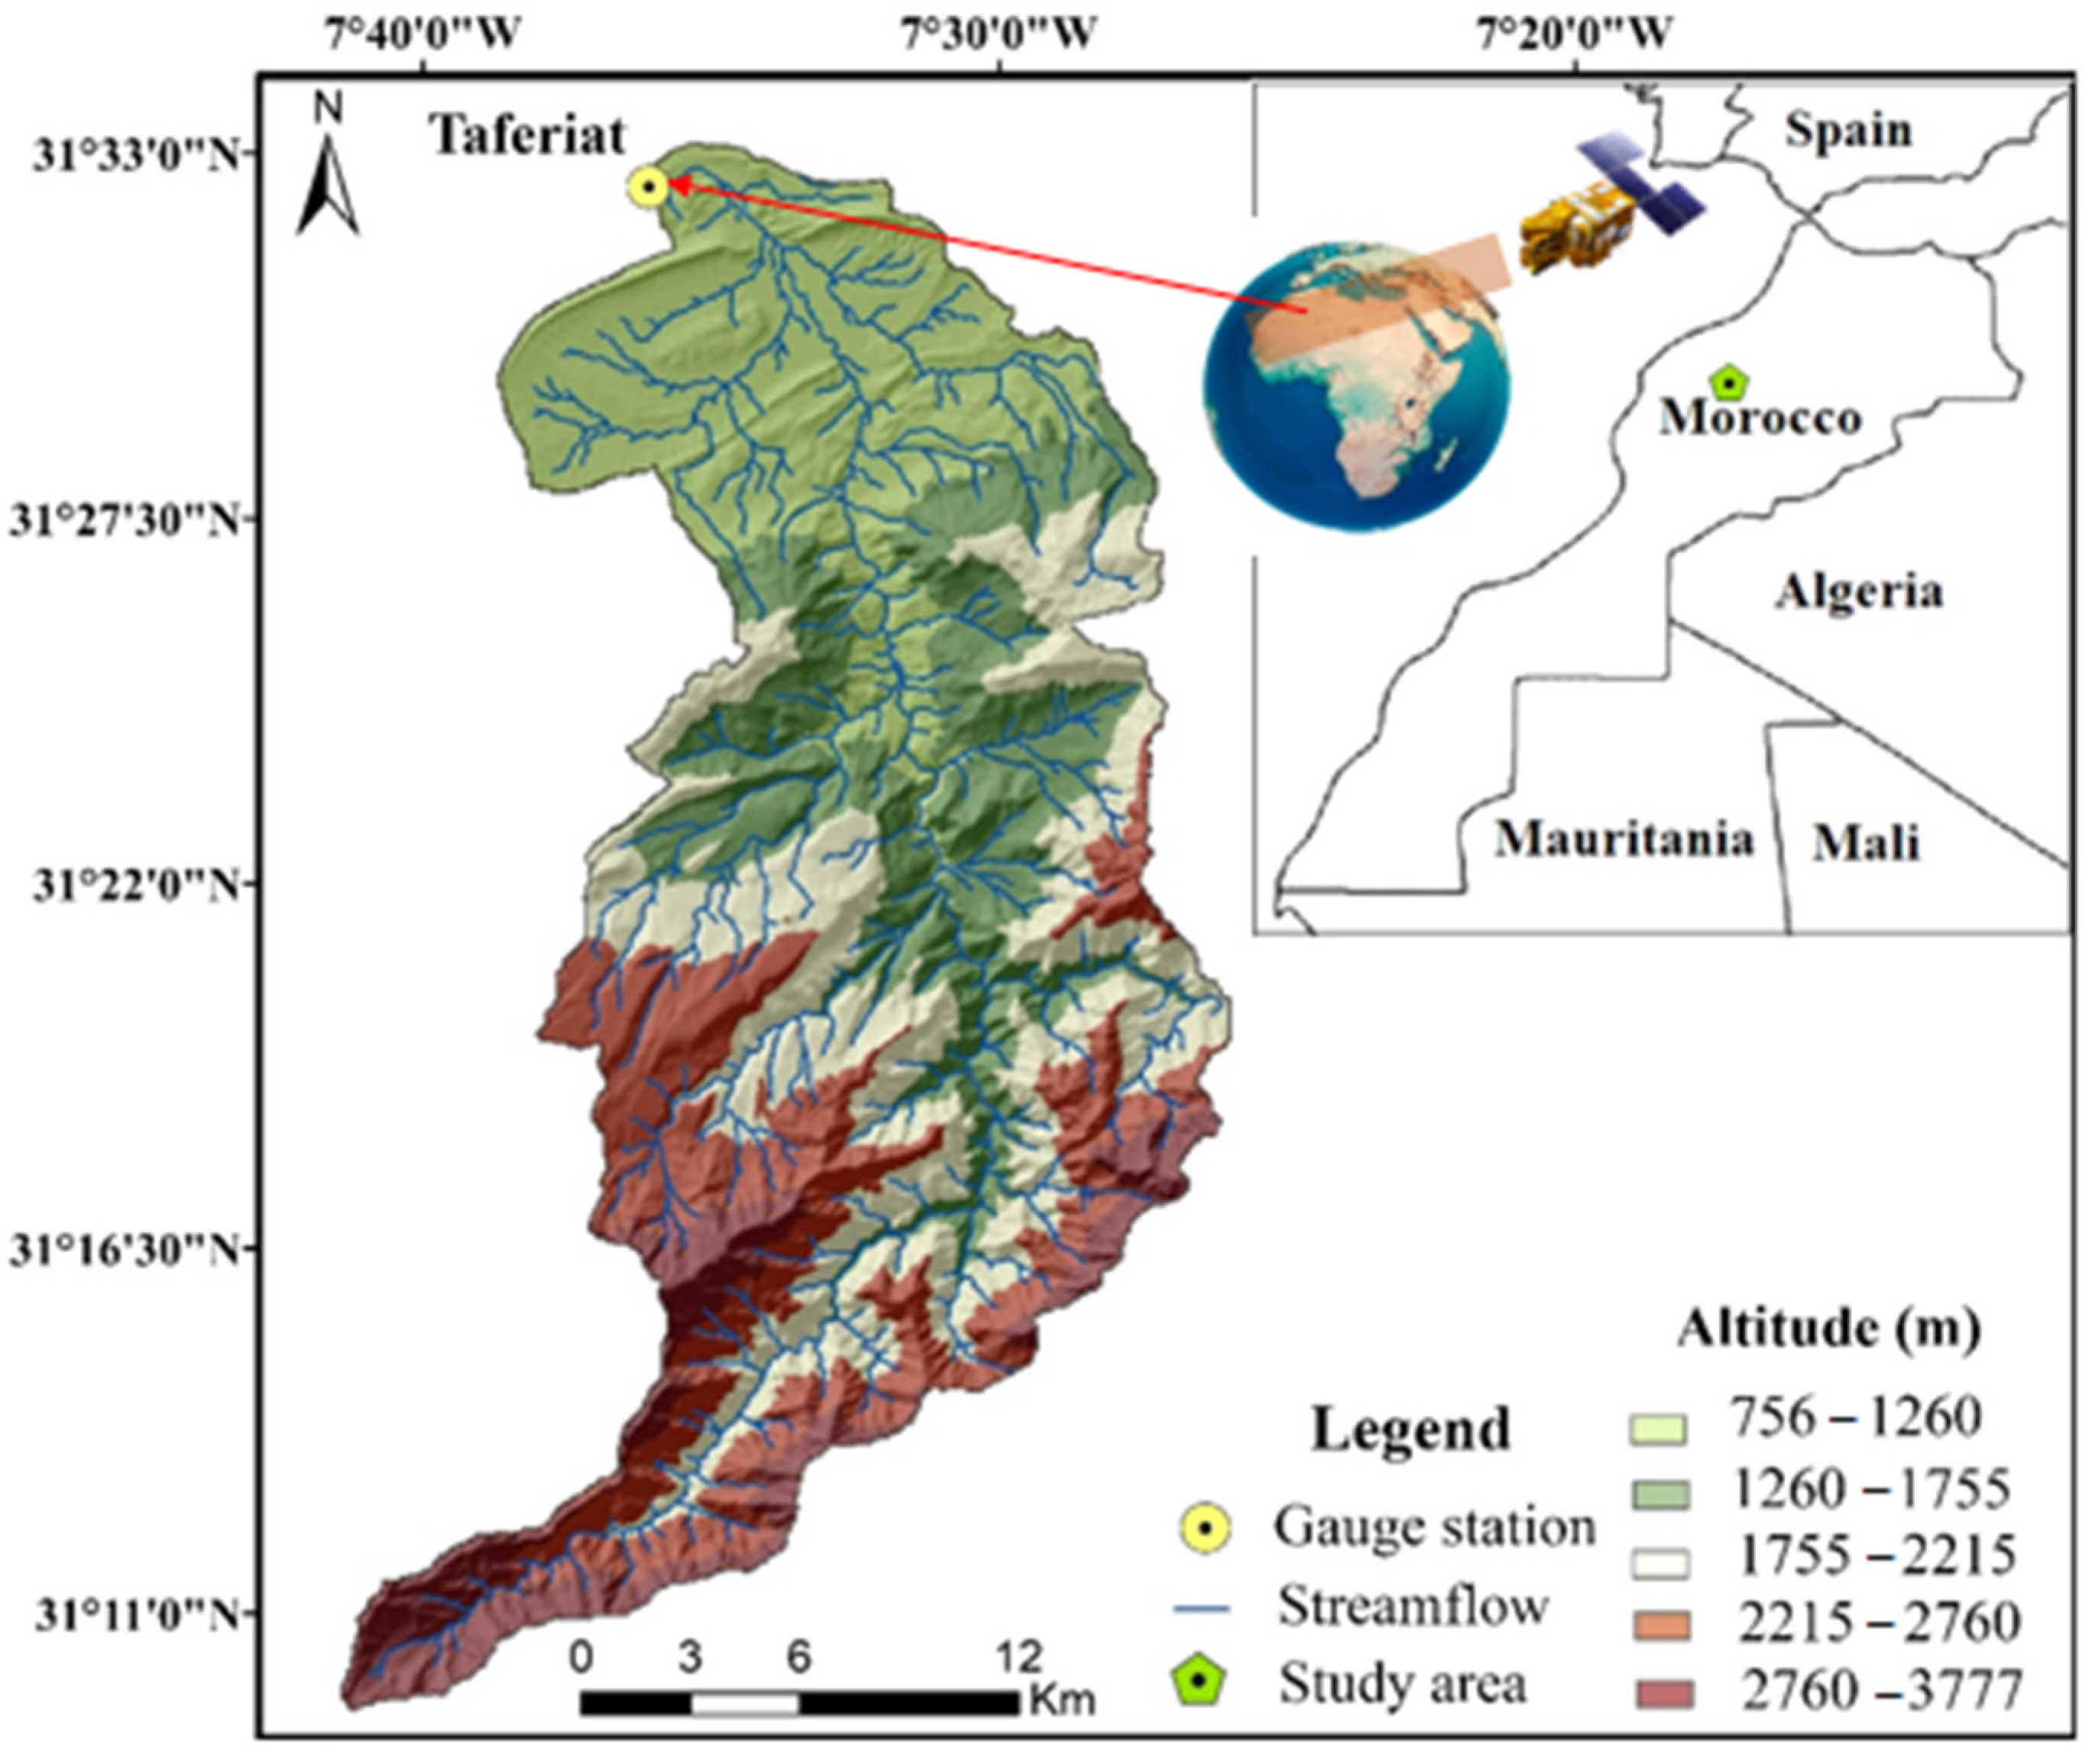
2.1. Study Area

The Tensift basin is considered one of the main basins of Morocco, covering an area of 20,450 km2 around Marrakech city, from the High Atlas Mountains to the Atlantic coast. This watershed is characterized by a semi-arid climate expressed by low rainfall, and high evaporation. Most of the Tensift flow comes from its five main tributaries, which have their source on the northern slopes of the High Atlas, which includes the Zat basin.
Zat watershed is a sub-basin of the Tensift catchment, and is also an Atlas tributary located on the left bank of the Tensift river and situated in the Moroccan High Atlas Mountains (Mount Toubkal, the highest mountain in North Africa) in the South EST of Marrakech city. Geographically, the sub-basin is located between latitude 31°30′ and 31°45′ North and longitude 7°30′ and 7°45′ West. It is drained by the Zat River, which measures 89 km, often has very steep slopes with an average of 19%, and covers a total area of about 520 km2 (Figure 1). The hypsometry of the catchment varies from 3777 m (above sea level) upstream to the Taferiat station where the outlet is at an altitude of 756 m [36].
This sub-basin is characterized by a Mediterranean climate strongly influenced by altitude. The Taferiat hydrometric station controls the discharge of the Zat basin, and also serves as a rain gauge. It receives an annual rainfall average of 523 mm/year; precipitation is mainly concentrated during the rainy period from October to April and a hot and dry period from May to September. Therefore, this study region is subject to frequent flash floods and droughts [36].

2.2. Dem

The terrain pre-processing started with the reconditioning of the Digital Elevation Model (DEM). The DEM tiles of resolution is approximately 30 m. It was downloaded from the United States Geological Survey (USGS). This DEM was clipped along the border of the basin using the polygon shapefile of the county downloaded from ESRI (Figure 1).

2.3. Rain Gauge Data

Rain gauge measurements are 10-min time scales precipitation data, collected from the only meteorological station of this basin shown in (Figure 1) located at the outlet of Zat basin, covering a period from 2014 to 2017. Data sets were provided by the Tensift Hydraulic Basin Agency. These data were used as a benchmark for evaluating TRMM 3B42 V7 and GPM IMERG V05 SPPs. All that was provided by this station were subject to strict quality control such as climate limit value inspection, and station extreme value inspection [37]. In addition, the daily, monthly, and yearly precipitation values were accumulated from 10-min observations.

2.4. Satellite Precipitation Data

This study evaluated two different satellite precipitation products SPPs, the TRMM 3B42 V7, and the GPM IMERG V05 compared to the gauge station at different time scales, from 1 September 2014 to 31 August 2017, in order to assess their reliability, and define their capabilities.
The period was chosen according to the available precipitation and discharge data. The Taferiat station was installed in 2012, and the available flow data extends to 2017 only. This limited the temporal interval of the study. Moreover, the GPM satellite was launched in 2014, which explains the choice of the beginning year of the data series.

2.4.1. TRMM 3B42 V7

The TRMM 3B42 V7 precipitation products were generated by using the TRMM 3B42 Version 7 algorithm [18]. It was designed to combine various microwaves MW, and infrared IR satellite-based precipitation estimates with gauge adjustments observations to provide 3-hourly quasi-global quantitative precipitation estimates. The 3B42 V7 product was derived by bias adjusting the near-real-time product with the GPCC monthly gauge-analysis precipitation data set, and it has a two-month latency [1]. The product can produce rational precipitation estimates in a 0.25° spatial resolution with a quasi-global coverage (50° S–50° N). In this study, the TRMM 3B42 V7 daily precipitation product was acquired from the Precipitation Measurement Mission (PMM) website (https://giovanni.gsfc.nasa.gov/giovanni/ (accessed on 16 May 2022)).

2.4.2. GPM IMERG V5

The GPM project is the result of a collaboration between (NASA) and (JAXA). The GPM satellite carries two primary sensors: the multi-channel GPM Microwave Imager (GMI), and the Dual-frequency Precipitation Radar (DPR). This product is expected to provide the next-generation global observations of rain and snow and improve weather and precipitation forecasts through the assimilation of instantaneous precipitation information [26]. The IMERG V05 uses the Goddard Profiling Algorithm to retrieve precipitation estimates from the GPM constellation using various precipitation-relevant satellite PMW sensors. Thereafter, the precipitation estimates are gridded and inter-calibrated into the GPM combined instrument product, further interpolated, and re-calibrated by the CPC Morphing-Kalman Filter Lagrangian time interpolation and the PERSIAN-Cloud Classification System recalibration schemes. IMERG is the Level 3 precipitation estimation algorithm of GPM, which provides three different daily IMERG products, which include IMERG Day 1 Early Run (near-real-time with a latency of 6 h), IMERG Day 1 Late Run (reprocessed near-real-time with a latency of 18 h) and IMERG Day 1 Final Run (gauged-adjusted with a latency of four months) products [38]. In this study, we evaluated the latest released GPM IMERG Version 5 (IMERG V5), the dataset produced at NASA Goddard Earth Sciences (GES). The IMERG precipitation products have a relatively finer spatial 0.1° spatial resolution with spatial coverage from 60° S to 60° N and temporal (half-hourly) resolution. The daily precipitation data were accumulated to obtain monthly and annual precipitation. The GPM (IMERG V05 final run) precipitation data were downloaded from the PMM website (https://giovanni.gsfc.nasa.gov/giovanni/ accessed on 20 May 2022)).

2.5. Statistical Evaluation of Satellite Precipitation Products

Different methods were used to compare the 3B42 V7 and IMERG V05 products with the gauge precipitation data from the Taferiat station, depending on temporal evolution by considering (sub-hourly, daily, monthly, and yearly) time steps. However, both studied satellite products have different spatial and temporal resolutions of (0.25°/3 h 3B42 V7 and (0.1°/30 min for IMERG V05), respectively, while the rain gauge station is located at the basin outlet and provides 10-min precipitation measurements of precipitation and runoff. For a reliable comparison, the used method is to plot the point precipitation data from the gauges to the same grid scale as the SPPs, either by spatial interpolation or simply by calculating the average. In addition, ref. [39] pointed out that the interpolation can lead to uncertainties due to systematic errors of the gauge density. Therefore, in our case, a direct comparison was used, extracting the numerical data from the SPPs and measuring the precipitation, adjusting them simultaneously to compare them to each other.
Furthermore, to evaluate the ability of the SPPs to estimate extreme rainfall events, it was decided to use them as input data in the HEC-HMS hydrological model. Indeed, the rainfall measurement station is not precise and poorly distributed spatially, especially in the mountainous regions of the High Atlas, which is a real issue for research work on hydrological modeling and flood forecasting. Consequently, it is important to evaluate the rainfall estimated by the satellites to demonstrate their ability to provide significant information and to approve their use as an alternative source of rainfall measurement data, especially during extreme precipitation events.

2.5.1. Continuous Statistical Indices

The assessment and comparison of the SPPs was conducted on the basis of the overall assessment (continuous statistical measures) and the precipitation detection capability (categorical statistical measures).
In addition, the capability of the SPPs to measure different precipitation intensity classes and flood periods was evaluated as well (Table 1). Four statistical measures were selected: correlation coefficient (CC), root mean square error (RMSE), and bias (bias), which were calculated to statistically evaluate the two PPS products.
Where N represents the number of samples; Si and S ¯ are gauge observations and their average; Pi and P ¯ represent satellite estimates and their average, respectively.
Additionally, a denotes the number of rainfall events that were observed and detected; c, is the number of rainfall events that failed to be detected by the satellite; b, denotes the number of rainfall events detected by the satellite that did not occur; the threshold for identifying a precipitation event is 0.2 mm/day.

2.5.2. Categorical Statistical Indices

To evaluate the precipitation detection capability of IMERG V05 and 3B42 V7 products, four categorical statistical indices were calculated to assess the ability of PPSs. The most common measures, counting Probability of Detection (POD), False Alarm Ratio (FAR), Critical Success Index (CSI), and Frequency Bias Index (FBI) are used in this study. The values of all categorical statistical measures are between 0 and 1.
The POD indicated the ratio of the number of precipitation events correctly detected by satellites among all real precipitation events. The FAR is the ratio of false alarming precipitation events to the total number of detected precipitation events. The FBI represents the fraction of falsely detected precipitation events (false alarm) compared to the total number of detected precipitation events, and indicates whether the dataset tends to overestimate (FBI > 1) or underestimate (FBI < 1) precipitation events. The CSI reported the number of correct predictions of a rain event divided by the total number of successes, false alarms, and failures.

2.6. Hydrological Model

The Hydrologic Engineering Centre’s Hydrologic Modeling System (HEC-HMS) is designed to simulate the rainfall-runoff processes of dendritic watershed systems. It is a deterministic, semi-distributed, event-based/continuous, mathematically-based (conceptual) model. It is able to model in a wide variety of geographical regions and different climatic contexts, such as arid and semi-arid mountainous climates, several studies having been carried out in the Tensift region. The HEC-HMS model was chosen mainly because it was previously validated in the same study area, and because it provided good and realistic results [36,42,43] in order to assess the applicability of the model in such an environment, using different approaches (event-based and continuous modeling).
The HEC-HMS model consists of four components: the basin model, the meteorological model, the control specifications, and the input data. The basin model provides information about the physical properties of the model, such as basin areas and stream reach connectivity. Similarly, the meteorological model includes information related to precipitation data. The control specification section contains information related to the timing of the model, the timing of a storm event, and the type of time interval (second, minute, hour, or day) that is required to be used in the model. Finally, the input data component contains the parameters or boundary conditions for the basin and weather models. The main input data used for this study are satellite and in situ precipitation and observed flow, as well as the different basin characteristics (number of curves, soil, LULC) resulting from the HEC-GeoHMS process. The method used in this paper includes the SCS-CN (Soil Conservation Service) curve number, the Clark unit hydrograph, and the base flow recession, which are necessary to determine the hydrological loss rate, runoff transformation, and base flow. The model was used in a lumped way (as we only have one measuring station at the downstream of the basin, which does not allow to do semi-distributed modeling). This approach aims to calibrate three rainfall events for each product, and then three more for observed rainfall. A total of 15 events were calibrated, 12 of which were satellite products, and 3 of which were observed data. The validation used a 3H time step of precipitation by implementing the model with different sources of precipitation data, such as observed and satellite precipitation with observed runoff, to evaluate the ability of SPPs to reproduce rainfall events from 2014 to 2017.

3. Results

3.1. Statistical Evaluation

The SPPs were statically compared against the ground observations to evaluate their accuracy and reliability. Table 2 lists the evaluation results of statistical metrics (CC, RMSE, and Bias) thought the entire study period over the Zat basin.
The rainfall time series of the two selected satellite products and the rain gauge at different timescales in the Zat basin are illustrated in Table 2. In general, the 3B42 V7 and IMERG V5 products present similar chronological precipitation patterns to those of the gauge. However, it can be seen that the product 3B42 V7 underestimates the 3 h and the daily precipitation, while the product IMERG V05 showed good performance on the 3 h and the daily timescale (Table 2). Regarding the monthly and annual time scale precipitation series, the product 3B42 V7 and IMERG V05 clearly showed good results.

3.2. Contingency Statistics

The categorical statistical metrics of 3B42 V7 and IMERG V5 at different time scales are shown in Table 3.
The precision of 3B42 V7 and IMERG V5 at 3 h, daily, monthly and annual scales were compared and analyzed. IMERG V05 demonstrated better performance than 3B42 V7 in detecting small time scale precipitation events, with high values of POD and CSI (0.13, 0.39 vs. 0.58, 0.82) and (0.08, 0.22 vs. 0.14, 0.18), respectively (Table 3), as well as reasonably high values of FAR and FBI (0.79, 0.66 vs. 0.83, 0.81) and (0.65, 1.17 vs. 3.63, 4.37), respectively.
The performance of the categorical statistical measures at the monthly and annual levels are shown in (Table 3). 3B42 V7 and IMERG V05 produced good results for rainfall estimation, with POD values and CSI values (0.99, 1 vs. 1, 1) and (0.07, 0 vs. 1.07, 1), respectively. Similarly, for the FAR and FBI, the results obtained were close to the perfect values, (0.08, 0 vs. 0.08, 0) and (1, 1 vs. 1.09, 1), respectively.
In general, IMERG V05 is better at detecting precipitation events, in particular at capturing precipitation traces and solid precipitation at a 3-hourly and daily scale, while 3B42 V7 can estimate precipitation on a large time scale.

3.3. Hydrological Evaluation of Discharge Simulation Using Two SPPs

The HEC-HMS model was used to calibrate and validate the 3 h of rainfall events from (1 September 2014) to (31 August 2017), at the level of the Zat basin, using the rainfall and runoff data from the Taferiat gauge station and satellite precipitation products. The four episodes that we chose to present are the most representative and complete of the data series.
The hydrological calibration and validation were carried out according to two different scenarios.
The obtained calibration and validation results are very satisfactory; the Nash–Sutcliffe coefficients obtained for calibration and validation are on average 88.20% and 57.50%, respectively (Table 4 and Table 5). The episode calibrations were performed by manual adjustment of the parameters in a way that does not lead to the deviation of the parameters from their real physical meaning, and which allows for a better understanding of each calibration parameter. This method requires a lot of time and effort to understand the behavior of each parameter and approximate it to the natural condition of the event occurrence. On the other hand, the objective function optimization method is simple and practical for function-based investigations but may ignore the real physical meaning of the parameters. Therefore, this paper combines the two methods to adjust the model parameters.
In this paper, eleven parameters were calibrated by maintaining the maximum and minimum intervals of calibration parameters based on the literature. The intervals of the calibrated parameter used are illustrated in Table 4.
Scenario 1 calibration: simulation and calibration using precipitation from both satellite products with observed fluxes, by adjusting the model parameters values until the model results acceptably match the observed data.
Scenario 2 validation: due to the limited sample size, the model was validated using the leave-one-out resampling approach; for the n flood events, each event i is successively removed, in order to find the relationship between the root-soil moisture measured by the time domain reflectometry “TDR” tool and the two models’ most sensitive calibration parameters (Curve Number “CN”, and time of concentration “TC”). A new CN was then re-estimated (Calculate CN) using the remaining n-1 episode. The CN calibration and the Tc parameters for an event i are set to the median of the calibrated parameters for the n-1 episodes. The calculated CN values obtained by this procedure are then used to model flood event i, and the simulated discharge is compared to the observed discharge. The validation results for the 15 events are presented in Table 6, indicating better model performance when using the SCS-CN model and taking into account soil moisture, with Nash coefficients between 0.51 and 0.82, using the leave-one-out procedure [43].

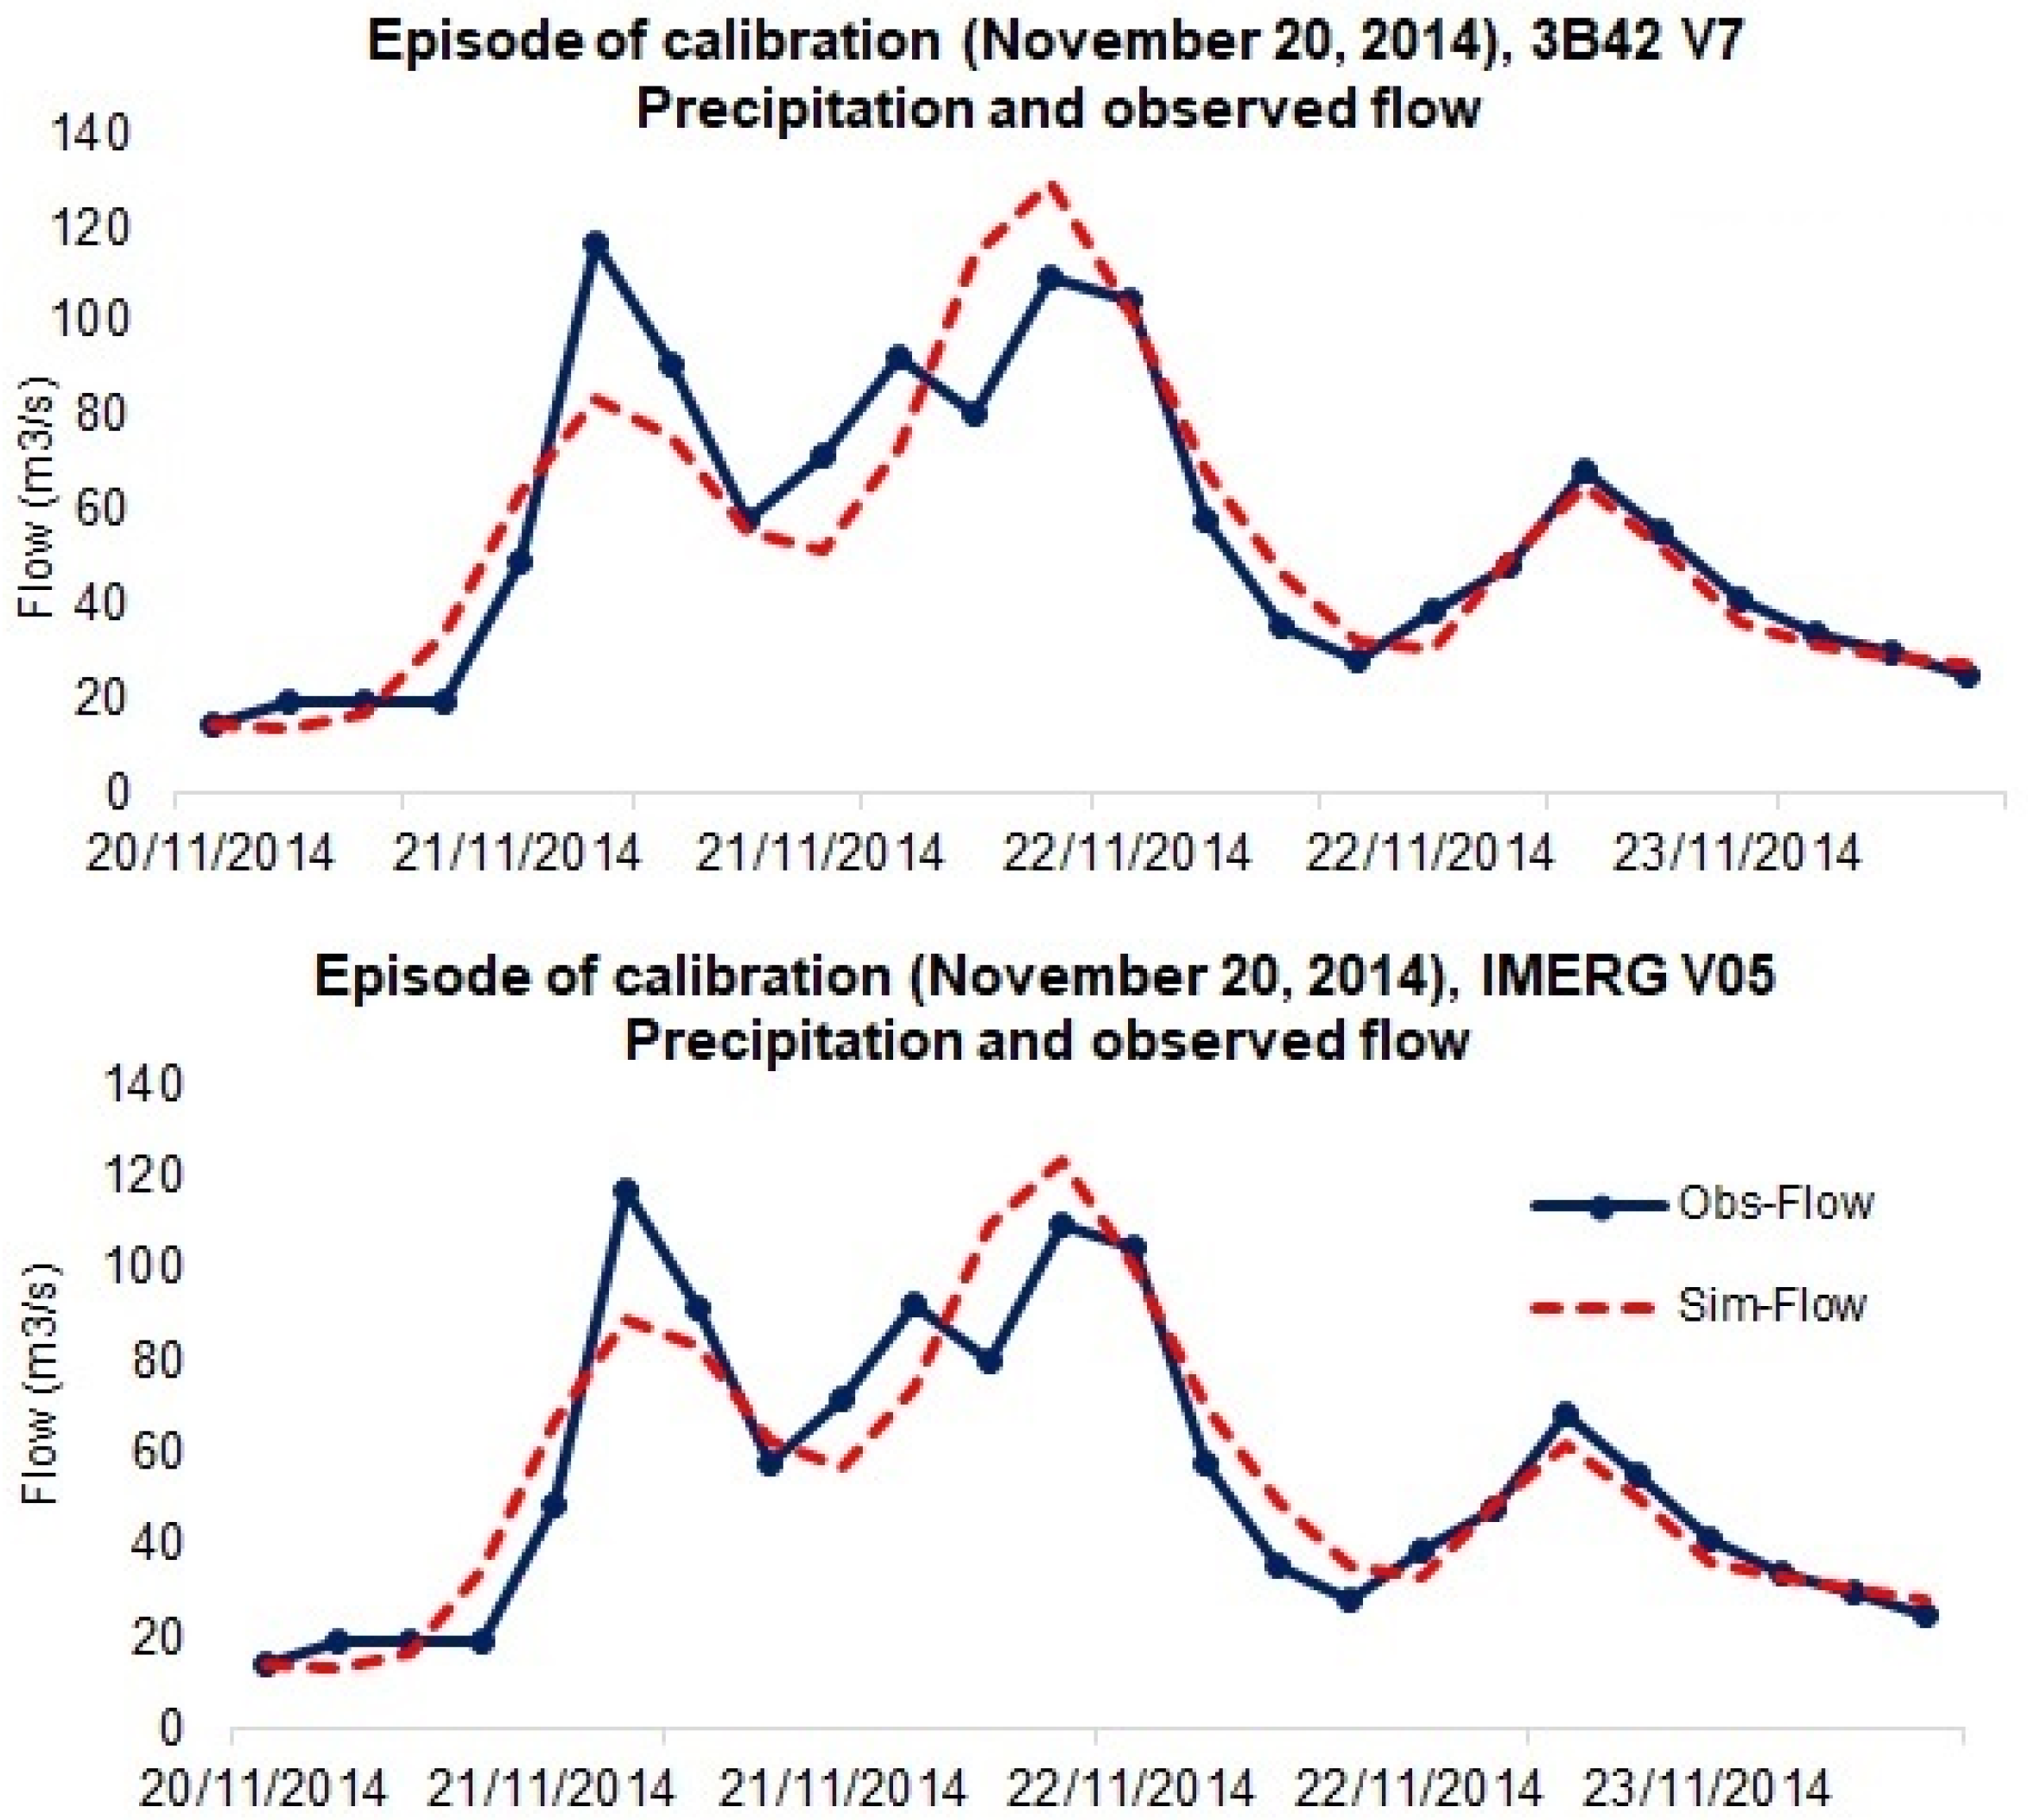
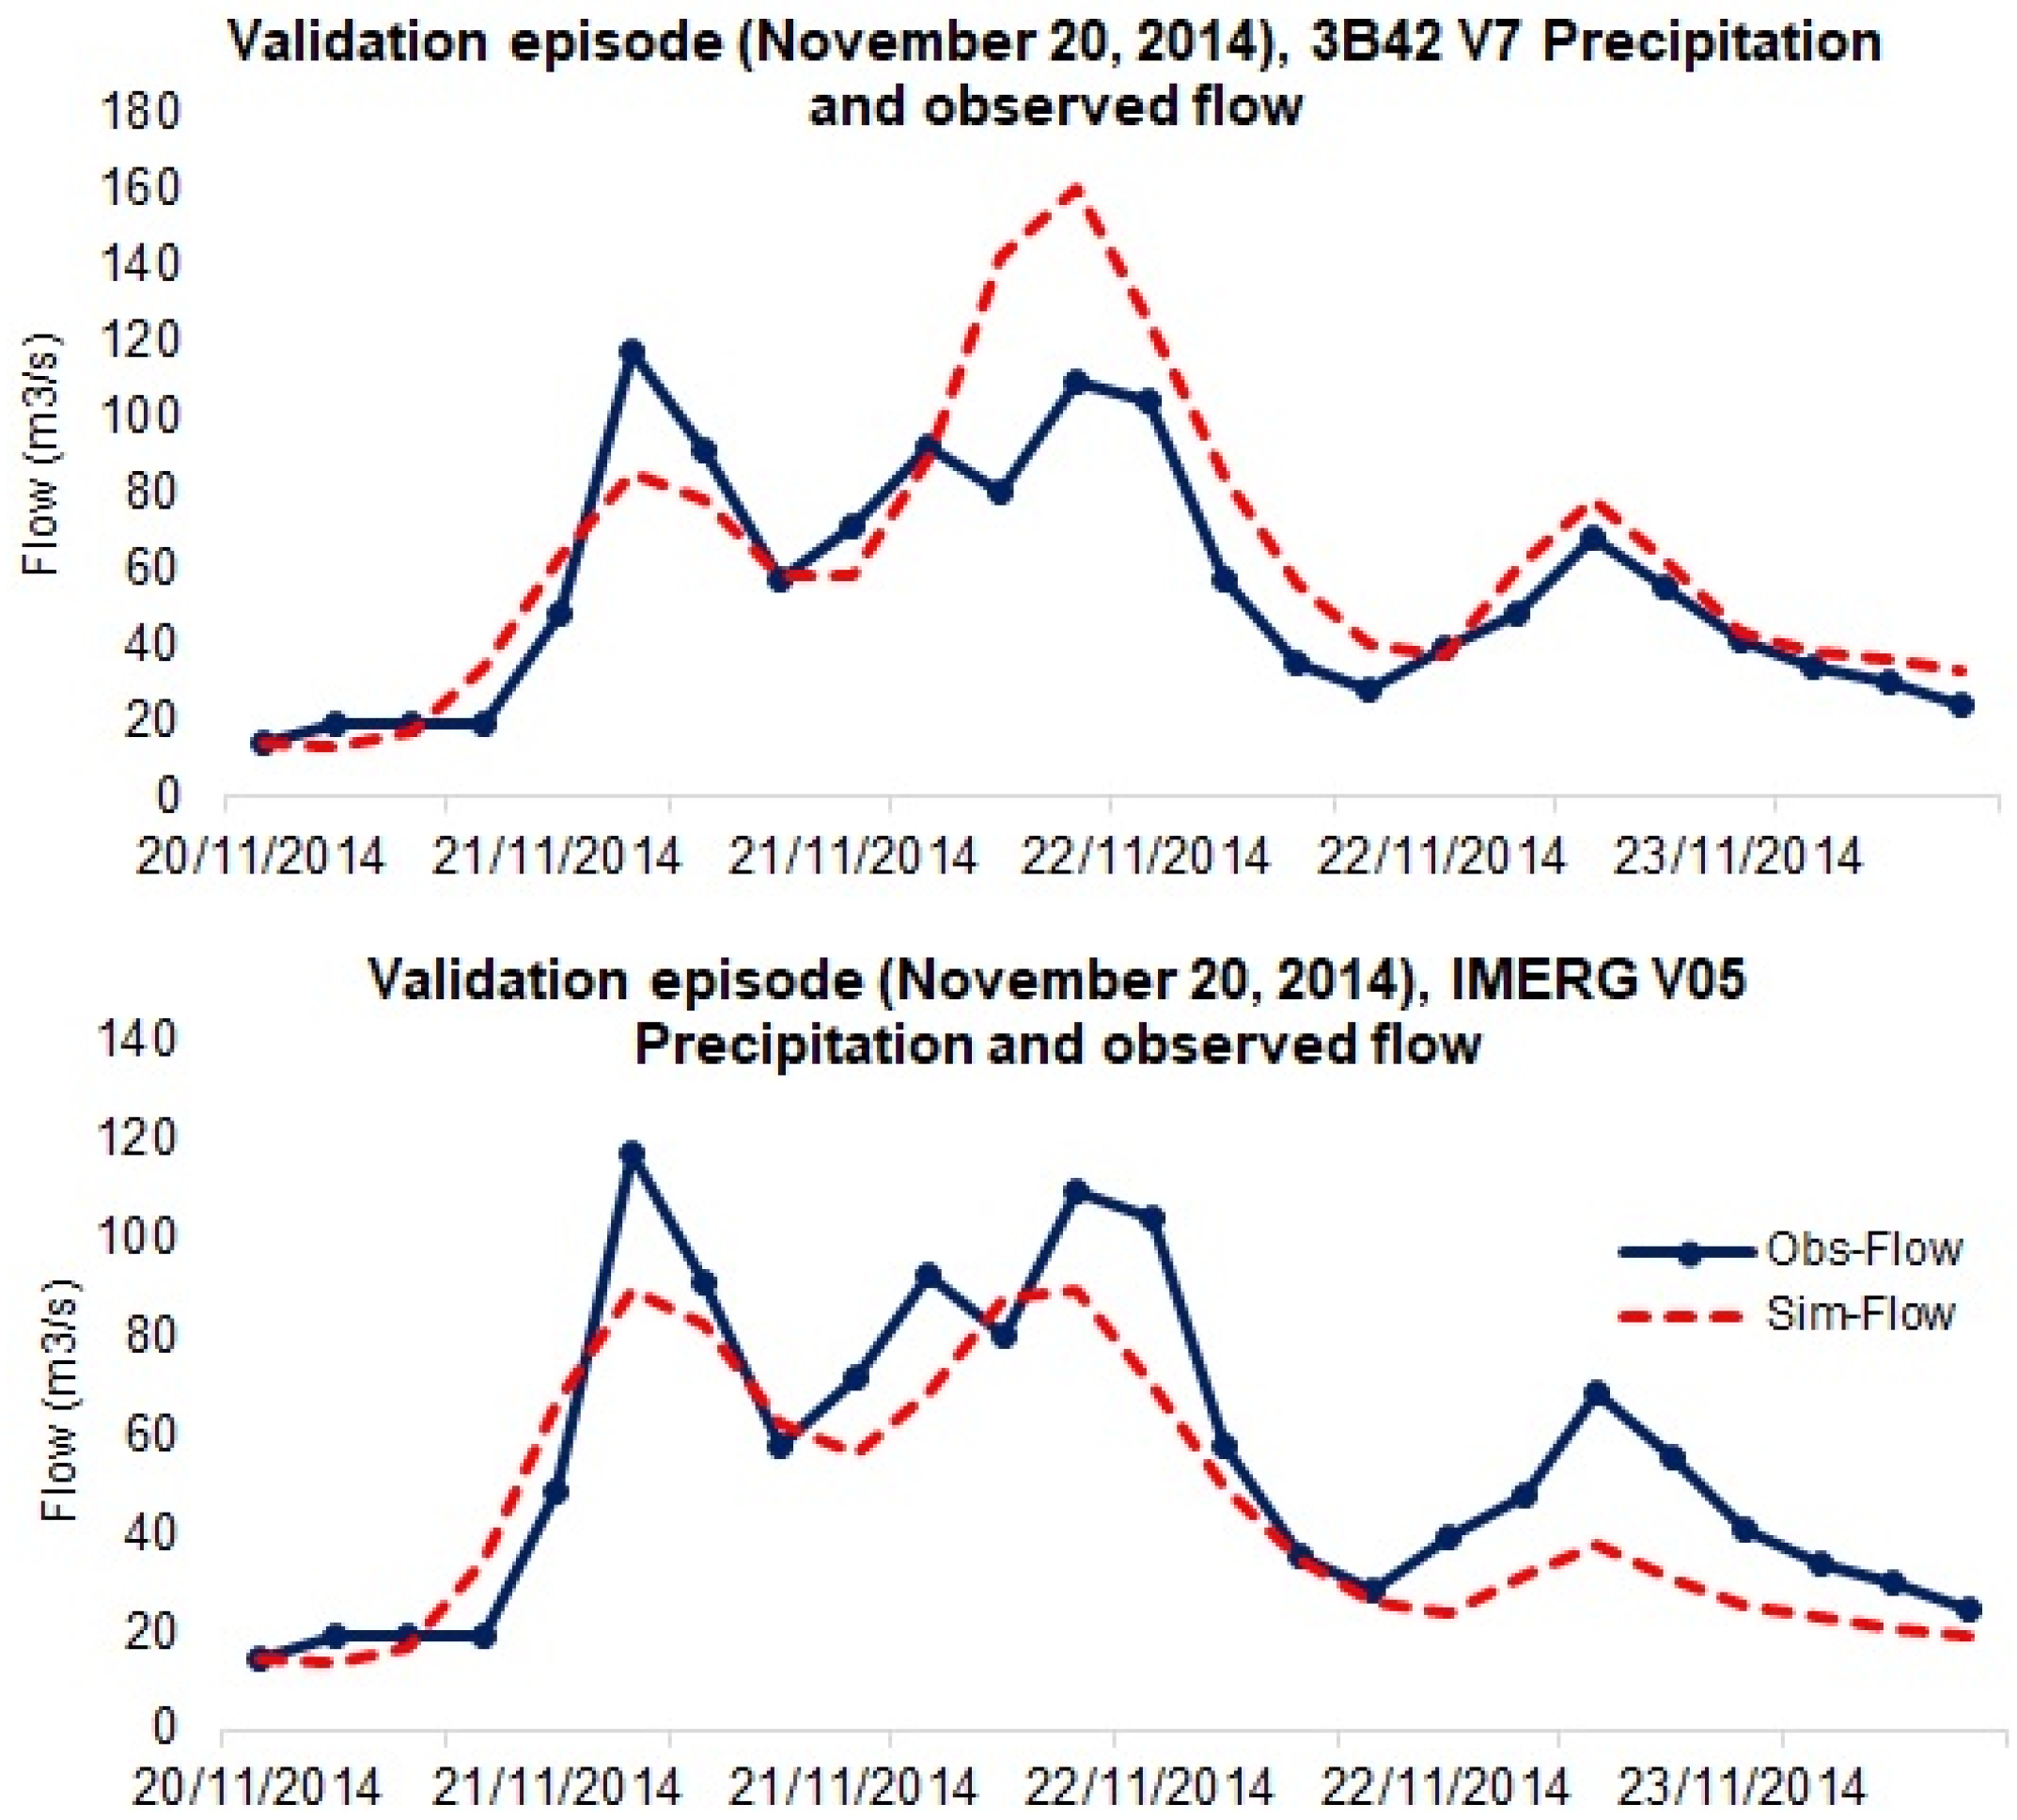
3.3.1. Event of 20 November 2014

This event represents a torrential flood; since the flood was generated by extreme precipitation spread over more than 15 days, it is the most intense event in the data set. The maximum flow reached was (123, 75 m3/s). However, the soils were saturated, resulting in high permeability and an increase in the runoff coefficient of the watershed.
The results of the calibration of the 3B42V7 and IMERG V05 rainfall data with the observed flow illustrated in the hydrographs of the Figure 2, show that the simulated flow curves were globally well reproduced for both products at the flood rise and the recession part, although the peaks flow were not reached by both products.
Based on the results the 3B42V7 calibration is satisfactory, as this product has a good capacity to record the high precipitation intensity during rainy episodes.
Furthermore, the IMERG V05 product does not have the ability to capture heavy precipitation; this is well demonstrated in the calibration results. The evaluation criteria are suitable RMSE = 0.5 for both products and a Nash of 79.20% and 70.10% for 3B42V7 and IMERG V05, respectively.
The validation hydrographs results in (Figure 3) were well reproduced for both products. The rise and the recession curves were well reproduced for 3B42V7, noting a slight underestimation of precipitation, but in general, this product well estimates heavy precipitation events. The IMERG V05 was not able to reproduce the validation hydrograph of this event. The rising curve was underestimated in the first pick as it represents the heavier precipitation during this event, and the other two picks were underestimated, the peak flow was not reached. This is because of the inability of this product to properly estimate the heavy precipitation.
The evaluation criteria are acceptable with an RMSE of 0.7 for both products, and a Nash of 52.20% and 66.50%, respectively.

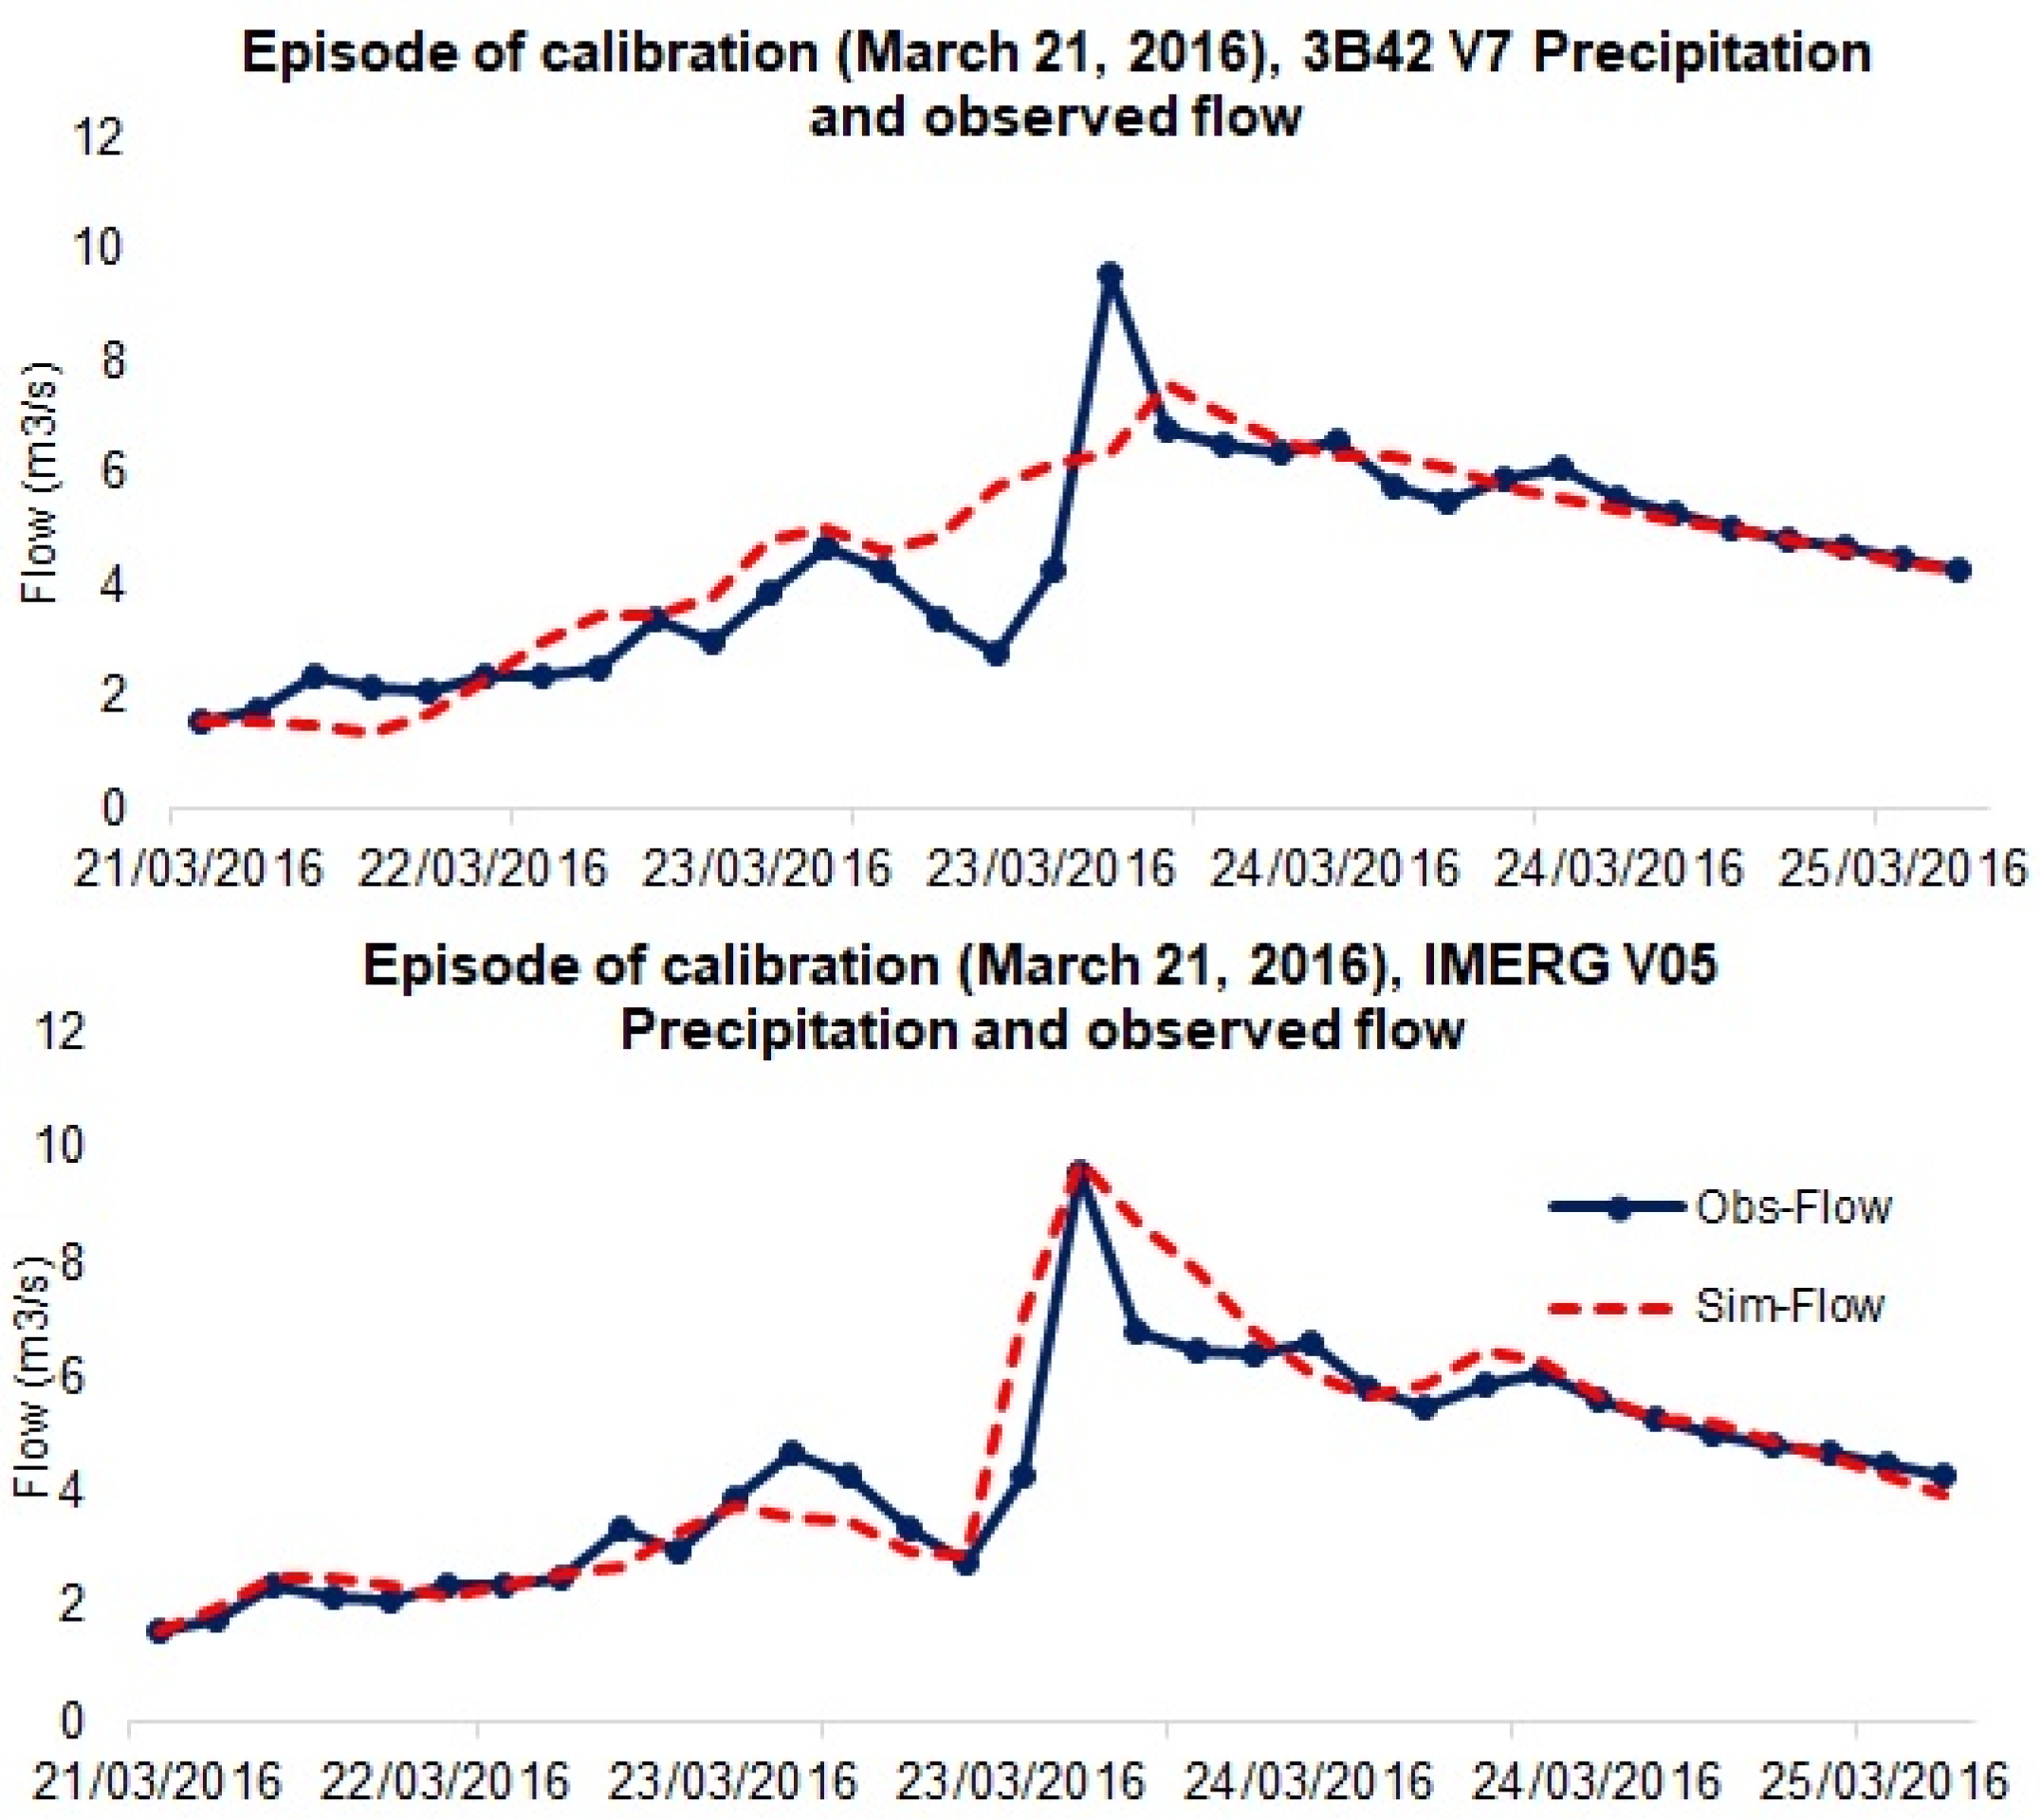
3.3.2. Event of 21 March 2016

This event represents the typical characteristics of a freshet caused by the melting of snowfall upstream of the Zat watershed. With the progressive increase of temperatures, the snow cover at the summit of the Atlas Mountains starts melting and feeding the streams of the mountainous basins including the study basin. This usually causes significant flooding during the occurrence of moderate rainfall episodes.
The hydrograph of Figure 4 is well calibrated, the simulated flow curves were differently reproduced for both products. Concerning 3B42V7 SPPs, the rise and the recession curves were well reproduced, but the peak flow was underestimated due to the fact that this satellite product is not able to reproduce the low precipitation. However, IMERG V05 hydrograph is well reproduced at the rise, the recession, and the peak flow.
The evaluation criteria are good with an RMSE of 0.3 and 0.3 and a Nash of 66.5% and 83.7% for 3B42V7 and IMERGV5 products.
On the other hand, the hydrographs of validation are also differently reproduced for the two SPPs (Figure 5).
The 3B42V7 underestimates the precipitation; as noticed this episode is generated by the effect of snowmelt, with the occurrence of light precipitation, and for this reason, the following product estimates poorly the slight precipitation as previously indicated, and consequently underestimates the value of precipitation during the event.
However, IMERGV5 has shown good performance in detecting small precipitation events; on the validation hydrograph the simulated curve is well reproduced at all levels. This is due to the fact that this product is capable of estimating small precipitation events with short time steps. This resolution has been well confirmed once more at this event.
The evaluation criteria are good with an RMSE of 0.7 and 0.6 for the product 3B42 V7 and IMERG V05, and a Nash of 56.20% and 74.20. 9%, respectively.

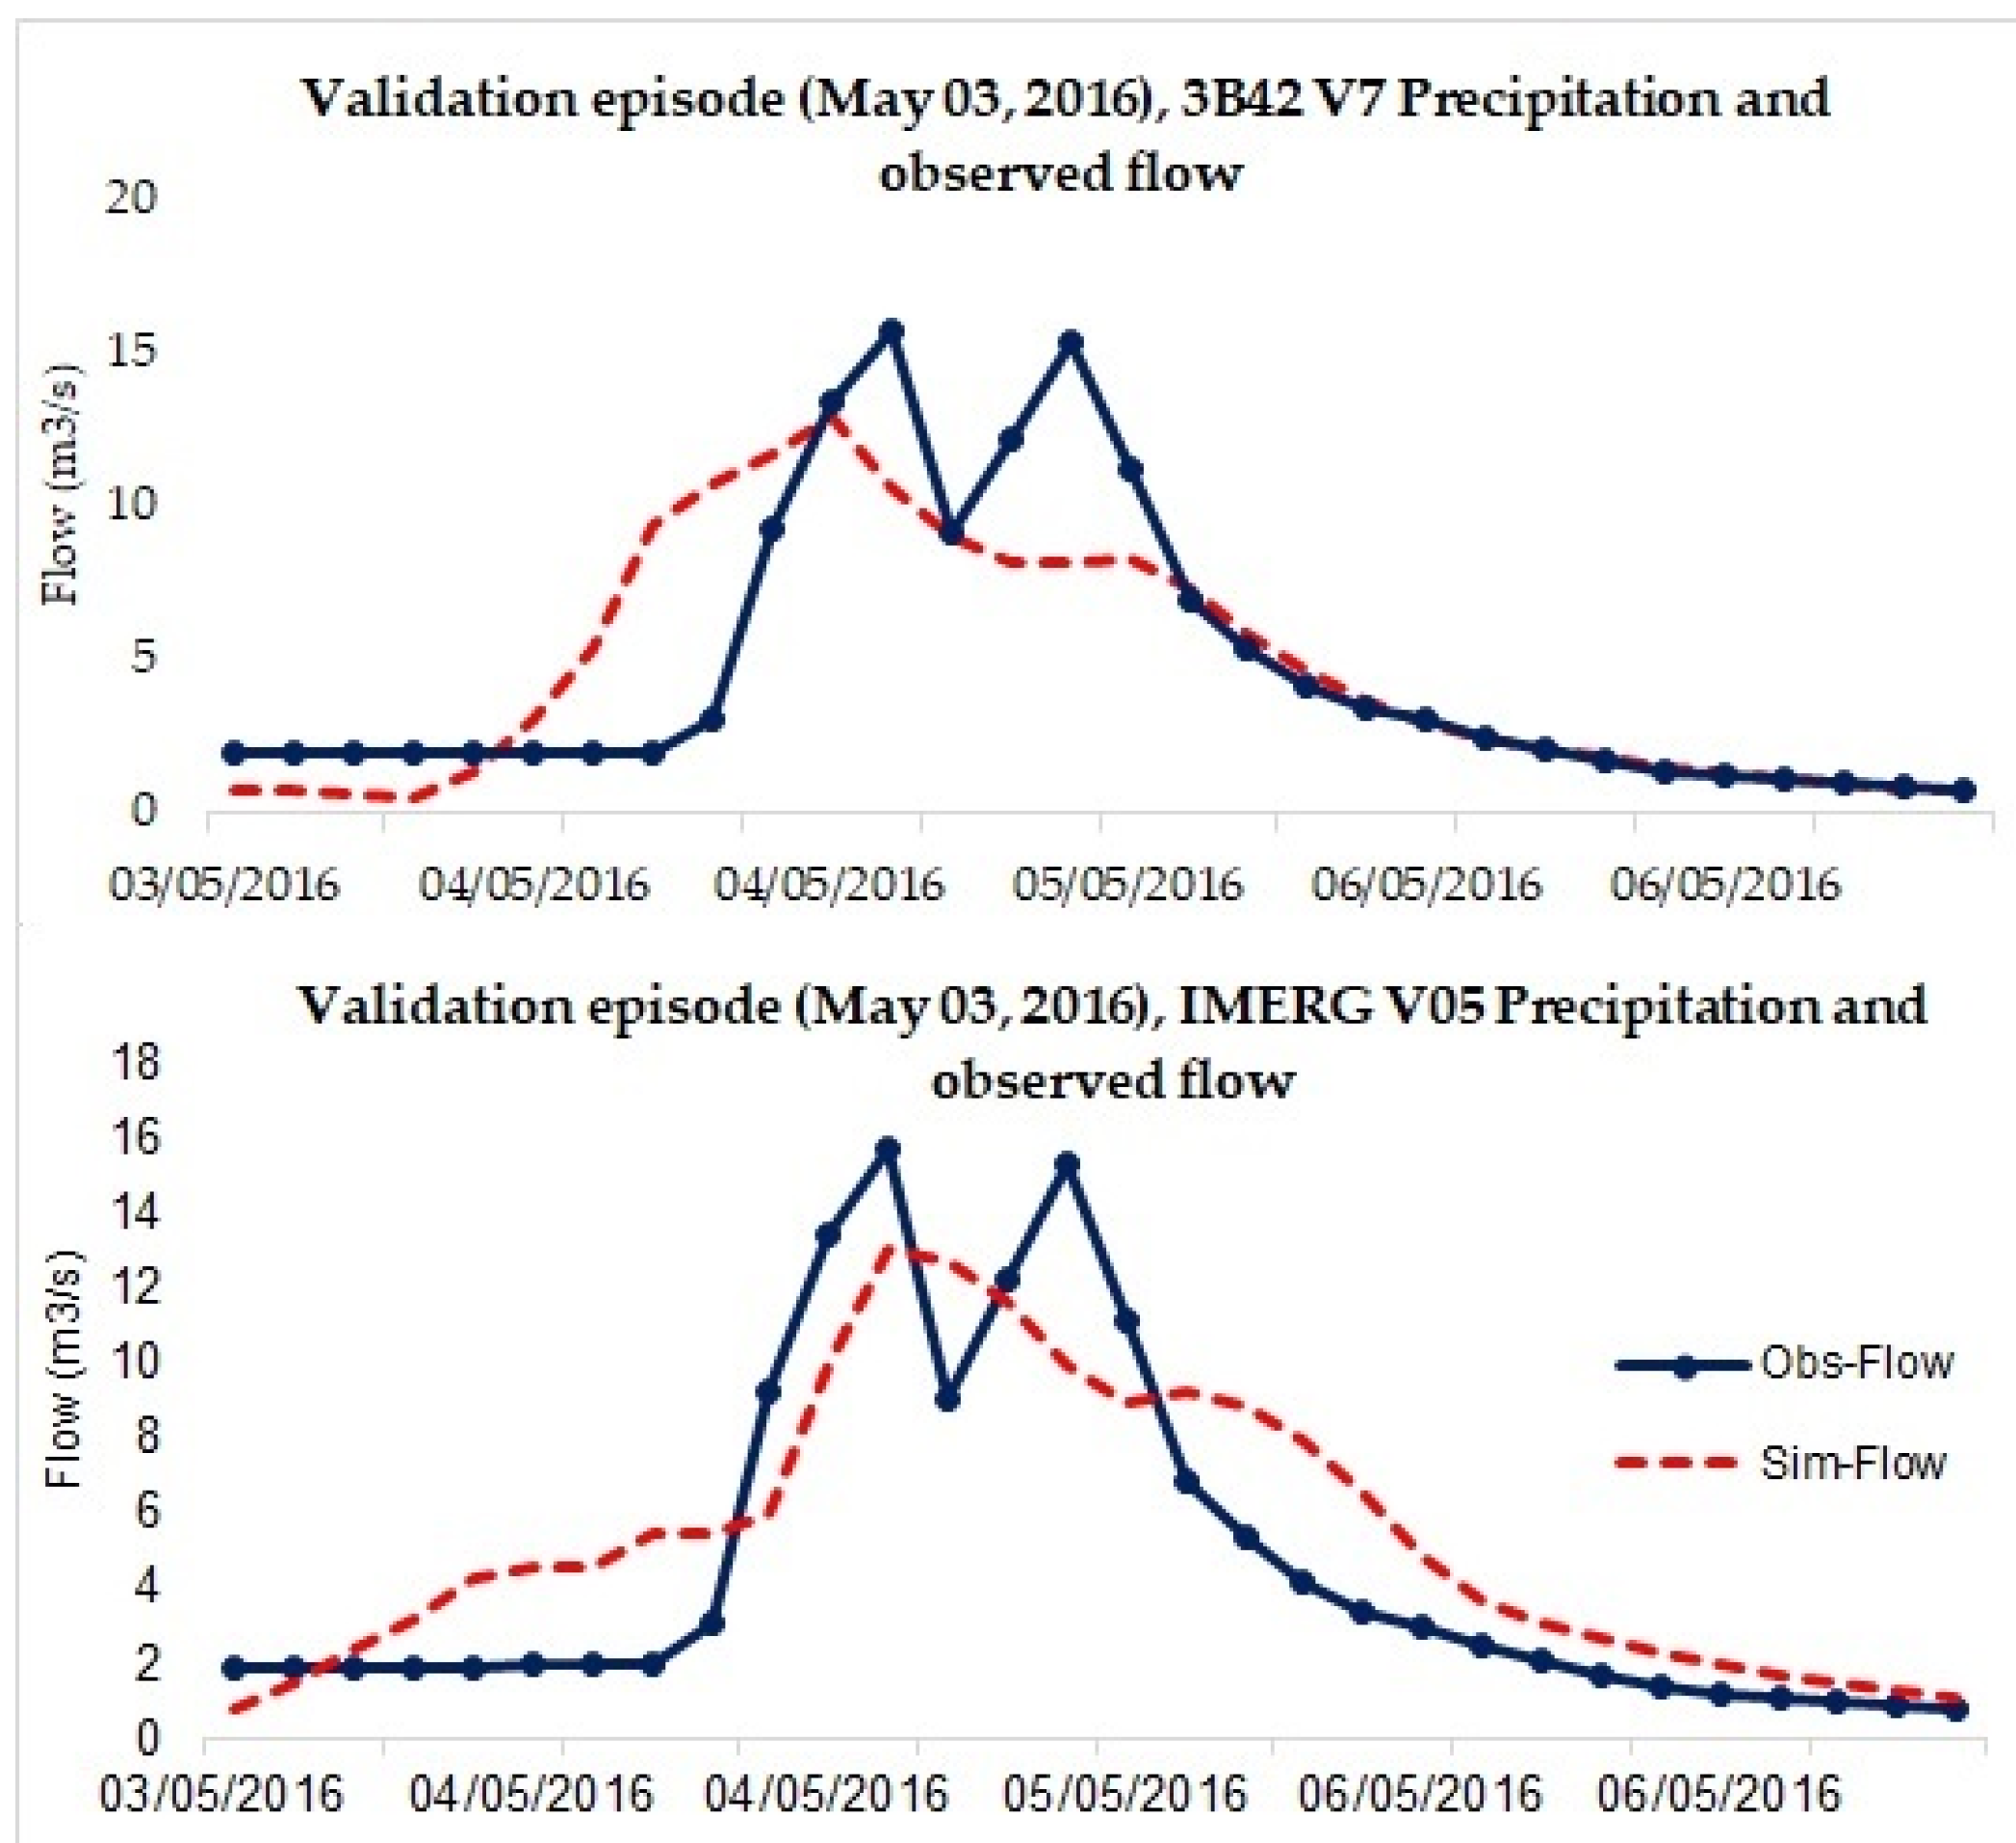
3.3.3. Event of 3 May 2016

The hydrological model results showed a reasonable fit between the shape of the simulated and observed hydrographs. Figure 6 shows a chronological comparison of simulated and observed streamflow at the watershed outlet for a calibration period of 3–5 May 2016 (we limit ourselves to modeling short-duration floods for which the evapotranspiration process is negligible). Although the measured peak flow values did not exactly match the simulated peak flow values for both products, there was a slight improvement for IMERG V05. The model tended to underestimate the streamflow, since the river flow was already high due to snowmelt, and this was added to the runoff caused by the flood, which the model did not take into account.
On the other hand, the volumes were well respected and the rise and fall curves were generally well reproduced with a slight improvement on the IMERG V05 side. The results of the evaluation criteria for both products 3B42V7 and IMERG V05 are satisfactory with NSE ranging from 76.80% to 79.30%, respectively.
After following the validation procedures previously mentioned in Section 3.3.4, the comparison of the observed and simulated hydrographs showed that the model underestimates the point flows, due to the non-conclusion of the snowmelt process. However, Figure 7 shows a good trend in the reproduction of the observed and simulated discharge curves, with an NSE of 61.30% for 3B42V7, and 72.90% for IMERG V05, which are good results.

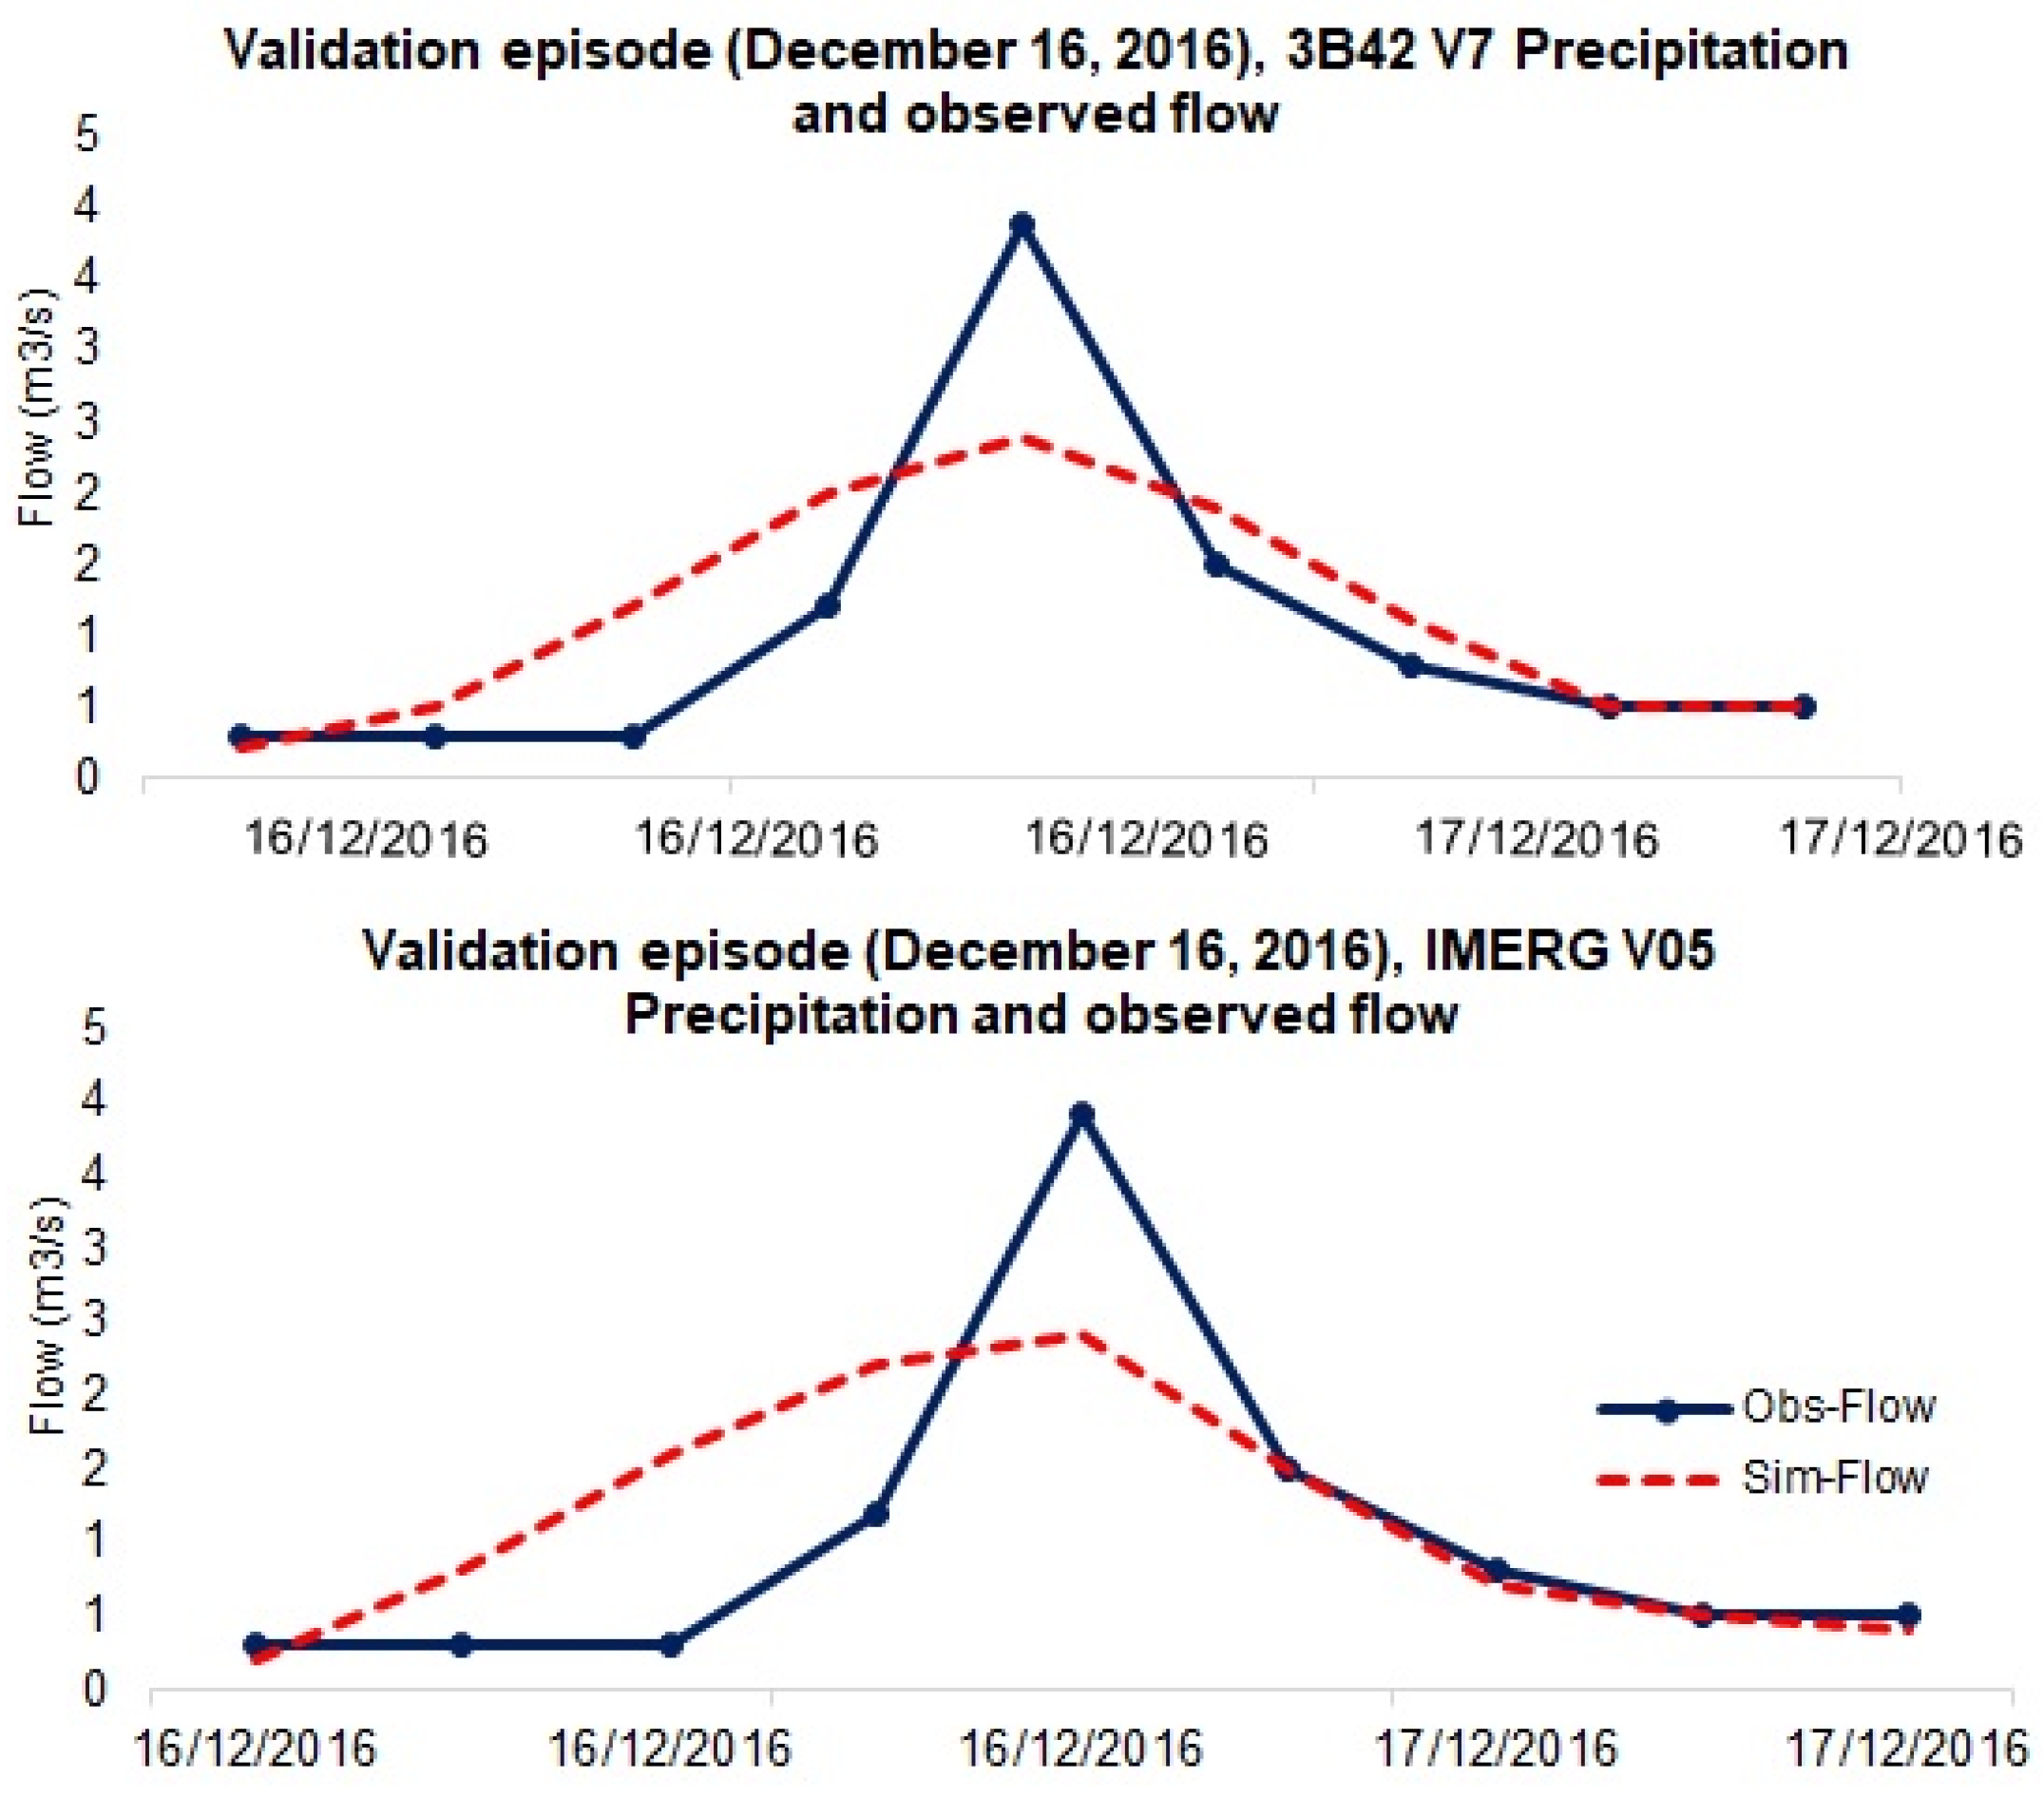
3.3.4. Event of 16 December 2016

The event represents a winter rain-storm characterized by liquid precipitation downstream and snow upstream of the watershed. This type of rain-storm is very frequent during the winter, especially in the high mountains of the Atlas.
The hydrographs of calibration in Figure 8 represent a simulated flow curve quite illustrative; the rising curve and the recession were well reproduced for both products 3B42V7 and IMERG V05, contrary to the peak flow which has not been reached for the 3B42V7. However, the evaluation criteria are acceptable and represent an NSE of 63.50% and 61.90%, respectively.
On the other hand, Figure 9 illustrates the validation graphs of each product, although the curves of the simulated flows are not well reproduced for both products, which underestimated winter precipitations since they are a mixture of rainfall and snowfall. The evaluation criteria are acceptable with an NSE of 63.20% for 3B42V7, and 57.20% for IMERG V05.
In this paper, an efficient method has been developed for the first time in a country with a Mediterranean climate, on the mountainous watersheds of the Moroccan High Atlas with low density and irregularity of precipitation and flow measurement stations. This is a good method to apply to solve the problem of deficiency of observed data in these regions.

4. Conclusions

SPPs are important precipitation data alternatives, particularly in high mountain watersheds, where measurement gauge stations are poorly distributed or absent. These products will mainly help in the simulation of river flows, flood forecasting, and water resources management in arid to semi-arid regions. This study conducted a complete performance evaluation of two satellite products—the TRMM (3B42 V7) and the GPM—(IMERG V05) using observations (sub-hourly, daily, monthly, and yearly) collected from the only gauge station of the Zat basin, named Taferiat station, and located at the downstream of the watershed. The watershed is characterized by a Mediterranean climate and mountainous topography, and the study was analyzed over 3 years, from 1 September 2014 to 31 August 2017. To evaluate the accuracy of 3B42 V7 and IMERG V05 satellite precipitation products, several quantitative, categorical, and statistical measurements were used: (R, RMSE, Bias) were used to quantitatively analyzed the accuracy of satellite precipitation products, and (POD, CSI, FAR, and FBI) were used to evaluate the precipitation detection capability of satellite precipitation products, and to simulate satisfactorily the flooding events in hydrological model.
The conclusions resulting from this study are summarized as follows:
(1)
3B42 V7 and IMERG V05 products performed well in estimating sub-hourly, daily, monthly, and annual precipitation compared to observed data from the Taferiat station. 3B42V7 underestimated low precipitation events but well estimated heavy precipitation with small time step. However, the monthly and annual precipitation were well captured. While IMERGV05 overestimates heavy precipitation episodes and has a good ability to detect low precipitation in small time step, the monthly and the yearly precipitation are well estimated by this product.
(2)
Compared to the ground applications, 3B42V7 and IMERG V5 showed acceptable correlation results at the sub-hourly and daily time scales. However, IMERG V05 performed slightly better than 3B42 V7 for the detection of sub-hourly and daily precipitation at the measuring station. The categorical statistical measures values showed high values of POD and CSI, as well as reasonably high values of FAR and FBI, noting that the results of the categorical measures are good. In general, IMERG V05 is better at detecting precipitation events, in particular at capturing precipitation traces and solid precipitation at a 3-hourly and daily scale, while 3B42 V7 can estimate precipitation on a large time scale.
(3)
The hydrological calibration and validation were performed according to two different scenarios; scenario 1 aims to simulate and calibrate events using rainfall from both satellite products with observed flows, while scenario 2 of validation uses the leave-one-out resampling approach; for the n flood events, in order to find the relationship between the root-soil moisture measured and the most sensitive model parameters (CN calibration, and time of concentration “TC”). The obtained results are satisfactory for all calibration and validation parts, the NSE coefficients ranging between 74.75% and 63.31%, respectively. The main point to remember is that the 3B42V7 product does not have a good ability to capture small rainfall events in a short time step, in fact, it underestimates the rainfall. On the other hand, the IMERG V05 product has an excellent capacity to record small rainfall events, which is well demonstrated in the validation graphs. Therefore, it is recommended to use this product for flood modeling and forecasting. The proposed method is an interesting approach to apply for solving the problem of insufficient observed data in the Mediterranean regions. The present manuscript provides a valuable reference for precipitation monitoring and forecasting in mountainous regions characterized by a Mediterranean climate, as well as in basins with few or poorly distributed rainfall stations.
Therefore, the results of this study are of great importance for analyzing the prospect’s application of SPPs at different time scales. This paper is one of the first papers developing a comparative approach of satellite rainfall products to observe gauge data in nnthe Moroccan High Atlas; they could indeed serve researchers as a reference work both in Morocco and neighbouring countries with similar climates and areas with irregular or sparse rain gauge networks.

Author Contributions

Conceptualization, M.B. and S.K.; methodology, M.B.; software, M.B.; validation, M.B., N.-E.L. and S.K.; resources, M.B.; data curation, M.B. and S.K.; writing—original draft preparation, M.B.; writing—review and editing, M.B., S.K. and Á.d.l.H.-P.; visualization, N.-E.L.; supervision, N.-E.L. and S.K; project administration, N.-E.L.; funding acquisition, M.B. All authors have read and agreed to the published version of the manuscript.

Funding

This research was supported by the projects: ERANETMED3-062 CHAAMS Global Change: Assessment and Adaptation to Mediterranean Region Water Scarcity and PRIMA-S2-ALTOS-2018 Managing water resources within Mediterranean agrosystems by accounting for spatial structures and connectivities.

Acknowledgments

The authors would like to thank Adam Milewski (Director of Water Resources & Remote Sensing Laboratory (WRRS), Department of Geology, University of Georgia, United States), who thoughtfully revised this manuscript.

Conflicts of Interest

The authors declare no conflict of interest.

References

  1. Yuan, F.; Zhang, L.; Win, K.W.W.; Ren, L.; Zhao, C.; Zhu, Y.; Jiang, S.; Liu, Y. Assessment of GPM and TRMM Multi-Satellite Precipitation Products in Streamflow Simulations in a Data-Sparse Mountainous Watershed in Myanmar. Remote Sens. 2017, 9, 302. [Google Scholar] [CrossRef]
  2. Bollasina, M.A.; Ming, Y.; Ramaswamy, V. Anthropogenic Aerosols and the Weakening of the South Asian Summer Monsoon. Science 2011, 334, 502–505. [Google Scholar] [CrossRef] [PubMed]
  3. Zhu, G.; He, Y.; Pu, T.; Wang, X.; Jia, W.; Li, Z.; Xin, H. Spatial distribution and temporal trends in potential evapotranspiration over Hengduan Mountains region from 1960 to 2009. J. Geogr. Sci. 2012, 22, 71–85. [Google Scholar] [CrossRef]
  4. Xia, T.; Wang, Z.-J.; Zheng, H. Topography and Data Mining Based Methods for Improving Satellite Precipitation in Mountainous Areas of China. Atmosphere 2015, 6, 983–1005. [Google Scholar] [CrossRef]
  5. Jiang, S.; Liu, S.; Ren, L.; Yong, B.; Zhang, L.; Wang, M.; Lu, Y.; He, Y. Hydrologic Evaluation of Six High Resolution Satellite Precipitation Products in Capturing Extreme Precipitation and Streamflow over a Medium-Sized Basin in China. Water 2017, 10, 25. [Google Scholar] [CrossRef]
  6. Borga, M.; Anagnostou, E.; Blöschl, G.; Creutin, J.-D. Flash floods: Observations and analysis of hydro-meteorological controls. J. Hydrol. 2010, 394, 1–3. [Google Scholar] [CrossRef]
  7. Germann, U.; Galli, G.; Boscacci, M.; Bolliger, M. Radar precipitation measurement in a mountainous region. Q. J. R. Meteorol. Soc. 2006, 132, 1669–1692. [Google Scholar] [CrossRef]
  8. Hrachowitz, M.; Weiler, M. Uncertainty of Precipitation Estimates Caused by Sparse Gauging Networks in a Small, Mountainous Watershed. J. Hydrol. Eng. 2011, 16, 460–471. [Google Scholar] [CrossRef]
  9. Mei, Y.; Anagnostou, E.N.; Nikolopoulos, E.I.; Borga, M. Error Analysis of Satellite Precipitation Products in Mountainous Basins. J. Hydrometeorol. 2014, 15, 1778–1793. [Google Scholar] [CrossRef]
  10. Yi, L.; Zhang, W.; Wang, K. Evaluation of Heavy Precipitation Simulated by the WRF Model Using 4D-Var Data Assimilation with TRMM 3B42 and GPM IMERG over the Huaihe River Basin, China. Remote Sens. 2018, 10, 646. [Google Scholar] [CrossRef]
  11. Muzirafuti, A.; Cascio, M.; Lanza, S.; Randazzo, G. UAV Photogrammetry-based Mapping of the Pocket Beaches of Isola Bella Bay, Taormina (Eastern Sicily). In Proceedings of the 2021 International Workshop on Metrology for the Sea; Learning to Measure Sea Health Parameters (MetroSea), Reggio Calabria, Italy, 4–6 October 2021; pp. 418–422. [Google Scholar] [CrossRef]
  12. Chen, C.; Chen, Q.; Duan, Z.; Zhang, J.; Mo, K.; Li, Z.; Tang, G. Multiscale Comparative Evaluation of the GPM IMERG v5 and TRMM 3B42 v7 Precipitation Products from 2015 to 2017 over a Climate Transition Area of China. Remote Sens. 2018, 10, 944. [Google Scholar] [CrossRef]
  13. Muzirafuti, A.; Boualoul, M.; Barreca, G.; Allaoui, A.; Bouikbane, H.; Lanza, S.; Crupi, A.; Randazzo, G. Fusion of Remote Sensing and Applied Geophysics for Sinkholes Identification in Tabular Middle Atlas of Morocco (the Causse of El Hajeb): Impact on the Protection of Water Resource. Resources 2020, 9, 51. [Google Scholar] [CrossRef]
  14. Sorooshian, S.; Hsu, K.-L.; Gao, X.; Gupta, H.V.; Imam, B.; Braithwaite, D. Evaluation of PERSIANN System Satellite–Based Estimates of Tropical Rainfall. Bull. Am. Meteorol. Soc. 2000, 81, 2035–2046. [Google Scholar] [CrossRef]
  15. Joyce, R.J.; Janowiak, J.E.; Arkin, P.A.; Xie, P. CMORPH: A Method that Produces Global Precipitation Estimates from Passive Microwave and Infrared Data at High Spatial and Temporal Resolution. J. Hydrometeorol. 2004, 5, 487–503. [Google Scholar] [CrossRef]
  16. Guo, J.; Zhai, P.; Wu, L.; Cribb, M.; Li, Z.; Ma, Z.; Wang, F.; Chu, D.; Wang, P.; Zhang, J. Diurnal variation and the influential factors of precipitation from surface and satellite measurements in Tibet. Int. J. Clim. 2014, 34, 2940–2956. [Google Scholar] [CrossRef]
  17. Funk, C.; Peterson, P.; Landsfeld, M.; Pedreros, D.; Verdin, J.; Shukla, S.; Husak, G.; Rowland, J.; Harrison, L.; Hoell, A.; et al. The climate hazards infrared precipitation with stations—A new environmental record for monitoring extremes. Sci. Data 2015, 2, 150066. [Google Scholar] [CrossRef]
  18. Huffman, G.J.; Bolvin, D.T.; Nelkin, E.J.; Wolff, D.B.; Adler, R.F.; Gu, G.; Hong, Y.; Bowman, K.P.; Stocker, E.F. The TRMM Multisatellite Precipitation Analysis (TMPA): Quasi-Global, Multiyear, Combined-Sensor Precipitation Estimates at Fine Scales. J. Hydrometeorol. 2007, 8, 38–55. [Google Scholar] [CrossRef]
  19. Hou, A.Y.; Kakar, R.K.; Neeck, S.; Azarbarzin, A.A.; Kummerow, C.D.; Kojima, M.; Oki, R.; Nakamura, K.; Iguchi, T. The global precipitation measurement mission. Bull. Am. Meteorol. Soc. 2014, 95, 701–722. [Google Scholar] [CrossRef]
  20. Tong, K.; Su, F.; Yang, D.; Hao, Z. Evaluation of satellite precipitation retrievals and their potential utilities in hydrologic modeling over the Tibetan Plateau. J. Hydrol. 2014, 519, 423–437. [Google Scholar] [CrossRef]
  21. Ringard, J.; Becker, M.; Seyler, F.; Linguet, L. Temporal and Spatial Assessment of Four Satellite Rainfall Estimates over French Guiana and North Brazil. Remote Sens. 2015, 7, 16441–16459. [Google Scholar] [CrossRef]
  22. Chandrasekar, V.; Le, M. Evaluation of profile classification module of GPM-DPR algorithm after launch. In Proceedings of the 2015 IEEE International Geoscience and Remote Sensing Symposium (IGARSS), Milan, Italy, 26–31 July 2015; pp. 5174–5177. [Google Scholar] [CrossRef]
  23. Liu, Z.; Ostrenga, D.; Vollmer, B.; Deshong, B.; Macritchie, K.; Greene, M.; Kempler, S. Global Precipitation Measurement Mission Products and Services at the NASA GES DISC. Bull. Am. Meteorol. Soc. 2017, 98, 437–444. [Google Scholar] [CrossRef] [PubMed]
  24. Gebregiorgis, A.S.; Kirstetter, P.; Hong, Y.E.; Gourley, J.J.; Huffman, G.J.; Petersen, W.A.; Xue, X.; Schwaller, M.R. To What Extent is the Day 1 GPM IMERG Satellite Precipitation Estimate Improved as Compared to TRMM TMPA-RT? J. Geophys. Res. Atmos. 2018, 123, 1694–1707. [Google Scholar] [CrossRef]
  25. Rozante, J.R.; Vila, D.A.; Chiquetto, J.B.; Fernandes, A.D.A.; Alvim, D.S. Evaluation of TRMM/GPM Blended Daily Products over Brazil. Remote Sens. 2018, 10, 882. [Google Scholar] [CrossRef]
  26. Kim, K.; Park, J.; Baik, J.; Choi, M. Evaluation of topographical and seasonal feature using GPM IMERG and TRMM 3B42 over Far-East Asia. Atmos. Res. 2017, 187, 95–105. [Google Scholar] [CrossRef]
  27. Zhong, R.; Chen, X.; Lai, C.; Wang, Z.; Lian, Y.; Yu, H.; Wu, X. Drought monitoring utility of satellite-based precipitation products across mainland China. J. Hydrol. 2019, 568, 343–359. [Google Scholar] [CrossRef]
  28. Wu, L.; Xu, Y.; Wang, S. Comparison of TMPA-3B42RT Legacy Product and the Equivalent IMERG Products over Mainland China. Remote Sens. 2018, 10, 1778. [Google Scholar] [CrossRef]
  29. Tan, M.L.; Santo, H. Comparison of GPM IMERG, TMPA 3B42 and PERSIANN-CDR satellite precipitation products over Malaysia. Atmos. Res. 2018, 202, 63–76. [Google Scholar] [CrossRef]
  30. Hussain, Y.; Satgé, F.; Hussain, M.B.; Martinez-Carvajal, H.; Bonnet, M.-P.; Cárdenas-Soto, M.; Roig, H.L.; Akhter, G. Performance of CMORPH, TMPA, and PERSIANN rainfall datasets over plain, mountainous, and glacial regions of Pakistan. Theor. Appl. Climatol. 2018, 131, 1119–1132. [Google Scholar] [CrossRef]
  31. Palomino-Ángel, S.; Anaya, J.A.; Botero, B.A. Evaluation of 3B42V7 and IMERG daily-precipitation products for a very high-precipitation region in northwestern South America. Atmos. Res. 2019, 217, 37–48. [Google Scholar] [CrossRef]
  32. Retalis, A.; Katsanos, D.; Tymvios, F.; Michaelides, S. Validation of the First Years of GPM Operation over Cyprus. Remote Sens. 2018, 10, 1520. [Google Scholar] [CrossRef]
  33. Saber, M.; Hamaguchi, T.; Kojiri, T.; Tanaka, K.; Sumi, T. A physically based distributed hydrological model of wadi system to simulate flash floods in arid regions. Arab. J. Geosci. 2015, 8, 143–160. [Google Scholar] [CrossRef]
  34. Milewski, A.; Elkadiri, R.; Durham, M. Assessment and Comparison of TMPA Satellite Precipitation Products in Varying Climatic and Topographic Regimes in Morocco. Remote Sens. 2015, 7, 5697–5717. [Google Scholar] [CrossRef]
  35. Milewski, A.; Seyoum, W.M.; Elkadiri, R.; Durham, M. Multi-Scale Hydrologic Sensitivity to Climatic and Anthropogenic Changes in Northern Morocco. Geosciences 2019, 10, 13. [Google Scholar] [CrossRef]
  36. Benkirane, M.; Laftouhi, N.-E.; El Mansouri, B.; Salik, I.; Snineh, M.; El Ghazali, F.E.; Kamal, S.; Zamrane, Z. An approach for flood assessment by numerical modeling of extreme hydrological events in the Zat watershed (High Atlas, Morocco). Urban Water J. 2020, 17, 381–389. [Google Scholar] [CrossRef]
  37. Chen, H.; Chandrasekar, V.; Tan, H.; Cifelli, R. Rainfall Estimation from Ground Radar and TRMM Precipitation Radar Using Hybrid Deep Neural Networks. Geophys. Res. Lett. 2019, 46, 10669–10678. [Google Scholar] [CrossRef]
  38. Zhang, Z.; Tian, J.; Huang, Y.; Chen, X.; Chen, S.; Duan, Z. Hydrologic Evaluation of TRMM and GPM IMERG Satellite-Based Precipitation in a Humid Basin of China. Remote Sens. 2019, 11, 431. [Google Scholar] [CrossRef]
  39. Duan, Z.; Liu, J.; Tuo, Y.; Chiogna, G.; Disse, M. Evaluation of eight high spatial resolution gridded precipitation products in Adige Basin (Italy) at multiple temporal and spatial scales. Sci. Total Environ. 2016, 573, 1536–1553. [Google Scholar] [CrossRef]
  40. Wu, Y.; Zhang, Z.; Huang, Y.; Jin, Q.; Chen, X.; Chang, J. Evaluation of the GPM IMERG v5 and TRMM 3B42 v7 Precipitation Products in the Yangtze River Basin, China. Water 2019, 11, 1459. [Google Scholar] [CrossRef]
  41. Li, X.; Zhang, Q.; Xu, C.-Y. Assessing the performance of satellite-based precipitation products and its dependence on topography over Poyang Lake basin. Theor. Appl. Climatol. 2013, 115, 713–729. [Google Scholar] [CrossRef]
  42. El Khalki, E.M.; Tramblay, Y.; Saidi, M.E.M.; Bouvier, C.; Hanich, L.; Benrhanem, M.; Alaouri, M. Comparison of modeling approaches for flood forecasting in the High Atlas Mountains of Morocco. Arab. J. Geosci. 2018, 11, 410. [Google Scholar] [CrossRef]
  43. Tramblay, Y.; Bouaicha, R.; Brocca, L.; Dorigo, W.; Bouvier, C.; Camici, S.; Servat, E. Estimation of antecedent wetness conditions for flood modelling in northern Morocco. Hydrol. Earth Syst. Sci. 2012, 16, 4375–4386. [Google Scholar] [CrossRef]
Figure 1. The geographical location of the Zat basin and rain gauge station used in the study.
Applsci 12 08309 g001
Figure 2. Calibration of the episode 20 November 2014, using 3B42V7 and IMERG V05 rainfall products and observed runoff data as input.
Applsci 12 08309 g002
Figure 3. Validation of the episode of 20 November 2014, of 3B42V7 and IMERG V05 rainfall products and observed runoff data as input using the means calibration parameters of the gauge precipitation calibration.
Applsci 12 08309 g003
Figure 4. Calibration of the episode 21 March 2016, using 3B42V7 and IMERG V05 rainfall products and observed runoff data as input.
Applsci 12 08309 g004
Figure 5. Validation of the episode of 21 March 2016, of 3B42V7 and IMERG V05 rainfall products and observed runoff data as input using the means calibration parameters of the gauge precipitation calibration.
Applsci 12 08309 g005
Figure 6. Calibration of the episode 3 May 2016, using 3B42V7 and IMERG V05 rainfall products and observed runoff data as input.
Applsci 12 08309 g006
Figure 7. Validation of the episode of 3 May 2016, of 3B42V7 and IMERG V05 rainfall products and observed runoff data as input using the means calibration parameters of the gauge precipitation calibration.
Applsci 12 08309 g007
Figure 8. Calibration of the episode 16 December 2016, using 3B42V7 and IMERG V05 rainfall products and observed runoff data as input.
Applsci 12 08309 g008
Figure 9. Validation of the episode of 16 December 2016, of 3B42V7 and IMERG V05 rainfall products and observed runoff data as input using the means calibration parameters of the gauge precipitation calibration.
Applsci 12 08309 g009
Table 1. Statistical metrics for evaluating IMERG V5 and 3B42 V7 products.
Statistical IndexUnitsReference ValuesEquationReference
Correlation Coefficient (CC)Ratio1 CC = i = 1 N ( Pi P ¯ ) ( Si S ¯ ) i = 1 N ( Pi P ¯ ) 2 i = 1 n ( Si S ¯ ) ² [40]
Root Mean Square Error (RMSE)mm0 RMSE = i = 1 N ( Pi Si ) 2 N
Biasmm0 Bias = i = 1 N ( Pi Si ) i = 1 N N
Probability of Detection (POD)Ratio1 POD = a a + c [41]
False Alarm Ratio (FAR)Ratio0 FAR = b a + b
Critical Success Index (CSI)Ratio1 CSI = a a + b + c
Frequency Bias Index (FBI)Ratio1 FBI = a + b a + c
Table 2. Statistical metrics results of 3B42 V7 and IMERG V5 precipitation estimates at multiple time scales from 2012 to 2017.
TRMMGPM
3 hDailyMonthlyYearly3 hDailyMonthlyYearly
CC0.120.380.790.940.40.590.810.86
RMSE1.410.92.1516.751.353.261.6921.1
Bias0.220.220.850.210.251.521.371.49
Table 3. Contingency statistical metrics results of 3B42 V7 and IMERG V5 precipitation estimates at multiple time scales from 2014 to 2017.
TRMMGPM
3 hDailyMonthlyYearly3 hDailyMonthlyYearly
POD0.130.390.8910.580.8211
FAR0.790.660.0800.830.810.070
CSI0.080.220.8210.140.180.921
FBI0.651.170.9713.634.371.071
Table 4. Summary range of calibrated parameter values.
Model ParametersCalibration Ranges
Loss parametersInitial Abstraction (mm)-
Curve Number (CN)46–83
Impervious (%)0–10
Transform parametersTime of concentration (HR)0.1–5.5
Storage Coefficient (HR)2.6–25.6
Baseflow parametersInitial discharge (m3/s)0.3–2.8
Recession constant0.6–0.8
Ratio0.3–0.5
Table 5. Episodes calibration settings.
IdEventsCurve NumberTime of ConcentrationRecession ConstantNash–Sutcliffe RMSE
CalibrationGauge precipitation20 November 2014510.10.60.880.4
21 March 2016600.60.550.880.3
3 May 20166320.290.830.4
16 December 20166090.30.580.7
3B42V720 November 2014540.60.60.790.5
21 March 2016670.10.60.670.6
3 May 201665100.30.770.5
16 December 20166140.60.640.6
IMERGV520 November 2014520.10.60.840.5
21 March 2016500.90.60.840.4
3 May 2016443.10.30.790.5
16 December 2016626.150.380.620.6
Mean 0.76
Table 6. Episodes validation results.
IdEventsCalculated CNNash-SutcliffeRMSE
ValidationGauge precipitation20 November 201460.390.580.6
21 March 201656.980.640.6
3 May 201659.030.830.4
16 December 201655.830.510.7
3B42V720 November 201459.20.520.7
21 March 201665.90.560.7
3 May 201663.050.610.6
16 December 201660.180.630.6
IMERGV520 November 201439.50.710.6
21 March 201650.50.740.5
3 May 2016470.730.5
16 December 2016490.570.7
Mean 0.64
Publisher’s Note: MDPI stays neutral with regard to jurisdictional claims in published maps and institutional affiliations.

