Abstract
To address the problem of dissolution damage during the long-term service of concrete hydraulic buildings, the concrete dissolution damage degree D and contact dissolution loss model with time were proposed by combining the results of indoor concrete dissolution tests. A mathematical model of the evolution of concrete parameters with time was developed. In the context of an underground concrete culvert project, a numerical analysis model of concrete dissolution deterioration was established, according to which the effects of different damage locations on the stress and displacement of concrete culverts were analyzed. The results show that the settlement value of the surface and the soil pore pressure value increase more when the bottom of the culvert is damaged by dissolution, and the settlement of the surface from the bottom damage is about 1.07~1.16 times of that from the top damage. When the damage position deviates from the center line of the culvert, the maximum point of vertical displacement in the transverse settlement trough of the ground surface deviates from the centerline of the culvert by about 3~5 m in the horizontal direction. At the bottom of the culvert, the concrete permeability coefficient reaches 6.957 × 10⁻⁸ m/s~8.354 × 10−8 m/s in about 13~16 years after the occurrence of dissolution damage, and local leakage occurs, causing a significant increase in the pore pressure of the soil near the leakage location. The overall settlement and uneven settlement resulting from the dual action of dissolution deterioration of concrete and infiltration pressure can have a serious impact on the upper channel buildings.
1. Introduction
Dissolution corrosion of concrete is also known as soft water erosion [1]. Contact with environmental water is inevitable when a hydraulic building is in service. The long-term contact of concrete with water leads to dissolution, reaction, and diffusion of hydration products in cementitious materials, such as concrete, causing calcium dissolution [2], which in turn leads to increased porosity and reduced strength of the concrete, and finally to structural damage. Therefore, dissolution is one of the most common and main diseases of hydraulic concrete [3]. Concrete dissolution is divided into leakage dissolution and contact dissolution. Contact dissolution is caused by direct contact between environmental water and the concrete surface [4]. Concrete in the process of dissolution is not subject to water pressure, or by the water pressure is negligible when the dissolution is contact dissolution [5]. The concrete in the process of dissolution by water pressure cannot be ignored when the dissolution is penetration dissolution [6]. In culverts and other medium- and long-distance water transfer projects, contact dissolution is extremely common. When concrete is damaged by contact dissolution, increased porosity of the material will lead to reduced strength and increased permeability, which seriously affects the durability and safety of concrete structures [7]. Carde et al. [8] performed uniaxial compression tests on cementitious materials attacked by soft water and ammonium nitrate solutions. The results show that the strength and stiffness of the material after calcium dissolution decreases significantly, and the rate of this strength decrease is essentially linearly related to the degree of dissolution damage. The compressive strength of the material after complete dissolution is about one-tenth of the compressive strength in the initial undamaged state. Nguyen et al. [9] conducted accelerated dissolution tests of solid and hollow cylindrical concrete specimens with ammonium nitrate solution and uniaxial compressive tests. The results show that the decrease in mechanical properties of the material after calcium dissolution is related to the degree of dissolution damage, and the stress curve of concrete becomes less steep after calcium dissolution. Heukamp et al. [10] studied the triaxial compression of hardened cement-net-slurry specimens and proposed a model of the relationship between material strength and pore water pressure. It was shown that this high pore pressure sensitivity of leached cement paste can be attributed to the low skeleton-to-fluid bulk modulus ratio, Ks/Kf, of the degraded material, which, together with the increase in porosity, leads to the high compressibility of calcium-leached materials. Zhang [11] and Huang et al. [12] also conducted experimental studies on the chemical–mechanical coupling of concrete and established the corresponding intrinsic structure models which provide references for subsequent studies. A schematic diagram of the concrete dissolution process is shown in Figure 1.
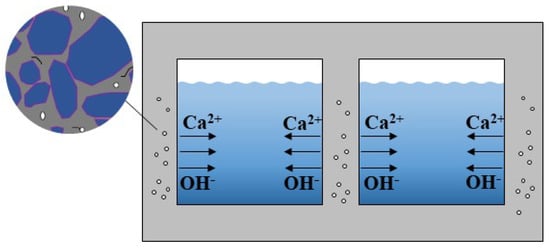
Figure 1.
Schematic diagram of the concrete dissolution process.
The main process of calcium dissolution of cement-based materials can be expressed by Equations (1) and (2) [13].
Culverts are channels where railroads or highways intersect with rivers and canal embankments so that water flows under the road. Their main material is concrete [14]. They are an important part of highway and embankment construction, and are not only related to national livelihood, but also to social and economic benefits [15]. Once the culvert is put into use, it needs to run continuously for an extended time, decades or even centuries. The concrete structure of the culvert is involved in the complex water flow environment for a long time. Most water conveyance culvert projects are also subject to year-round internal and external water pressure; the water flow and water pressure may cause damage to the concrete surface and accelerate the dissolution [16]. Dissolution deterioration of the concrete structure has a negative impact on the building that crosses above [17]. Therefore, many scholars have conducted extensive research on the problem of dissolution deterioration in culvert engineering [18]. Pasupathy et al. [19] conducted a durability study of low-calcium fly ash polymer concrete culverts in a salt lake environment and found that the dissolution of concrete surface carbonation products in contact with water resulted in high porosity of the concrete surface, thereby promoting dissolution deterioration of the concrete. The study indicated that the development of durable polymer concrete for use in harsh environments requires proper consideration of binders and preliminary durability performance testing to avoid premature deterioration. Akhoondan et al. [20] conducted a durability study of culverts lined with aluminized steel (AST2) and showed by electrochemical impedance measurements that AST2 corrodes severely at the beginning of exposure and can effectively mitigate concrete dissolution deterioration with the formation of a thick layer of corrosion products. Shen et al. [21] used high-performance mineral admixtures to improve the durability of culvert concrete in alpine regions to solve the serious freeze–thaw and melting damage problems, and concluded that the incorporation of 21% fly ash and 9% flag powder greatly improved the frost resistance and durability of concrete. Xie et al. [22] carried out an example study on the dissolution of concrete structures in large culverts; investigated the dissolution condition, material strength, and carbonation depth of the culverts; examined and analyzed the dissolution condition; and discussed the dissolution mechanism of large concrete culverts.
Based on these studies, it can be found that culverts located underground for an extended time are not only subject to loads such as earth pressure and internal water pressure, but also to the erosion of concrete due to environmental factors such as the dissolution caused by water flow [14]. Concrete structures inevitably have durability problems under the action of aggressive water environments such as long-term flowing drainage water [23]. The coupling effect of load and dissolution accelerates the degradation process of the durability [3] and load-bearing performance [24] of water-transfer concrete structures. However, many scholars have so far conducted studies on simple dissolution reactions and mechanisms, and fewer studies have been conducted on the coupling of multiple effects. The study of combined chemical–mechanical–seepage damage evolution of underground culverts under the coupling effect of flowing water dissolution and pressure load is crucial to predicting the service life of water transmission concrete structures and achieving safe water transmission, which has important engineering application value.
In this paper, a dissolution damage model is proposed to reflect the deterioration of concrete macroscopic properties. A combined chemical–mechanical–seepage numerical model of a double-box culvert is established to study the internal force changes in the culvert caused by dissolution damage at different locations along the culvert. The effects on surface settlement and pore pressure of the surrounding soil in the context of an actual underground double-box culvert structure in a channel and culvert intersection project provide reference for similar projects and subsequent related research.
2. Dissolution Damage Model
2.1. Proposed Model for the Evolution of Elastic Modulus
Concrete is a nonhomogeneous quasi-brittle material [25], and its damage process is often ductile, which is difficult to describe with a specific model or physical parameters. It is usually characterized with the help of changes before and after damage, which is the principal measure of damage [26]. To describe the role of microscopic concrete materials on their macroscopic mechanical properties, it is necessary to define a suitable damage variable [27]. From damage mechanics, it is known that the stress-elastic-strain relationship for undamaged materials is εe = σ/E. According to the strain equivalence principle, if the material has damage of degree D, the stress–elastic-strain relationship becomes εe = σ/E(1 − D); E is the modulus of elasticity of the undamaged material, σ is the stress to which the material is subjected, εe is the elastic strain of the material, and the modulus of elasticity of damaged material is defined by Ē = E(1 − D). The damage degree D can be obtained as follows.
Zhou [28] et al. investigated the evolution of mechanical properties of concrete with dissolution time by conducting dissolution experiments on concrete with different ratios, which used a concentration of 6 mol/L ammonium nitrate solution to accelerate the dissolution of concrete. The dissolution rate was about 300 times that of concrete in deionized water [29]. Referring to the experimental results [30], the equation of the rate of reduction in the elastic modulus of concrete versus the dissolution time (unaccelerated) is introduced in Equation (4):
where Ē indicates the elastic modulus of concrete after dissolution, GPa; E indicates the initial elastic modulus of concrete, GPa; and t indicates the calendar time in days.
From the derivation of Equations (3) and (4), the model equation for the evolution of concrete dissolution damage degree D with time is obtained in Equation (5), and the model equation for the evolution of concrete elastic modulus with time is obtained in Equation (6):
where D indicates the degree of concrete dissolution damage; t indicates the calendar time in days; E0 indicates the initial modulus of elasticity of concrete, GPa; and Ē indicates the modulus of elasticity of concrete after dissolution, GPa.
2.2. Proposed Model for the Evolution of Porosity and Permeability Coefficient
The dissolution of solid-phase hydration products such as CH and C-S-H gels lead to an increase in the porosity of the microstructure. Carde [30] et al. found that the increase in porosity after complete dissolution of ordinary cement paste was basically the same as the volume fraction of CH in the hardened cement paste, while C-S-H precipitation of calcium caused only microscopic pores, which had less effect on porosity. Therefore, to simplify the process of calculating the porosity increment, the dissolution of C-S-H gel can be equated to the dissolution of solid phase CH. The increment of porosity Δφ in the dissolution process is shown in Equation (7). Jia [31] et al. established a three-dimensional calcium dissolution mathematical model based on the mass conservation law, solid–liquid equilibrium relationship curve, porosity evolution model, and effective diffusion coefficient evolution model. The ion-exchange boundary conditions were introduced to consider the contact boundary concentration changes, and the accuracy of the results was verified by comparison with experiments to derive the porosity versus time curves, which were fitted as shown in Equation (8):
where φ0 indicates the initial porosity; ρCH indicates the density of solid phase CH, taking the value of 2.24 × 10³ kg/m3; MCH indicates the molar mass of CH, taking the value of 74 g/mol; and t indicates the calendar time in days.
The evolution equation of the permeability coefficient is obtained from the Kozeny–Carman equation:
where k0 indicates the initial permeability coefficient, cm/s; φ0 indicates the initial porosity; and φ indicates the concrete porosity after dissolution.
3. Numerical Modeling
3.1. Project Overview
A large culvert intersection project with a backwater canal is used as the background. The type is an assembly culvert, and the main design index is as follows: the design length is 234 m, design flow rate is 53.9 m3/s, the design water depth is 3.5 m, the structure of the pipe body is box-type, the section size is 2 × 4.0 m × 4.0 m, the length of gate section is 10 m, and the length of building arrangement is 154 m. The culvert axis intersects with the backwater canal at an angle of roughly 77°, which is convenient for traffic. The design dimensions of the culvert are shown in Figure 2.
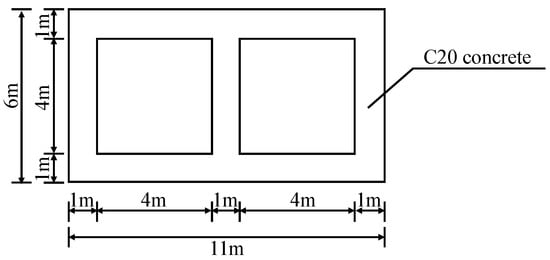
Figure 2.
Culvert design size.
The stratum within the scope of engineering geological exploration is the upper Pleistocene alluvium of the Fourth Series, and the lithology is mainly light, medium, and heavy powdery loam, fine sand, and pebbles, divided into five soil units. Layer ⑤ is pebbles (), composed mainly of quartz sandstone, followed by quartz sand and andesite. Layer ④ is fine sand (), composed mainly of feldspar and quartz, mostly fine sand with uneven quality, locally containing a small amount of mud and occasionally small gravel and occasional calcium colloid in XHCSX4. Layer ③ is loess-like heavy powdery loam (). It is plastic, with a soil texture, rusty yellow streaks, occasional calcium reticulation, and slightly low local clay content near medium powdery loam. Layer ② is loess-like medium powdery loam (). It is plastic with uneven soil texture, snail shell fragments, occasional rusty yellow streaks, and slightly high local clay content near the medium powdery loam. Layer ① is loess-like heavy powdery loam (). It is brownish yellow, wet and plastic, and has uneven soil texture, a plant root system and snail shell fragments.
The physical parameters of the soil layer used in the numerical model are shown in Table 1. The permeability coefficient is determined according to the geological exploration data, and the geological profile is shown in Figure 3.

Table 1.
Suggested values for physical parameters of soil layers and structural materials in the site area.
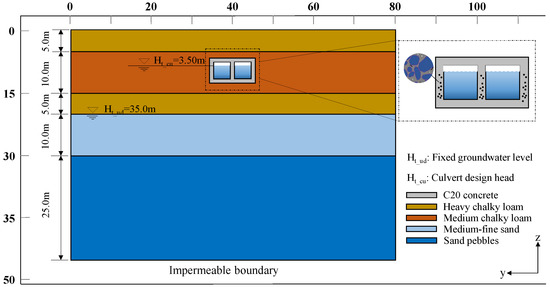
Figure 3.
Geological profile of culvert engineering.
3.2. Model Building
Under the actual service conditions of underground water conveyance culverts, the cavity concrete not only undergoes mechanical damage caused by loads such as water pressure and earth pressure, but also produces chemical damage caused by dissolution, and its durability degradation is a complex chemical–mechanical damage evolution model [32]. The existing damage models mostly used quantitative analysis of the elastic–plastic damage process of concrete under a single mechanical load or considering only chemical–seepage coupling. In this paper, we consider chemical damage under the action of dynamic water dissolution [33] and establish a combined chemical–mechanical–seepage numerical model of concrete dissolution damage to study the deformation and force of the underground culvert and surrounding soil under concrete dissolution degradation.
The finite element software ABAQUS was used to build the model, as shown in Figure 4, and the combined chemical–mechanical–percolation mesh-type consisted of C3D8P cells, which generated 456,050 mesh nodes and 416,468 mesh cells.
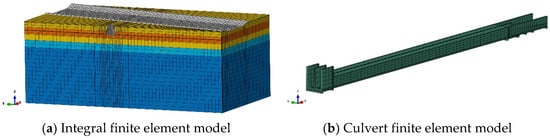
Figure 4.
Three-dimensional finite element model.
Displacement boundary condition setting: The surface and channel surface are free. The four sides of the model are only allowed to move in-plane, and their normal displacement constraint is 0. The bottom of the model uses fixed constraints to limit the displacement to 0. Seepage boundary condition setting: It is considered that there is sufficient water recharge, and groundwater is always kept 20 m below the surface. The pore water pressure in the horizontal plane 20 m below the surface is always set to 0. The hydrostatic pore pressure boundary is on the side of the model. In the ground stress equilibrium stage, the surface leakage area of the inner wall of the culvert adopts the ABAQUS default state impermeable boundary. The water pressure and pore pressure of the inner wall of the culvert are set at 3.5 m. The setting of the interaction between the culvert and soil: The contact surface between the outer surface of the culvert and the soil is restrained by a tie, and the rotational freedom of the slave surface is limited to be the same as that of the main surface. In this simulation, except for the medium-fine sand and sandy pebbles, which adopt the linear elastic principal structure, all the soils are simulated by the elastic–plastic principal structure relationship based on the Mohr–Coulomb yield criterion, and the C20 concrete adopts the linear elastic principal structure.
3.3. Damage Simulation
A culvert project is often arranged in sections. The cross-sectional direction of the culvert is the Y direction, along the culvert body is the X direction, and the vertical direction is the Z direction. Assuming that the sections are along the same direction as the dissolution damage, the location of the damage is located along the X direction in the central section of the culvert sidewall, cover, and bottom plate. The culvert is divided into five damage areas (A~E), as shown in Figure 5.
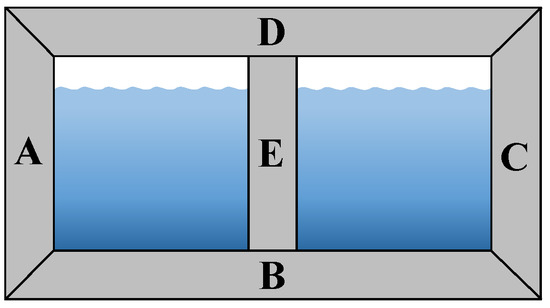
Figure 5.
Culvert damage simulation distribution map.
Contact dissolution is an extremely slow process. In this paper, the change process of each parameter during the dissolution damage shown in Figure 6 is used as the input to the intrinsic model of the damaged area. Simulating the changes in the dissolution damage from 0 to 40 years for each dissolution damage area allows us to analyze the changes in concrete structure internal force, surface settlement, soil pore pressure of the culvert, and the possible effects on the cross structure of the upper backwater canal.
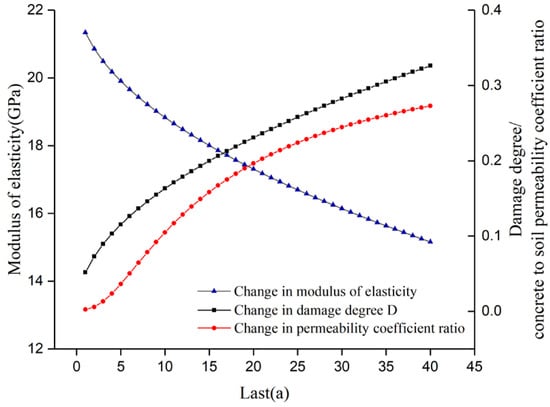
Figure 6.
Characteristic curves of calculated parameters of culvert damage analysis with different calendar time.
4. Results and discussion
4.1. Model Validation
In order to verify the rationality of the constructed evolutionary model, the evolutionary model curves were compared with the fitted curves of the concrete dissolution degradation test performed at Zhejiang University [34]. The fitted curve in reference [34] for porosity is plotted against the evolution equation curve, as shown in Figure 7, and the fitted curve in reference [34] for the elastic modulus is plotted against the evolution equation curve, as shown in Figure 8.
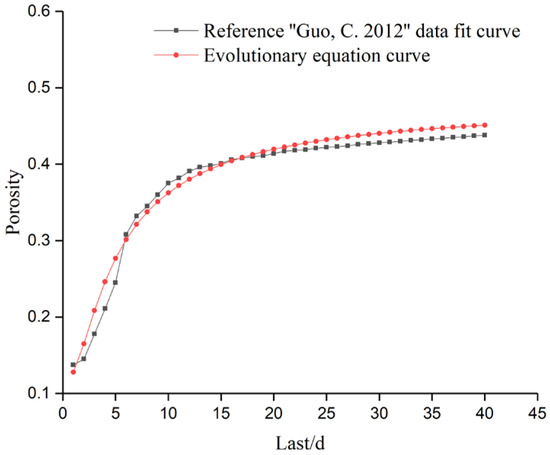
Figure 7.
Comparison of porosity variation [34].
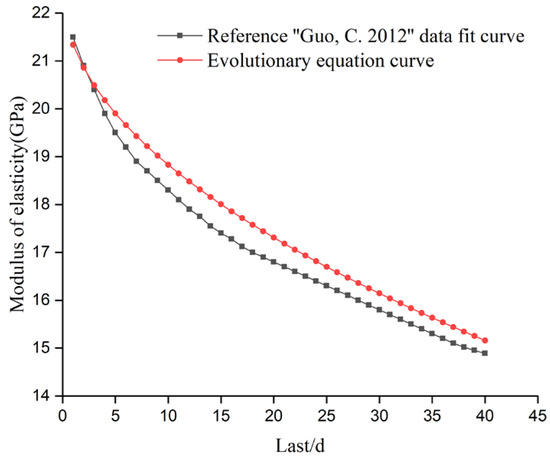
Figure 8.
Comparison of changes in modulus of elasticity [34].
The reasonableness of the numerical model is reflected qualitatively by comparing the consistency of the porosity and elastic modulus variation laws with time and evolution equation curves fitted to the data from reference [34]. As can be seen from Figure 7, with the deepening of dissolution, both curves reflect a gradual increase in concrete porosity, and with the change in time, it gradually tends to become smoother. As can be seen from Figure 8, with the deepening of dissolution, both curves reflect a gradual decrease in the modulus of elasticity of concrete, and the consistency is good. Therefore, the constructed model for the evolution of concrete dissolution loss can reasonably reflect the change law of each physical parameter of concrete as the degree of dissolution deepens.
In order to verify the reasonableness of the numerical model, it is proposed to compare the simulated maximum surface settlement results with the actual field measurement results. Since the field test area is not completely consistent with the simulated area, there are a few missing data, and here the results and laws of the field test of underground culverts by Chen et al. [35] are used to complete the measured data in the hydrogeological report of the project. The reasonableness of the numerical model is reflected qualitatively by comparing the consistency of the maximum surface settlement curve calculated by the model with the variation pattern of the measured surface settlement values. As seen in Figure 9 and Figure 10, the maximum settlement curve of the ground surface obtained from the ABAQUS-based simulation is essentially consistent with the measured vertical displacement variation law of the ground surface, with a maximum relative error of 1.22%, and the simulation calculation results are more consistent. Therefore, the constructed numerical model of concrete dissolution degradation can reasonably reflect the changes in the displacement field.
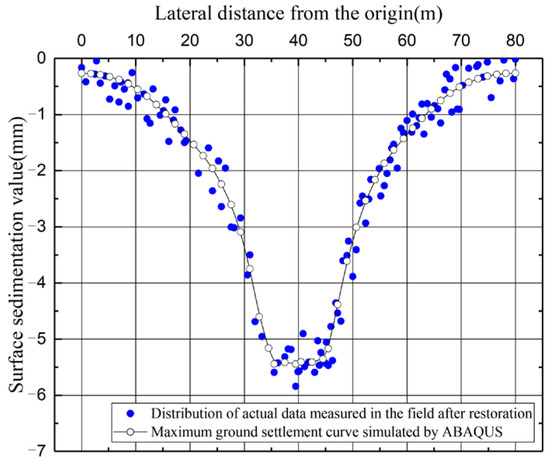
Figure 9.
Measured data distribution and numerical simulation settlement curve.
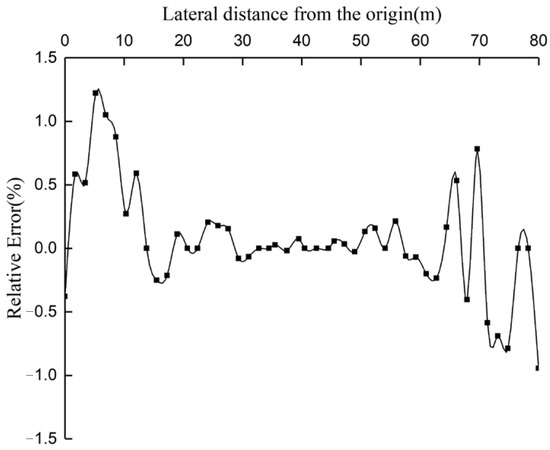
Figure 10.
Relative error variation curve.
4.2. Changes in Internal Forces of Culverts under the Effect of Dissolution
The occurrence of dissolution damage in different parts of concrete will lead to changes in the internal forces of the concrete structure, which adversely affect the long-term operation of the project. Since the tensile strength of concrete is much lower than the compressive strength, the main tensile stress interval of concrete is studied. From the initial state of the maximum stress, shown in the Figure 11, separate zones can be seen in six parts of the obvious tensile stress concentration. The six zones are named as the I~VI regions, and both the sides and the central part of the obvious tensile stress area are not seen at this analysis site.
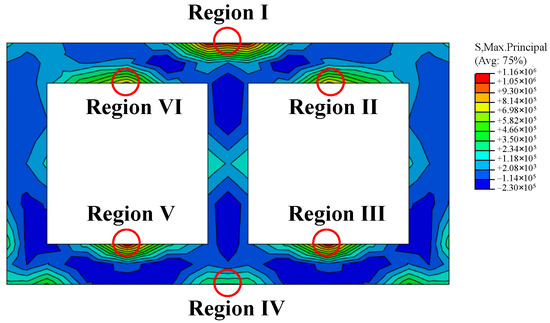
Figure 11.
Initial state maximum tensile stress cloud.
Under different working conditions in each area of the culvert, with the deepening of the degree of dissolution, the culvert maximum tensile stress changes, as shown in Figure 12. The following law can be found.
- (1)
- The maximum tensile stress area of the culvert is mainly distributed in the lower end of the culvert center wall, the top and bottom of the cavity, and near the corner of the bottom of the culvert. The maximum tensile stress value in the initial state is 1.16 MPa: 1.20 MPa in the A condition, 1.16 MPa in the B condition, 1.20 MPa in the C condition, 1.19 MPa in the D condition, 1.18 MPa in the E condition, and 1.16 MPa in the full dissolution condition. The standard tensile strength of C20 concrete is 1.50 MPa, and the design value of tensile strength is 1.10 MPa. Considering the deterioration caused by dissolution, the strength of the concrete is discounted. However, the maximum tensile stress value of each working condition in the dissolution cycle is still less than its standard value of tensile strength.
- (2)
- In the II and VI regions, under the E working condition, the culvert middle wall undergoes dissolution degradation, and the decrease in elastic modulus leads to an increase in the vertical deformation of the middle wall. The middle of the roof plate produces a larger vertical displacement under the action of soil pressure, self-weight, and other loads, which leads to a significant increase in tensile stress in the II and VI regions, with a peak value of 0.89 MPa. In the A and C working conditions, the culvert sidewalls undergo dissolution deterioration and the reduction in elastic modulus leads to an increase in sidewall deformation. The two ends of the top plate produce larger vertical displacement under the action of soil pressure, self-weight, and other loads, which leads to a reduction in tensile stress in the II and VI regions. In the B condition, the bottom plate of the culvert is degraded by dissolution, and the decrease in elastic modulus leads to an increase in vertical displacement of the sidewall. Additionally, the two ends of the top plate produce a larger vertical displacement under the action of soil pressure, self-weight, and other loads, which leads to the decrease in tensile stress in the II and VI regions. In the D working condition, the culvert top slab undergoes dissolution deterioration, and the reduction in elastic modulus causes the stress concentration to be released, and the tensile stresses in the II and VI regions show a small decrease. Under the full dissolution condition, the culvert as a whole undergoes dissolution deterioration, and the resulting effect is equivalent to the use of low-strength concrete in terms of mechanical properties, with a small change in stress distribution, as can be seen in Figure 12. Here, the maximum tensile stress in each region under the full dissolution condition undergoes a small change.
- (3)
- The tensile stress growth is larger and symmetrically distributed with a peak value of 1.20 MPa in the III and V regions under working conditions C and A. The tensile stress grows fastest in area I under working condition B, and the peak value can reach 1.13 MPa. In working condition D, the tensile stress appears to drop steeply, considering that the dissolution site is in the I area, and the elastic modulus of concrete decreases, leading to a decrease in stiffness and the release of tensile stress. The tensile stress under working condition E in region VI shows a rapid increase with a peak value up to 0.89 MPa, and in the other working conditions, the tensile stress decreases each year.
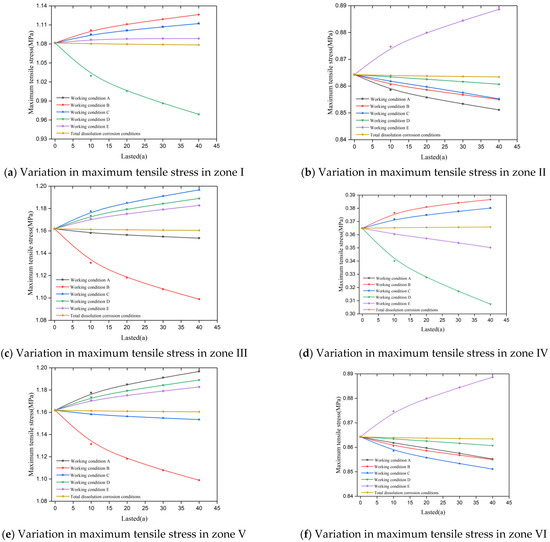
Figure 12.
Variation in maximum stress in each area with increasing dissolution.
4.3. Change in Surface Settlement Induced by Culvert Dissolution
The changes in surface lateral settlement curves at 10, 20, 30, and 40 years due to concrete deterioration caused by contact dissolution occurring at different locations along the culverts are shown in Figure 13; the following patterns can be found:
- (1)
- The width and settlement value of the surface sedimentation trough will show a nonlinear increase with the increasing degree of dissolution. In the event of concrete dissolution damage for 40 years, the maximum surface settlement value reaches 7.33 mm, and the resulting overall settlement will adversely affect the upper backwater canal buildings, leading to lining fractures, channel leakage, and other hazards, causing the culvert to fall into a vicious cycle, seriously shortening the project operation cycle.
- (2)
- When the sidewall of the culvert is damaged by dissolution, the upper part of the soil on the unconsolidated side settles more, because the physical and mechanical properties of the concrete are reduced due to the dissolution of the sidewall, and the upper part of the soil on the unconsolidated side moves to the dissolved side, resulting in greater surface settlement.
- (3)
- For the dissolution damage at the same horizontal position (such as A and C working conditions), the maximum value of surface settlement at each dissolution degree is very similar, and the horizontal distance from the centerline of the culvert at the location of occurrence is almost equal.
- (4)
- Different locations of the surface lateral settlement troughs caused by dissolution damage occur at different locations. When the damage position is close to the centerline of the culvert (B, D, E, and full erosion conditions), the maximum settlement point of the surface transverse settlement trough is located in the centerline of the culvert (i.e., y = 40 m). When the damage position deviates from the culvert centerline (A and C conditions), the maximum point of vertical displacement in the transverse ground settlement tank deviates from the culvert centerline by about 3~5 m in the horizontal direction. The main reason for this phenomenon is the increase in porosity and serious loss of elastic modulus at the site of dissolution damage, which leads to the increase in concrete deformation and uneven settlement of the soil, and seriously impacts the stability of the upper channel structure.
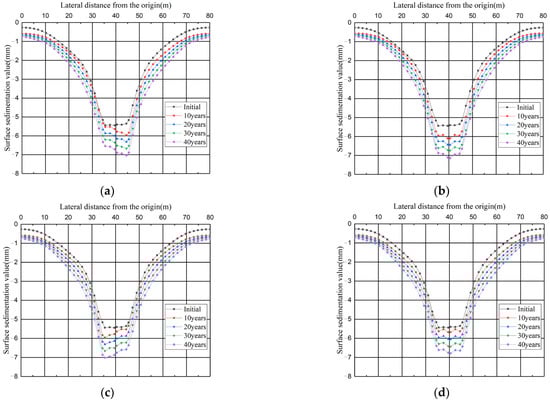
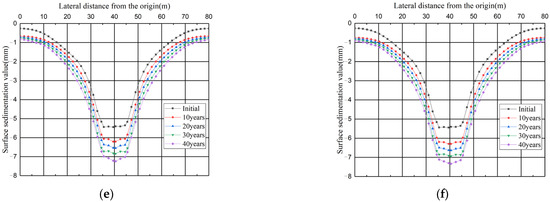
Figure 13.
Development of the longitudinal surface settlement curve caused by dissolution deterioration at the same location. (a) Longitudinal settling tank for working condition A. (b) Longitudinal settling tank for working condition B. (c) Longitudinal settling tank for working condition C. (d) Longitudinal settling tank for working condition D. (e) Longitudinal settling tank for working condition E. (f) Longitudinal settling tank for total dissolution working condition F.
A comparison of the surface lateral settlement curves caused by dissolution damage at different locations for a given time is shown in Figure 14. From the figure, the following patterns can be found:
- (1)
- During each dissolution period, the influence range and depth of surface settlement troughs caused by dissolution damage in B and full dissolution conditions are the most obvious. The vertical displacement of surface settlement troughs caused by dissolution damage in the A and C positions is the largest on the unsolved side and is symmetrically distributed.
- (2)
- At each dissolution time, the surface settlement caused by dissolution damage at the bottom of the culvert is significantly larger than that caused by dissolution damage at the top of the culvert, and the surface settlement from the bottom damage is about 1.07~1.16 times of that from the top damage. This is due to the local leakage of concrete caused by dissolution degradation and the fact that the soil at the lower part of the culvert is subjected to infiltration pressure, and the soil settlement is larger and more extensive.
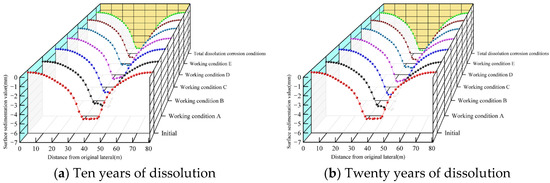
Figure 14.
Comparison of surface longitudinal settlement curve patterns caused by dissolution degradation at different locations and shown for a given time.
The variation in the maximum value of surface settlement with the dissolution cycle under different dissolution conditions is shown in Figure 15. From the figure, the following patterns can be found:
- (1)
- The closer the location of culvert damage is to the bottom, the greater the value of surface settlement caused, and the maximum value of surface settlement caused by dissolution at the bottom is about 20% more than that at the top.
- (2)
- The width and settlement value of the surface settlement trough shows a nonlinear increase with the increase in the degree of dissolution, which is mainly divided into three stages: The first stage is 0~15 years, where the degree of concrete dissolution is small, the decrease in permeability coefficient is small, the culvert does not show leakage, and the main cause of soil settlement is the decrease in concrete elastic modulus. The second stage is 15~30 years, where the settlement increase rate gradually increases. At this time, the degree of concrete dissolution increases and the culvert shows local leakage. Under the dual action of the decreased elastic modulus of concrete and infiltration pressure, the soil settlement increases substantially (working condition D does not show the phenomenon of internal water infiltration because the dissolution site is located at the top of the culvert). The third stage is 30 to 40 years, where the rate of increase in subsidence remains stable.
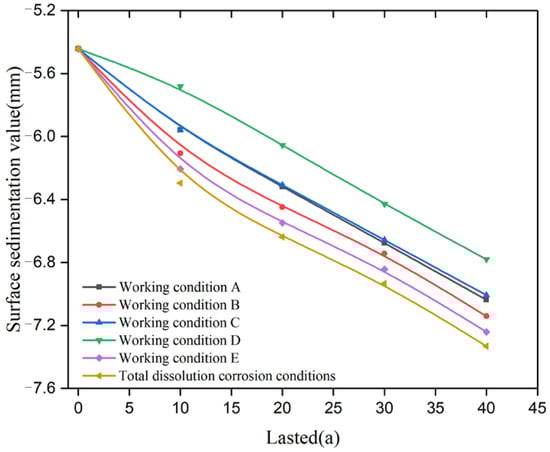
Figure 15.
Comparison of surface sedimentation maxima with the degree of dissolution.
4.4. Changes in Soil Pore Pressure Caused by Culvert Dissolution
The deepening of the degree of dissolution damage leads to a substantial decrease in the permeability coefficient of concrete in the culverts, and then the phenomenon of leakage occurs, leading to changes in the hydraulic boundary conditions of the soil. This affects the changes in the pore pressure field of the surrounding soil. Through numerical simulation, the following features are found:
- (1)
- As can be seen from the Figure 16, the dissolution damage at the bottom of the culvert (working condition B) reached a permeability coefficient of 8.354 × 10⁻⁸ m/s for the concrete in about 16 years. Furthermore, local leakage occurred, causing a significant increase in the pore pressure of the soil near the leakage location. The full dissolution condition reaches a concrete permeability coefficient of 6.957 × 10⁻⁸ m/s in about 13 years. Furthermore, local leakage occurs, causing a significant increase in the pore pressure of the soil near the leakage location.
- (2)
- Different locations along the culvert show dissolution damage, causing different locations where the increase in pore pressure of the surrounding soil occurs. When damage occurs at the top and bottom of the culvert, the pore pressure changes have a clear symmetry. When damage occurs in the lateral part, the pore pressure changed only in a unilateral range. This is consistent with the conclusion that the maximum ground settlement value occurs near the centerline of the culvert when dissolution damage occurs at the top and bottom of the culvert, while the maximum ground settlement value occurs on the side of the centerline of the culvert when dissolution damage occurs at the sidewalls of the culvert.
- (3)
- The range and shape of the increase in pore pressure of the surrounding soil caused by dissolution damage occurring at various locations along the culvert are different. The range of the increase in pore pressure of the soil caused by top dissolution (D working condition) is the smallest, and the influence range is approximately rectangular, at about 11 m in the horizontal direction and 1 m in the vertical direction. The increased range in soil pore pressure caused by lateral dissolution (A and C working conditions) is more concentrated, and the influence range is approximately triangular, at about 15 m in the horizontal direction and 7 m in the vertical direction. As can be seen from Figure 17, the increased range in pore pressure caused by the bottom dissolution (B condition) and the full dissolution conditions is approximately isosceles trapezoidal, where the increased range in pore pressure caused by the full dissolution condition is the largest, at about 25 m in the horizontal direction and 13 m in the vertical direction.
- (4)
- Under the full dissolution condition, when leakage occurs at the bottom and side of the culvert, the impact is the widest, the pore pressure changes the most, and the seepage pressure is the largest. For the soil body under the action of seepage pressure, the settlement value increases substantially, which is consistent with the conclusion that the surface settlement value is the largest under the full dissolution condition.
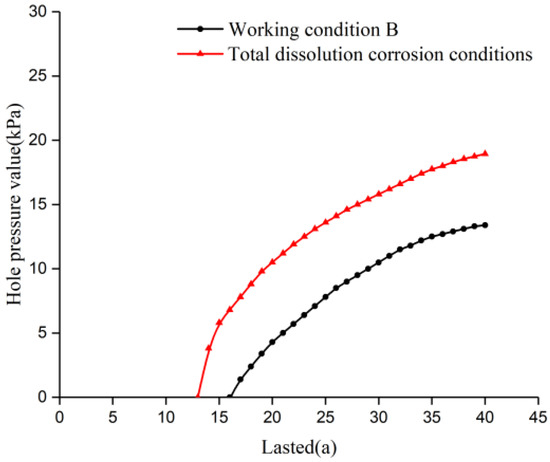
Figure 16.
Variation in pore pressure value at the bottom of the culvert with dissolution time for working condition B and full dissolution working condition (kPa).
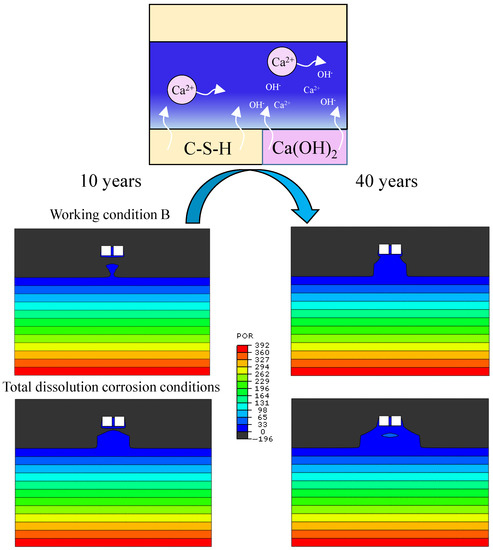
Figure 17.
Variation in pore pressure value from 10 to 40 years for working condition B and total dissolution working condition (kPa).
5. Conclusions
This paper analyzes an underground double-box culvert structure project at the intersection of a channel and culvert under typical stratigraphic conditions on the north bank of the Yellow River in Henan province. A combined chemical–mechanical–seepage numerical model of a double-box culvert was developed using the evolutionary model of each physical parameter as input. A section of its cavity was selected for zoning, divided into four deterioration parts: A, B, C, and D. The effects on the internal force of the concrete structure, the effects of surface settlement, and the effects of pore pressure in the surrounding soil were analyzed under the occurrence of dissolution damage at different locations along the culvert. The main conclusions follow.
- (1)
- Through the rational analysis of the evolution equation and numerical model, the results show that the concrete dissolution damage model constructed in this paper can reasonably reflect the changes in macroscopic mechanical properties and permeability during concrete dissolution. Additionally, the combined chemical–mechanical–percolation numerical model established based on it can accurately and reliably simulate the changes in surface settlement, structural internal force, and soil pore pressure in the project area under the consideration of concrete dissolution degradation conditions.
- (2)
- The tensile stress area of the culvert is mainly distributed in the vicinity of the top plate and bottom plate at the lower end of the middle wall of the culvert. The maximum tensile stress value of concrete under each working condition within 40 years of the dissolution cycle is lower than its standard value of tensile strength, so the culvert can operate normally at the stress level. In the actual operation, there are microcracks on the concrete surface, which increase with the deepening of dissolution. Without targeted treatment, the initial cracks quickly develop and join together to cause damage, requiring attention.
- (3)
- The width and settlement value of the surface settlement trough show a nonlinear increase with the increase in the degree of dissolution. The maximum settlement value of the surface reaches 7.33 mm when the concrete has been damaged by dissolution for 40 years, and will continue to increase with time. The resulting overall settlement adversely affects the upper backwater canal structures, leading to lining fractures, channel leakage, and other hazards, making the operating environment of the culvert fall into a vicious cycle, seriously shortening the operational cycle of the project.
- (4)
- As the degree of concrete dissolution deepens, the porosity increases, local leakage occurs, and the soil settlement value increases substantially by about 20% under the dual action of elastic modulus decrease and infiltration pressure.
- (5)
- In this paper, the variation in the degree of dissolution with the water depth in the culvert and the process of dissolution reactions are not considered. In the future, we can conduct studies from a microscopic point of view, construct the coupled equations of concrete chemistry and mechanics, and replace the damage degree D with the chemical reaction rate ki for joint solutions, which may be able to better simulate the mechanical behavior of concrete under dissolution damage.
Author Contributions
G.Z. conceived this research; G.Z. and L.X. performed the calculations; G.Z., L.X. and G.C. prepared the original draft; editing and review of this article was completed by G.Z., G.C. and W.Z.; Z.S., L.J. and X.L. were responsible for overseeing the progress and visualization of the article. All authors have read and agreed to the published version of the manuscript.
Funding
This study was supported by projects funded by the National Natural Science Foundation of China (Grant No. 52179130), the Fundamental Research Funds for the Central Universities of HHU (Grant No. B200203039), and the National Key R&D Program of China (Grant No. 2019YFC1510802). The authors thank the reviewers for their corrections and the editorial team for their support!
Institutional Review Board Statement
The study did not require ethical approval.
Informed Consent Statement
Not applicable.
Conflicts of Interest
We declare that we have no financial or personal relationships with other people or organizations that can inappropriately influence our work; there is no professional or other personal interest of any nature or kind in any product, service, and/or company that could be construed as influencing the position presented in, or the review of the manuscript entitled “Performance deterioration of underground culverts considering the effect of dissolution and its effect on the surrounding soil”.
References
- Fang, K.; Ruan, Y.; Wu, L. A Study on Leakage Dissolution Characteristic of Concrete. J. Hydroelectr. Eng. 2001, 1, 31–39. [Google Scholar] [CrossRef]
- Gerard, B. Simplified modelling of calcium leaching of concrete in various environments. Mater. Struct. 2002, 35, 632–640. [Google Scholar] [CrossRef]
- Ueda, H.; Sakai, Y.; Kinomura, K.; Watanabe, K.; Ishida, T.; Kishi, T. Durability Design Method Considering Reinforcement Corrosion due to Water Penetration. J. Adv. Concr. Technol. 2020, 18, 27–38. [Google Scholar] [CrossRef] [Green Version]
- Kong, X.; Ji, G.; Liu, Y. Research on leakage dissolution of hydraulic concrete. J. China Inst. Water Resour. Hydropower Res. 2012, 10, 63–68. [Google Scholar] [CrossRef]
- Ruan, Y.; Fang, K.; Zeng, L. Experimental Study on Surface Contact Dissolution of Hydraulic Concrete. J. Build. Mater. 2007, 10, 528–533. [Google Scholar] [CrossRef]
- Lin, D.; Yi, B.; Chen, Y. Research Development of the Corrosion of Reinforced Concrete in Saline Soil Environment. Mater. Rev. 2014, 28, 137–141. [Google Scholar] [CrossRef]
- Ghantous, R.M.; Poyet, S.; L’Hostis, V.; Tran, N.-C.; François, R. Effect of crack openings on carbonation-induced corrosion. Cem. Concr. Res. 2017, 95, 257–269. [Google Scholar] [CrossRef]
- Carde, C.; Escadeillas, G.; François, A.H. Use of ammonium nitrate solution to simulate and accelerate the leaching of cement pastes due to deionized water. Mag. Concr. Res. 1997, 49, 295–301. [Google Scholar] [CrossRef]
- Nguyen, V.; Nedjar, B.; Torrenti, J. Chemo-mechanical coupling behaviour of leached concrete: Part II: Modelling. Nucl. Eng. Des. 2007, 237, 2090–2097. [Google Scholar] [CrossRef]
- Heukamp, F.; Ulm, F.-J.; Germaine, J. Mechanical properties of calcium-leached cement pastes: Triaxial stress states and the influence of the pore pressures. Cem. Concr. Res. 2001, 31, 767–774. [Google Scholar] [CrossRef]
- Zhang, Y.; Zhang, Z.; Shao, J. Constitutive Model of Chemical-Mechanical Damage in Concrete. Eng. Mech. 2006, 23, 153–156. [Google Scholar] [CrossRef]
- Huang, B.; Qian, C. Characterization and Stress-Strain Relationship of Leached Concrete. J. Chin. Ceram. Soc. 2011, 39, 87–91. [Google Scholar] [CrossRef]
- Kamali, S.; Moranville, M.; Leclercq, S. Material and environmental parameter effects on the leaching of cement pastes: Experiments and modelling. Cem. Concr. Res. 2008, 38, 575–585. [Google Scholar] [CrossRef]
- Abuhajar, O.; El Naggar, H.; Newson, T. Static soil culvert interaction the effect of box culvert geometric configurations and soil properties. Comput. Geotech. 2015, 69, 219–235. [Google Scholar] [CrossRef]
- Xi, X.; Yang, S.; Li, C.-Q. A non-uniform corrosion model and meso-scale fracture modelling of concrete. Cem. Concr. Res. 2018, 108, 87–102. [Google Scholar] [CrossRef] [Green Version]
- Al-Sodani, K.A.A.; Maslehuddin, M.; Al-Amoudi, O.S.B.; Saleh, T.A.; Shameem, M. Performance of corrosion inhibitors in cracked and uncracked silica fume cement concrete beams. Eur. J. Environ. Civ. Eng. 2018, 24, 1573–1588. [Google Scholar] [CrossRef]
- Solgaard, A.O.S.; Michel, A.; Geiker, M.; Stang, H. Concrete cover cracking due to uniform reinforcement corrosion. Mater. Struct. 2013, 46, 1781–1799. [Google Scholar] [CrossRef]
- Chu, F.; Zeng, S.; Fang, W.; Wang, P. Mechanical Properties of Large-Sized Corrugated Steel Pipe Culvert Under High Embankment Filled. J. Northeast. Univ. 2016, 37, 1338–1342. [Google Scholar] [CrossRef]
- Pasupathy, K.; Berndt, M.; Sanjayan, J.; Rajeev, P.; Cheema, D.S. Durability of low-calcium fly ash based geopolymer concrete culvert in a saline environment. Cem. Concr. Res. 2017, 100, 297–310. [Google Scholar] [CrossRef]
- Akhoondan, M.; Sagüés, A.A. Corrosion Mechanism of Aluminized Steel in Limestone Backfill. Corrosion 2013, 69, 1147–1157. [Google Scholar] [CrossRef]
- Shen, A.; Zhang, J.; Fan, L. Durability of C40 machine-made sand concrete for highway culvert in alpine areas. J. Jiangsu Univ. 2018, 39, 115–119. [Google Scholar] [CrossRef]
- Xie, Y.; Bao, Y.; Li, N. Case study on corrosion of large-diameter drainage concrete box culvert. Water Wastewater Eng. 2019, 45, 121–123. [Google Scholar] [CrossRef]
- Zhang, K.; Shen, Z.; Xu, L.; Tan, J.C.; Yang, C. Durability control index of anti-seepage curtain considering the effect of advection-diffusion-driven leaching. J. Hydraul. Eng. 2020, 51, 169–179. [Google Scholar] [CrossRef]
- Cai, X.; He, Z.; Sun, H. Structure evolution of calcium silicate hydrate and suitable content of fly ash among cementitious materials under dissolution. J. Hydraul. Eng. 2012, 43, 302–307. [Google Scholar] [CrossRef]
- Ghanooni-Bagha, M.; Shayanfar, M.; Shirzadi-Javid, A.; Ziaadiny, H. Corrosion-induced reduction in compressive strength of self-compacting concretes containing mineral admixtures. Constr. Build. Mater. 2016, 113, 221–228. [Google Scholar] [CrossRef]
- Zuo, X.; Sun, W. Full Process Analysis of Damage and Failure of Concrete Subjected to External Sulfate Attack. J. Chin. Ceram. Soc. 2009, 37, 1063–1067. [Google Scholar] [CrossRef]
- Sola, E.; Ožbolt, J.; Balabanić, G.; Mir, Z. Experimental and numerical study of accelerated corrosion of steel reinforcement in concrete: Transport of corrosion products. Cem. Concr. Res. 2019, 120, 119–131. [Google Scholar] [CrossRef]
- Zhou, X.; Ye, L.; Zheng, J. An experimental study on the degradation of mechanical properties of leached concrete. J. Zhejiang Univ. Technol. 2016, 44, 524–528. [Google Scholar] [CrossRef]
- Wan, K.; Li, Y.; Sun, W. Experimental and modelling research of the accelerated calcium leaching of cement paste in ammonium nitrate solution. Constr. Build. Mater. 2012, 40, 832–846. [Google Scholar] [CrossRef]
- Carde, C.; François, R. Effect of the leaching of calcium hydroxide from cement paste on mechanical and physical properties. Cem. Concr. Res. 1997, 27, 539–550. [Google Scholar] [CrossRef]
- Jia, P.; She, C. Three-dimensional finite element numerical simulation of contact dissolution of cement-based materials. J. Yangtze River Sci. Res. Inst. 2019, 36, 132–139. [Google Scholar] [CrossRef]
- Gawin, D.; Koniorczyk, M.; Pesavento, F. Modelling of hydro-thermo-chemo-mechanical phenomena in building materials. Bull. Pol. Acad. Sci. Tech. Sci. 2013, 61, 51–63. [Google Scholar] [CrossRef] [Green Version]
- Kong, X.; Chen, G.; Li, S. Studies on the decreasing rule of the anti-shearing strength along RCC joints (cracks) subjected to leaching. J. Hydraul. Eng. 2017, 48, 1082–1088. [Google Scholar] [CrossRef]
- Guo, C. Degradation Mechanism of Concrete Due to Calcium Dissolution. Master’s Thesis, Zhejiang University, Zhejiang, China, 2012. [Google Scholar]
- Chen, B.; Zheng, J.; Zhang, S. Field test and numerical simulation of ground treatment for culverts under high embankments. Rock Soil Mech. 2009, 30, 1483–1489. [Google Scholar] [CrossRef]
Publisher’s Note: MDPI stays neutral with regard to jurisdictional claims in published maps and institutional affiliations. |
© 2022 by the authors. Licensee MDPI, Basel, Switzerland. This article is an open access article distributed under the terms and conditions of the Creative Commons Attribution (CC BY) license (https://creativecommons.org/licenses/by/4.0/).