Abstract
Ships and offshore structures are subjected to impact loads, such as slamming and sloshing. High impact pressures can cause permanent hull deformation by a single impact event. In addition, significant fatigue damage can be accumulated via repeated impact pressures. In this study, the plastic deformation behavior of flat plates under slamming impact is numerically investigated using a coupled Eulerian–Lagrangian method. The dynamic impact pressure of the flat plates by weight and drop height is investigated under the assumption of viscous and compressible fluids. To evaluate the plastic deformation of the plate, contact between water and the plate is removed after a certain duration after dropping, and then the remaining deformation is measured. Optimized finite element models for drop simulations are selected via a mesh sensitivity study, and the simulation results are calibrated and compared with experimental data. Results of the simulation and the experiment show good agreement in general in terms of deflection range. However, because the initial condition of the plate is not reflected in the simulation, some discrepancy is observed in maximum deflections. Finally, a discussion is presented for a more accurate fluid impact analysis model based on the comparison results with the experimental data.
1. Introduction
Ships and offshore structures are subjected to impact loads such as slamming and sloshing. High impact pressures can cause permanent hull deformation in a single impact event [1,2]. In addition, significant fatigue damage can be accumulated via repeated impact pressure events [3,4].
For decades, researchers have experimentally investigated structural damage due to fluid impact [5,6,7,8,9]. Chuang [5,6] performed a series of wet drop tests on rigid and elastic flat-bottom plates to estimate peak pressure values. Based on the experimental results, a design load evaluation method that can reveal the plate thickness of the ship hull was presented. Shin et al. [3] investigated slamming impacts on flat bodies. They dropped a flat steel box onto water and investigated the deformation of the box.
Recently, numerous studies have been performed to evaluate plate slamming via numerical analysis techniques. This is because numerical analysis is less expensive and less time consuming than experiments and can be implemented to efficiently evaluate various situations [4,10,11]. Typically, numerical analysis for evaluating the soundness of a structure after slamming impacts is performed in two primary stages: fluid analysis and structural analysis. In fluid analysis, the slamming pressure exerted on the structure is calculated via computational fluid dynamics (CFD) simulation [12,13,14]. Liao et al. [15] investigated the slamming behavior of a trimaran in oblique regular waves using the CFD method. The analysis model was based on the unsteady Reynolds-averaged Navier–Stokes method combined with the realizable – turbulence model, and the results obtained were compared with those of conventional monohull ships.
Seo et al. [16] predicted slamming loads in large container ships via CFD simulation. They compared the slamming pressures obtained numerically with those obtained using an empirical formula provided by the Classification Society. Once the slamming pressure for a specific situation is determined numerically, the structural integrity can be evaluated by applying pressure to the target structure [17,18]. Yu et al. [19] proposed an analytical model to estimate the hydro-plastic response of beams and panels subjected to water slamming. They solved the proposed equation in a numerical way based on the fourth- order Runge–Kutta method and analyzed the results. Kim and Choung [20] evaluated the shock-resistance response of Frigate equipment caused by underwater explosion. They predicted the structural response to shock using a one-dimensional finite element model. Farhangi and Karakouzian [21] applied rehabilitation techniques to improve the structural resistance against slamming impact in a corrosive environment.
As the fluid flow field is affected by the solid boundary that is to be deformed in real time, the deformation of the solid boundary should be considered in CFD simulations. Therefore, two-way coupled fluid–structure interaction (FSI) analyses have been performed increasingly recently. Jang et al. [22] performed FSI analyses to analyze vortex-induced vibrations for ship rudder applications. They simulated the fluid flow on the rudder using an open-source CFD program and investigated the structural behavior using the finite element method (FEM). Hwang et al. [23] investigated the impact of thruster jet flow for ultra large container ships using the arbitrary Lagrangian–Eulerian (ALE) method. The ALE method combines the advantages of Lagrangian algorithms, which are typically used in solid mechanics, and Eulerian algorithms, which are primarily used in fluid dynamics. In the ALE method, the nodes of a mesh can be moved arbitrarily to manage significant distortions with high resolution [24].
Additionally, the coupled Eulerian–Lagrangian (CEL) method can be used for FSI applications [25,26,27]. The CEL method analyzes the structural behavior of a Lagrangian domain fluid flow in the Eulerian domain like the ALE method. However, the CEL method is different from the ALE method in that the fluid node and Euler mesh remain stationary while the material moves based on the Euler volume fraction. As the fluid mesh does not deform nor does it require remeshing, the computational cost can be reduced, and the fluid element distortion problem can be avoided. As the CEL method is based on an explicit time integration scheme based on operator splitting, its accuracy is relatively low compared with that afforded by conventional CFD simulations; however, it is gaining wide acceptance owing to the simplicity and efficiency of its numerical calculations [28].
There are many previous studies that calculate the sloshing pressure or evaluate the structural behaviors for a given sloshing impact pressure level; however, there are very limited studies available to deal with sloshing pressure and structural assessment simultaneously in single simulation. As it is very difficult to find a relevant method that satisfies analysis accuracy with time efficiency, it is necessary to find the strength and weakness of each method based on studies through various numerical analyses techniques. The CEL technique used in current study is particularly rare for sloshing simulations due to relatively less accuracy than conventional CFD for the fluid domain application; however, it is worthwhile to use the CEL method for structure design purpose.
In this study, the plastic deformation of a flat plate for a slamming impact was numerically investigated using the CEL method. The dynamic impact pressure of the flat plates by weight and drop height was investigated under the assumption of viscous and compressible fluids. To evaluate the plastic deformation of the plate, contact between water and the plate was removed after a certain duration after dropping, and then the remaining deformation was measured.
Optimized finite element models for the drop simulations were selected via a mesh sensitivity study, and the simulation results were calibrated and compared with the experimental data. Finally, a discussion is presented for a more accurate fluid impact analysis model based on the comparison results with the experimental data.
2. Materials and Methods
2.1. Experiments
In this study, numerical analysis was performed under the same shape and conditions as those used in an experiment by Shin et al. [3], and the results were compared with the experimental data. In the study by Shin et al. [3], a 2 m 1.2 m steel box was dropped from heights of 1 and 2 m into a 3 m 4 m rectangular water tank, as shown in Figure 1. To fix the top of the open-section box, six beams were attached to the top of the box, as shown in Figure 1b. They tested three different steel box thicknesses, i.e., 3, 5, and 8 mm. The principal dimensions of the steel boxes used in the experiments are listed in Table 1. More details regarding the experiment are available in previous publications by Shin et al. [3].
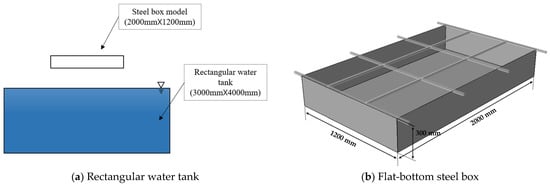
Figure 1.
Wet drop test setup [3].

Table 1.
Principal dimension of steel plate used in current study [3].
2.2. CEL Method
The slamming simulation of the steel plate included the significant deformation of a fluid, the stress analysis of the structure, and the contact between the fluid and structure. Modeling a fluid region using the classical traditional Lagrangian formulation, which is generally applicable for solid mechanics applications, is almost impossible owing to excessive distortion in the fluid element. Therefore, the fluid region is typically modeled using the Eulerian formulation, which can express the flow of matter within a fixed mesh system. A Lagrangian formulation, in which the nodes are fixed to the material and the element deforms against material deformation, is typically applied to calculate the stress and strain levels for a steel plate. In Eulerian analysis, a material is expressed using the volume-of-fluid technique, and the elements do not deform the material. In the Lagrangian method, the governing equation is based on momentum conservation.
The principle of virtual work in finite element methods for this study can be expressed as shown in Equations (1)–(3).
where V is the volume of the domain, the density, the stress, and the strain, the body force, the shear stress, S the surface, the internal force, and the external force.
In the FEM, the displacement, velocity, and acceleration are assumed to be interpolated from nodal values using the interpolation function NA, which is associated with node A, as expressed in Equation (4).
The inertial term in Equation (1) and external force in Equation (3) can be obtained using Equation (4), and the internal force in Equation (2) can be obtained by evaluating the virtual strain. One can refer to any standard text regarding the FEM for a detailed calculation process.
Three fundamental Lagrangian conservation equations, i.e., the conservation equations of mass, momentum, and energy for fluid motion, are presented in Equations (5)–(7), respectively. To translate the equations to Eulerian formulations, the relationship between the Lagrangian and Eulerian time derivatives should be determined using Equation (8) [29].
where denotes the material velocity; denotes the Cauchy stress; denotes the total energy per unit volume; is an arbitrary solution variable; and are the material and spatial–time derivatives of , respectively.
Equation (7) can be simplified using the strain rate tensor , as shown in Equation (9), because the internal energy is obtained by subtracting the kinetic energy from the total energy. Subsequently, the conservation equations with Eulerian time derivatives can be obtained, as shown in Equations (10)–(12).
To solve this problem, Equations (10)–(12) can be written in the general conservation form, as shown in Equation (13).
where is the flux term, and is the source term. In the CEL method, the operator split method is adopted to solve partial differential equations. This method separates Equation (13) into two equations, i.e., Equation (14) for the Lagrangian step involving the source term, and Equation (15) for the Eulerian step, which involves the convective term [21].
Figure 2 shows the operator split method for each step of the CEL method. The deformed mesh based on Equation (14) is remapped to the original position in the Eulerian fixed mesh based on Equation (15). The Lagrangian solution variables, such as mass, momentum, and energy, are adjusted for material flow between adjacent elements [30].
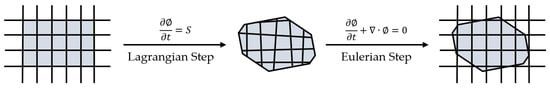
Figure 2.
Schematic representation of operator split method adapted from [22].
To describe the hydrodynamic response of water, a constitutive equation based on the governing equations shown in Equations (10) to (12) is required. The constitutive equation of water assumed in this study is shown in Equation (16).
where is the pressure at location x and time t, the dynamic viscosity of water, and R the strain-rate tensor.
The hydrodynamic properties of water can be described using an equation of state (EOS). ABAQUS/Explicit uses the Mie–Gruneisen EOS, as shown in Equation (17), with the linear Hugoniot form, as shown in Equation (18).
where denotes the pressure stress, which is defined as positive in compression; , where is a material constant, and is the reference density; is the internal energy per unit mass, where and are the Hugoniot pressure and specific energy, respectively; , with .
A typical fit to the Hugoniot data is shown in Equation (18).
where and relate the linear shock velocity and particle velocity , as shown in Equation (19).
By combining Equations (17) and (18), the linear Hugoniot form can be written as shown in Equation (20).
Equation (20) is simplified to Equation (21) by setting and [30].
Hence, the steel plate is modeled in the Lagrangian domain, whereas water is modeled in the Eulerian domain based on the Mie–Gruneisen EOS with the linear Hugoniot form.
3. Numerical Analysis
3.1. Finite Element Model
In this study, the CEL method was adopted to simulate the deformation of a plate against free fall into water using ABAQUS, which is a commercial finite element analysis program. The dynamic explicit solver of ABAQUS was applied for the simulation [30]. Figure 3 shows the computational domain and boundary conditions of the finite element model. Water, which undergoes a significant deformation, was modeled in the Eulerian domain, whereas the steel box, whose deformation was relatively insignificant, was modeled in the Lagrangian domain. Water was assumed to be viscous and compressible fluid. Air was not modeled separately, and the empty space was set to the initial void region. The displacement and rotation of the wall of the water tank were all fixed. The initial deformation condition of the steel plate was not considered in the simulation. In the simulation, to enable efficient calculations, the steel box was placed 0.001 m from the free water surface, and the secondary velocity considering the actual drop height, i.e., 1 or 2 m, was applied in the simulation. Both the water and steel box meshes were constructed with an optimized size via a mesh sensitivity study (see Section 3.2). The steel box was modeled using shell elements. The penalty contact method between the Lagrangian elements and the Eulerian elements was used in Abaqus.
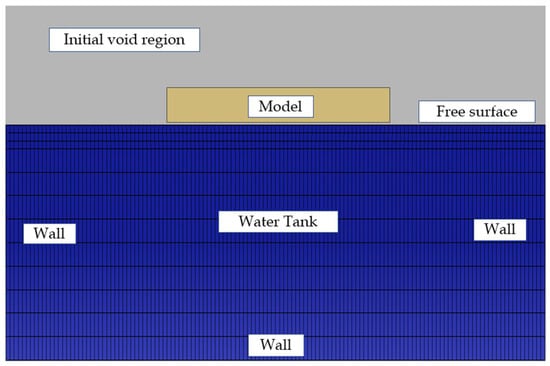
Figure 3.
Computational domain and boundary conditions.
The multilinear plasticity model was applied to the material model of the steel box, as shown in Figure 4 with Table 2, to calculate the amount of plastic deformation on the bottom plate due to impact after its fall onto the water tank. The material properties of each plate based on thicknesses of 3, 5, and 8 mm were obtained from Shin et al. [3].
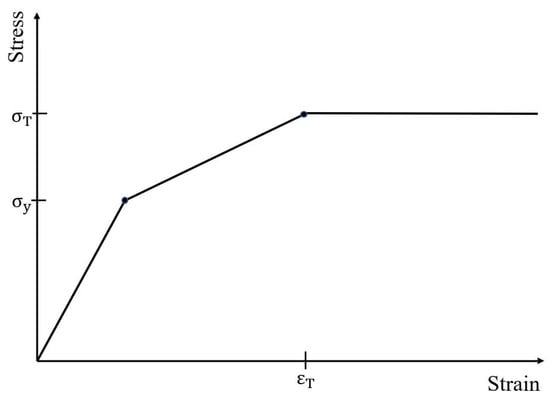
Figure 4.
Multilinear plasticity model for steel box.
Table 2.
Material properties for steel box [4].
The EOS was used to simplify the properties of water in terms of density and dynamic viscosity, as shown in Table 3. Furthermore, it was used to simulate the Navier–Stokes flow without considering turbulent flow. As the primary force component should be pressure for water impact, a suitable approximation can be obtained using this EOS [27].
Table 3.
EOS parameters for water [19].
The parameters for the speed of sound of water (c0), constant coefficient(s) of the impact velocity equation, and material constant () of the Gruneisen EOS are provided in Table 3 [27].
3.2. Mesh Sensitivity Study
In finite element analysis, a suitable mesh size must be determined as it significantly affects the analysis result. In particular, because the mesh size significantly affects the pressure exerting on the steel box, the stress, and the corresponding permanent deformation on the steel box, the optimal size must be determined via a sensitivity study.
In this study, a mesh sensitivity study was performed on water and steel box, as shown in Figure 5 and Figure 6, respectively. For the water model, the 25 and 12.5 mm meshes showed similar results.
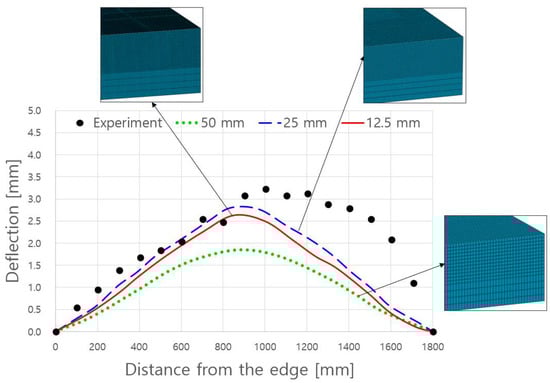
Figure 5.
Mesh sensitivity study for water model.
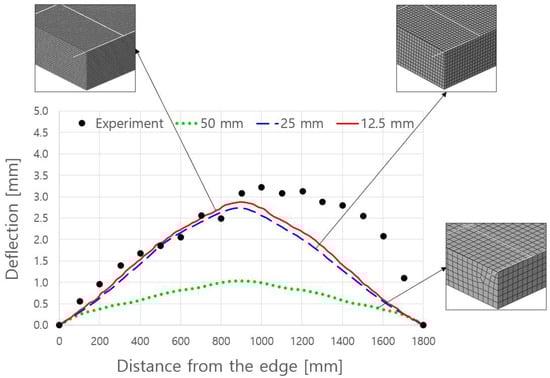
Figure 6.
Mesh sensitivity study for steel box model.
As the number of Eulerian elements significantly affects the overall calculation time, element size 25 mm was used in consideration of the calculation efficiency. Meanwhile, similar results were obtained for plate mesh sizes of 25 and 12.5 mm. The plate mesh did not significantly affect the overall analysis time; hence, 12.5 mm was selected as the mesh size for an accurate stress analysis. The deformation of the plate is indicated by the relative displacement, with both edges of the plate fixed at zero. The overall finite element model is shown in Figure 7.
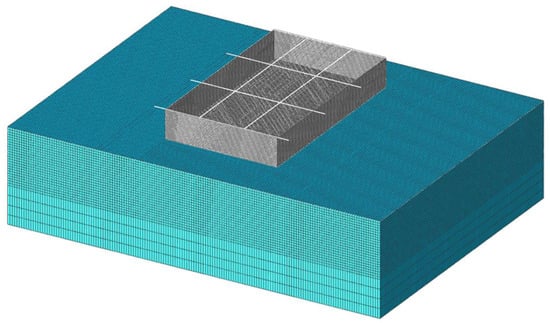
Figure 7.
Finite element model for wet drop test.
4. Analysis Results and Discussion
This section presents the results of the numerical simulations and a comparison between the numerical and experimental results.
Figure 8 shows images of the water–steel box interaction as time progresses for a drop height (h) of 2 m and a plate thickness (t) of 3 mm. Figure 9 shows the pressure value at each stage shown in Figure 8a–d, i.e., the pressure exerting on the center of the bottom plate.
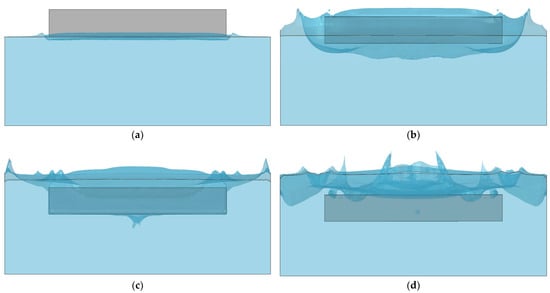
Figure 8.
Images of water–steel box interaction in CEL analysis (h: 2 m; t: 3 mm).
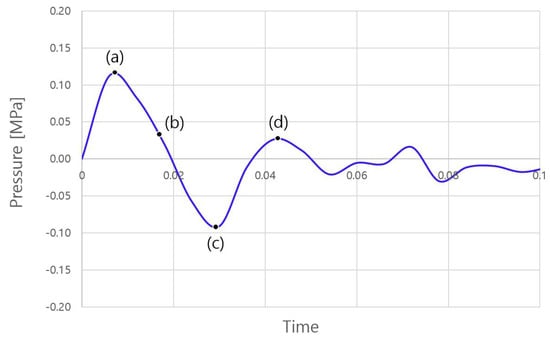
Figure 9.
Pressure time history for center of bottom plate (h: 2 m; t: 3 mm).
Two peak pressures were observed in the wet drop test of the flat plate owing to the air pocket effect immediately after immersion at the water surface. In general, the second peak pressure was higher than the first peak pressure owing to the air pocket effect. However, only one peak pressure response was observed in this study because no air pocket was considered.
The primary purpose of this study was to examine the plastic deformation of a plate during a slamming impact event. The plastic deformation of the plate was investigated after the dynamic impact of water on the plate had disappeared.
Figure 10 shows the plastic deformation contour in the vertical (plate thickness) direction. For comparison with the experimental results, the relative displacement was calculated by fixing both ends of the plate centerline to zero, as shown in Figure 11. The formula used to calculate the relative deformation is shown in Equation (22).
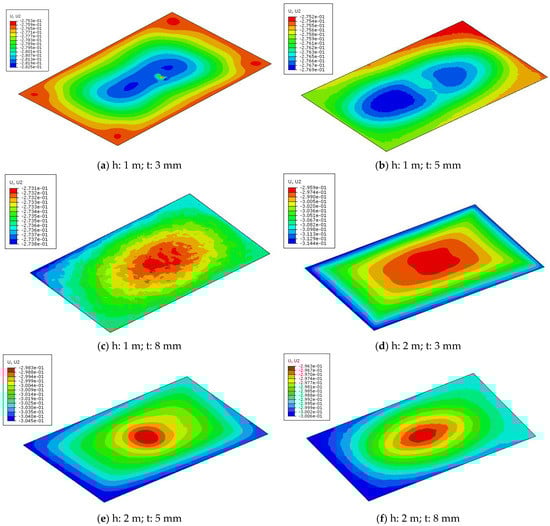
Figure 10.
Plastic deformation contour in vertical direction.
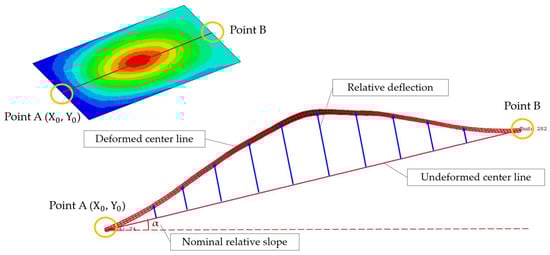
Figure 11.
Calculation of relative deformation.
Figure 12 shows a comparison of the simulated relative deformation results derived using Equation (22) with the experimental results. It is observed that the plate deformation becomes increased as drop height is higher and plate thickness is thinner. In addition, various deformation patterns were observed for experimental works; whereas simple deformation patterns were found in FE simulations.
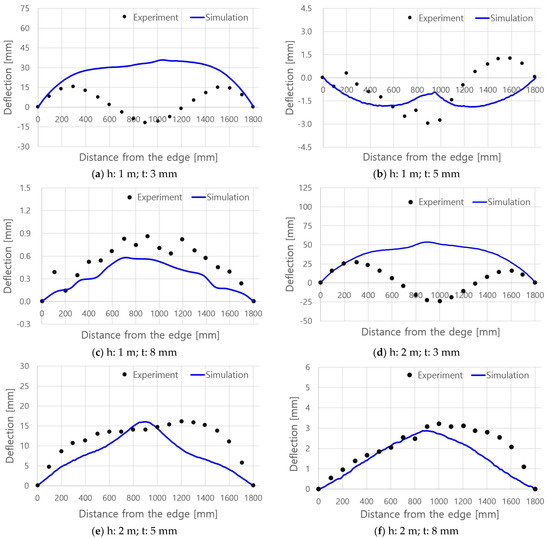
Figure 12.
Comparison of relative plastic deflections between experiment and simulation.
Figure 12c,e,f show excellent agreement in terms of deformation between the simulation and experimental results, i.e., one deformation peak, whereas Figure 12a,b,d show discrepancies between the simulation and experiment, i.e., different numbers of deformation peaks.
The different deformed shapes shown by the experimental and numerical results are thought to be attributable to the initial deformation, which was not reflected in this study. As the current test specimen is an unstiffened flat plate, the initial imperfection mode and shape significantly affect the dynamic structural behaviors.
If the initial imperfection mode of the test specimen shows a three-half-wave cycle pattern, then better simulation results can be expected by applying a similar initial imperfection pattern. However, the simulation results agreed well with the experimental results for cases involving a low amount of initial imperfection or a one-half wave cycle pattern of the initial imperfection.
Further study is required to accurately reflect the initial shape of the bottom plate before performing the simulation. In addition, the air pocket effect, which is primarily observed in the wet drop of a flat plate, is attributable to the difference between the experiment and simulation [31]. Generally, when a flat plate is dropped, an air pocket is generated in the middle, and the edges of the plate establish contact with water, which may change the deformation of the plate. In particular, the presence of air pockets can significantly affect the deformation of the plate, which exhibits an initial imperfection. In this study, an air pocket was not implemented because air was not considered in the simulation. Additional numerical studies are required to realize an air pocket by considering air, which is a compressible fluid.
The different deflection patterns between the experiments and simulations shown in Figure 12a,b,d are attributable to the different initial imperfection shapes; however, a comparison of the maximum deflection ranges, i.e., the difference between the maximum and minimum deformation for each case, indicates consistency between the simulation and experimental results, as shown in Figure 13a. Figure 13b shows the distribution of error rates for each case using a Box-Whisker plot. The mean and median of the error rates are approximately 22%, and the 75th percentile is 32%. However, all cases with a large error rate are the cases where the absolute value of deflection range is small, i.e., the error is less than 4 mm. It can be seen that the error rate is very low for relatively large deflection range. The effect of the initial deformation is considered to be larger when the amount of deformation is small due to the low drop height.
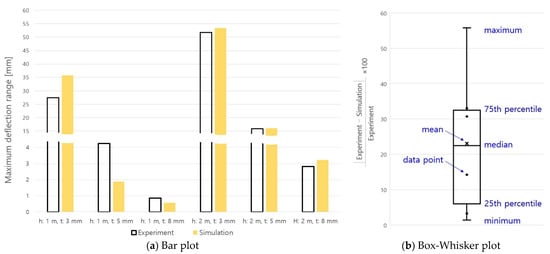
Figure 13.
Comparison of maximum deflection ranges.
Better predictions via simulations for slamming impact events are expected when the precise initial imperfection measurement and air pocket are considered.
5. Conclusions
In this study, the plastic deformation of a flat plate under slamming impact was investigated numerically. To simulate fluid–structure interactions, the CEL method, which combines the advantages of Eulerian and Lagrangian formulations, was applied, and the permanent deformation in the plate was measured and compared with previous experimental results. The following conclusions were obtained:
- Similar to the experiment, the simulation result showed that the relative deformation of the plate increased as the drop height increased and the plate thickness decreased. In the experiment, various patterns of deformation were observed, while the simulation results all showed deformation of the same shape.
- A comparison between the CEL-based simulation and experimental results indicated good agreement between them in terms of the maximum deflection range. Two cases (h: 1 m, t: 5 mm and h: 1 m, t: 8 mm) show relatively large differences, where the amount of deflection was small. The result of this study presents that the CEL technique is suitable for analyzing slamming impacts and the resulting deformation on a plate.
- Various shape deformations, i.e., deformed shapes with one or two peaks, were observed in the experiment, whereas the simulation results primarily indicated deformations with only one peak. The difference in the maximum deformation might be due to the difference in the deformation shape.
- Two additional studies can be performed in the future. One is to accurately measure the initial deformation of the plate before an experiment and apply it to a simulation study. This would allow various modes of deformation to be observed in the simulation. The other is to consider air pockets, which are primarily caused by the slamming of flat plates, in the simulation. In this regard, air, which is a compressible fluid, must be included in the analysis. By performing the two studies above, the deformation of the flat plate due to slamming can be predicted more accurately.
Author Contributions
Conceptualization, J.-H.K.; methodology, J.-H.K.; validation, Y.I.P.; formal analysis, S.-H.P.; investigation, S.-H.P.; writing—original draft preparation, Y.I.P.; writing—review and editing, Y.I.P.; visualization, S.-H.P.; supervision, J.-H.K.; project administration, J.-H.K.; funding acquisition, J.-H.K. All authors have read and agreed to the published version of the manuscript.
Funding
This work was supported by the Dong-A University research fund.
Institutional Review Board Statement
Not applicable.
Informed Consent Statement
Not applicable.
Data Availability Statement
The data presented in this study are available on request from the corresponding author.
Conflicts of Interest
The authors declare no conflict of interest.
References
- Yamamoto, Y.; Iida, K.; Fukasawa, T.; Murakami, T.; Arai, M.; Ando, A. Structural damage analysis of a fast ship due to bow flare slamming. Int. Shipbuild. Prog. 1985, 32, 124–136. [Google Scholar] [CrossRef]
- Buchner, B.; Voogt, A. Wave Impacts due to Steep Fronted Waves. In Proceedings of the Rogue Waves 2004, Brest, France, 20–22 October 2004. [Google Scholar]
- Shin, H.; Seo, B.; Cho, S.-R. Experimental investigation of slamming impact acted on flat bottom bodies and cumulative damage. Int. J. Nav. Arch. Ocean Eng. 2018, 10, 294–306. [Google Scholar] [CrossRef]
- Seo, B.; Truong, D.D.; Cho, S.; Kim, D.; Park, S.; Shin, H. A study on accumulated damage of steel wedges with dead-rise 10° due to slamming loads. Int. J. Nav. Arch. Ocean Eng. 2018, 10, 520–528. [Google Scholar] [CrossRef]
- Chuang, S.-L. Experiments on Flat-Bottom Slamming. J. Ship Res. 1966, 10, 10–17. [Google Scholar] [CrossRef]
- Chuang, S.L. Investigation of Impact of Rigid and Elastic Bodies with Water; Report 3248; Department of the Navy, Naval Ship Research and Development Center: Washington, DC, USA, 1970. [Google Scholar]
- Sayeed, T.M.; Peng, H.; Veitch, B. Experimental investigation of slamming loads on a wedge. In Proceedings of the MARTEC2010, the International Conference on Marine Technology, BUET, Dhaka, Bangladesh, 11–12 December 2010. [Google Scholar]
- Lewis, S.G.; Hudson, D.A.; Turnock, S.R.; Taunton, D.J. Impact of a free-falling wedge with water: Synchronized visualization, pressure and acceleration measurements. Fluid Dyn. Res. 2010, 42, 035509. [Google Scholar] [CrossRef]
- Jeong, Y.-J.; Choi, J.-M.; Kim, M.-S.; Kim, Y.-T.; Heo, W.-S.; Lee, J.-M. Evaluation of the pressure-resistance of the intersection of a Membrane-type primary barrier: Part 1 experimental study. J. Adv. Mar. Eng. Technol. 2020, 44, 203–209. [Google Scholar] [CrossRef]
- Luo, H.; Hu, J.; Soares, C.G. Numerical Simulation of Hydroelastic Responses of Flat Stiffened Panels under Slamming Loads. In Proceedings of the ASME 29th International Conference on Ocean, Offshore and Arctic Engineering, Shanghai, China, 6–11 June 2010. [Google Scholar]
- Chakma, P.; Lee, Y.W. Numerical investigation on incompressible fluid flow and heat transfer of porous media using Lattice Boltzmann method. J. Korean Soc. Mar. Eng. 2021, 45, 181–193. [Google Scholar] [CrossRef]
- Lee, G.N.; Duong, T.T.; Jung, K.H.; Suh, S.B.; Lee, J.Y. Study on PIV-Based Pressure Estimation Method of Wave Loading under a Fixed Deck. J. Ocean Eng. Technol. 2020, 34, 419–427. [Google Scholar] [CrossRef]
- Huo, F.; Yang, H.; Yao, Z.; An, K.; Xu, S. Study on Slamming Pressure Characteristics of Platform under Freak Wave. J. Mar. Sci. Eng. 2021, 9, 1266. [Google Scholar] [CrossRef]
- Yongxing, Z.; Kim, D.-J. Optimization Approach for a Catamaran Hull Using CAESES and STAR-CCM+. J. Ocean Eng. Technol. 2020, 34, 272–276. [Google Scholar] [CrossRef]
- Liao, X.; Chen, Z.; Gui, H.; Du, M. CFD Prediction of Ship Seakeeping and Slamming Behaviors of a Trimaran in Oblique Regular Waves. J. Mar. Sci. Eng. 2021, 9, 1151. [Google Scholar] [CrossRef]
- Seo, D.W.; Jeon, G.Y.; Song, K.H. A Comparative Study on the Prediction of Bow Flare Slamming load using CFD and Prescript Formula for the Container Ship. J. Adv. Res. Ocean Eng. 2018, 4, 204–206. [Google Scholar]
- American Bureau of Shipping, Strength assessment of membrane type LNG containment systems under sloshing loads. ABS Guidance Notes, 2006. Available online: https://ww2.eagle.org (accessed on 1 March 2022).
- Jeong, Y.; Choi, J.; Kim, M.; Kim, Y.; Heo, W.; Lee, J. Evaluation of the pressure-resistance of the intersection of a Membrane-type primary barrier: Part 2 finite element analysis. J. Adv. Mar. Eng. Technol. 2020, 44, 210–217. [Google Scholar] [CrossRef]
- Yu, Z.; Amdahl, J.; Greco, M.; Xu, H. Hydro-plastic response of beams and stiffened panels subjected to extreme water slamming at small impact angles, Part I: An analytical solution. Mar. Struct. 2019, 65, 53–74. [Google Scholar] [CrossRef]
- Kim, H.; Choung, J. Shock-Resistance Responses of Frigate Equipments by Underwater Explosion. J. Ocean Eng. Technol. 2022, 36, 161–167. [Google Scholar] [CrossRef]
- Farhangi, V.; Karakouzian, M. Effect of Fiber Reinforced Polymer Tubes Filled with Recycled Materials and Concrete on Structural Capacity of Pile Foundations. Appl. Sci. 2020, 10, 1554. [Google Scholar] [CrossRef] [Green Version]
- Jang, W.-S.; Hong, S.-Y.; Song, J.-H.; Kwon, H.-W.; Choi, W.-S. Study on Vortex-Induced Vibration Predictions for Ship Rudders. J. Ocean Eng. Technol. 2020, 34, 325–333. [Google Scholar] [CrossRef]
- Hwang, T.; Yeom, G.-S.; Seo, M.; Lee, C.; Lee, W.-D. Impact of the Thruster Jet Flow of Ultra-large Container Ships on the Stability of Quay Walls. J. Ocean Eng. Technol. 2021, 35, 403–413. [Google Scholar] [CrossRef]
- Donea, J.; Huerta, A.; Ponthot, J.-P.; Rodríguez-Ferran, A. Arbitrary Lagrangian-Eulerian methods. In Encyclopedia of Computational Mechanics; Wiley: Hoboken, NJ, USA, 2004; Volume 1, Chapter 14; pp. 413–437. [Google Scholar]
- Shin, M.-B.; Park, D.-S.; Seo, Y.-K. Comparative Study of Ice Gouge Simulation Considering Ice Keel-Seabed Interactions. J. Ocean Eng. Technol. 2019, 33, 556–563. [Google Scholar] [CrossRef] [Green Version]
- Valdi, M.H.T.; Atrechian, M.R.; Shalkoohy, A.J.; Chavoshi, E. Numerical Investigation of Water Entry Problem of Pounders with Different Geometric Shapes and Drop Heights for Dynamic Compaction of the Seabed. Geofluids 2018, 2018, 5980386. [Google Scholar] [CrossRef] [Green Version]
- Ahmadzadeh, M.; Saranjam, B.; Fard, A.H.; Binesh, A. Numerical simulation of sphere water entry problem using Eulerian–Lagrangian method. Appl. Math. Model. 2014, 38, 1673–1684. [Google Scholar] [CrossRef]
- Benson, D.J. Computational methods in Lagrangian and Eulerian hydrocodes. Comput. Methods Appl. Mech. Eng. 1992, 99, 235–394. [Google Scholar] [CrossRef]
- Ragab, M.; Liu, H.; Yang, G.-J.; Ahmed, M.M.Z. Friction Stir Welding of 1Cr11Ni2W2MoV Martensitic Stainless Steel: Numerical Simulation Based on Coupled Eulerian Lagrangian Approach Supported with Experimental Work. Appl. Sci. 2021, 11, 3049. [Google Scholar] [CrossRef]
- Dassault Systèmes Simulia Corp, 2014. Abaqus 6.14 Theory Manual. Available online: https://blogs.3ds.com (accessed on 3 March 2022).
- O’Connor, C.; Mohajernasab, S.; Abdussamie, N. Numerical investigation into water entry problems of a flat plate with air pockets. J. Ocean Eng. Sci. 2022, in press. [CrossRef]
Publisher’s Note: MDPI stays neutral with regard to jurisdictional claims in published maps and institutional affiliations. |
© 2022 by the authors. Licensee MDPI, Basel, Switzerland. This article is an open access article distributed under the terms and conditions of the Creative Commons Attribution (CC BY) license (https://creativecommons.org/licenses/by/4.0/).