Article

3R Composites: Knockdown Effect Assessment and Repair Efficiency via Mechanical and NDE Testing

by
Maria Kosarli
1,*,
Georgios Foteinidis
1,
Kyriaki Tsirka
1,
Nerea Markaide
2,
Alaitz Ruiz de Luzuriaga
2,
Diego Calderón Zapatería
3,
Stefan Weidmann
4 and
Alkiviadis S. Paipetis
1,*
1
Department of Materials Science and Engineering, University of Ioannina, 45110 Ioannina, Greece
2
CIDETEC, Basque Research and Technology Alliance (BRTA), Paseo Miramon 196, 20014 Donostia-San Sebastian, Spain
3
IDEC, Engineering Composites Advanced Solution, C/Albert Einstein 29, 01510 Minano Menor, Spain
4
Manufacturing Science, Leibniz-Institut für Verbundwerkstoffe GmbH, 67663 Kaiserslautern, Germany
*
Authors to whom correspondence should be addressed.
Appl. Sci. 2022, 12(14), 7269; https://doi.org/10.3390/app12147269
Submission received: 3 June 2022 / Revised: 15 July 2022 / Accepted: 18 July 2022 / Published: 19 July 2022
(This article belongs to the Special Issue Composite and Smart Materials: Theory, Methods and Applications)

Abstract

:
In this study, the mechanical properties of purposefully synthesized vitrimer repairable epoxy composites were investigated and compared to conventional, commercial systems. The purpose was to assess the knockdown effect, or the relative property deterioration, from the use of the vitrimer in several testing configurations. Mechanical tests were performed using ILSS, low-velocity impact, and compression after impact configurations. At modeled structure level, the lap strap geometry that can simulate the stiffening of a composite panel was tested. Several non-destructive evaluation techniques were utilized simultaneously with the mechanical testing in order to evaluate (i) the production quality, (ii) the damage during or after mechanical testing, and (iii) the repair efficiency. Results indicated that the new repairable composites had the same mechanical properties as the conventional aerospace-grade RTM6 composites. The electrical resistance change method proved to be a valuable technique for monitoring deformations before the initiation of the debonding and the progress of the damage with consistency and high sensitivity in real time. In terms of repair efficiency, the values ranged from 70% to 100%.

1. Introduction

Composite materials are used more and more in aerospace industries as primary or secondary parts replacing metals [1]. Their constantly growing demand in industrial applications led the scientific community to the development of advanced composite configurations [2]. These advanced composites can satisfy all the essential requirements for use in aeronautics and simultaneously possess multiple functionalities (multi-functional composites) [3,4]. The prerequisites for advanced composites, apart from high specific properties, are typically high fracture toughness and good fatigue performance. On the other hand, advanced functionalities include structural health monitoring (SHM) capability [5,6,7], electromagnetic shielding [8], energy harvesting [9,10,11,12], and self-healing capability [13,14,15,16,17,18,19].
Besides the advantages of composites, the heterogeneity of their structure leads to more complicated damage mechanisms than typical isotropic materials as metals [20,21]. One of the most important damage types in composite laminates is caused by impacts, and more specifically, low-velocity impact. This type of damage may be due to random and typically underrated events such as tool dropdown [22]. Typically, these impacts cause delaminations that are not, or are barely, visible (BVID: barely visible impact damage) matrix cracking, or even fiber breakages [23,24]. For the detection of BVID, non-destructive evaluation techniques (NDE) such as the IR-thermography [25,26] and ultrasonics [27] are used on the composite parts. These techniques can also be employed for the evaluation of any repair process performed on the damaged part or structure [28,29].
The repair of thermoset epoxy polymers and composites is challenging. The chemical bonds formed after the polymerization are irreversible; thus, the repair is problematic or even impossible [23]. Except for the conventional and well-known self-healing methods (extrinsic or intrinsic) [30], a new category of thermoset epoxy resins, called vitrimers, is nowadays being developed and studied. These epoxies have all the advantages of thermoplastics as they are re-processable, repairable, and recyclable by introducing dynamic covalent bonds into their polymeric network [31]. In vitrimers, permanent crosslinks are replaced with exchangeable bonds that can rearrange thermally (or under another stimulus) via dissociative or associative mechanism [32]. At a specific temperature, above the glass transition temperature (Tg), or topology freezing temperature (Tv), these bonds can rearrange to repair resin/fiber delaminations and resin microcracks in the damaged part [33]. On the other hand, vitrimers retain the properties of the typical thermoset under service temperature, such as the resistance to environmental degradation, the good thermal properties, and, more crucially, their high mechanical properties [34,35]. Ruiz de Luzuriaga et al. [36,37] developed a new epoxy vitrimer resin called 3R (re-processable, repairable, recyclable) resin. The vitrimer 3R resin was, for the first time, applied at the manufacturing of fiber-reinforced composites using standard and well-known processes.
In this study, in order to assess and establish the vitrimer 3R technology, the fracture mechanisms of commercial (composites manufactured with a typical aerospace grade resin) and 3R epoxy composites were investigated and compared. Specifically, the relative property deterioration, henceforth called the “knockdown effect”, was assessed in relation to the mechanical properties for several testing configurations. The knockdown effect is defined as the percentage change of the initial mechanical properties of a commercial composite material after the incorporation of a repair technology. Numerous well-established geometries were tested, such as the interlaminar shear strength (ILSS), the low-velocity impact, and the compression after impact configuration. At modeled structure level, the lap strap geometry that can simulate the stiffening of a composite panel was examined [36]. The previous tests were employed on both conventional and 3R carbon fiber-reinforced polymers (CFRPs). To evaluate the repair efficiency, the above tests were performed before and after repair, to estimate the ability of the 3R resin to regain its initial mechanical properties. Additionally, several NDE techniques were employed concurrently with mechanical testing to assess the repair efficiency of the 3R composites, including IR-thermography, electrical resistance change method (ERCM), impedance spectroscopy, acoustic emission (AE), and phased array ultrasonics. These techniques were employed offline and online to evaluate (i) the production quality, (ii) the damage during or after mechanical testing, and (iii) the repair efficiency.

2. Materials and Methods

2.1. Materials

The CHOMARAT 5HS carbon fabric C-WEAVE™ 280SA5 T800HB 6K 40B-5HS ×125 cm with binder veil Spunfab 118CHQ 4 g/m2 1 face was used as reinforcement. For the conventional panels, the aerospace-graded RTM6 epoxy resin supplied from Hexcel was selected. The 3R panels were manufactured using a vitrimer epoxy resin developed by CIDETEC for this purpose. It is formulated to fulfil the requirements of the aerospace and it is based on a mixture of the monomers Tetraglycidyl-4,4′ methylene dianiline (TGMDA) and Bisphenol F diglycidyl ether (BFDGE), and the hardener 4-Aminophenyl disulfide (4-AFD).

2.2. Composites Manufacturing

2.2.1. Conventional (RTM6) Panels

Conventional panels were manufactured with the resin transfer molding (RTM) process. The lamination sequence was [(±45)/(0/90)]4s. The resin (RTM6) was preheated to eliminate air bubbles. The injection of the resin was performed with a pressure of up to 3 bar. Curing took place at 180 °C for 1.5 h. Once the curing process was finished, the tooling was left to cool down at room temperature. The panel was extracted and cut at the desired dimensions for each test.

2.2.2. 3R Panels

The lamination was [(±45)/(0/90)]4s while the 3R resin was preheated at 70 °C under magnetic stirring. The part B (hardener) was then added to the beaker and left for stirring for approximately 10 min. The manufacturing process was the hand layup method on a hot substrate. With the help of a roller tool, pressure was applied to ensure proper impregnation with the resin. Curing took place at 130 °C for 1 h and at 180 °C for 0.5 h in a hot press according to the optimized curing profile of the 3R resin, as provided by the manufacturer. The force of the applied pressure was at 30 kN. The panels were then left to cool down to ambient and cut at the necessary dimensions for each test.

2.3. Equipment for the Mechanical Characterization

2.3.1. Interlaminar Shear Strength (ILSS) Testing

The ILSS tests took place on a Universal Testing Machine WDW-100 by Jinan S.A. with a 100 kN loadcell. The selected displacement rate was 1 mm/min. The interlaminar shear strength was evaluated by the short beam shear geometry according to ASTM D2344. The maximum strength (MPa) was estimated from Equation (1):
Strength ILSS = 0.75 Pmax/(b h)
where Pmax is the maximum load (N), b is the width of the specimen (mm), and h is the specimen thickness (mm).

2.3.2. Low-Velocity Impact Testing

The low-velocity impact was realized with an Instron Ceast 9340 Drop Tower equipped with a 45 kN loadcell and a 16 mm hemispherical impactor with a mass of 2.5 kg. Two impact energies were selected at 9 J and 15 J. The dimensions of each specimen were 100 × 150 mm according to ASTM D7136. The mechanical knockdown effect and the repair efficiency (at 3R specimens) were evaluated in terms of maximum impact load (kN) and absorbed energy (J). The absorbed energy was calculated from the area under the load–displacement curve.

2.3.3. Compression after Impact (CAI) Testing

CAI experiments were performed on a Universal Testing Machine WDW-100 by Jinan S.A. equipped with a 100 kN loadcell according to ASTM D7137. The displacement rate was set at 1.25 mm/min. The dimensions of each specimen were recorded. Each specimen was clamped in an in-house CAI fixture that did not allow the sample to slide or move. Half of the impacted 3R specimens (at each energy level) were subsequently tested for compression after impact (CAI), and the rest of them were repaired and tested again (impact damage and CAI). The mechanical knockdown effect and the repair efficiency (of the 3R specimens) were evaluated in terms of maximum CAI load (kN) and CAI strength (MPa). The maximum CAI strength (MPa) was estimated from Equation (2):
Strength CAI = P_max/(w × h)
where P is the maximum load (N), w is the width of the specimen (mm), and h is the thickness of the specimen (mm).

2.3.4. Lap Strap Testing

Lap strap is a geometry that can simulate the stiffening of a composite panel and can be used in order to reduce materials consumption and simplify the geometry by replacing stringer run-out configuration [38]. The method employed a simplified joint configuration usually referred to as lap strap geometry. This geometry comprises two parts, the lap and the strap, bonded together with either a 3R or conventional resin adhesive layer. During the test procedure, the lap initially debonds from the strap and then the delamination propagates further in the interply plane in the strap. It should be mentioned that failure in the lap strap geometry is manifested in mixed mode. However, at the early stages of the test, the adhesive layer between the lap and the strap fails in mode II, followed by mode I failure at higher stress levels [38]. The dimensions and the geometry are depicted in Figure 1. Mechanical testing was performed with an Instron 8001 Universal Testing Machine with a 100 kN loadcell. The selected displacement rate was 1 mm/min under tensile load, and the test was stopped when the first small drop of the load occurred, whereby the initiation of the debonding of the lap from the strap happened. The stress was calculated as the ratio of the load to the cross-sectional area (thickness × width) and the strain as the ratio of the extension to the grip-to-grip distance. The mechanical knockdown effect and the repair efficiency (of the 3R specimens) were evaluated in terms of maximum stress (MPa).
For the structural health monitoring in lap strap specimens, ERCM was utilized simultaneously with mechanical testing. Figure 2 shows the lap strap geometry and the spots where the ERCM electrodes were attached.
Exploiting the electrical properties of the carbon fibers and the highly electrically insulating epoxy matrix, electrical NDE methods can be utilized for the (i) stain sensing and (ii) damage monitoring on CFRPs. At the early stages of the lap strap test, the specimen is under tensile loading. Although the carbon fibers have piezoresistive properties as a typical strain gage, i.e., the electrical resistance increases when the fibers are subjected to tensile strain, the total behavior at composite level is highly dependent on the electrical anisotropy of the composite. In a typical unidirectional composite, the resistance is expected to increase with tensile strain [39]. However, there is always the possibility that tensile strain increases the possibility of interfiber contact which potentially could reduce the resistance [40,41]. In the presence of out-of-axis laminae such as ±45 plies, this effect is more prominent as the fibers tend to align themselves with the loading axis during testing and, thus, the probability of the establishment of random contacts between the fibers is definitely increased [40]. As a result, these phenomena cause a decrease in the electrical resistance in the thickness direction which may surpass the strain-induced increase in the reinforcement material.
On the other hand, when microcracks and delaminations are induced in the matrix of the composite, the network of fiber contact is disrupted and the length of the conductive path increases, leading to an increase in the electrical resistance. This increase is described in Figure 2B,C, whereby the conductive path between the two electrodes is marked with red arrows. Before debonding, the conductivity occurs through the shortest path, which is a straight line between the electrodes (Figure 2B). After debonding of the lap from the strap, the shortest possible conductive path is described by the curved arrow in Figure 2C. This phenomenon triggers an increase in resistance due to the appearance of damage [39,40].
In all cases, in the employed geometry and independently of the resistance change which depends on the lamination of the composite, the delamination is expected to be manifested as a discontinuity in the resistance vs. time curve.

2.4. Non-Destructive Evaluation Techniques

2.4.1. Acoustic Emission (AE)

The AE activity was recorded online during each test using one wideband AE sensor (R-15-ALPHA, Physical Acoustics Corp., PAC, Princeton, NJ, USA). The coupling between the sensor and the specimen was achieved by applying a thin layer of ultrasonic gel. The pre-amplifier gain was set to 40 dB. The threshold was also set to 40 dB in order to avoid the possibility of electronic/environmental noise. The AE signals were recorded in a two-channel monitoring board PCI-2, PAC with a sampling rate of 5 MHz.

2.4.2. IR-Thermography

For the acquisition of the thermal response of the CFRP laminates, an FLIR A6750 MWIR camera was utilized, with a resolution of 640 × 512 pixels and a 125 Hz frame rate. For the application of the pulsed thermography method, two 1000 W IR lamps were used as the heating source, triggered by a Tektronix AFG3052C signal generator. The ramp pulse had a duration of 7 s, and the peak-to-peak voltage was 7 V. The distance between the specimen and the lamp was 1 m, equal to the distance between the specimen and the camera.

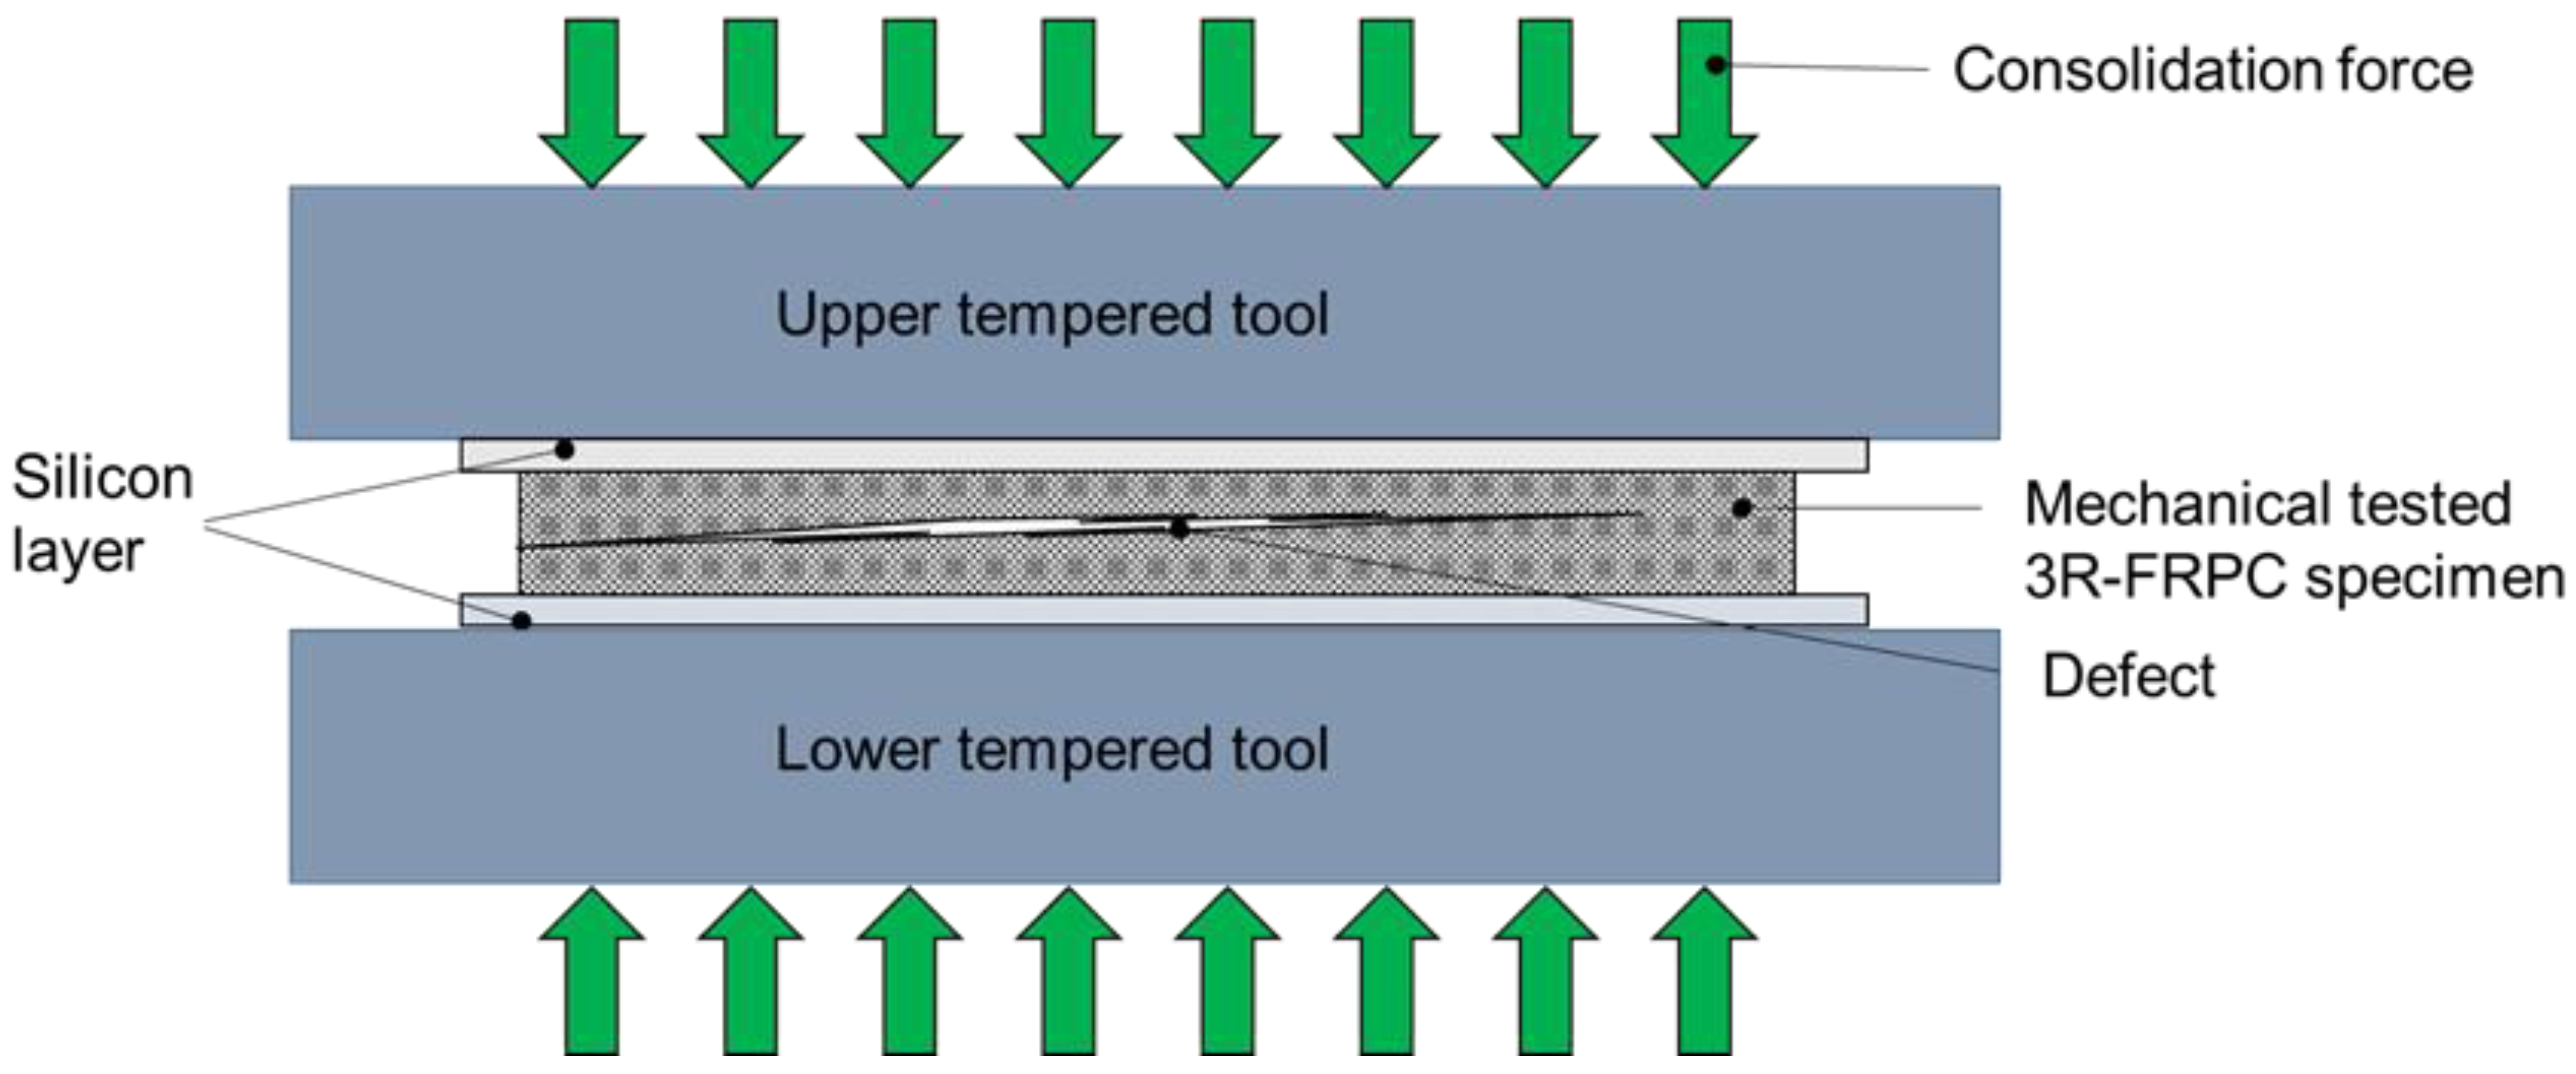
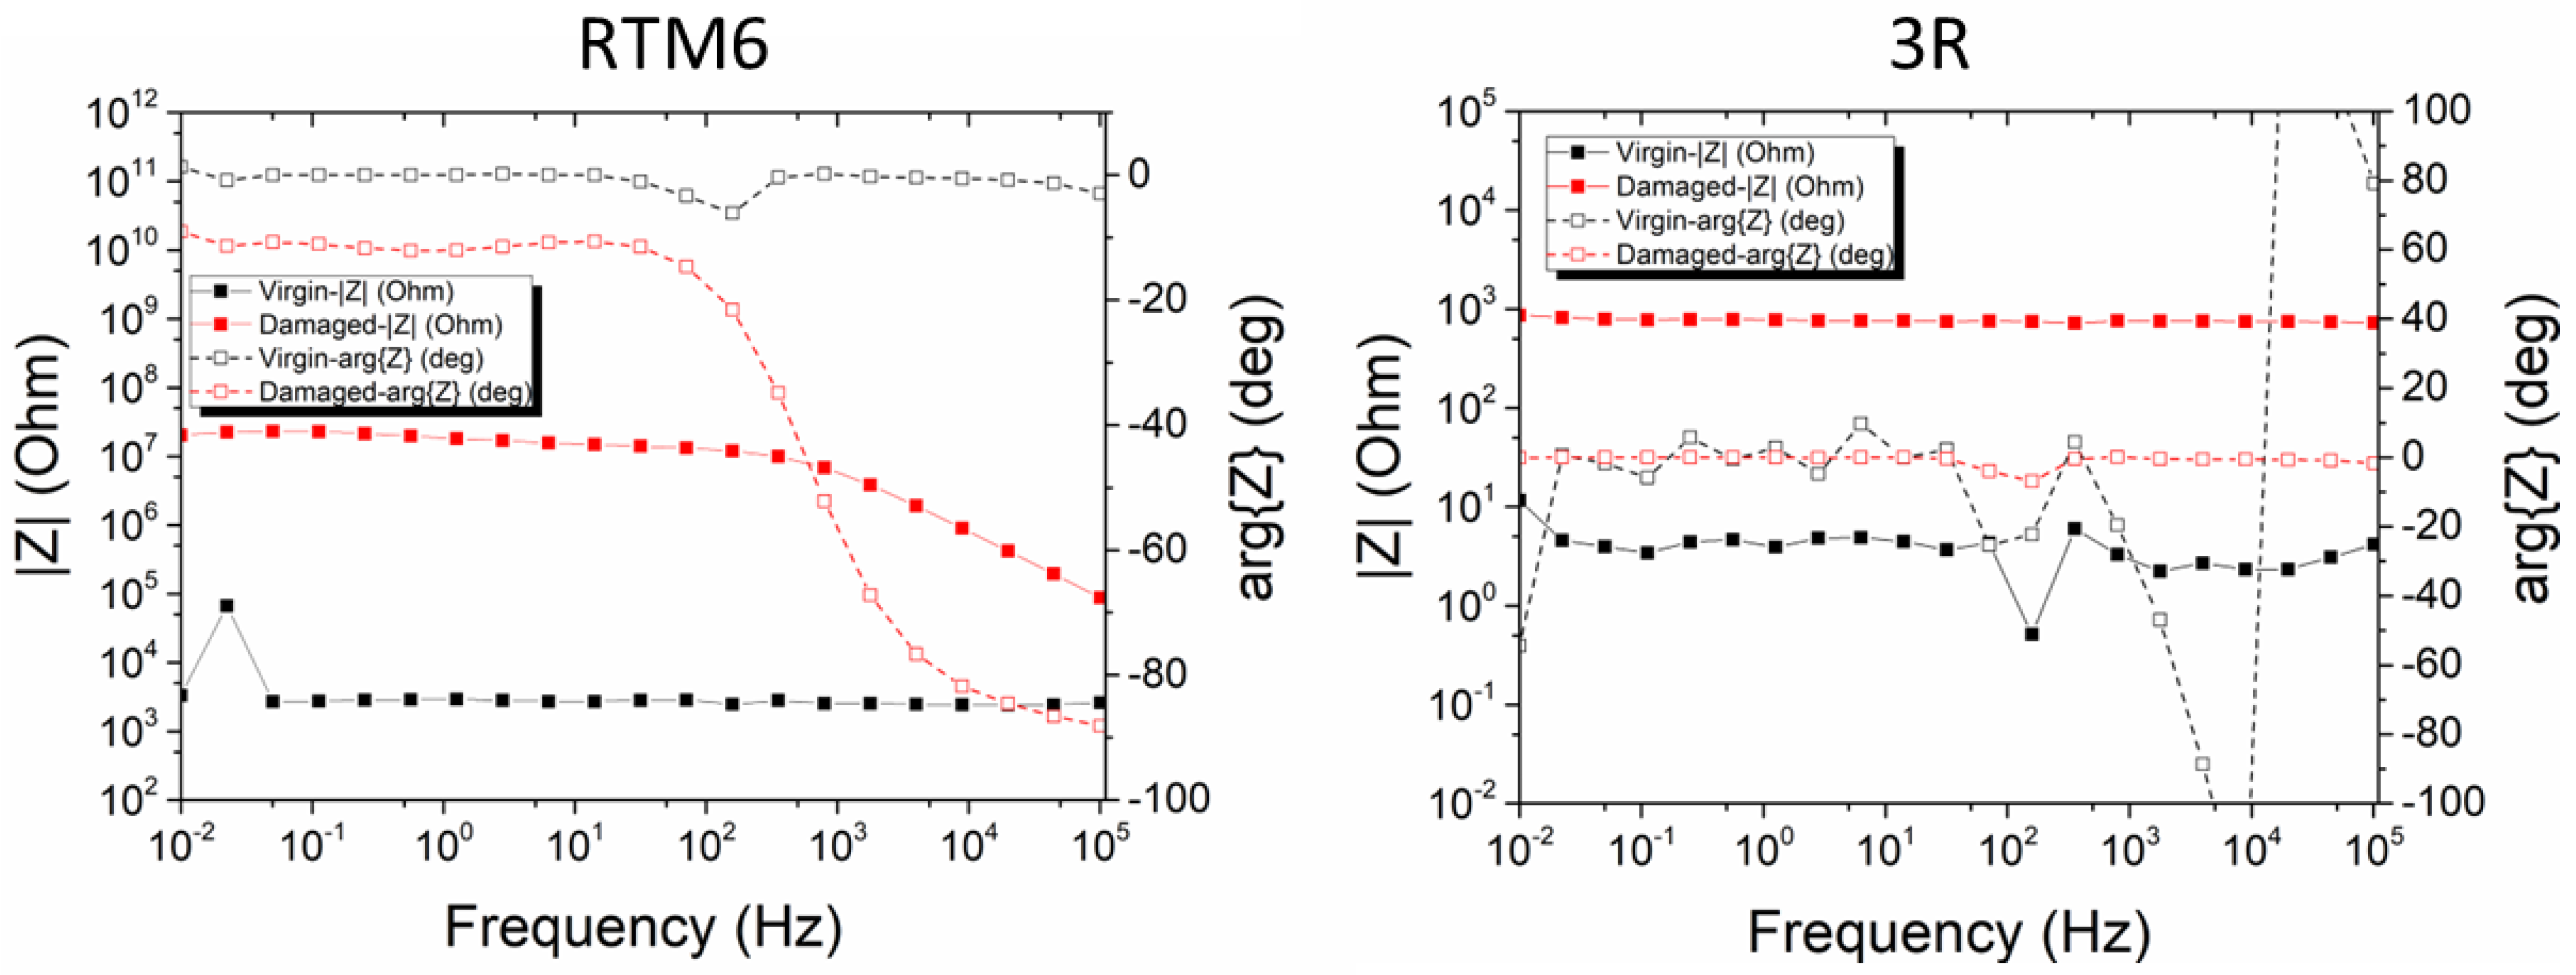
2.4.3. Impedance Spectroscopy

Impedance measurements were performed using the Advanced Dielectric Thermal Analysis System (DETA-SCOPE) supplied by ADVISE, Chios, Greece. The specimens were placed between two parallel copper plates with dimensions of 52 mm × 12 mm. A sinusoidal voltage of 10 V was applied to the capacitor. Scans were performed between two frequency values (0.01 Hz to 100 kHz). All measurements were performed at a constant temperature, namely, 21 ± 0.1 °C, monitored by an EXTECH VIR50 IR thermometer.

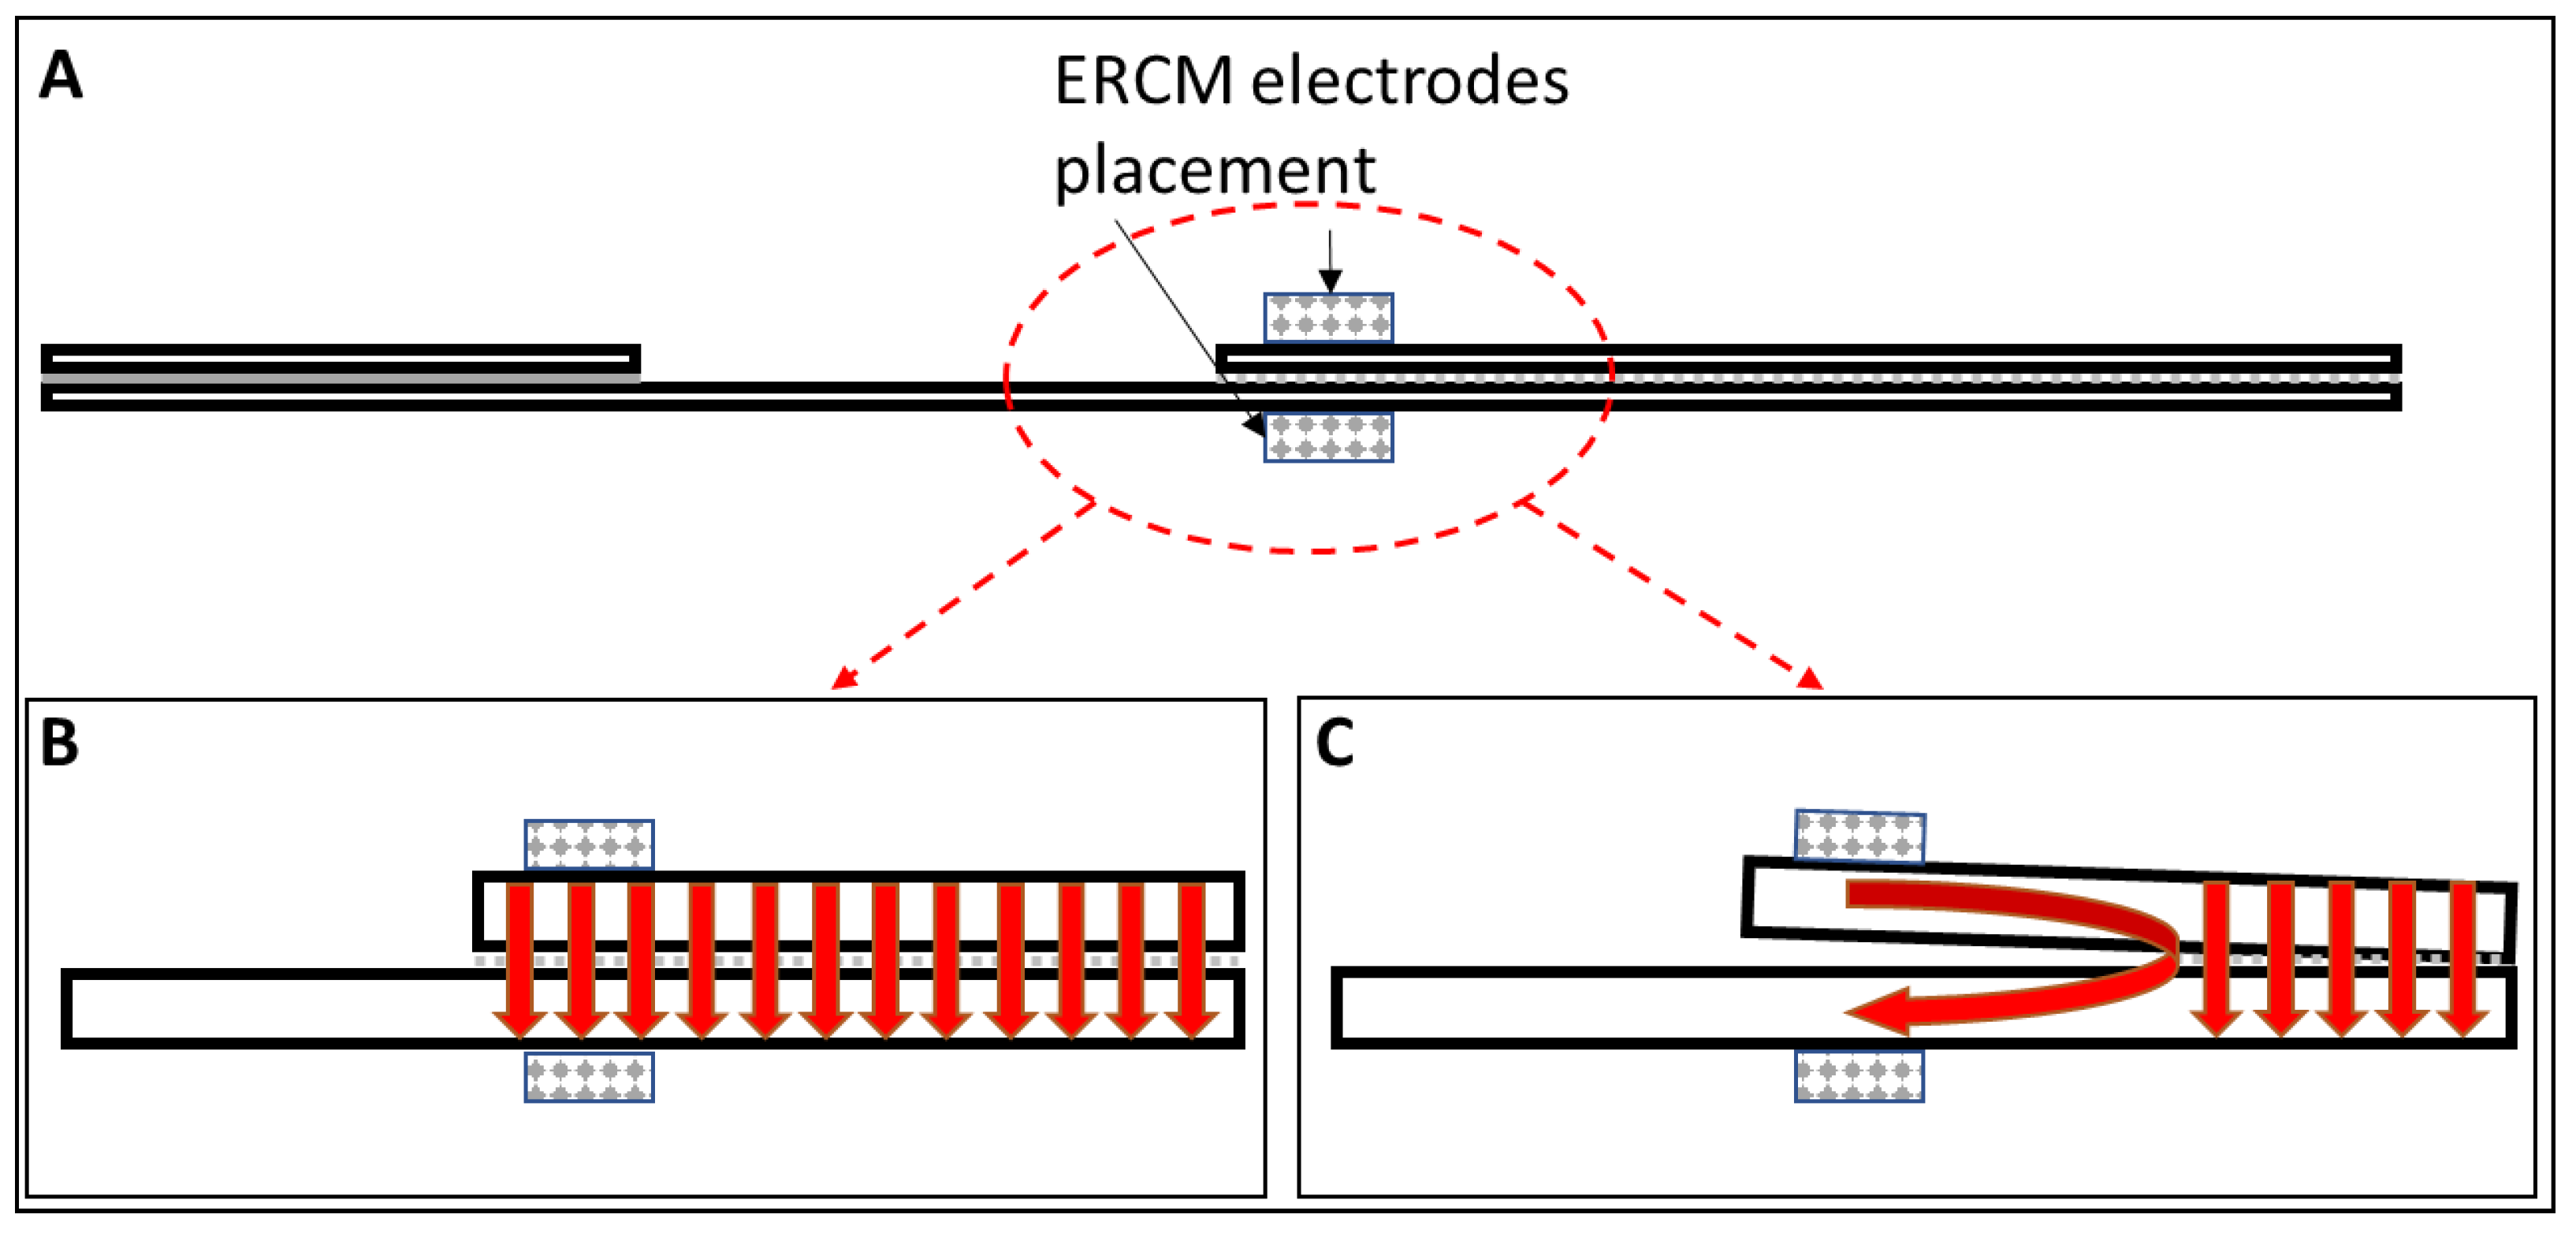
2.4.4. Electrical Resistance Change Method

For the measurements of the electrical resistance, a two-probe multimeter (Agilent 34401A, Santa Clara, CA, USA) was utilized.

2.4.5. Phased Array Ultrasonic Imaging
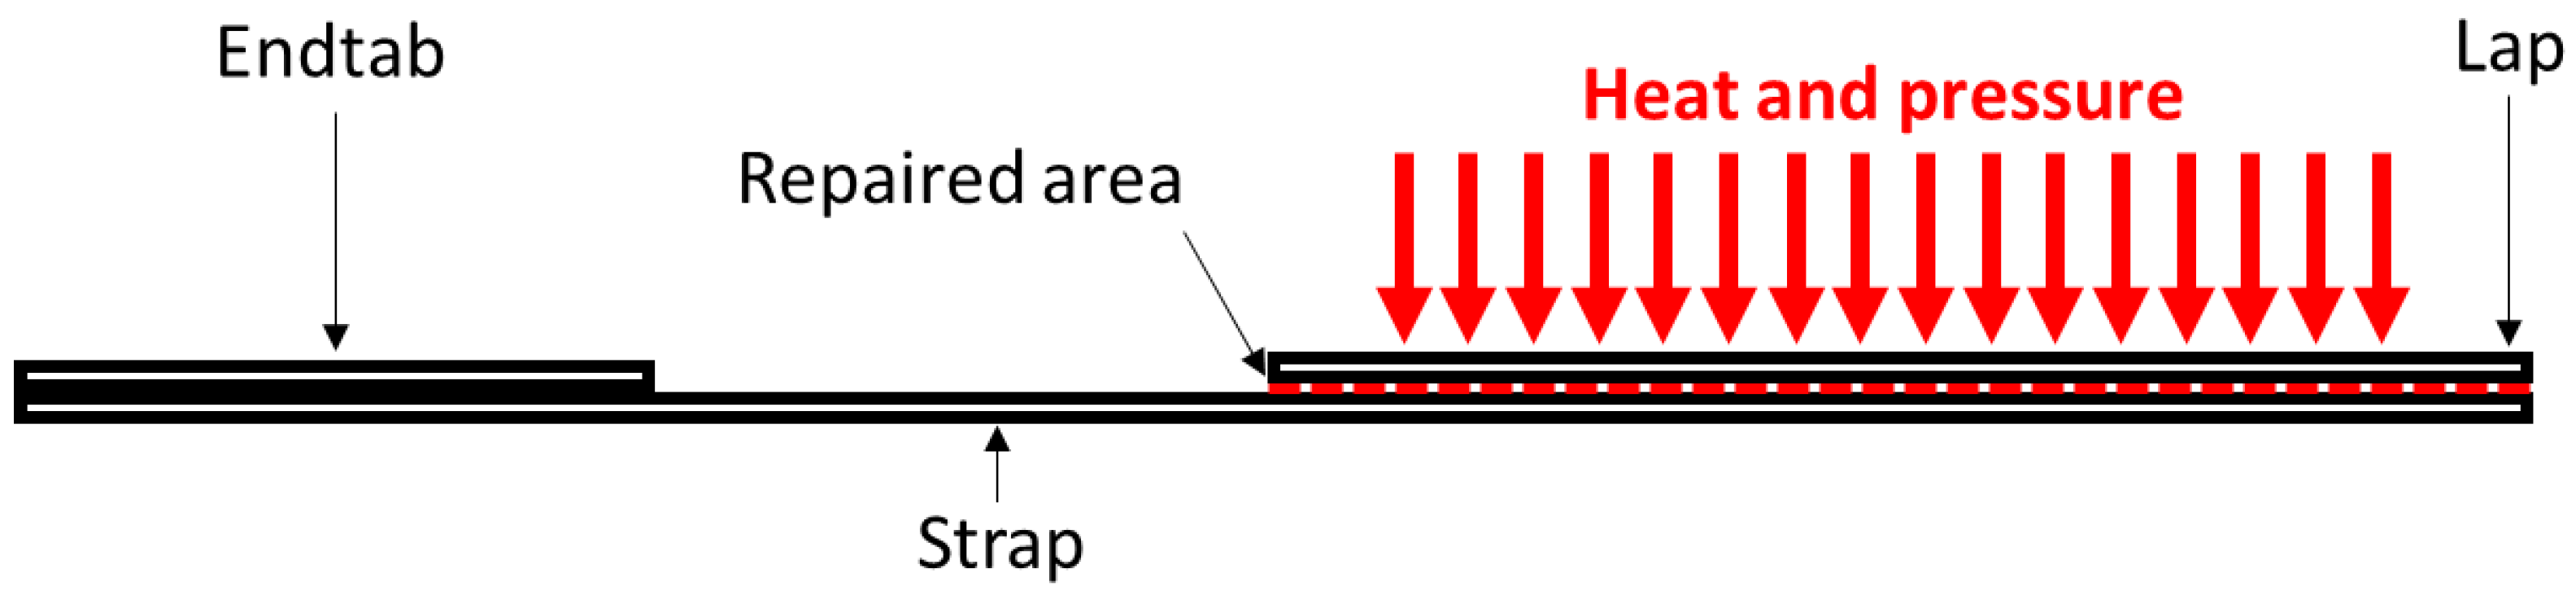
The inspection of the composites was performed using a Dolphicam2 phased array ultrasonic imaging platform. The frequency range was from 0.5 to 15 MHz, while the transducer electrode had a resolution of 128 × 128 elements. The gates were selected to be from 1 mm to 5 mm (specimen thickness). For the capturing of larger images than the size of the transducer, the in-built stitching function was used. The coupling between the sensor and the specimen was achieved by applying a thin layer of ultrasonic gel.

2.5. Repair Process

The damaged specimens were placed in a hot press between two high-temperature-resistant silicone layers (HT 60 WHT silicone sheet, thickness 1.5 mm, provided by MVQ-Silicones, Weinheim, Germany). After placing the specimens in the press, the press was closed, and pressure was applied (Figure 3). As soon as the consolidation pressure was fully applied, the upper and lower press tools were heated to repair the specimens. The repair temperature was set at 220 °C, the holding time of the repair temperature was 2 h, and the consolidation pressure on the specimen area caused by the consolidation force was 2 MPa. The thickness of the test specimens did not change during the repair process due to the high fiber volume content of 73% and the high viscosity of the resin. After the holding time, the specimens were cooled down at constant consolidation pressure. When room temperature was reached, the test specimens were removed from the press.

2.6. Evaluation of the Knockdown Effect and Repair Efficiency

The knockdown effect is defined as the percentage change of the initial mechanical properties of a commercial composite material after the incorporation of a repair technology, as mentioned above. The evaluation of the knockdown effect was performed according to Equation (3).
Knockdown effect, k% = 1 − (Mechanical property of a 3R composite/
Mechanical property of a commercial composite) × 100%
The repair efficiency is defined as the ability of a 3R composite to regain its initial mechanical properties [13,14,15,16,17,18,19] and is calculated according to Equation (4).
Repair efficiency, n% = (Mechanical property of a repaired 3R composite/
Mechanical property of an initial 3R composite) × 100%

3. Results and Discussion
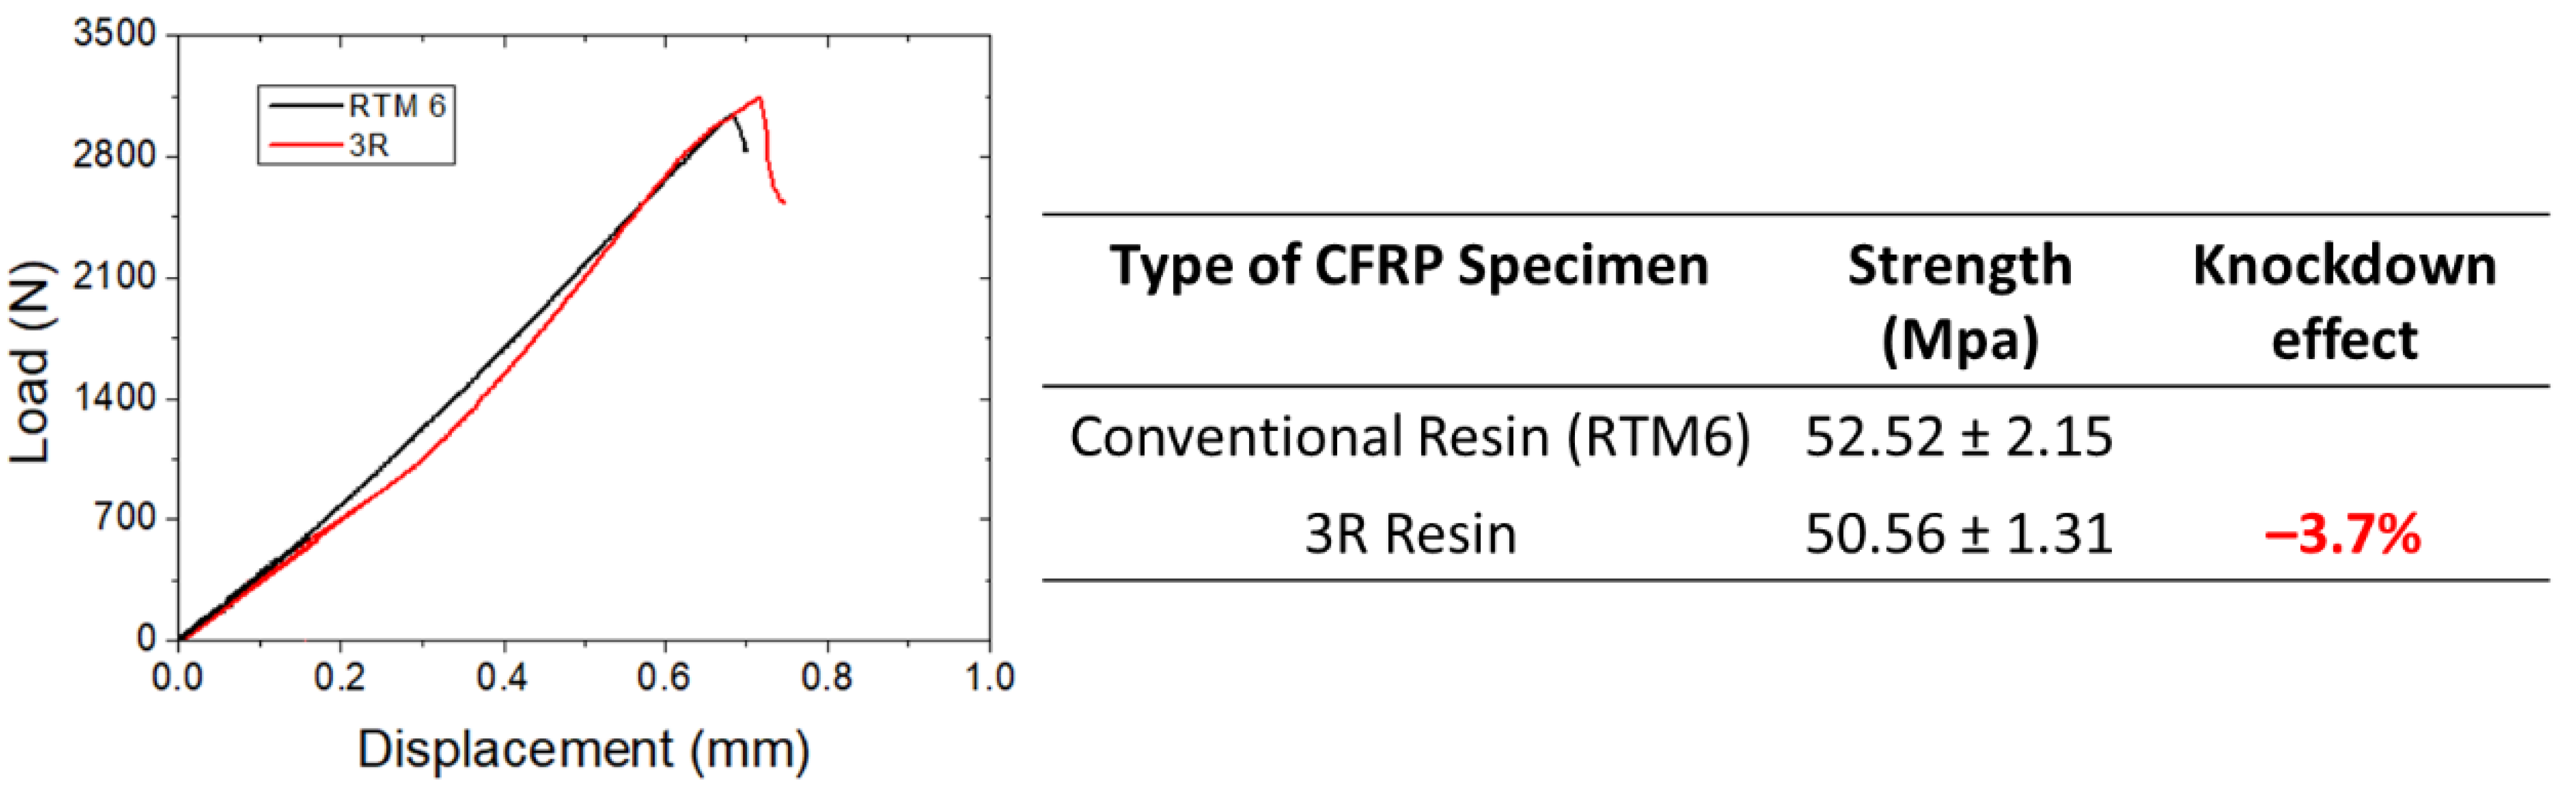
3.1. ILSS Geometry

3.1.1. Knockdown Effect on Mechanical Properties

Figure 4 depicts representative ILSS plots and the average maximum strength of both types of specimens. A negligible knockdown effect of −3.7% in the average maximum strength was calculated, which indicates that the usage of 3R vitrimer resin as matrix did not lead to any significant deterioration in comparison to the conventional aerospace matrix in terms of ILSS.

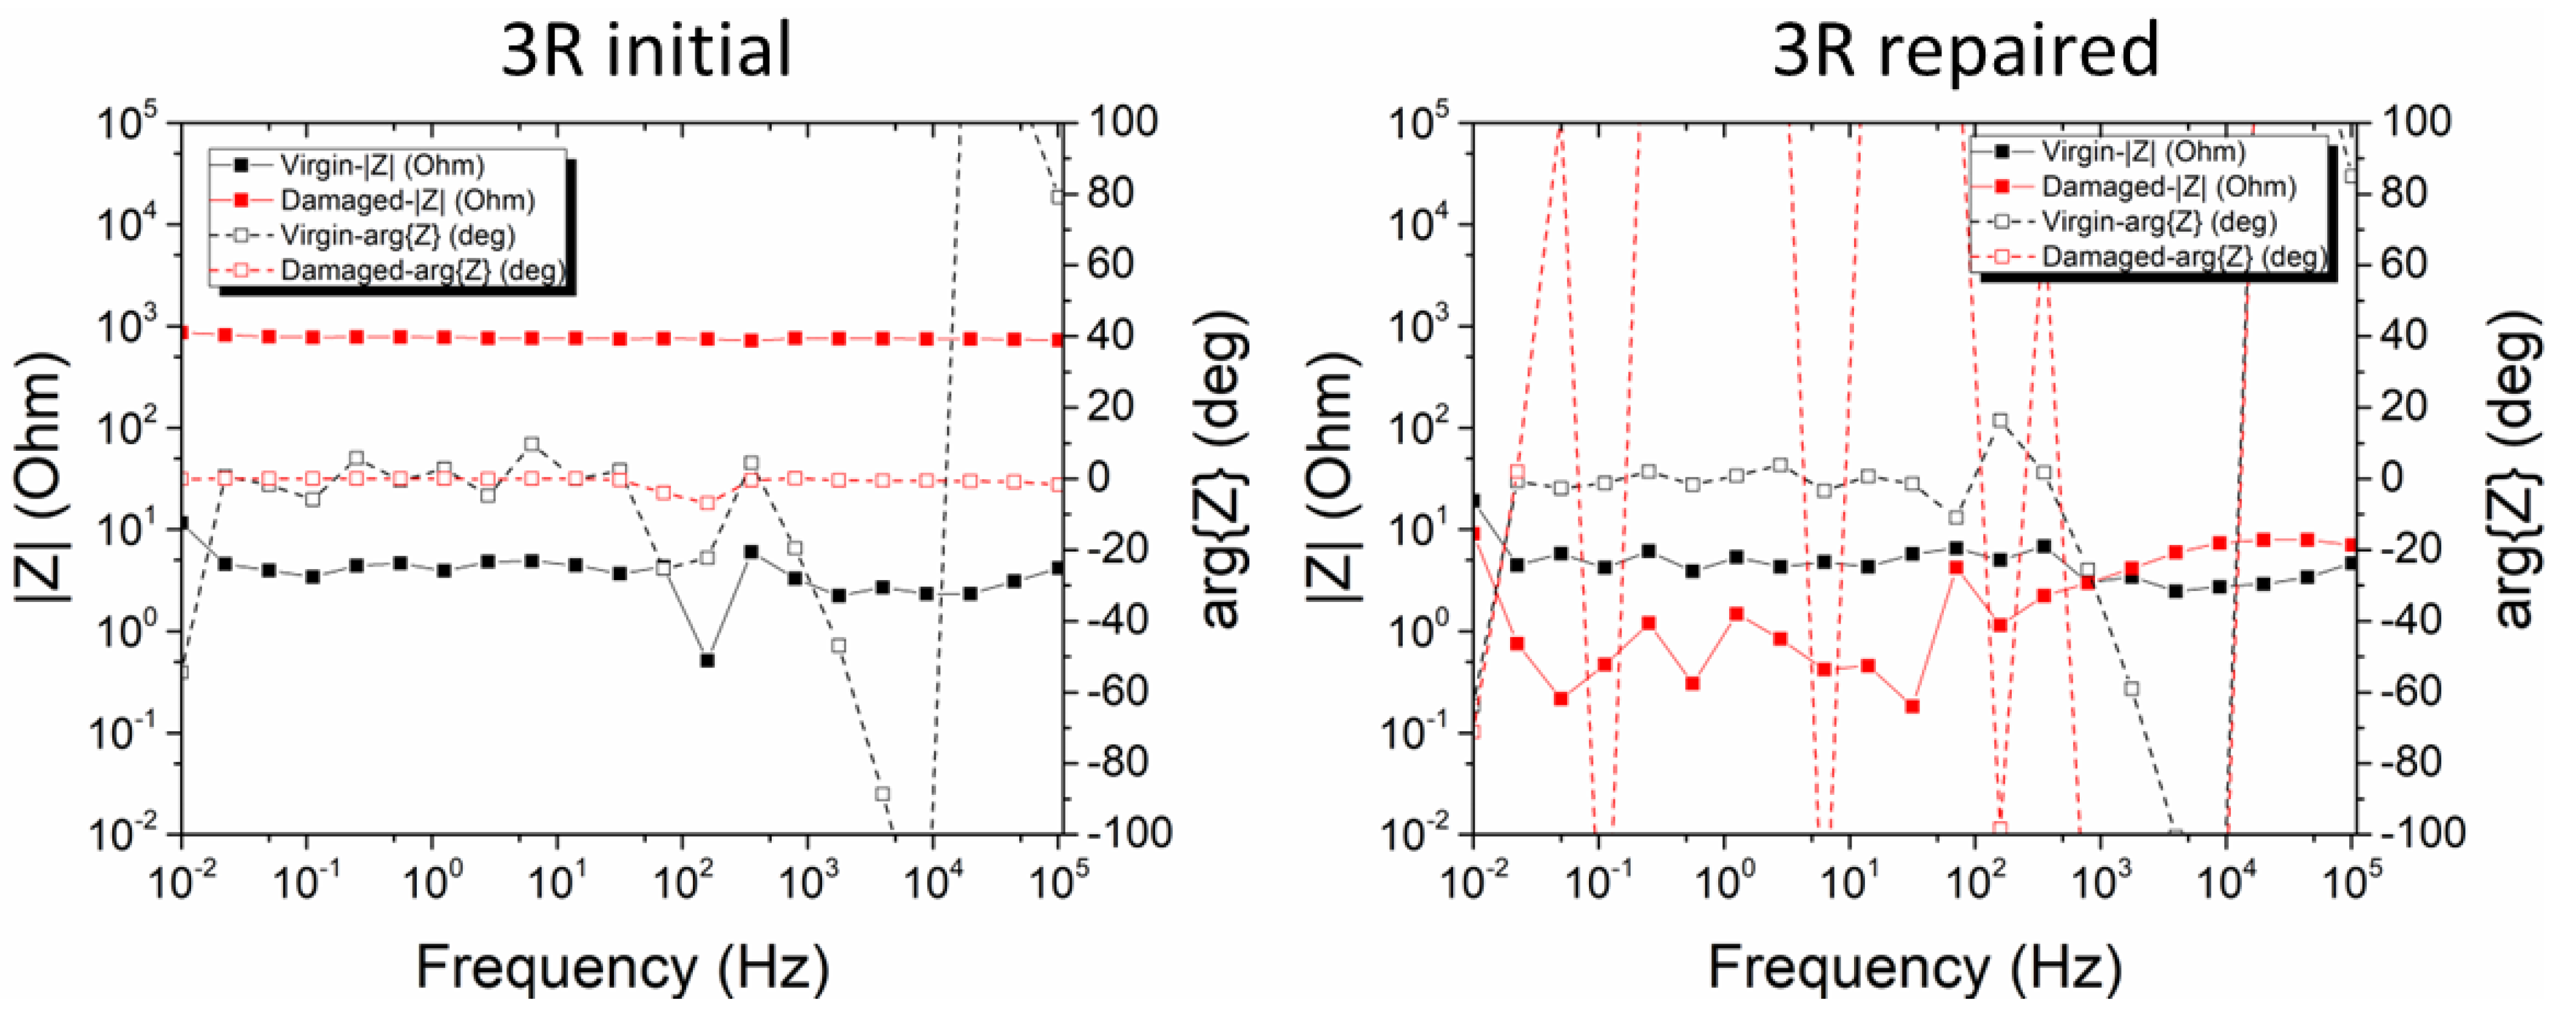
3.1.2. Non-Destructive Evaluation via Impedance Spectroscopy

Impedance spectroscopy (IS) was utilized to assess the manufacturing and the damage of the ILSS specimens. Figure 5 (left) shows representative IS results of an RTM6 ILSS specimen before and after the mechanical test. The magnitude of the impedance of the virgin specimen (black curve with filled squares) was ca. 103 ohms and exhibited an ohmic behavior (independent of the frequency), as indicated by the fact that the phase remained near 0° (black curve with unfilled squares). This behavior is indicative of good resin impregnation which prevents or better limits direct contact of the conductive carbon fiber reinforcement which would lead to an electric shortcut and much lower impedance values. The subsequent introduction of damage caused an increase in the magnitude of the impedance by four orders of magnitude (red curve with filled squares). A transition from ohmic to non-ohmic behavior also appeared in the plot at 1 kHz and was depicted by a decrease of the magnitude of the impedance at 1 kHz frequency and onwards (red curve with filled squares). This was also confirmed by a shift in the phase from almost −10° to −90° (red curve with unfilled squares), which reveals that capacitive phenomena occurred in this frequency range. This is a typical behavior that accompanies the introduction of damage, i.e., delaminations, microcracks, etc., in composite materials, as the trapped air disrupts the pre-existing conductive path [7].
On the other hand, the 3R ILSS specimen exhibited distinctly different behavior. In Figure 5 (right), the magnitude of the impedance of the virgin specimen (black curve with filled squares) fluctuated at a few ohms, and the phase curve (black curve with unfilled squares) fluctuated around 0°, accompanied by significant noise as the recorded values were beyond the lower detection limit of the experimental equipment. This indicates that in this case, the conductive carbon fibers presented a significant number of interfiber contacts which in turn implies poor wetting/impregnation by the 3R resin. Ultrasonic inspection and IR-thermography results presented in Section 3.2.2 confirmed the existence of poor wetting areas (dry spots).
After the mechanical test, the magnitude of the impedance increased by two orders of magnitude (red curve with filled squares) as a result of the introduction of air and the reduction of the contact area between the plies of the laminate (fewer spots of contact between CFs). The phase remained around 0°, revealing a purely ohmic behavior (red curve with unfilled squares).

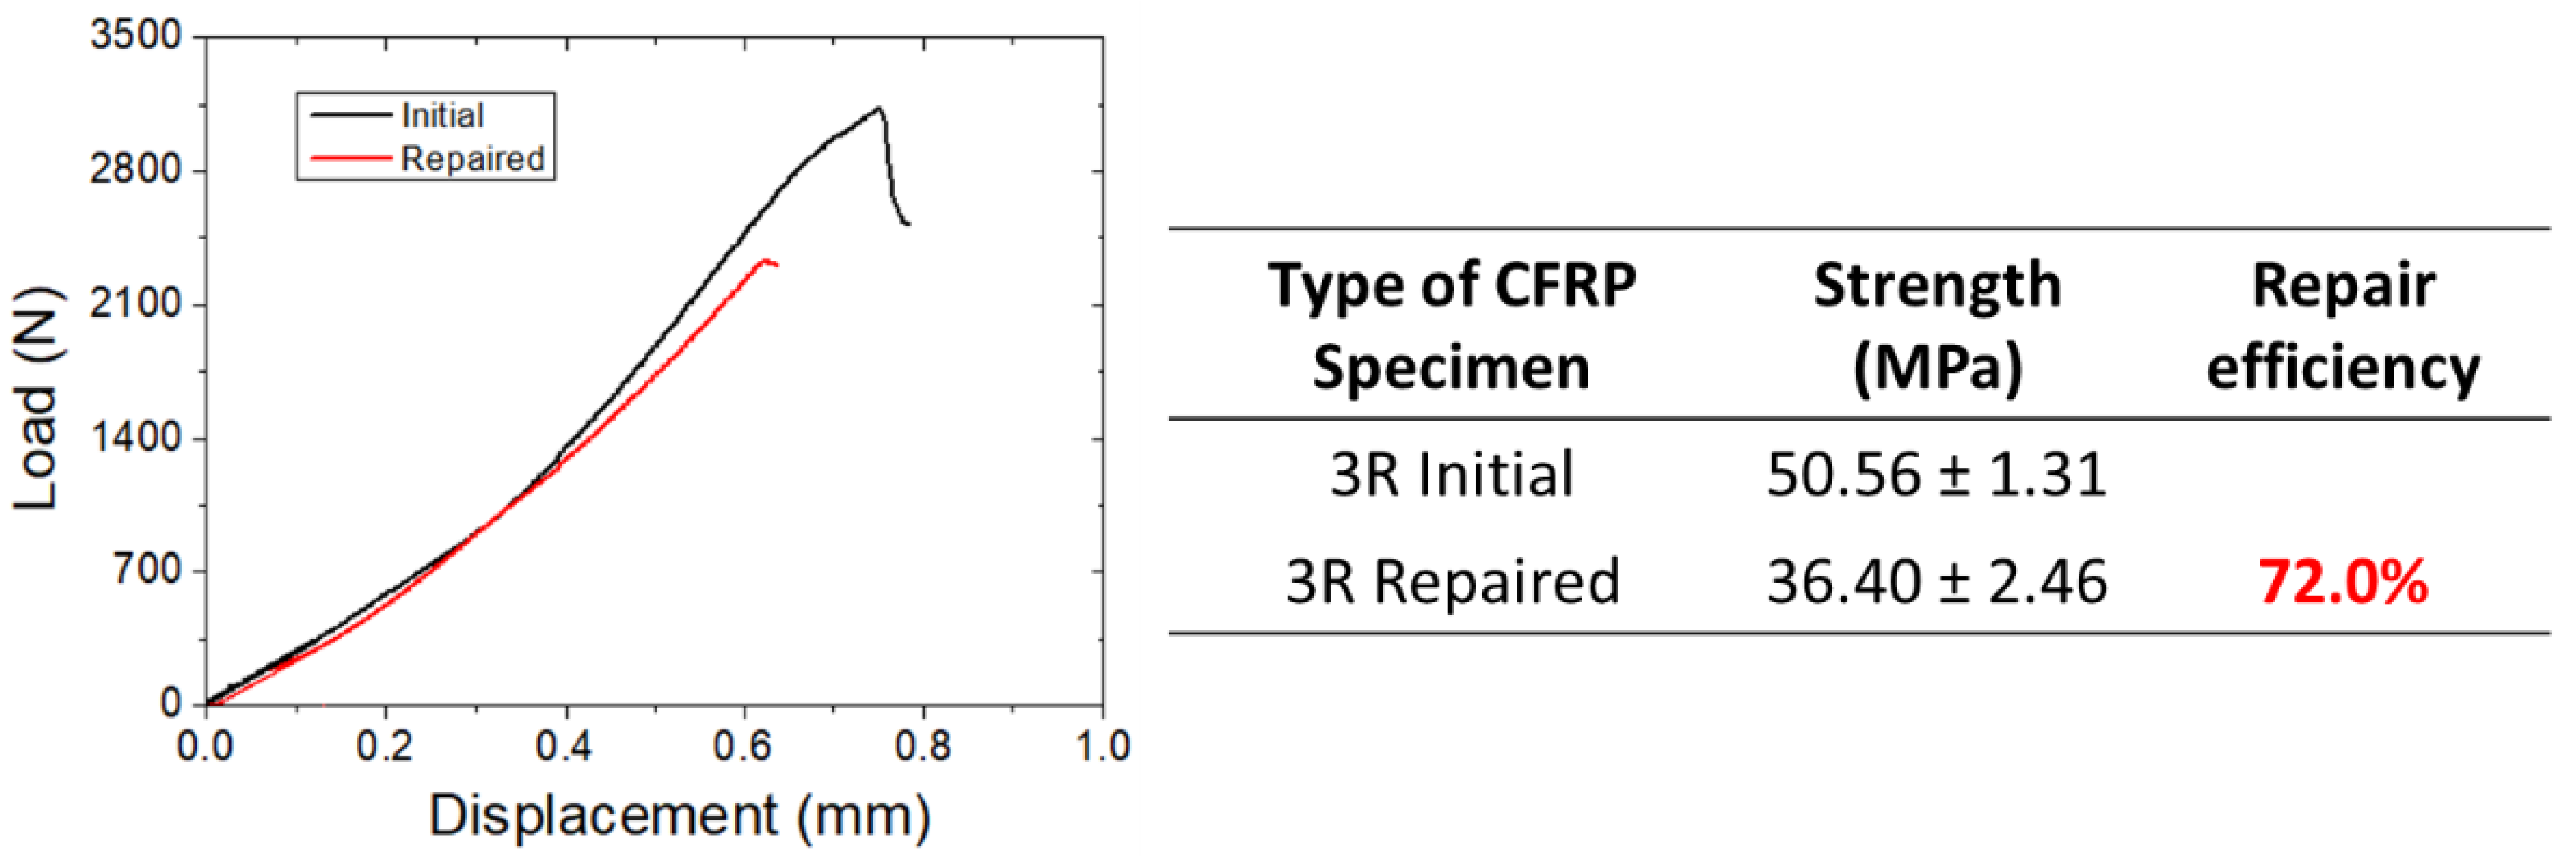
3.1.3. Repair Efficiency of 3R Composites

The repair efficiency was estimated at 72% of the maximum ILSS strength (Figure 6). The initial strength values were estimated at 50 MPa, while after the repair process, the strength was ca. 36 MPa. The results were deemed as satisfactory considering the small size of the ILSS specimens. These typically contain micro-delaminations and cracks that are difficult to repair.

3.1.4. Non-Destructive Evaluation via Impedance Spectroscopy

Figure 7 illustrates the impedance results after the repair process. It must be noted that the left graph in this figure is the same as the right graph in Figure 4 and corresponds to the state of the material before the repair process. The magnitude of the impedance after the first damage and the subsequent repair was restored to its initial values, as measured before the introduction of the damage, below 10 ohms (black curve with filled squares). The damage in the repaired specimen caused a further reduction in the magnitude of the impedance, probably by exposing the carbon fibers. The scans were noisy because the impedance values were out of the limits of the experimental equipment.

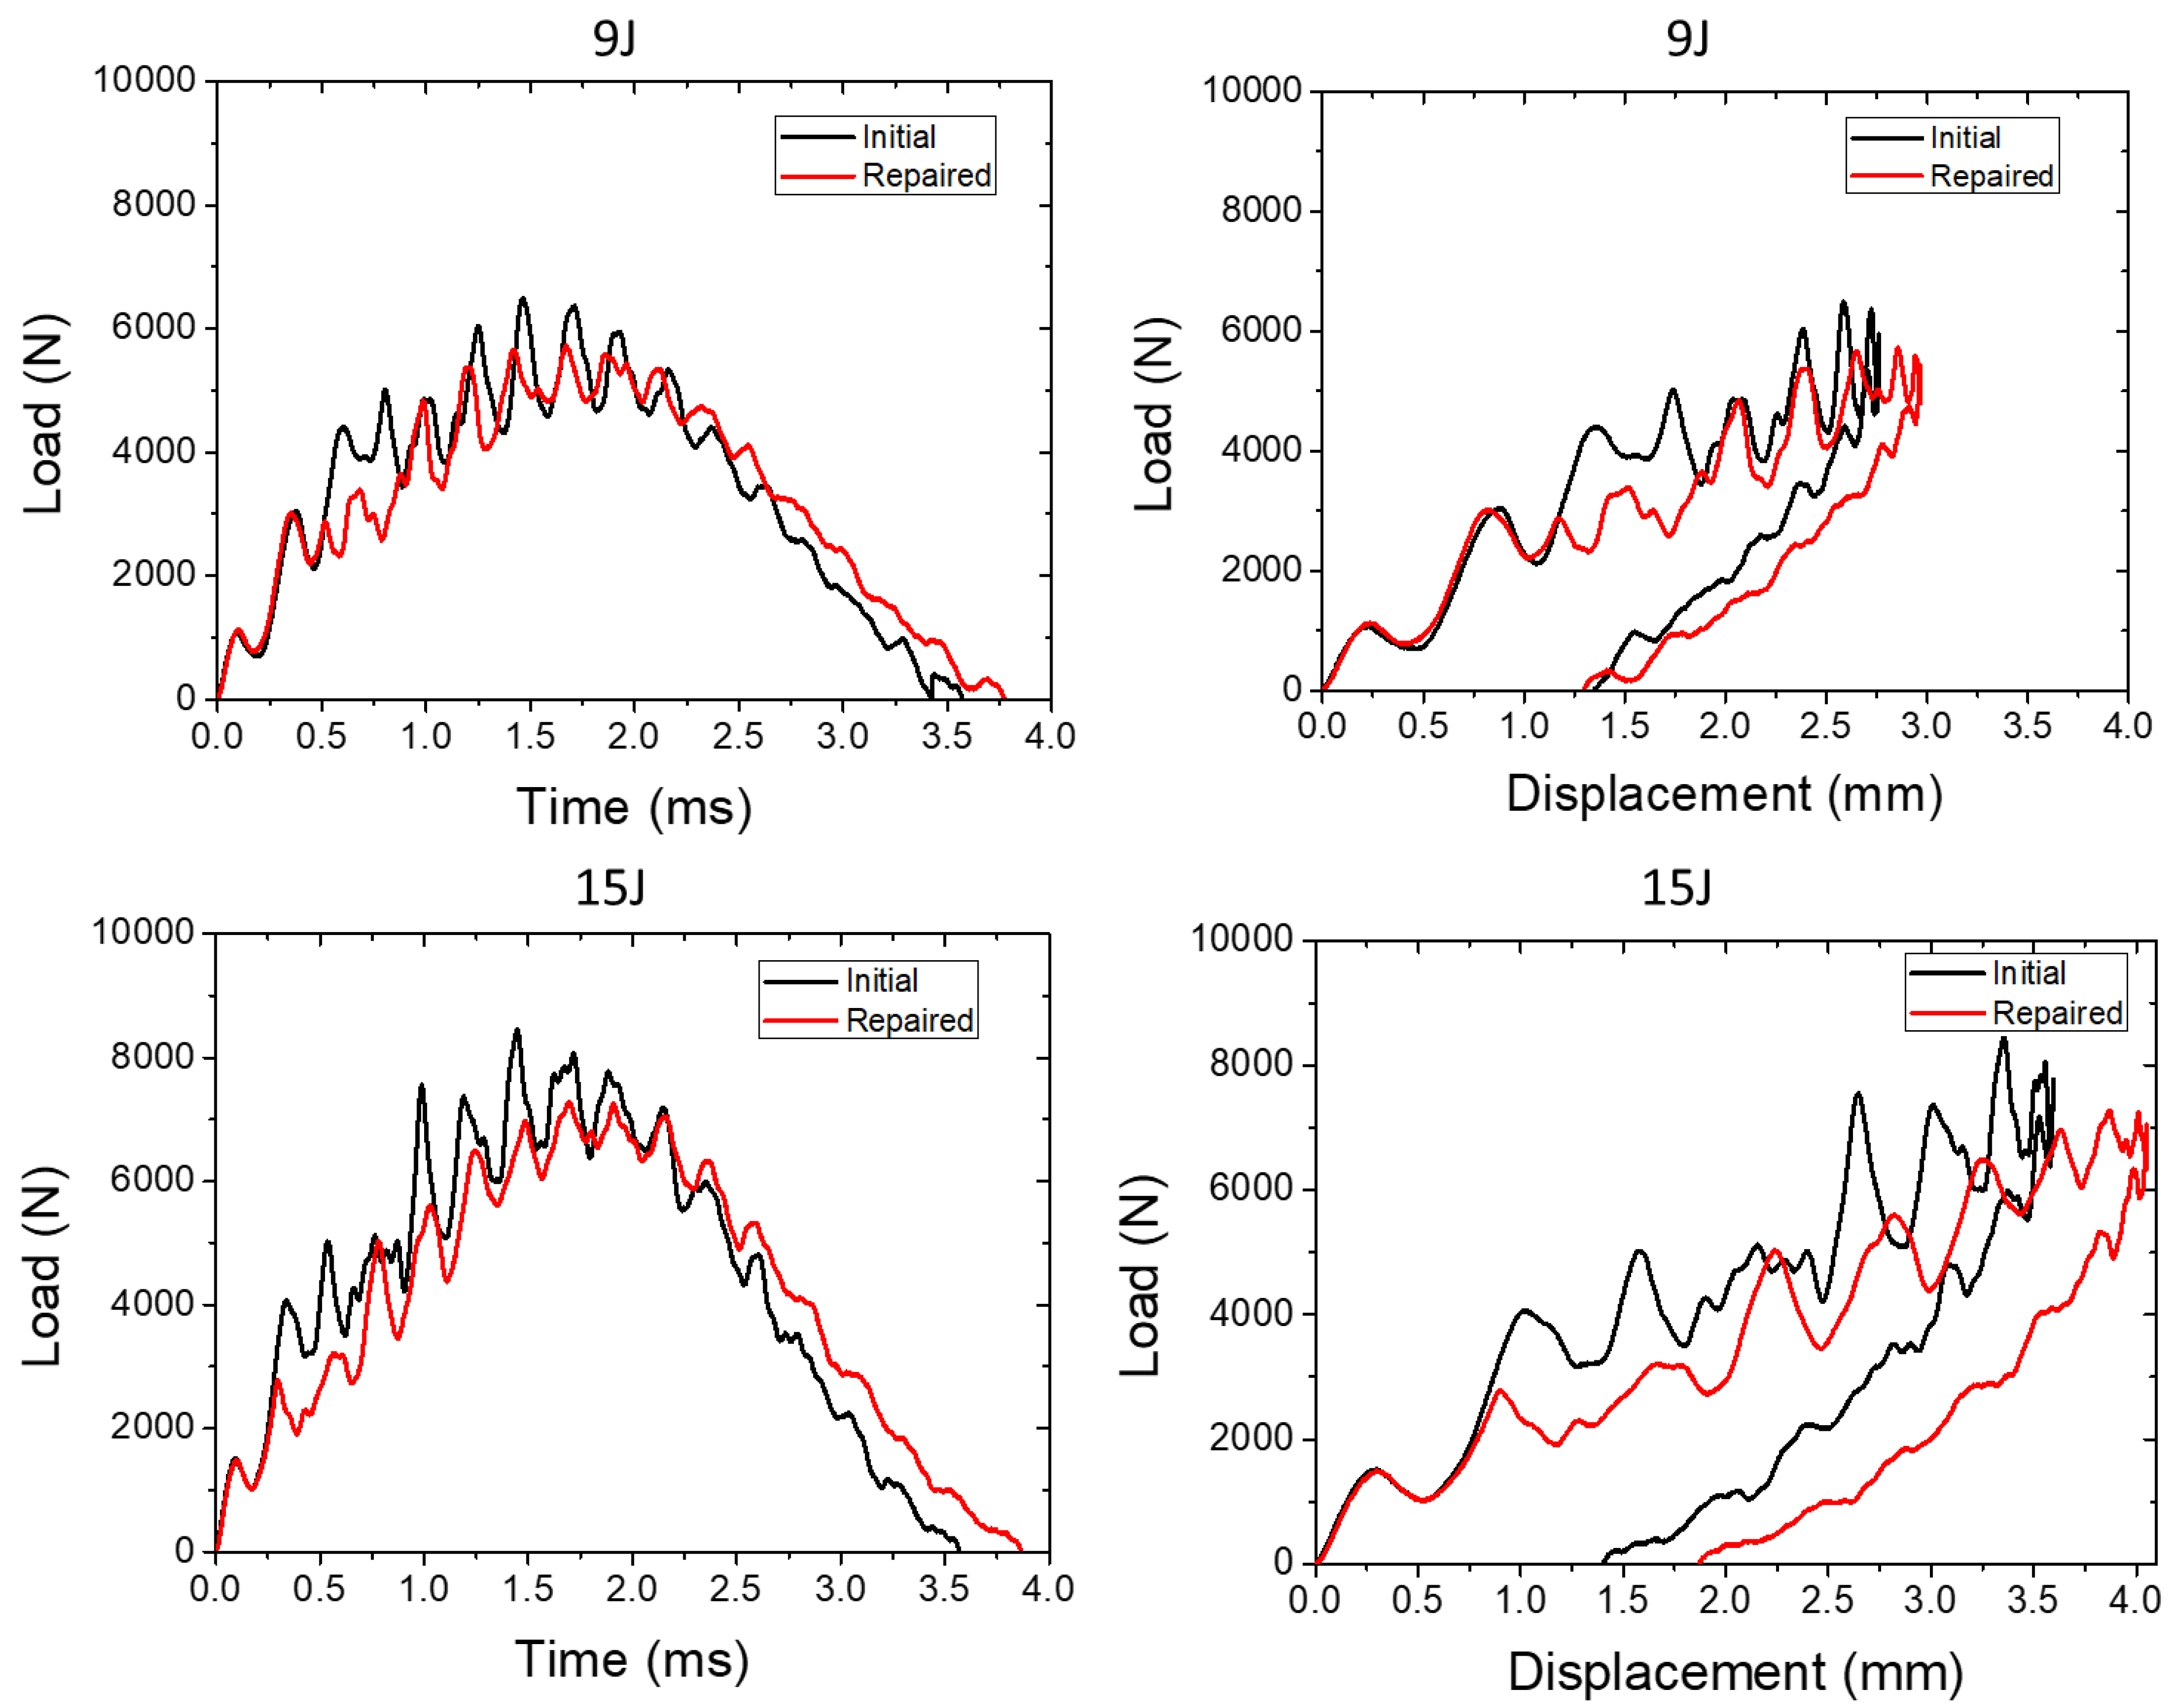
3.2. Low-Velocity Impact Tests

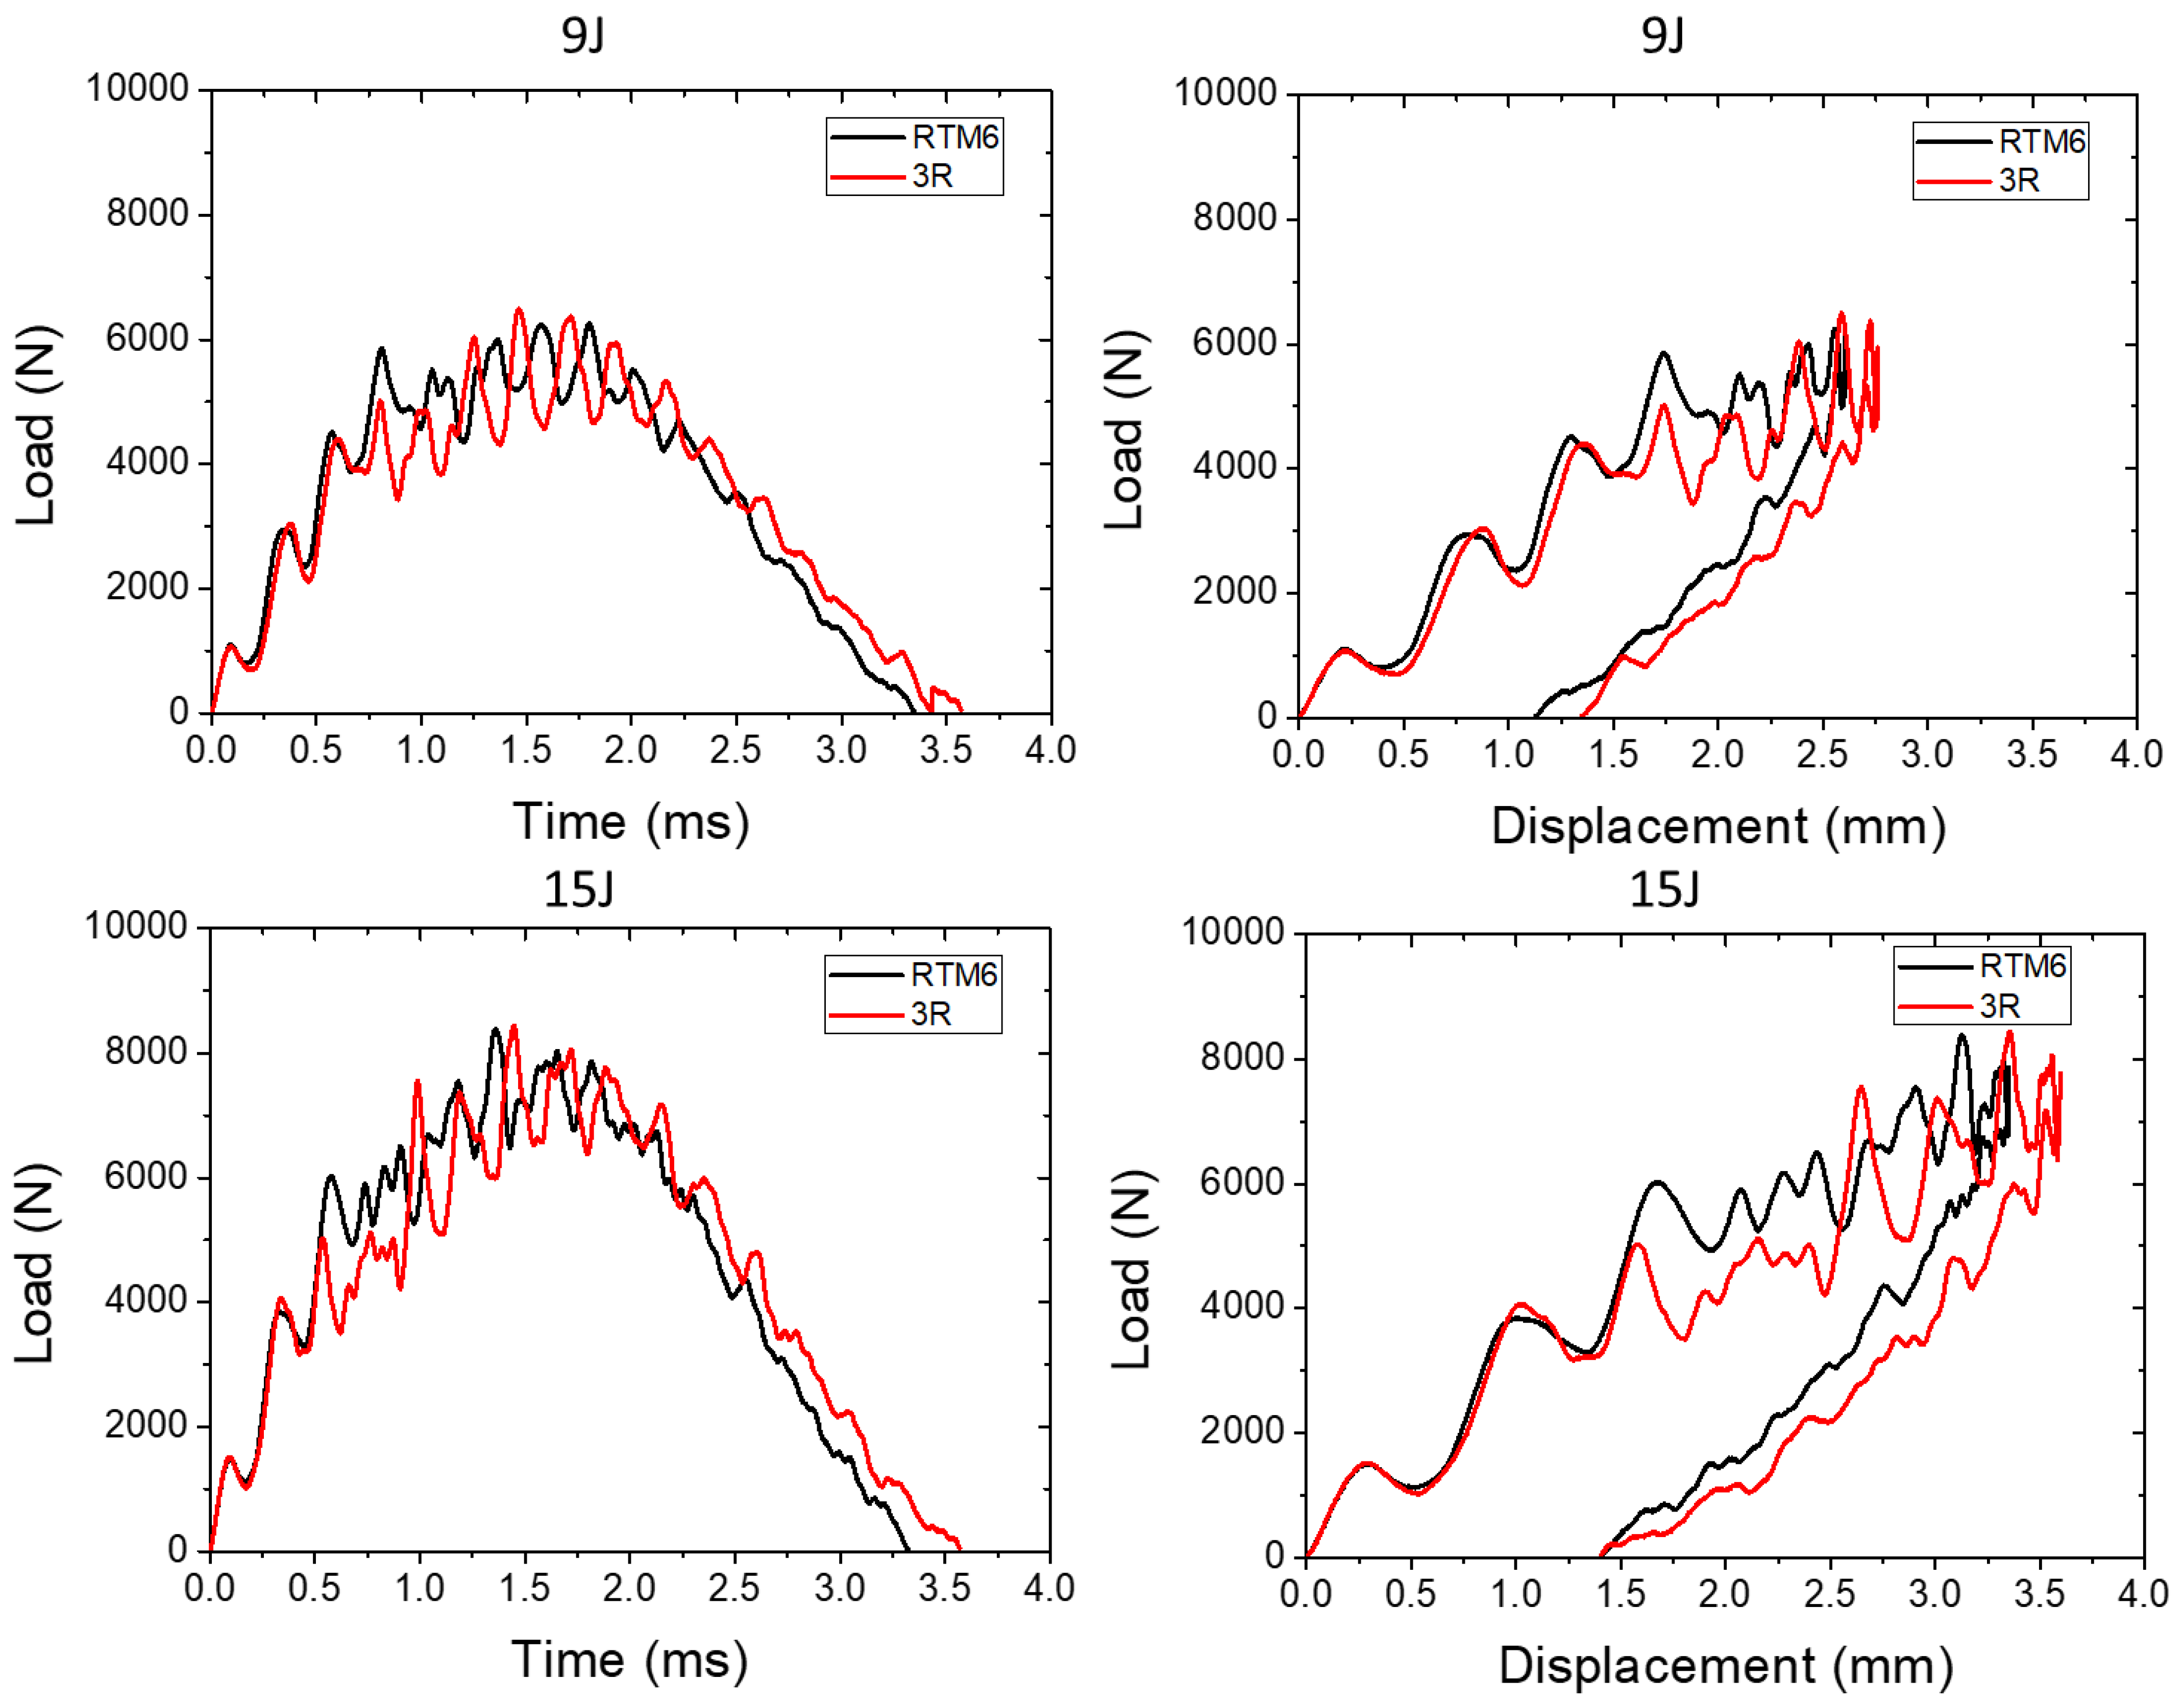
3.2.1. Knockdown Effect on Mechanical Properties

Low-velocity impact tests were performed at two energy levels (9 and 15 J) for conventional and 3R specimens. The knockdown effect between the 3R and the conventional composites was evaluated in terms of maximum impact load (kN) and absorbed energy (J). Figure 8 depicts representative load–time and load–displacement plots of both impact energies. The 3R composites exhibited a negligible knockdown effect of -1.8% of the maximum load at the 9 J impact and a knockdown effect of −3.7% at the 15 J impact (Table 1).
The reduced maximum load suggested that the 3R specimens had decreased bending stiffness against the conventional [42,43]. On the contrary, in terms of energy absorption, the 3R panels absorbed more energy than the conventional composites. The 3R specimens exhibited 4.1% more energy absorption than the conventional specimens at the 9 J impact and 2.2% more energy absorption at the 15 J impact. The results showed that the 3R specimens were tougher than the conventional specimens. They also showed that the 3R specimens had more extensive damage, as confirmed by the phased array ultrasonic technique. The damage was not visible by bare eye in all cases. Further evaluation of the impacted plates (mean diameter of impact damage) was performed via a phased array (c-scan) and IR thermography, and the results are presented below.

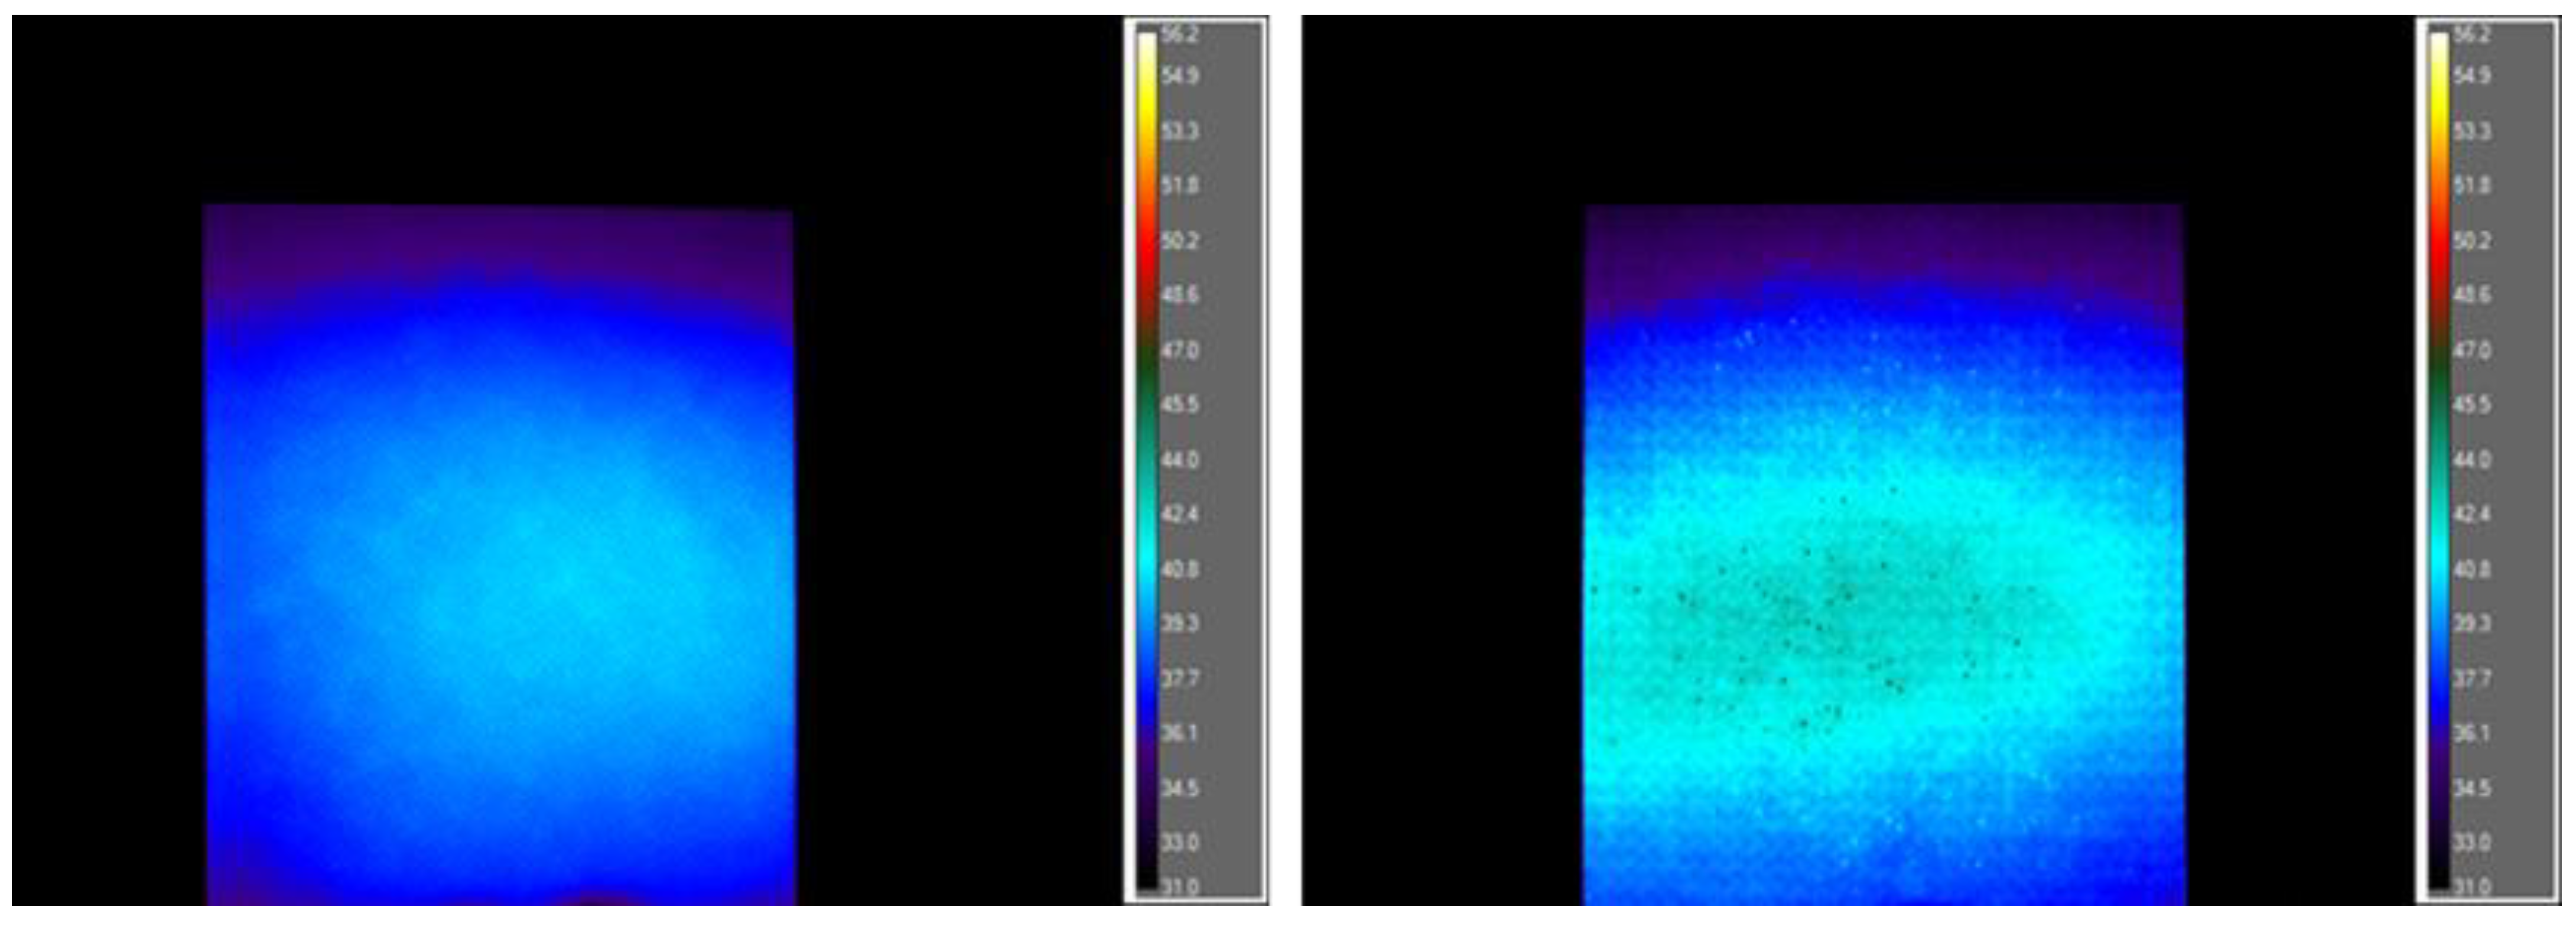
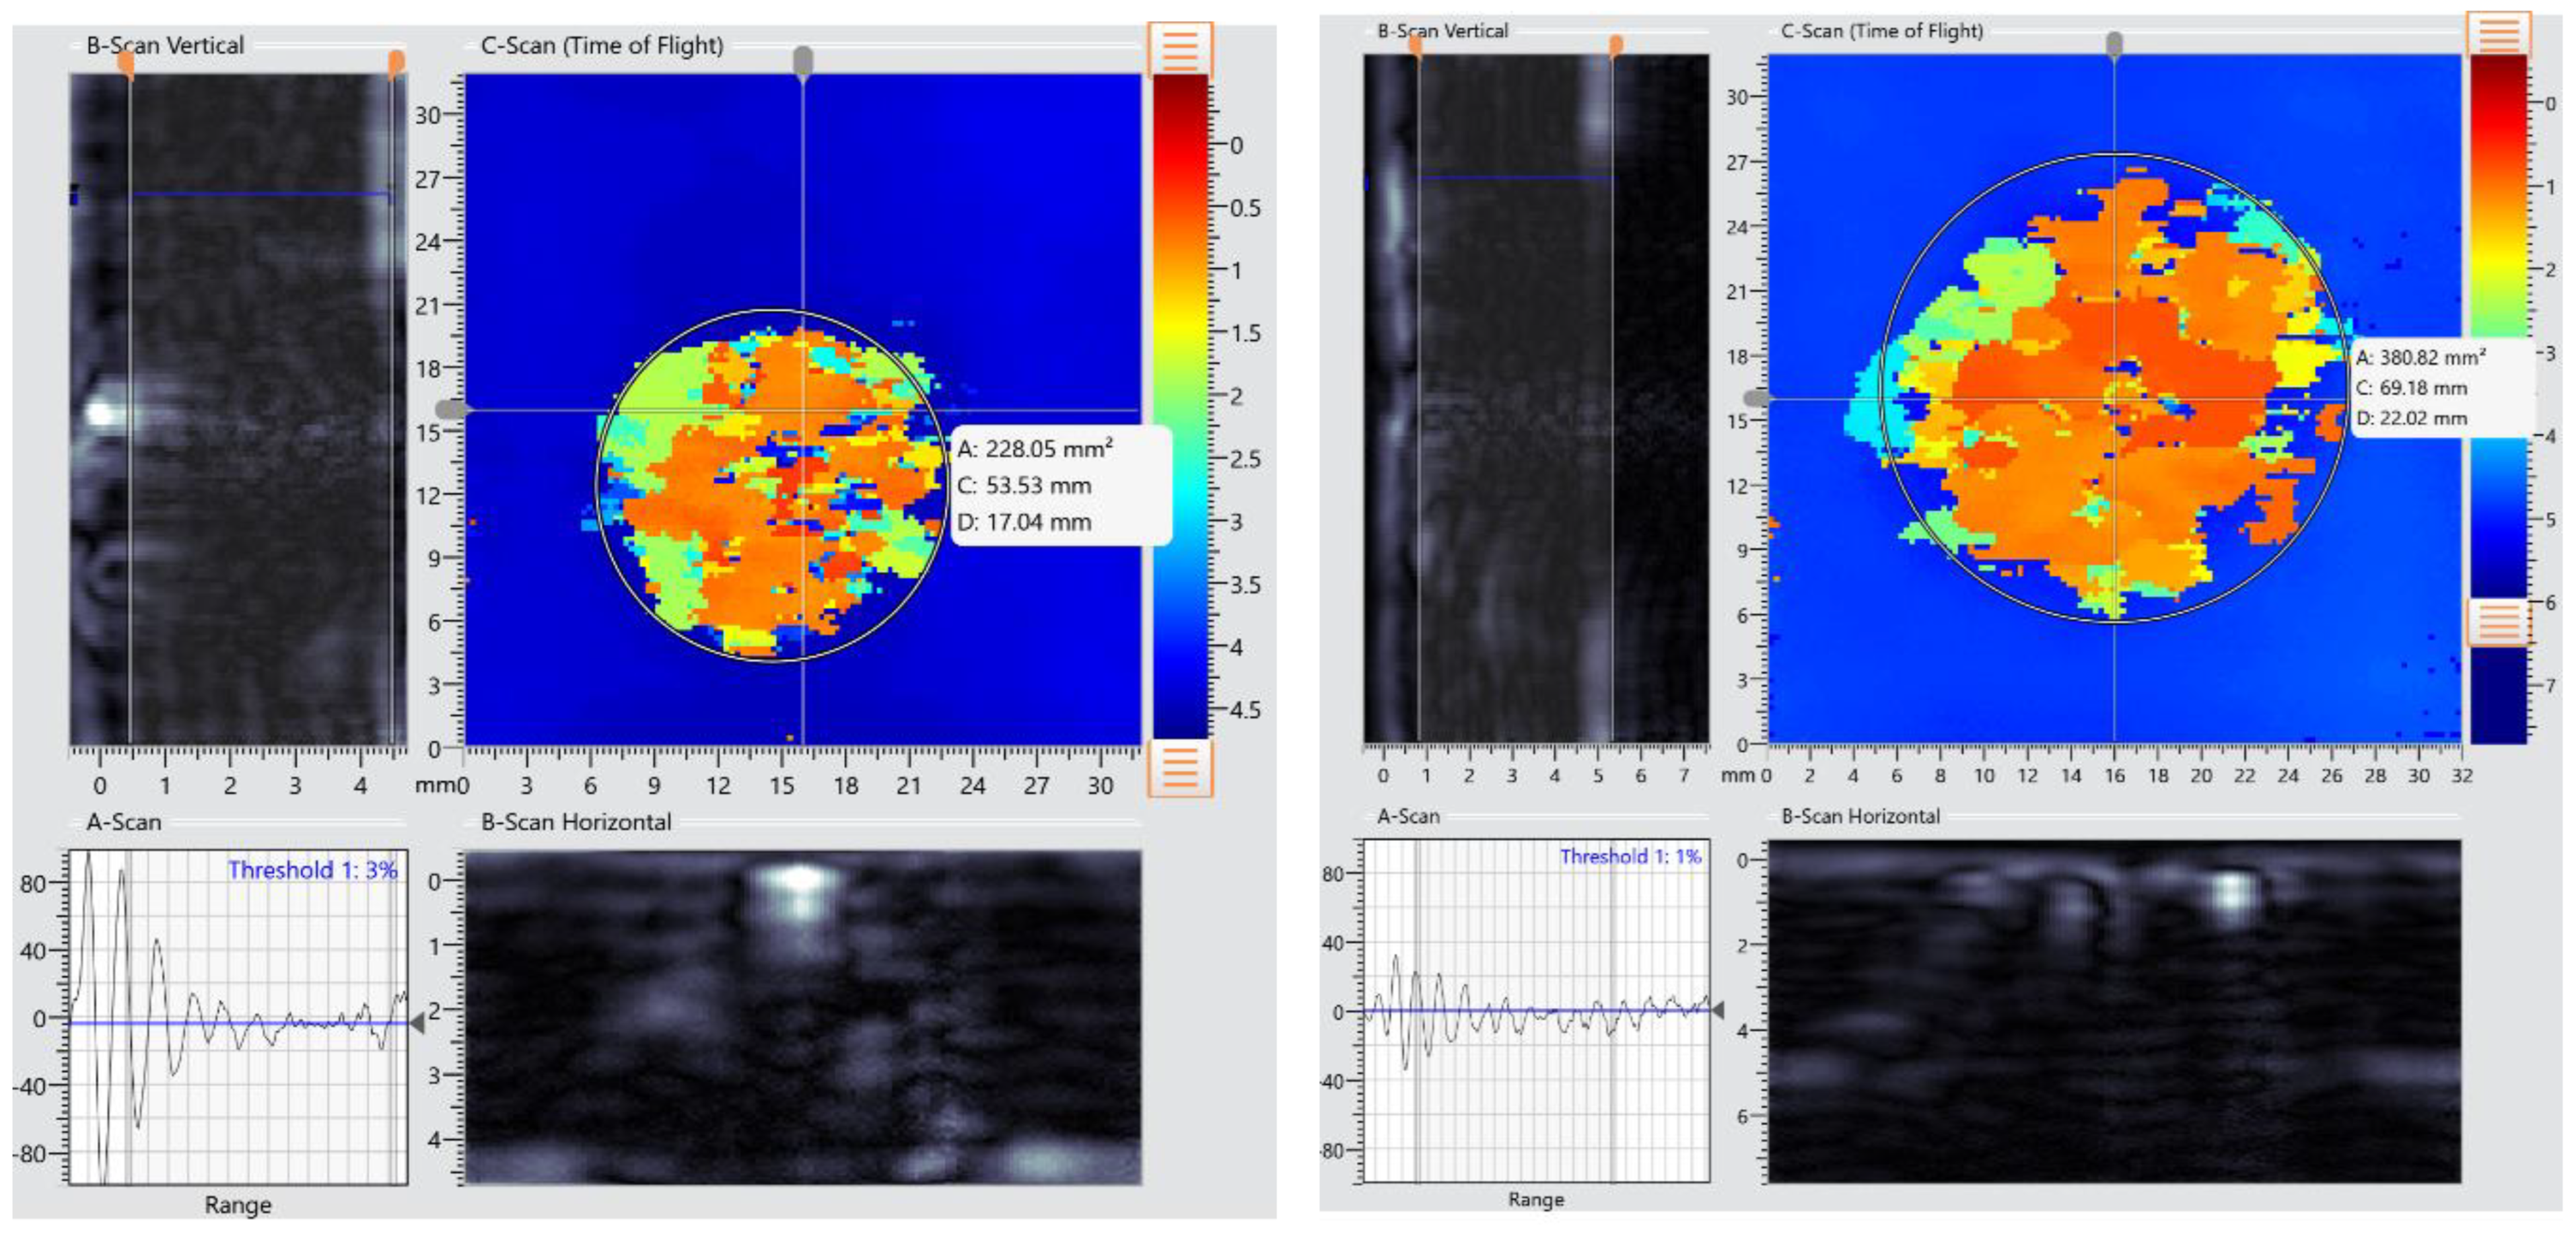
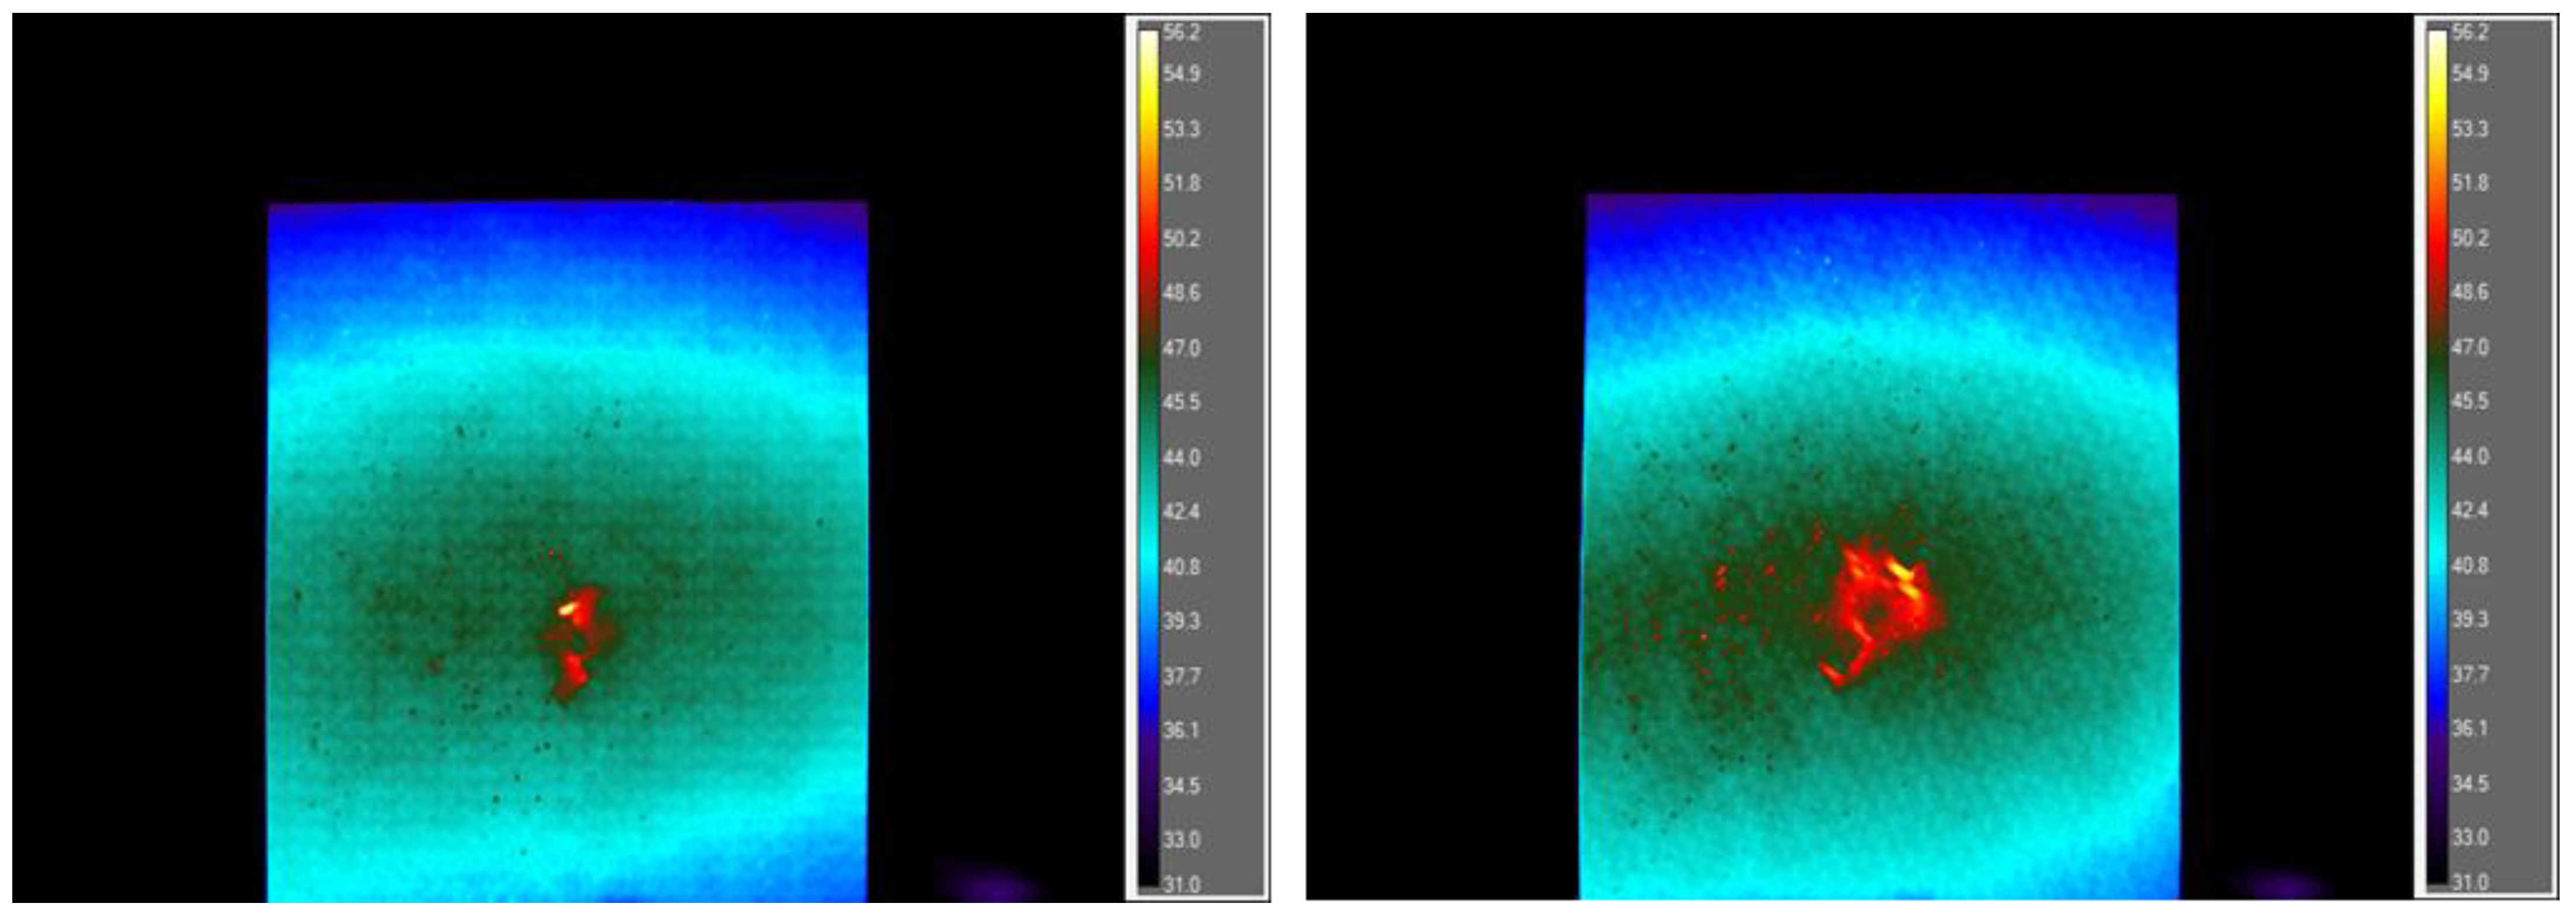
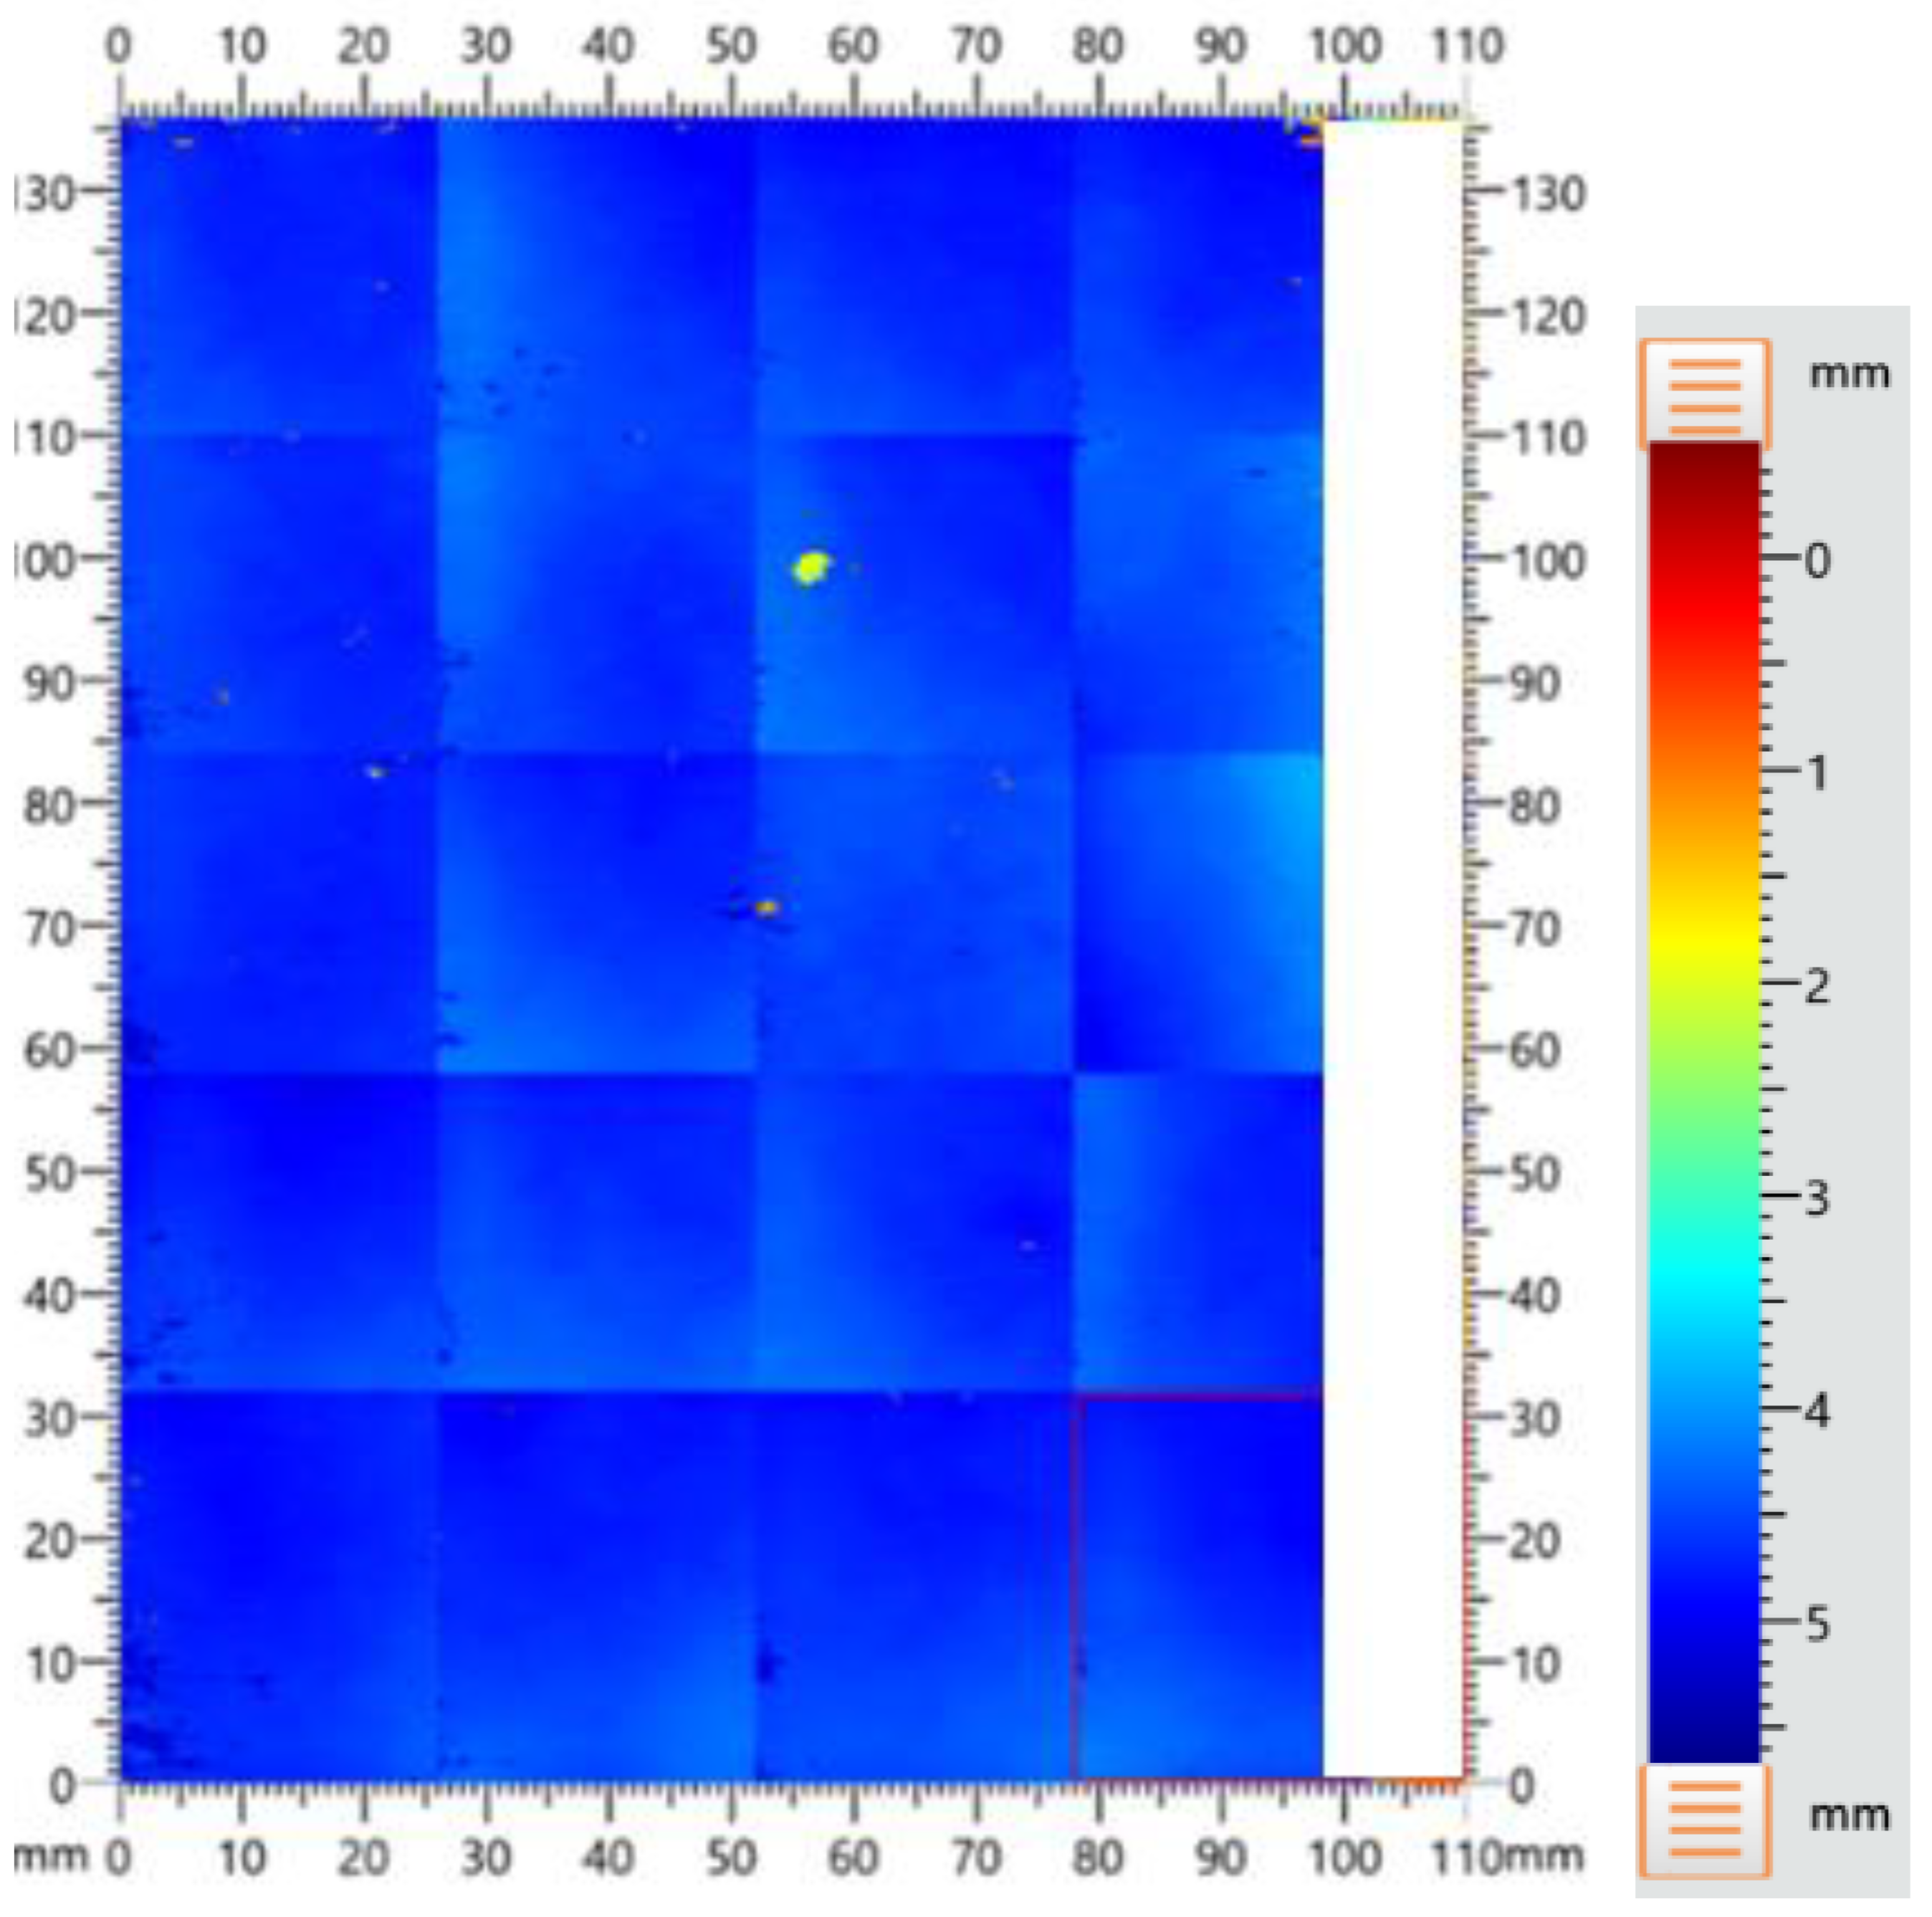
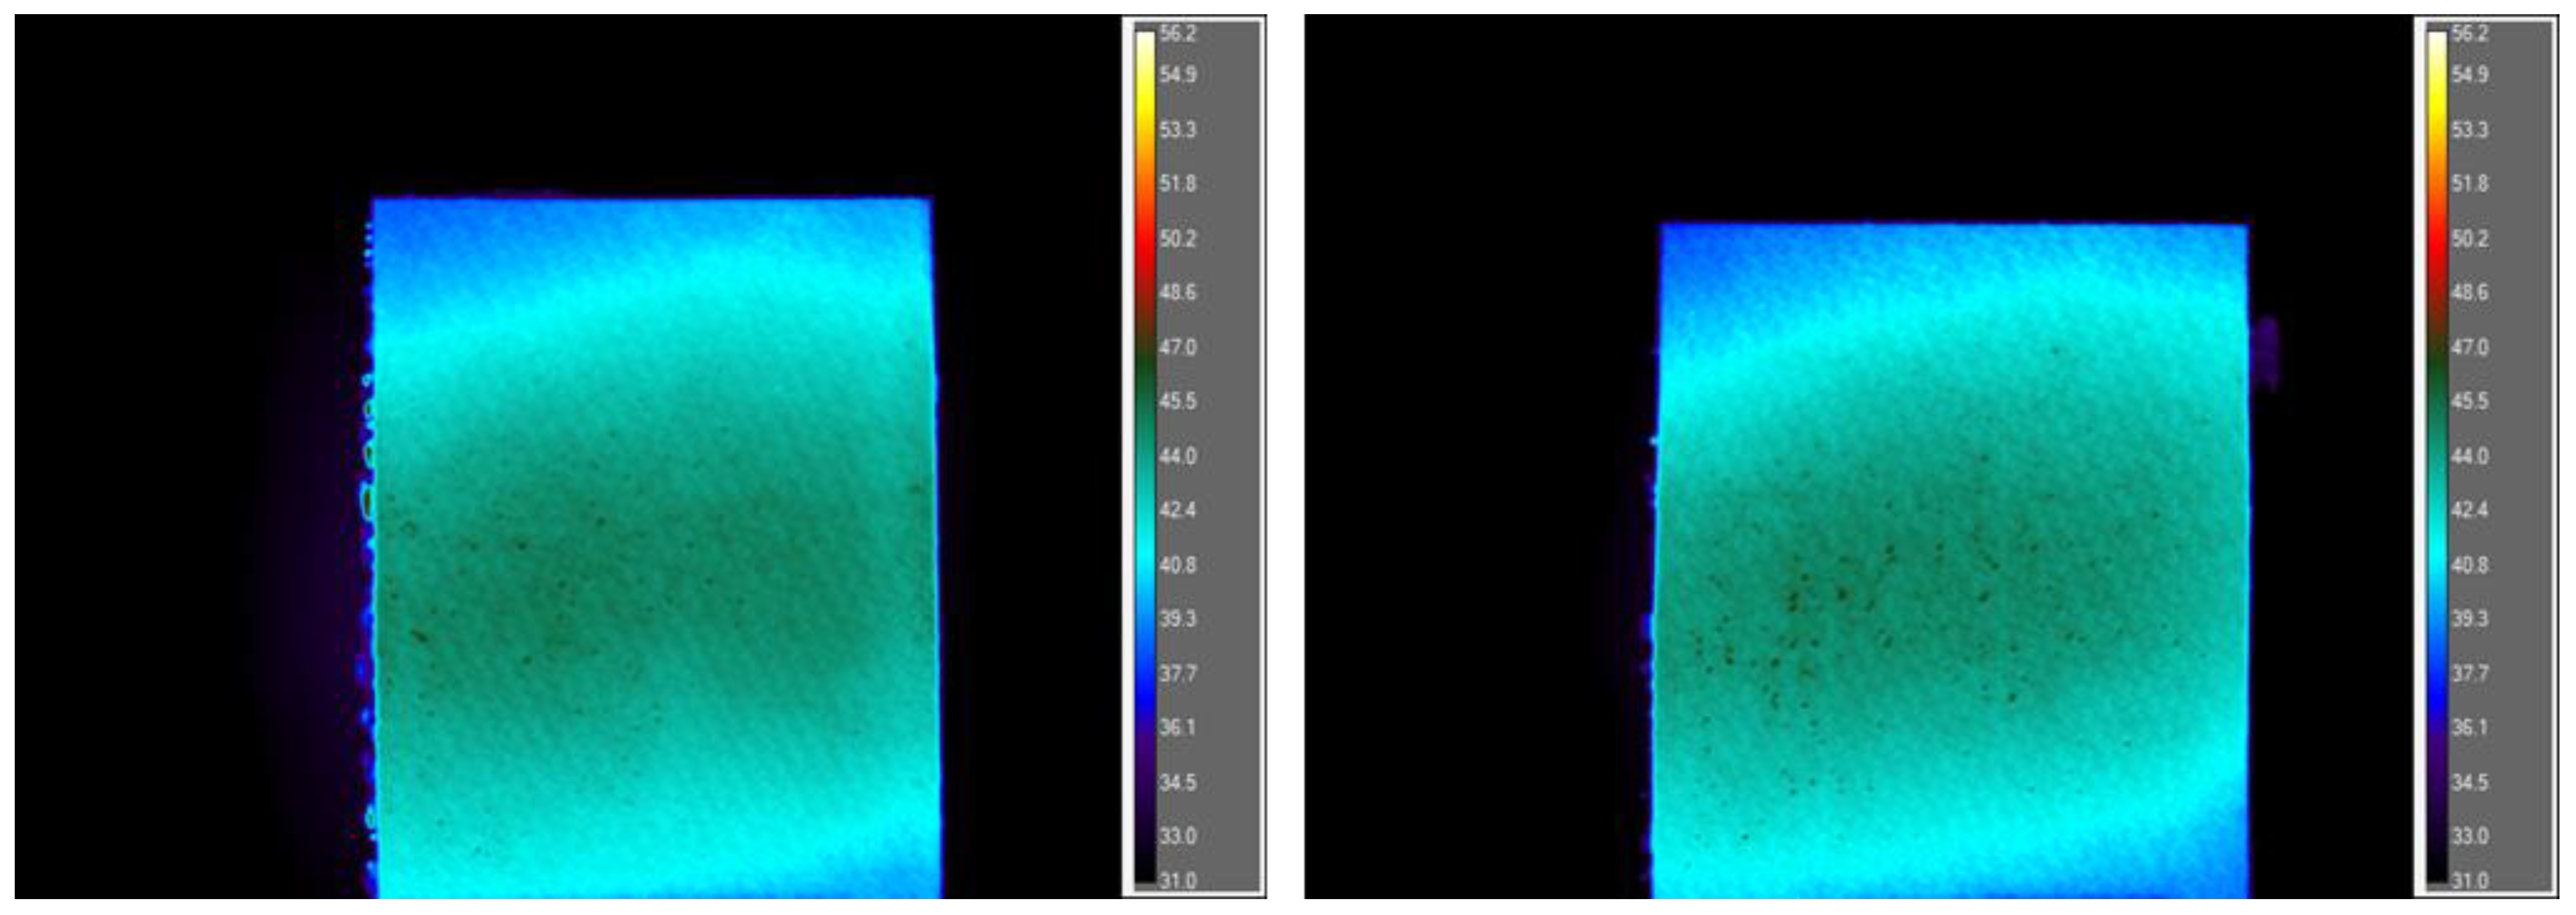
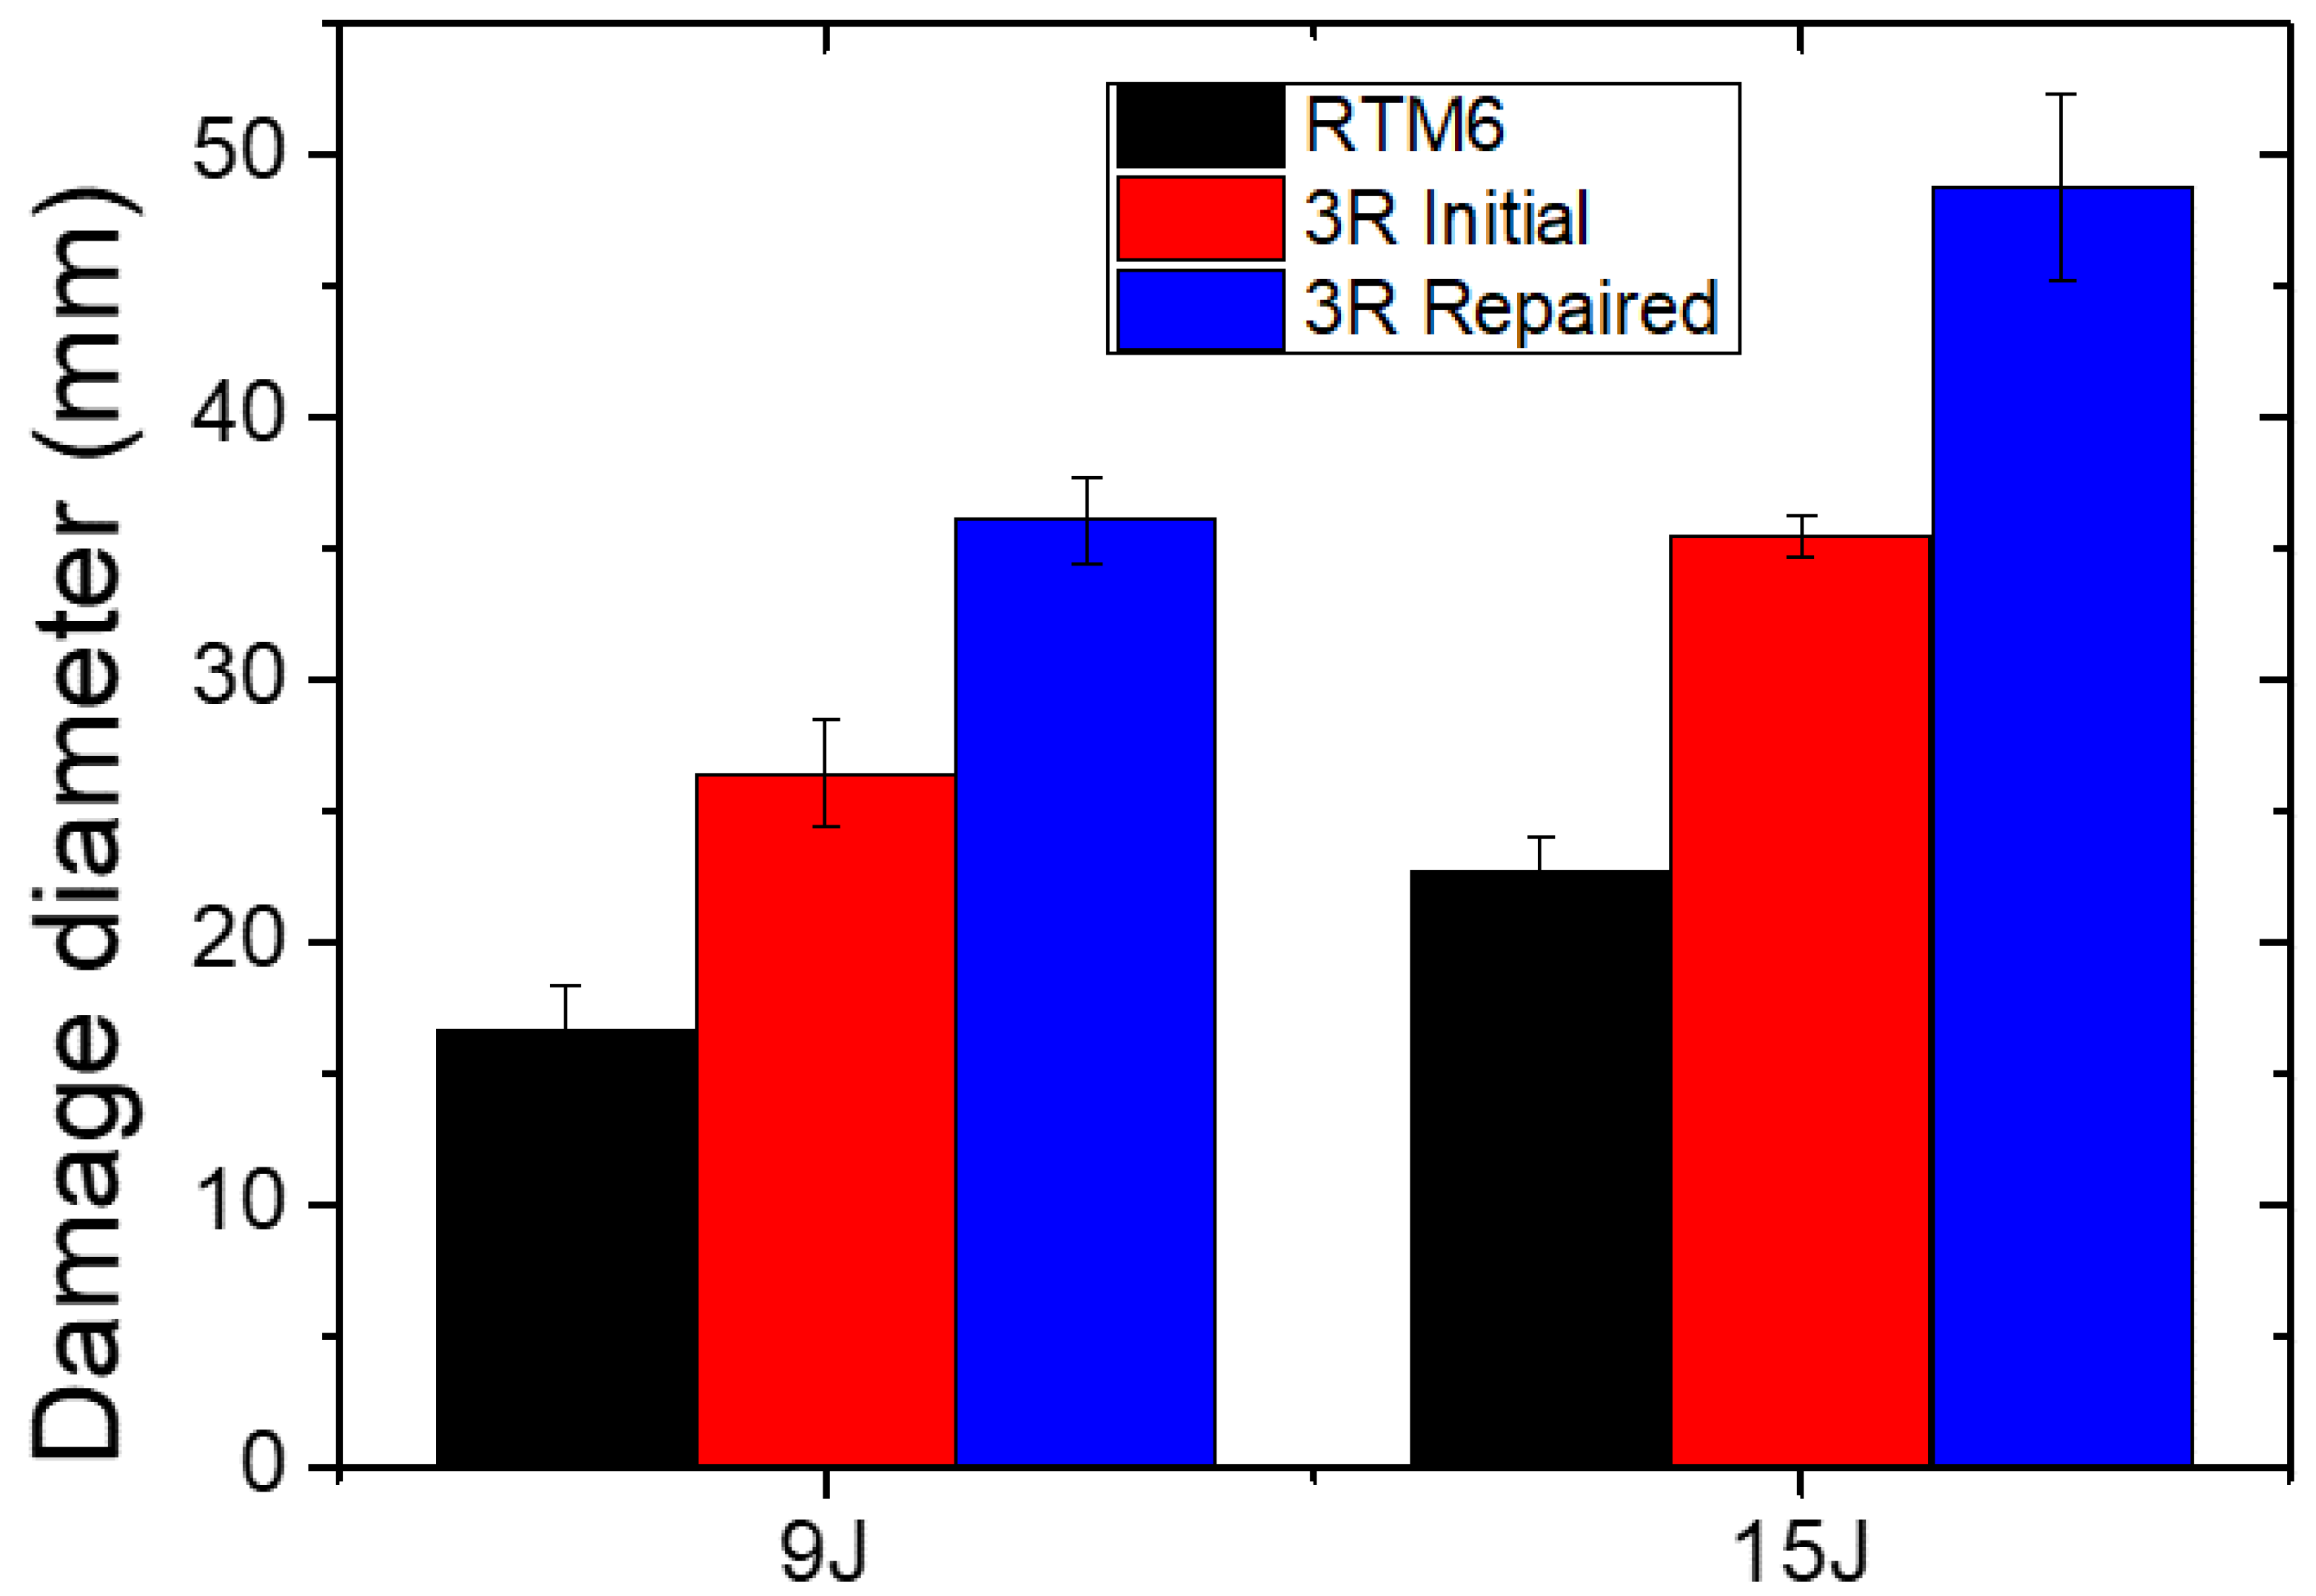
3.2.2. Non-Destructive Evaluation via Phased Array Ultrasonics and IR Thermography

The impact test caused extensive internal delaminations inside the laminates. Phased array and pulsed IR-thermography were employed to assess the size of the damaged area after the impact at both energy levels. More specifically, for the RTM6 laminates, measurements were performed after the manufacturing to evaluate the quality of the process. The measurements were repeated after the impact test for the identification of the damage (Figure 9).
For the 3R laminates, the above NDE characterization stages were employed, followed by the evaluation of the repair process, the second damage by impact test, and the identification of the extension of the second damage (Figure 10).
The complete volume of each laminate was evaluated by employing the built-in stitching function to detect any defects induced during the manufacturing process, such as delaminations, poor impregnation of the fibers, voids, etc. In Figure 11 (left), a representative phased array c-scan of an RTM6 laminate is depicted. The blue color corresponds to the bottom surface of the composite. No defects were detected during the manufacturing process.
On the other hand, phased array scans of the 3R laminates after manufacturing (Figure 11 (right)) revealed numerous defects which occurred at various depths due to the poor impregnation of the CF by the 3R resin. Poor impregnation of the fibers led to voids manifested as trapped air at the matrix–fabric interphase or between/inside yarns. The void content varied both between different areas of the same laminate and among different laminates.
Pulsed IR-thermography confirmed the c-scan results. In Figure 12 (left), the RTM6 laminate was of high quality, with a uniformly distributed thermal behavior. Contrariwise, the 3R laminate in Figure 12 (right) presented a few heat traps that emerged at almost 5 s to 10 s of the heating cycle. Imperfections that appear at this timeframe of the heating cycle correspond to defects located near the surface of the laminate. These heat traps were small voids that remained from the manufacturing process of the composite.
Ultrasonic inspection after the impact test revealed delaminations inside the composite. This type of damage (barely visible impact damage: BVID) is introduced inside the composites and can expose them to danger as visual inspections on the surface cannot detect them. BVIDs can act as crack initiators, leading to further delamination extension and potentially disastrous results [24]. The laminates were tested under two different impact energies. Two representative ultrasonic scans of the RTM6 laminates are depicted in Figure 13 (left) and (right) for 9 J and 15 J energy levels, respectively.
The delamination diameters of the impacted laminates are presented in Table 2. The damage caused by the 9 J low-velocity impact had a mean diameter of 16.71 mm ± 1.62 mm, while the 15 J impact caused approximately 36% more damage, with a 22.68 mm ± 1.37 mm mean diameter.
Figure 14 illustrates the affected area of the 3R laminates after the impact test for both energy levels. The 15 J impact damage caused a delamination that exceeded the dimensions of the probe, thus stitching function was applied (Figure 14 (right)). The laminates after the 9 J energy impact presented delaminations with a mean diameter of 26.43 mm ± 2.05 mm, as is shown in Table 3. The 15 J impact introduced delaminations with a 35.53 mm ± 0.79 mm mean diameter. Compared to RTM6 laminates, the 3R laminates suffered 58% and 57% more extensive delaminations at 9 J and 15 J impact energies, respectively.
Figure 15 illustrates the damage from the low-velocity impact at 9 J (left) and 15 J (right). The 9 J damage is barely visible with IR thermography at 5–10 s of the heating cycle, as the heating defused fast to the rest of the area of the laminate, while the 15 J impact caused more distinct damage. The 3R laminates suffered more extended damage (Figure 16) than the conventional, with the IR thermography result agreeing with the phased array ultrasonics results.

3.2.3. Repair Efficiency

Figure 17 illustrates representative load–time and load–displacement plots for both impact energies before and after repair. The repair efficiency of the low-velocity impact geometry was calculated in terms of the maximum load and the absorbed energy (Table 4). At the 9 J impact, the max load was recovered by approximately 91% and the absorbed energy by ca. 87%. In the case of the 15 J impact, the specimen fully recovered by absorbing practically the same amount of energy (repair efficiency 106%), while the max load regained its value by ca. 99%. The repair process was more than efficient since the initial values were fully recovered.

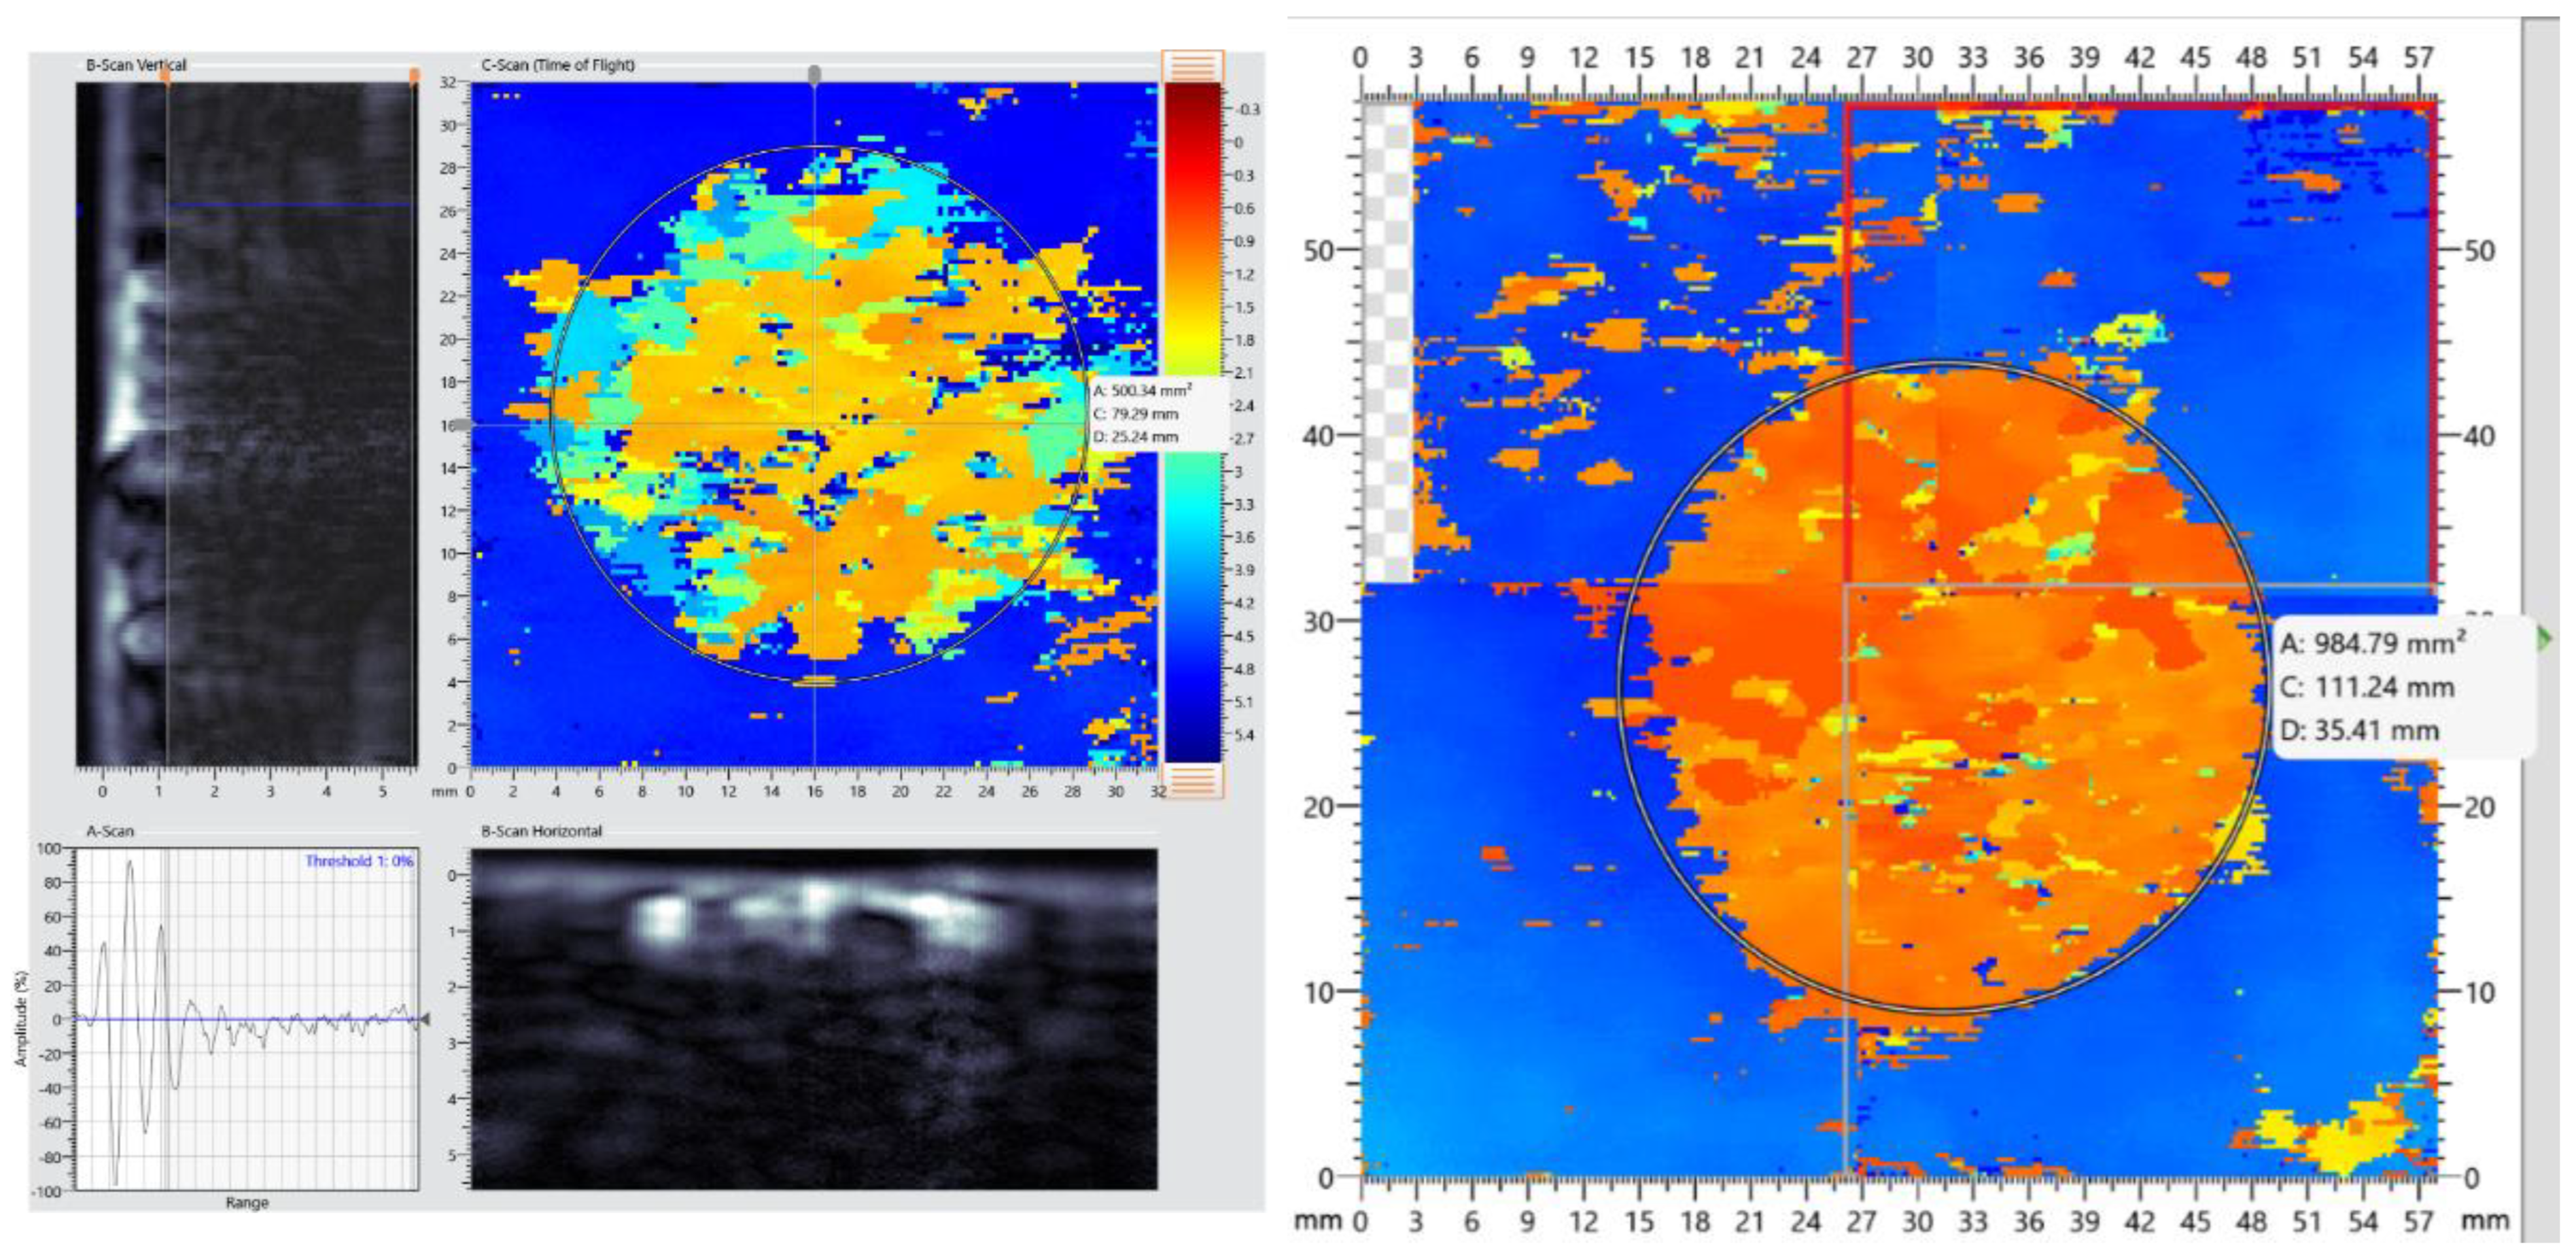
3.2.4. Non-Destructive Evaluation via Phased Array Ultrasonics and IR Thermography

The 3R laminates were repaired after the impact test. The repair process was evaluated with the phased array ultrasonics technique to investigate the efficiency of the resin re-bonding. Figure 18 and Figure 19 show that most of the defects that were created during the manufacturing process were eliminated after the repair. Figure 19 presents a comparison between the c-scan prior to and after repair. A few delaminations still remained between the middle laminae of the composite (Figure 19c).
Figure 20 presents the IR thermographs of the 3R laminates after the repair process. Although the delaminations were fully repaired, a few defects from the manufacturing process remained and acted as heat traps near the surface of the laminate (red/dark spots on the surface of the laminate).
The delaminations of the repaired 3R laminates caused by the second impact test are illustrated in Figure 21.
The 9 J energy impact led to a delamination with a mean diameter of 36.1 mm ± 1.63 mm. More extensive delamination occurred in the repaired 3R laminates after the 15 J impact. The mean diameter of the damage was 48.82 mm ± 3.54 mm (Table 5). When compared with the initial specimens, the repaired specimens had an increased damaged area diameter by 36.6% and 37.4% for the 9 J and 15 J impact, respectively. Figure 22 depicts a bar chart with a comparison of the mean damage diameter for all the inspected laminates.
The second damage, which was caused by the impact test on the repaired 3R specimens, was also detected by IR thermography by applying pulse heating. The results were in agreement with the phased array ultrasonics. When compared to the initial specimens, the delamination area increased in both the 9 J and the 15 J impact energy levels, as can be seen in Figure 23.

3.3. Compression after Impact (CAI)

3.3.1. Knockdown Effect on Mechanical Properties

Half of the impacted 3R specimens (at each energy level) were subsequently tested in compression after impact (CAI), and the rest of them were repaired and tested again (impact damage and CAI) in order to calculate the knockdown effect (Table 6). Regarding the laminates that were subjected to 9 J impact, CAI showed that the 3R composites exhibited mean values of maximum load of 100.59 ± 4.75 kN and a mean maximum strength of 212.43 ± 12.18 MPa. The conventional specimens exceeded the upper limit of the loadcell (105 kN) during mechanical testing without breaking. Therefore, the knockdown effect was evaluated using an approximate value of 105 kN as the maximum load and estimated approximately at ≈−3.0% or ≈−1.9% using the maximum strength values. At the 15 J impact, the knockdown effect of 3R specimens was −4.3% in terms of maximum load and –1.1% in compression strength.

3.3.2. Repair Efficiency
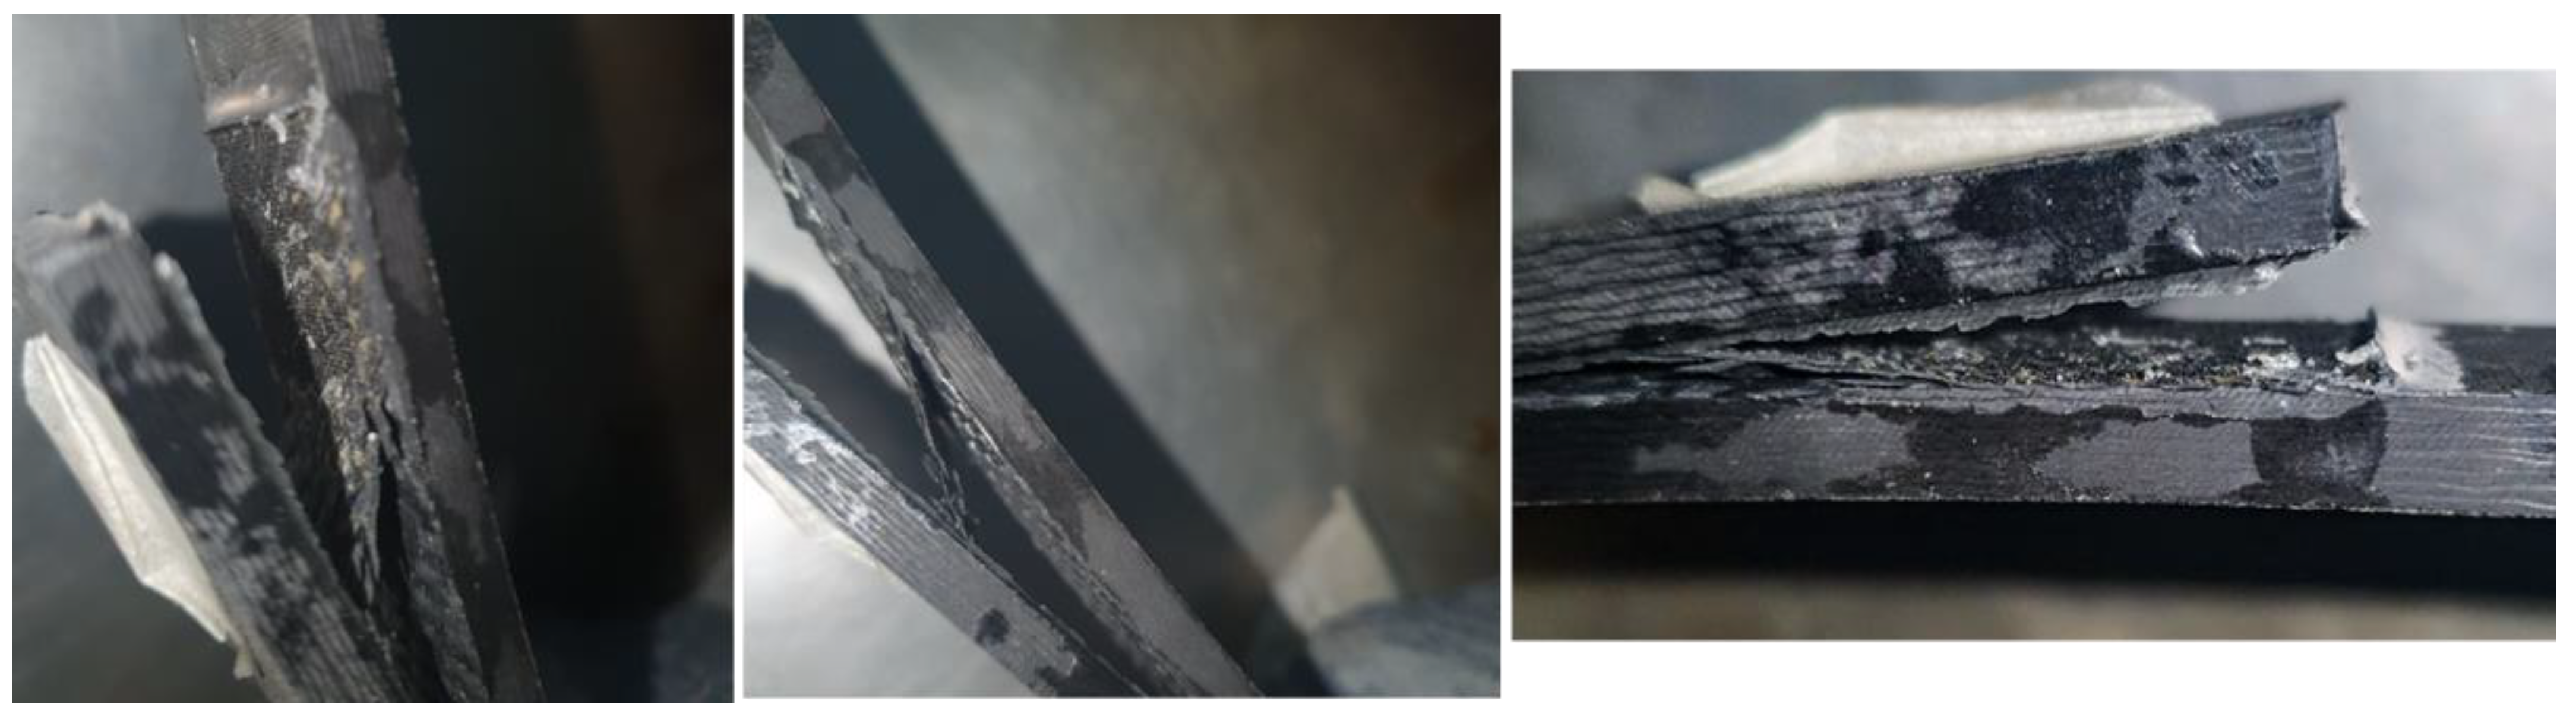
The initial 3R specimens that were tested at impact and CAI were compared to the repaired 3R specimens. In terms of the maximum compression strength, the repair efficiency was estimated at 80.1% on the 9 J impact and 74.8% on the 15 J impact (Table 7). Additionally, the maximum load recovery was at 75.8% for the 9 J impact and 61.5% for the 15 J impact.

3.4. Lap Strap

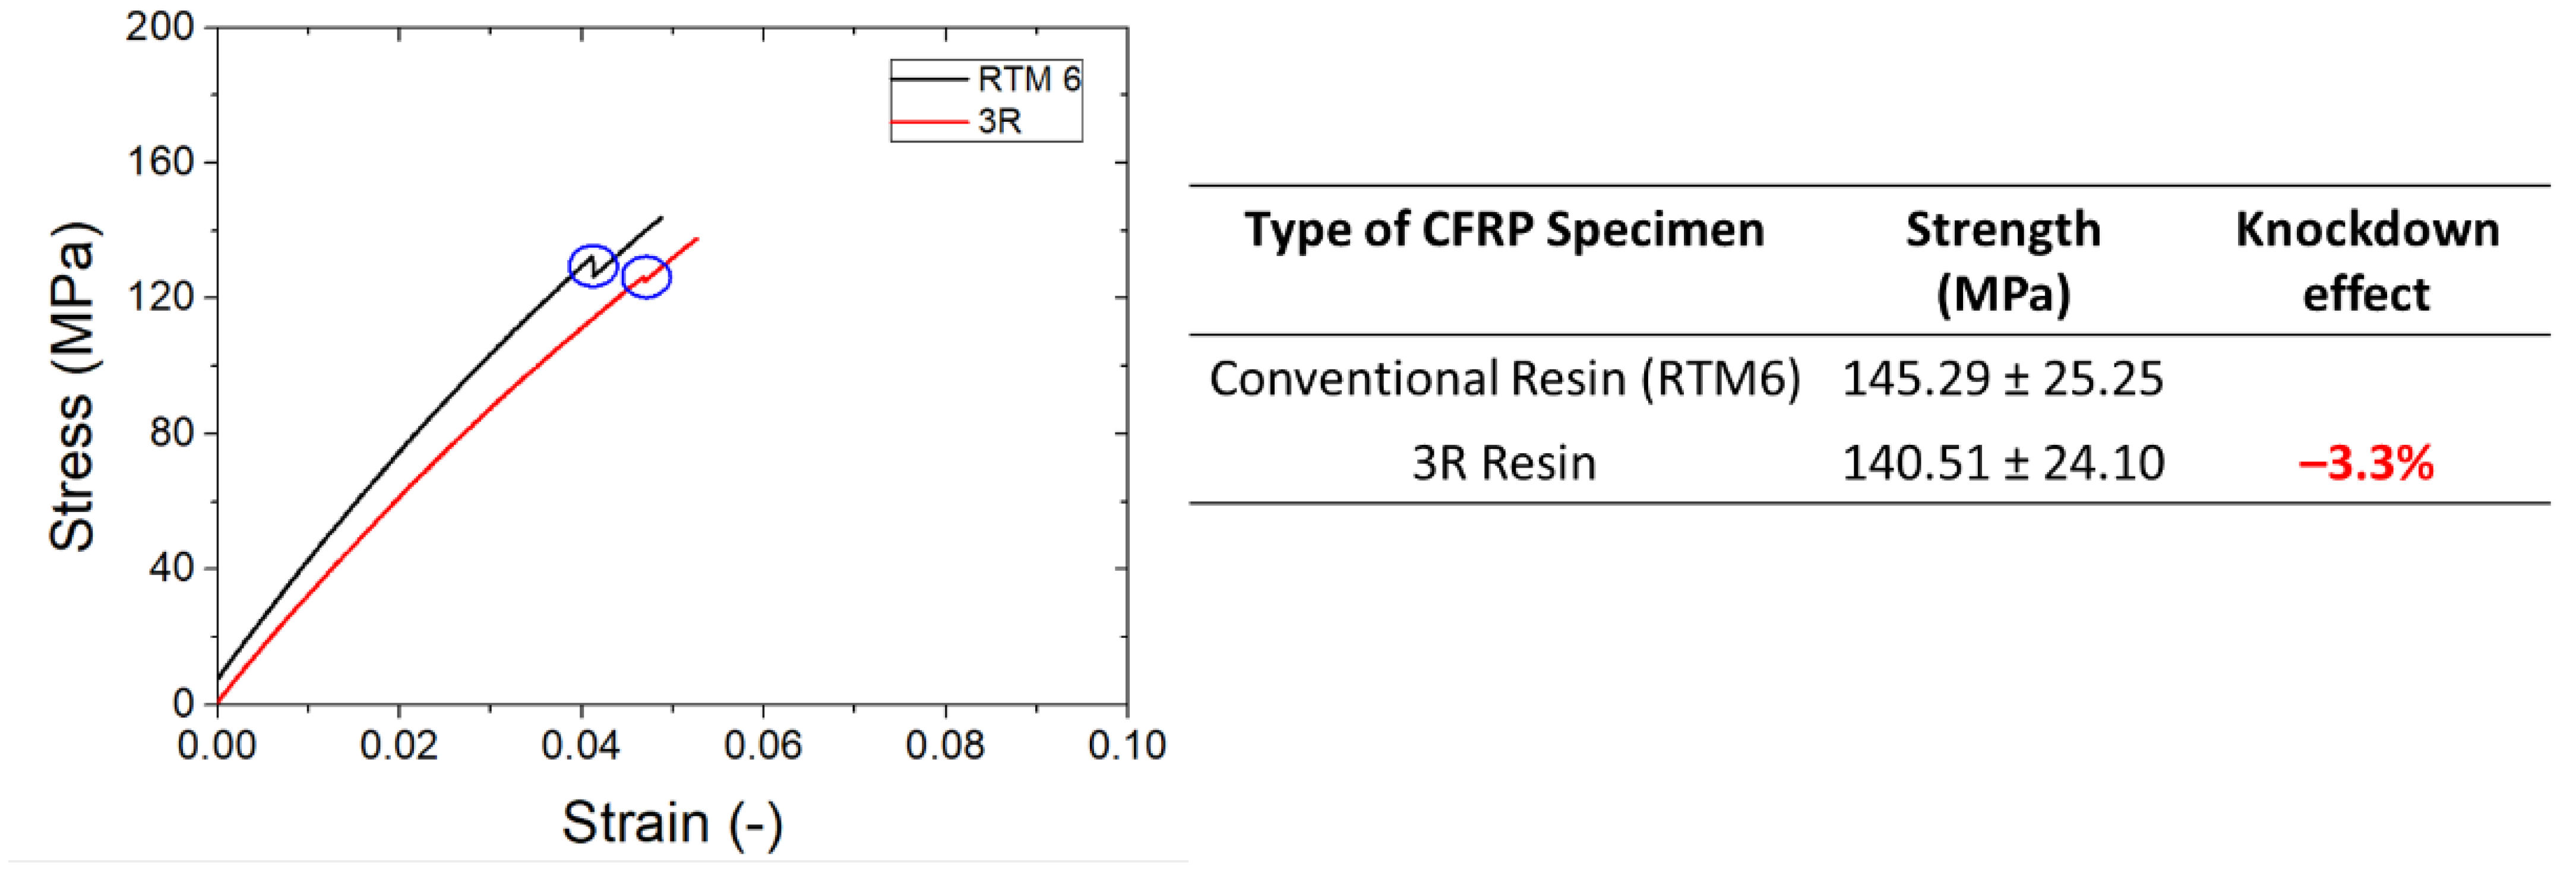
3.4.1. Knockdown Effect on Mechanical Properties

3R lap strap specimens exhibited a knockdown effect of 3.3% compared to the conventional specimens (Figure 24). Additionally, the 3R specimens exhibited a load drop smaller than in the case of conventional specimens.

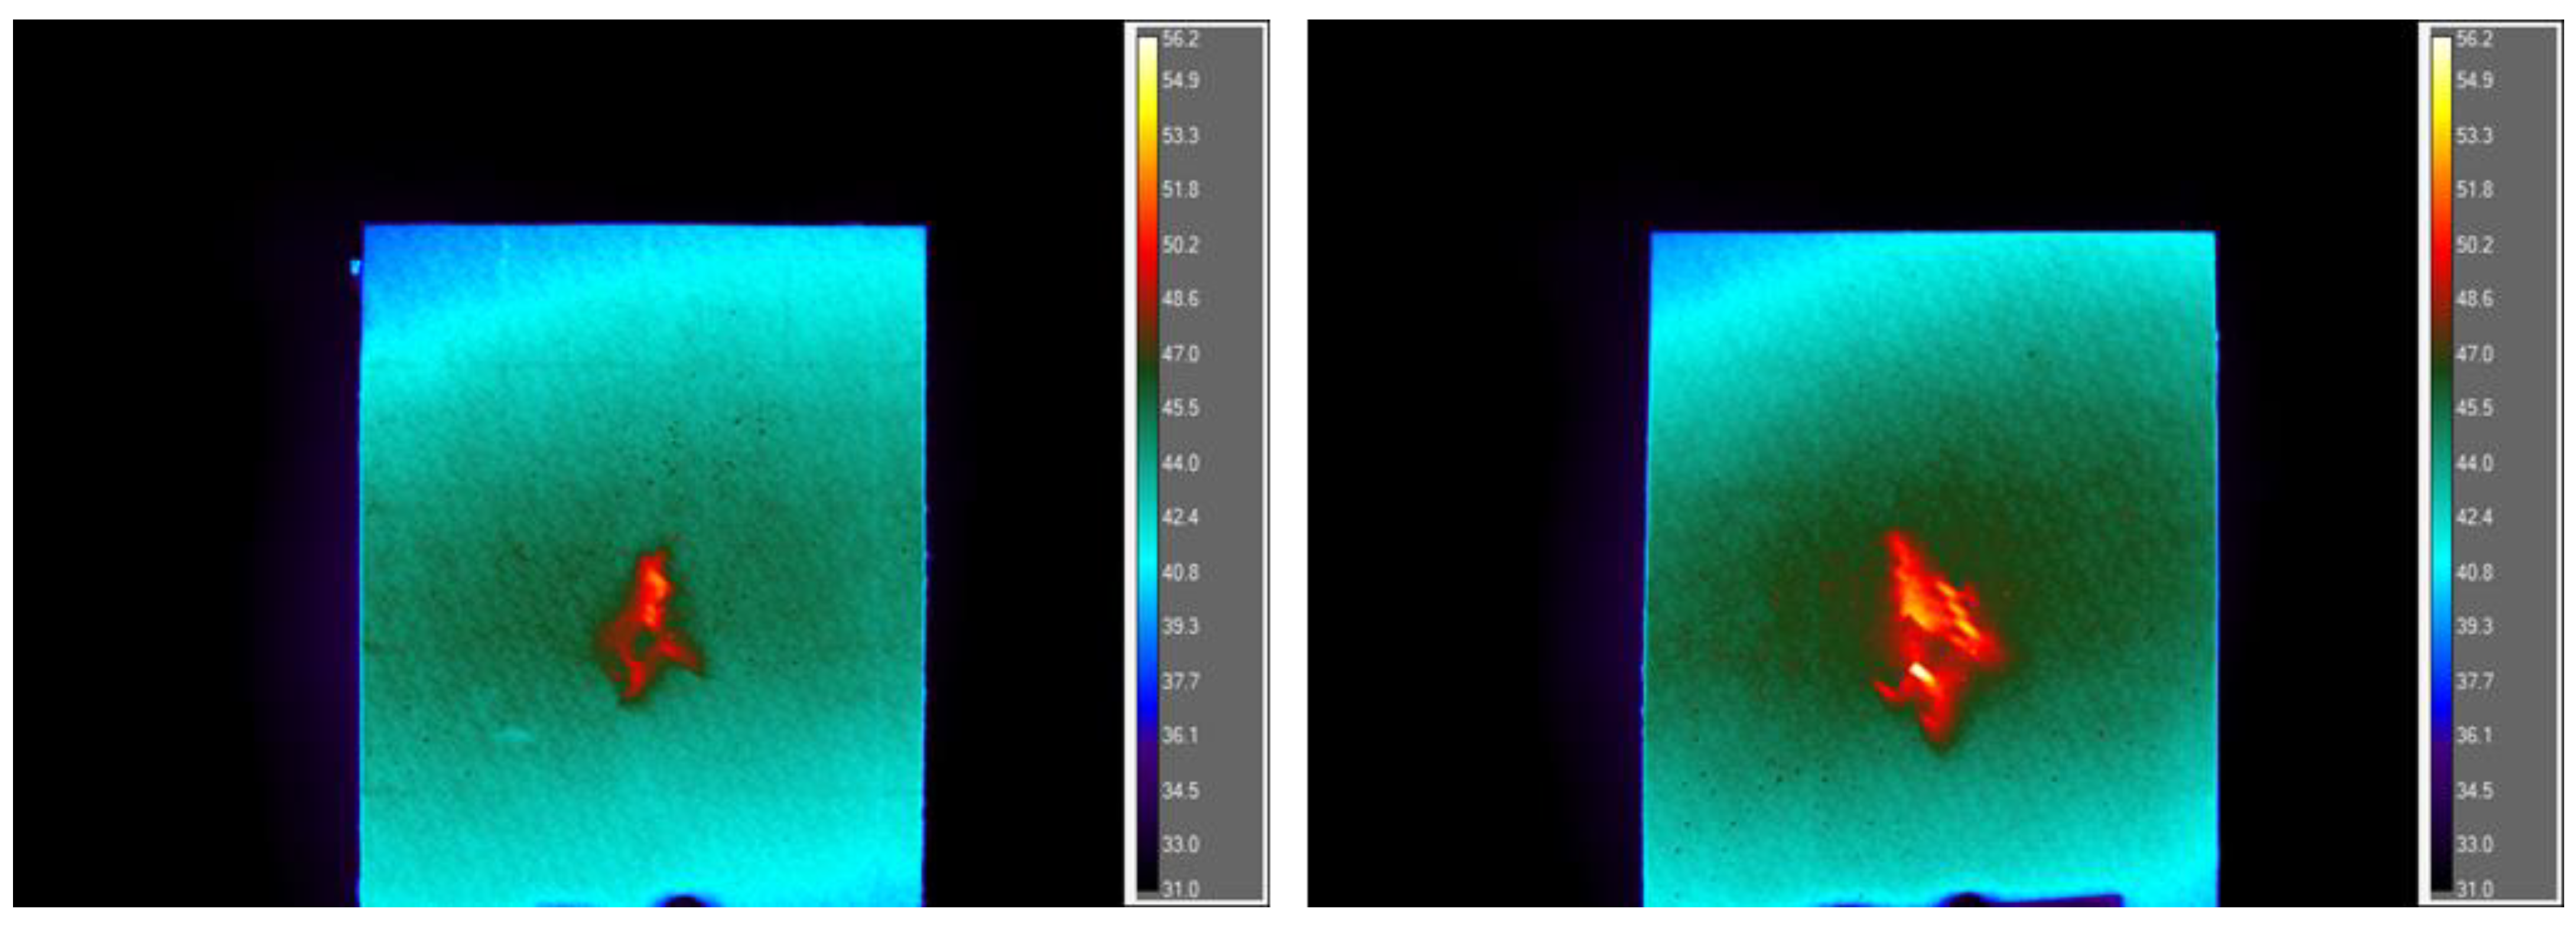
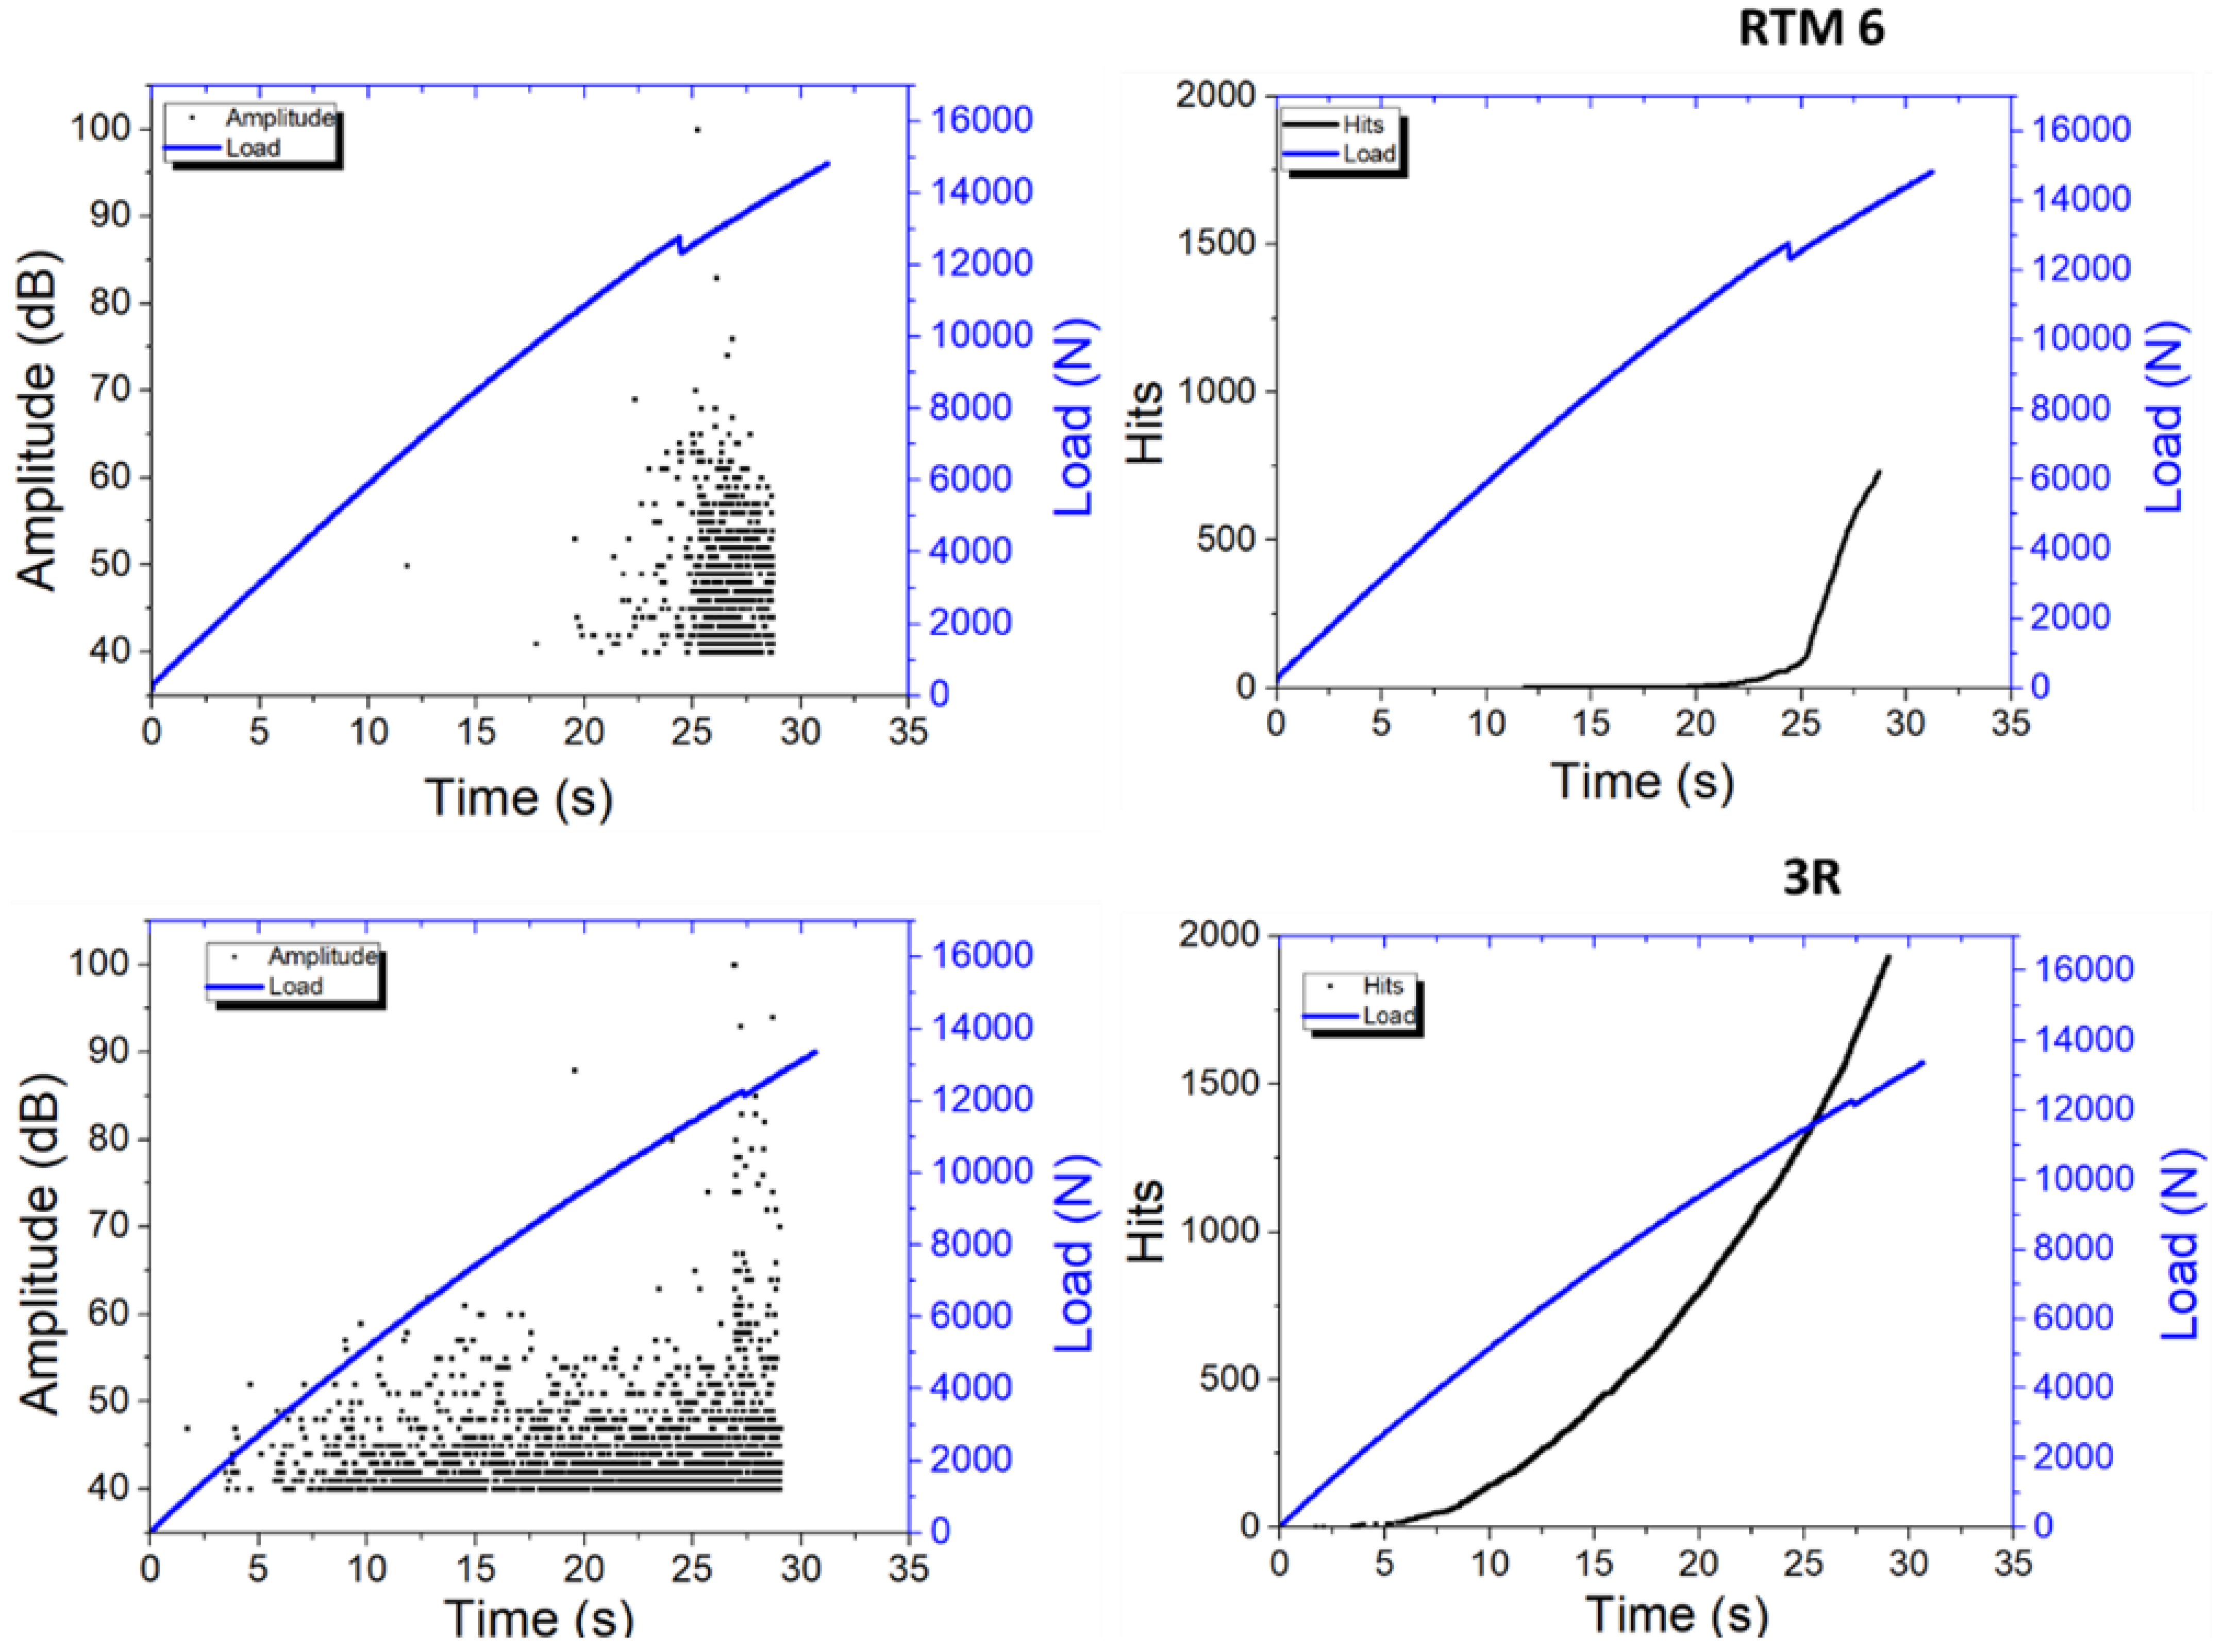
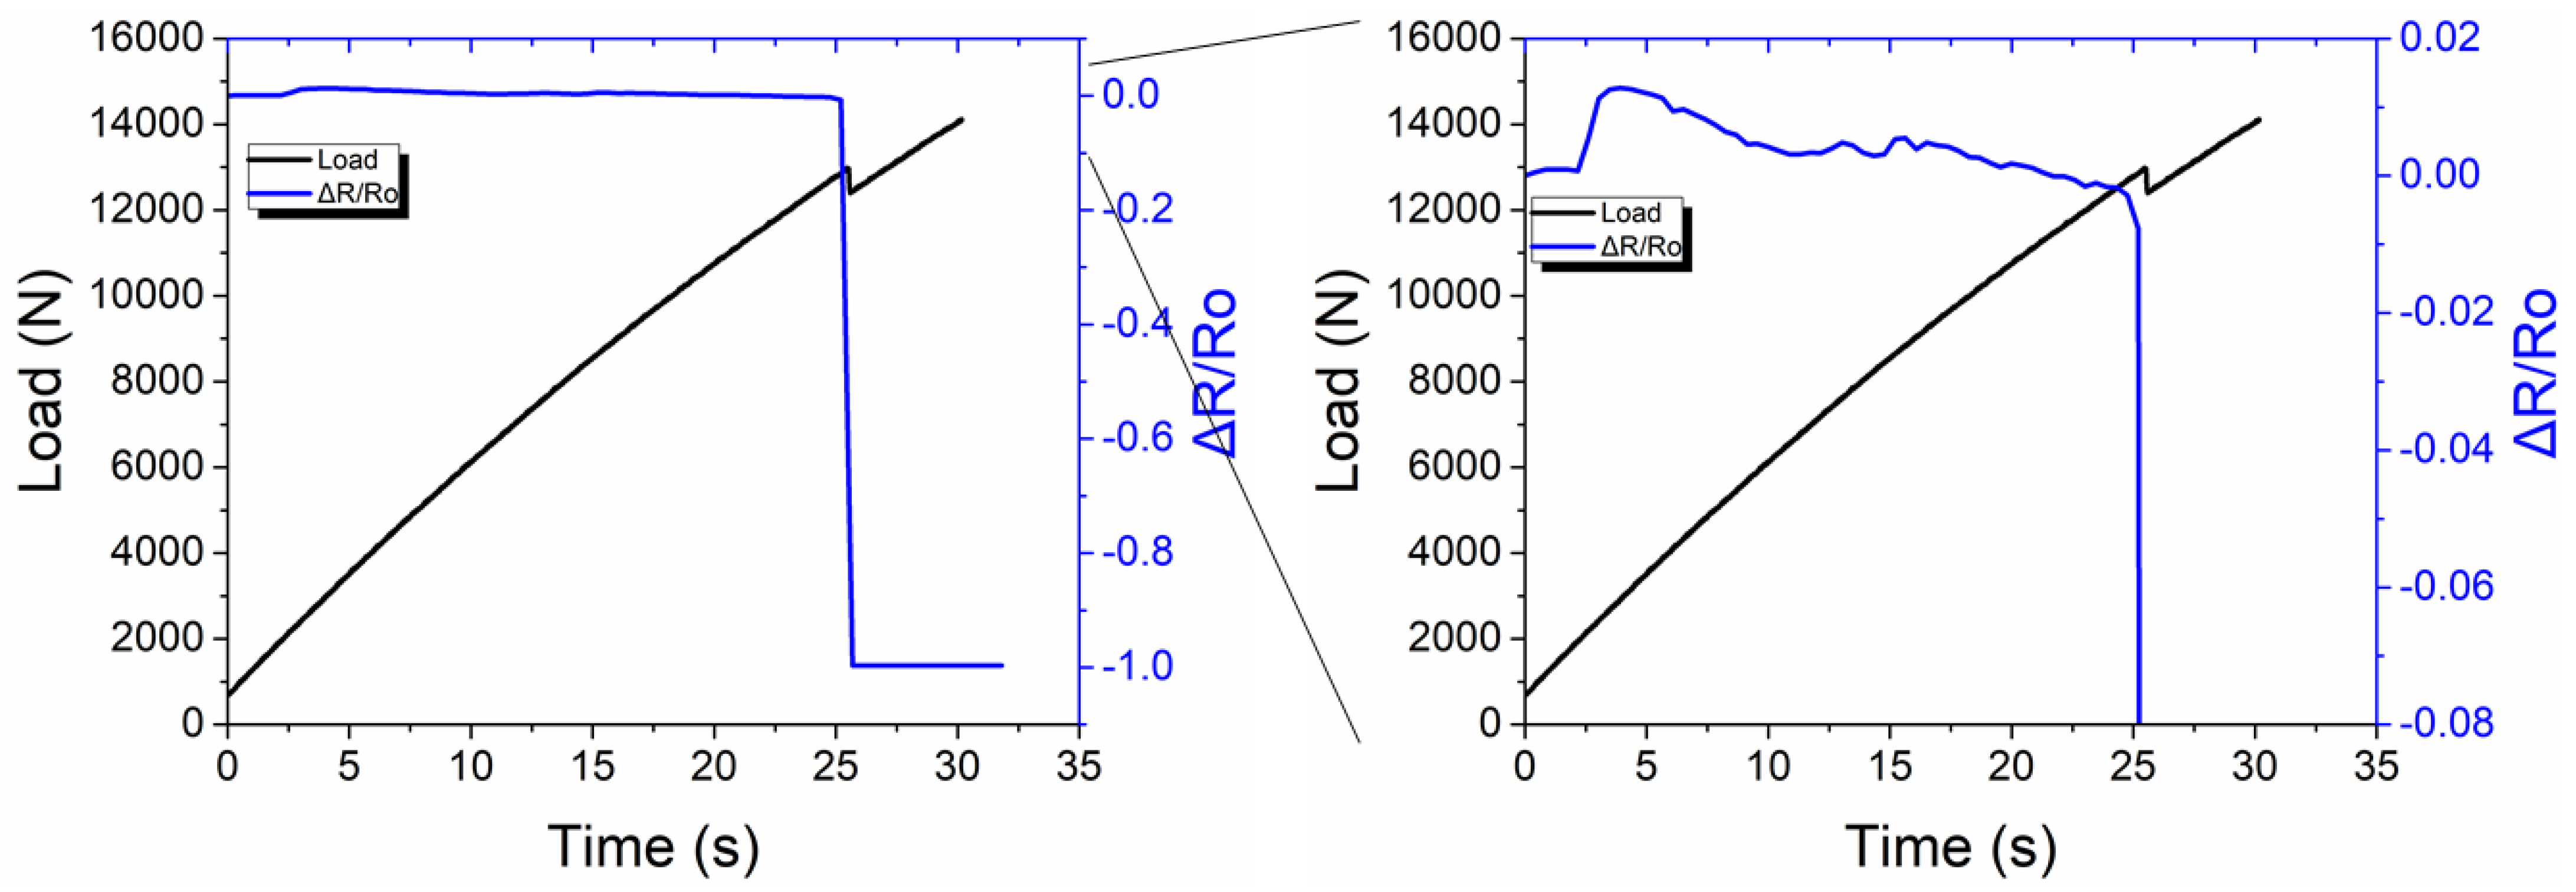
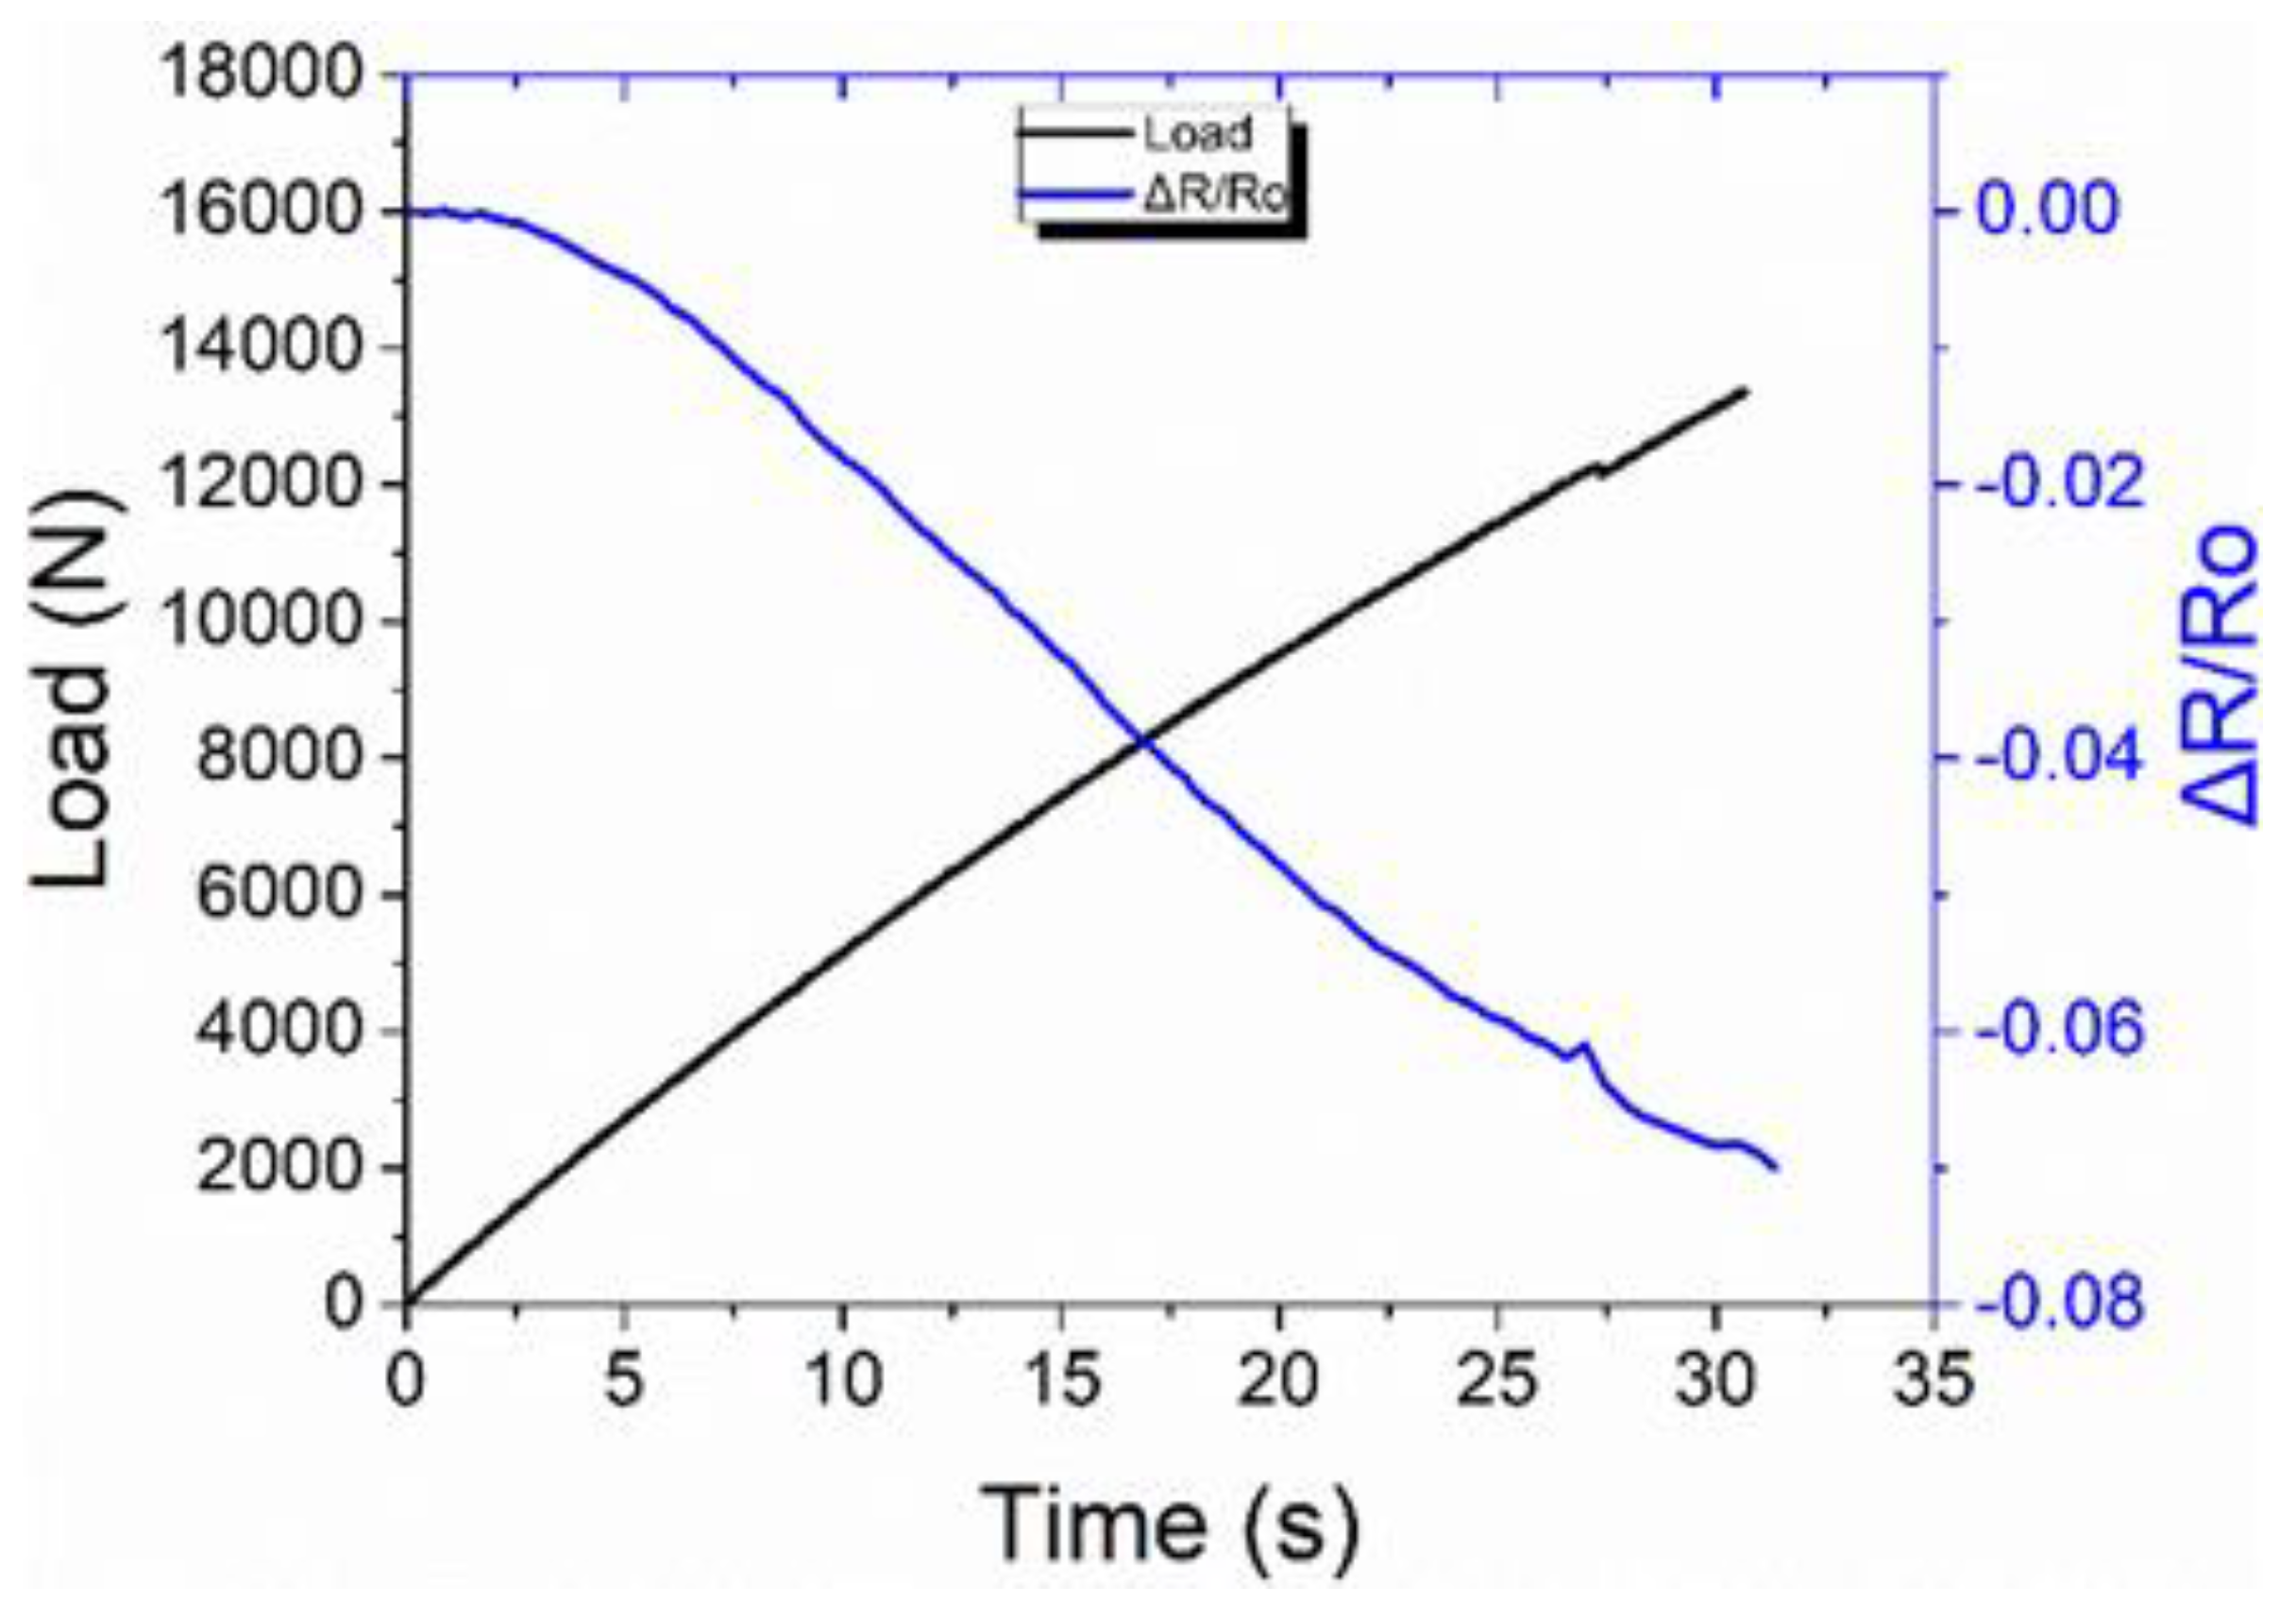
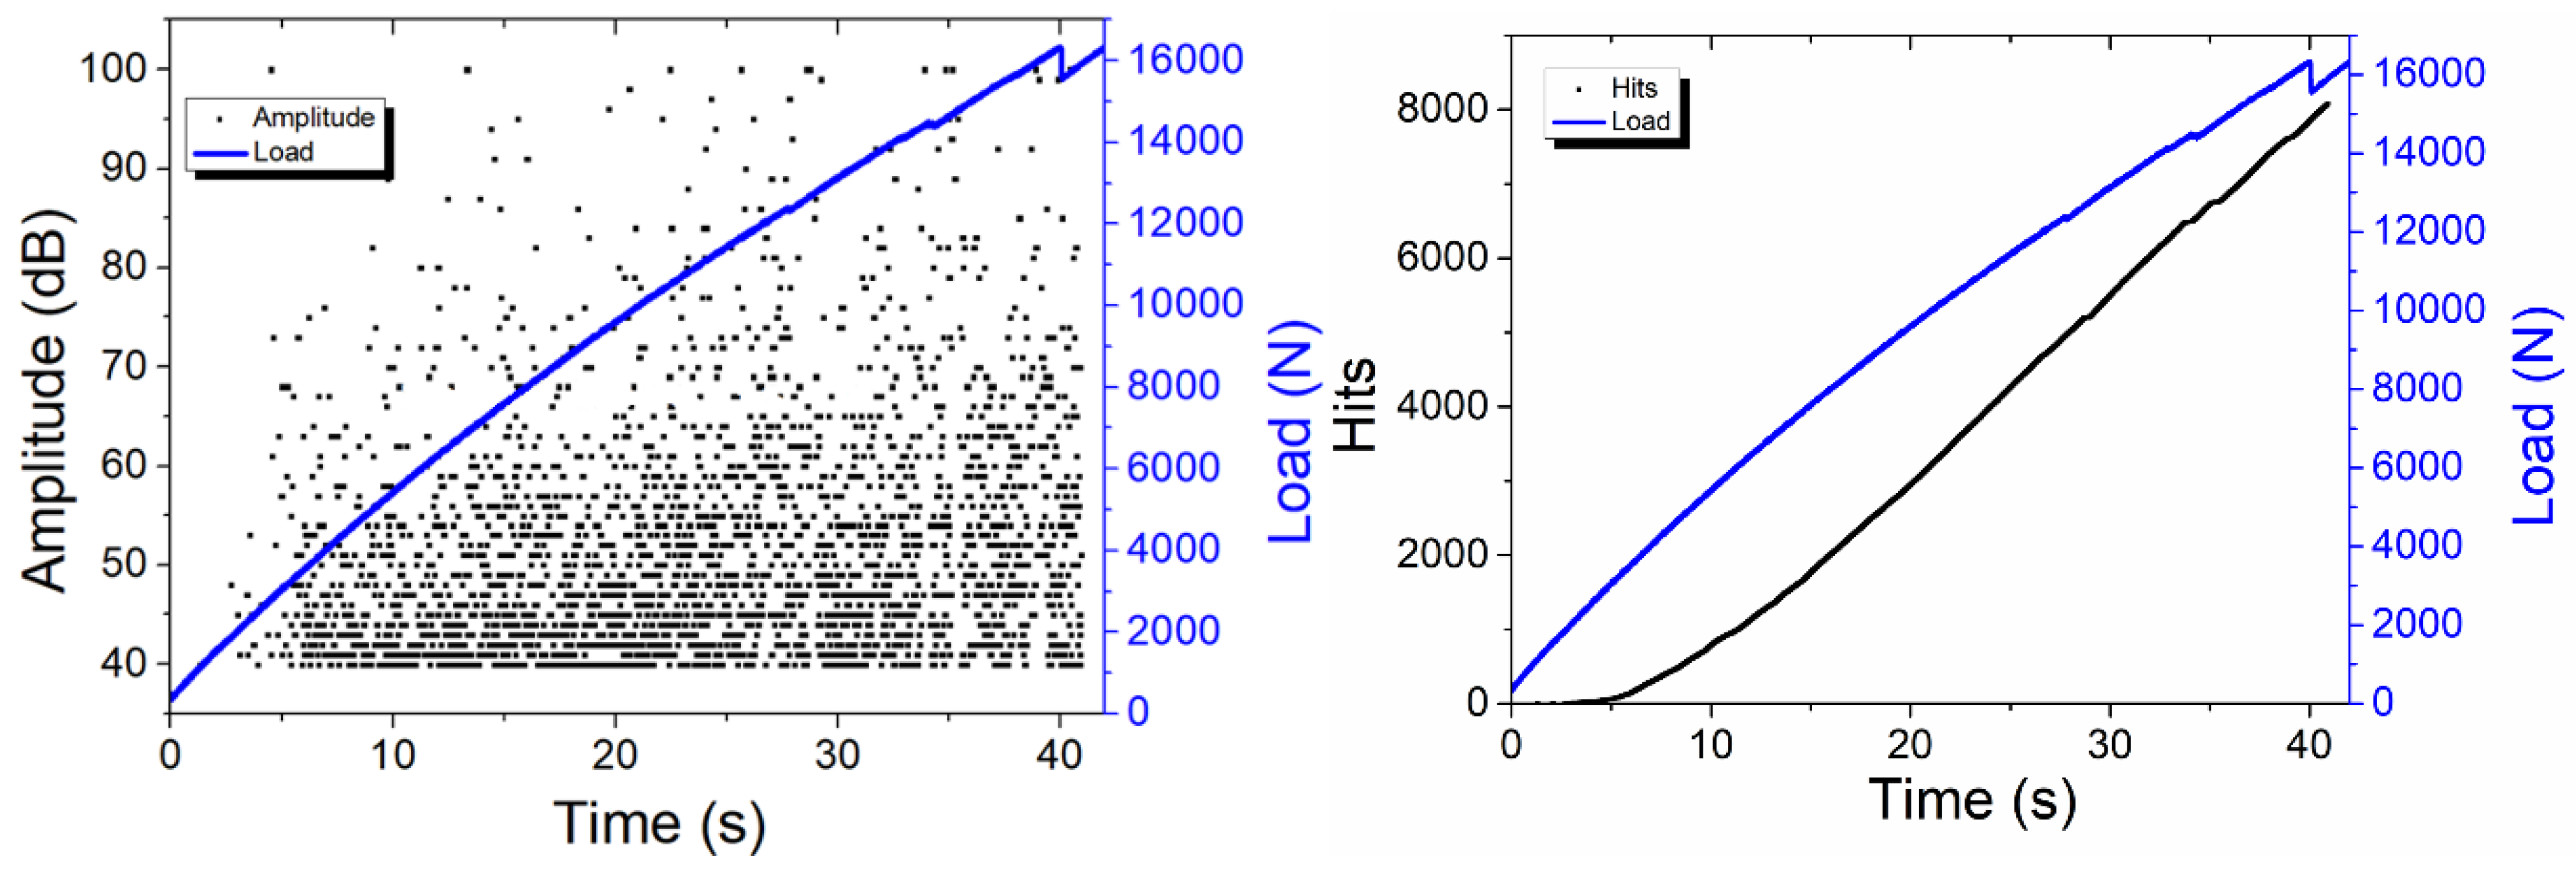
3.4.2. Non-Destructive Evaluation via Electrical Resistance Change Method and Acoustic Emission

Acoustic Emission

The AE activity of the 3R specimen (Figure 25 (bottom)) presented a higher population of low-amplitude hits (40–60 dB) and fewer hits at a high amplitude, which occurred at the initial failure of the lap strap joint. The low-amplitude hits were related to matrix cracking from the beginning of the lap strap test due to tensile loading. Before the debonding of the lap from the strap, high-amplitude hits (60–80 dB) were accumulated, denoting shear failure. On the contrary, the RTM6 specimens only exhibited their total AE activity before the debonding (Figure 25 (top)). Most of the recorded hits were in the range of 40–60 dB and a few in the range of 60–80 dB, indicating that the specimen failure mainly occurred by matrix cracking.

Electrical Resistance Change Method

Figure 26 (left) presents the electrical behavior during the mechanical test of the RTM6 specimen. The initial resistance of the specimen before the damage was ca. 167 kohm. This value showed that the lap was electrically isolated by the strap. As aforementioned, electrical isolation was achieved with the good impregnation of the carbon fibers with the RTM6 resin, which prevents inter-fiber contact. A slight decrease in the resistance was observed during the elastic deformation of the specimen. This is typically an indication of strain-dependent behavior on the elastic deformation, which precedes damage phenomena. A sharp drop of the resistance designated the delamination onset. As should be noted, this delamination onset was followed by the very brittle local failure of the matrix and extended bridging between the lap and the strap by bare carbon fibers, as the surrounding matrix had disappeared (Figure 27).
This led to the creation of an electrical shortcut between the lap and the strap and the abrupt reduction in electrical resistance to levels comparable to that of the resistance of carbon fibers.
The 3R specimen had an initial resistance of ~2 ohm. A conclusion that can be drawn from this small value of resistance is that the impregnation of the carbon fibers with the 3R resin allowed inter-fiber contacts and thereby reducing the total resistance. This may be either attributed to unimpeded resin flow, or, conversely, to poor impregnation. As dry spots were observed in the case of the 3R composites, the second explanation is highly possible. The area where the elastic deformation took place can be clearly observed in Figure 28, with an almost proportional dependence of the resistance to the elongation of the specimen. As expected, the delamination onset, i.e., the failure of the lap strap geometry, was detected by a discontinuity in the resistance vs. time curve. In contrast, after failure, the resistance rise was masked by the deformation sensing, and the resistance continued to have a downtrend.
The analysis of the NDE results from AE and ERCM techniques led to the following conclusions. RTM6 presented a highly brittle behavior, as indicated both by the AE results as well as the electrical resistance change findings, whereby the load was accumulated in the adhesive until the point where an abrupt load release was manifested as a sudden rupture. In more detail, the AE activity of the lap strap specimens manufactured with RTM6 began as the specimen departed from the elastic deformation region and culminated to the point of its sudden failure when a part of this load was released, most probably due to the unstable crack propagation. This was confirmed by the ΔR/R0 results, where no significant change was observed until that specific point where a sudden drop in the resistance due to the brittle matrix fracture, which allowed for the short-circuiting of the carbon fiber insulation, was observed.
On the other hand, the 3R resin seemed to fail in a less brittle manner, which could indicate a more stable crack growth. In this case, a considerable amount of hits was accumulated when the specimen was still in the elastic deformation region. The amplitude of the accumulated hits denoted that cracks were forming in the matrix until the point of the first fracture, where a crack propagation might have happened. These specimens contained manufacturing defects, as already confirmed by ultrasonic inspection and IR-thermography images (presented in Section 3.2.2). Such defects may have acted as crack initiation points at the early stages of the mechanical test. The extent of the failure of the 3R adhesive layer was smaller than the respective failure of the RTM6 specimen, as indicated by the smaller load drop. In this case, this critical point of the first fracture was also characterized by some fiber breakages, as indicated by the accumulated high-amplitude hits in the 3R specimen’s AE plot. The smooth failure process of the 3R resin specimens was also evident in the electrical resistance change results, where a gradual decrease of the resistance was observed throughout the test, while at the delamination between the lap and the strap onset, the discontinuity was manifested as a small increase in the resistance.

3.4.3. Repair Efficiency

The repaired lap strap specimens presented improved strength values compared to the initial specimens (Figure 29). Specifically, the initial 3R composites showed an average maximum strength of 140.51 ± 24.11 MPa, while the repaired composites exhibited an average maximum strength of 155.62 ± 19.86 MPa. The repair efficiency was calculated to be 110.8%. The increase of the strength values after repair may be attributed to welding phenomena that occur in the 3R composites during the repair cycle. During repair, the applied heat and pressure caused a slight consolidation of the interface between the lap and the strap (welding), resulting in an increase in the bonding strength between the two parts. Moreover, the repair cycle promoted the adhesion with further 3R resin interdiffusion between the two parts. This was also confirmed via the comparison of the initial and the repaired resistance values that were obtained from the ERCM and are presented below.

3.4.4. Non-Destructive Evaluation

Acoustic Emission

The repaired 3R specimens presented a rich AE activity from the beginning of the lap strap test (Figure 30). The amplitude of the hits ranged from 40 dB to 100 dB, denoting that multiple fracture mechanisms took place simultaneously, i.e., matrix cracks, fiber pull-outs, and fiber breakage. This behavior, which is distinctly different from the behavior of the initial specimen, can be attributed to the presence of the loading history due to the first mechanical test and the conditions of the repair process. At this point, it should be mentioned that the repair took place by applying pressure and heat only at the bonding area, as illustrated in Figure 31. The remaining area of the strap was not repaired; thus. the initial cracks were not eliminated. For this reason, fiber breakages occurred at low loadings at stress concentrations due to the formed cracks at the early stages of the test, as shown in Figure 30 by the accumulation of several hits with 80–100 dB amplitude. This rich acoustic activity at high dB levels, that appeared at the early stages of testing for the repaired specimens, but was not present in the case of the initial specimen, was indicative of pre-existing damage which led to early acoustic emission phenomena due to secondary damage already present, an analogue to the felicity effect [17]. It may be postulated that this activity was due to accumulated damage at the non-repaired area of the specimen, where cracks were formed during the first loading cycle, and led to the subsequent fiber failure during the second loading cycle. This assumption is further supported via the comparison of the acoustic profile of the repaired specimen at the early stages of testing with the respective acoustic profile of the initial 3R specimen (Figure 25 (bottom left)) at the final failure stage. As can be seen, the two profiles are quite similar. The rich activity was continuously observed throughout the test of the repaired specimen and masked the final failure, where normally high amplitude AE signals are exhibited.
Furthermore, by comparing the plot in Figure 30 (right) with the plot in Figure 25 (bottom right), it can be seen that both their mechanical and AE behavior presented distinct differences. The failure of the initial specimen occurred just above 12 kN, while the repaired specimen failed at almost 16 kN. However, prior to the final delamination between the lap and the strap, the repaired specimen also presented several small drops in the recorded load at lower values, i.e., at ~10 kN, ~12 kN, ~14 kN, and just above 14 kN before the final failure. Similarly, the acoustic profile of the initial specimen presented cumulative AE hits that increased until the debonding of the lap from the strap, where a small decrease in its AE activity was recorded. On the other hand, the acoustic profile of the repaired 3R specimen presented many more total hits until its final failure, as well as three distinct intervals, before the final failure, where its AE cumulative hits curve reached a plateau. These plateaus were observed at the time where the mechanical plot of the specimen showed the small drops of the load before the final load drop, denoting the failure of the specimen.
It is postulated that at the first loading process (initial specimen), critical cracks appeared in the material only during the final failure just above 12 kN, while at the early stages of loading, the combined information from the mechanical and the AE profiles did not show any evidence of critical cracks. However, small noncritical cracks were formed during the early stages of loading, as indicated by the amplitude of the hits (Figure 25 (bottom left)). Those cracks could not cause the failure of the specimen; however, they caused an accumulation of damage which led to the unstable crack growth, where a critical crack initiated and developed between the lap and the strap, and this caused the failure of the specimen. By comparing the loading process of the 3R initial specimen with the RTM6 specimen, a more stable crack growth can be observed for the 3R specimen at the early stages of loading. When the repair process was performed, those noncritical cracks were successfully repaired to some extent and the repaired specimen failed at higher load values (~16 kN). It should be noted, although it is obvious, that only noncritical cracks located at the parts of the specimens where heat and pressure have been applied could have been repaired (Figure 31).
Overall, the loading history and the repair process affected the fracture process in the case of the 3R resin. During the early stages of loading of the repaired specimens, multiple noncritical cracks appeared together with secondary damage phenomena due to pre-existing damage in the parts of the specimen that were not repaired. This was not the case in the initial specimen, where obvious damage was not yet present, during its first loading cycle. These cracks were seen in both the mechanical and the AE profiles of the repaired specimen, as small load drops or plateaus, respectively, before the final failure, as commented above. This denotes a change in the fracture process of the material, indicating a more stable crack growth in the repaired sample in comparison to the initial one. This fracture behavior suggests that the material has become tougher.

Electrical Resistance Change Method

Figure 32 illustrates the force vs. time plot with concurrent monitoring of the relative electrical resistance change during the mechanical test of the repaired 3R lap strap specimen. The resistance of the repaired specimen was 1.47 ohm, 26.5% lower than the resistance of the initial 3R lap strap specimen. The applied pressure and the high temperature during the repair process were responsible for this phenomenon. The same electrical behavior with the initial specimen was observed during the test of the repaired specimen. A strain-dependent area of the resistance occurred at the early stages of the test. After almost 26 s, debonding took place at the adhesive between the lap and the strap before the failure of the specimen. Every step of the crack propagation was identified by the ERCM as small peaks in the resistance due to the reduction of the contact area between the lap and the strap. These smaller peaks confirmed that the failure of the specimen did not occur by unstable crack propagation but via a cumulative accumulation of multiple shorter cracks. This observation confirms the analysis that was presented in Acoustic Emission Section.

4. Conclusions

This study focused on the evaluation of the knockdown effect between a conventional typical aerospace-grade epoxy resin (RTM6) and a vitrimer epoxy resin. The vitrimer resin was re-processable, repairable, and recyclable (3R-resin). The repair efficiency of the 3R composites was also estimated. Various mechanical tests were performed simultaneously with NDE techniques such as impedance spectroscopy, acoustic emission, IR- thermography, phased array ultrasonics, and electrical resistance change method.
ILSS and low-velocity impact results presented a negligible knockdown effect of about 3–4%, proving that the 3R resin had similar mechanical properties to the conventional (RTM6) resin. Repair efficiency values of 72% were also calculated for the ILSS geometry. At low-velocity impact specimens, the values recovered by 87% in terms of average maximum load and by 105% in terms of the absorbed energy at two energy levels (9 J and 15 J). The impedance spectroscopy was used to evaluate the impregnation of the carbon fibers and offered a complete view of the electrical behavior of the ILSS geometry. Conventional specimens exhibited higher impedance than 3R specimens. This showed that carbon fibers were better impregnated by the conventional resin than by the 3R resin. The impedance values of the 3R specimens were similar to the carbon fiber values, denoting the appearance of shortcuts between the fibers, which indicated poor wetting/impregnation by the 3R resin. An increase in the impedance occurred in both types of specimens due to delamination. The impedance was restored after the repair of the 3R specimens, while the damage in the repaired specimens caused a further reduction in the magnitude of the impedance, probably by exposing the carbon fibers.
The phased array ultrasonics offered a picture of the remaining defects from the production and the repair processes and a quantitative damage detection on the impacted specimens, with high accuracy at impact tests. The IR thermography confirmed the phased array results with high sensitivity at the small defects on the surface of the impacted specimens, which acted as heat traps. The knockdown effect was evaluated approximately at ≈−3.0% in terms of maximum load or ≈−1.9% using the maximum strength values at CAI tests after a 9 J impact. At the 15 J impact, the knockdown effect of 3R specimens was −4.3% in terms of maximum load and −1.1% in compression strength.
The lap strap, a geometry that can simulate the stiffening of a composite panel, exhibited a knockdown effect of about 3% between the RTM6 and 3R composites. However, lap strap specimens recovered about 110% of their initial values due to the welding phenomenon that occurred during the repair process. The acoustic emission technique provided crucial information about the evolution of the fracture process. The RTM6 specimens presented a sudden rupture as the AE activity accumulated only at the point of lap strap failure, denoted by a higher population of low-amplitude hits (matrix cracks) and fewer hits at a high amplitude (shear damages and fiber breakages). On the other hand, the 3R specimens had a rich low-amplitude AE activity from the early stages of the test, declaring crack formation in the matrix before the failure. These cracks were due to manufacturing defects identified by ultrasonics and IR-thermography which acted as initiation points. Additionally, after the repair process, the AE technique revealed the existence of initial cracks as well as the effects of the loading history. The electrical resistance change method was applied to the lap strap simultaneously with the mechanical testing. ERCM proved to be a valuable technique for monitoring deformations before the debonding initiation and the progress of the damage with consistency and high sensitivity in real time.

Author Contributions

Methodology, M.K., G.F., K.T., A.R.d.L., D.C.Z. and S.W.; writing—original draft preparation, M.K., G.F. and K.T.; writing—review and editing, K.T. and A.S.P.; supervision, A.S.P.; project administration, N.M. All authors have read and agreed to the published version of the manuscript.

Funding

This research received funding from the European Union’s Horizon 2020 research and innovation program under grant agreement No 769274, “AIRPOXY”.

Institutional Review Board Statement

Not applicable.

Informed Consent Statement

Not applicable.

Conflicts of Interest

The authors declare no conflict of interest.

References

  1. Tiwary, A.; Kumar, R.; Chohan, J.S. A review on characteristics of composite and advanced materials used for aerospace applications. Mater. Today Proc. 2021, 51, 865–870. [Google Scholar] [CrossRef]
  2. Luan, C.; Movva, S.; Wang, K.; Yao, X.; Zhang, C.; Wang, B. Towards next-generation fibre-reinforced polymer composites: A perspective on multifunctionality. Funct. Compos. Struct. 2019, 1, 042002. [Google Scholar] [CrossRef]
  3. Lincoln, R.L.; Scarpa, F.; Ting, V.P.; Trask, R.S. Multifunctional composites: A metamaterial perspective. Multifunct. Mater. 2019, 2, 043001. [Google Scholar] [CrossRef]
  4. Asghar, S.; Syed, H.K.; Bin Liew, K.; Khan, I.U.; Salman, S. Multifunctional Polymer Matrix Composites. Encycl. Mater. Compos. 2021, 937–946. [Google Scholar] [CrossRef]
  5. Bekas, D.G.; Sharif-Khodaei, Z.; Baltzis, D.; Aliabadi, M.H.F.; Paipetis, A.S. Quality assessment and damage detection in nanomodified adhesively-bonded composite joints using inkjet-printed interdigital sensors. Compos. Struct. 2019, 211, 557–563. [Google Scholar] [CrossRef]
  6. Bekas, D.; Grammatikos, S.A.; Kouimtzi, C.; Paipetis, A.S. Linear and non-linear electrical dependency of carbon nanotube reinforced composites to internal damage. IOP Conf. Ser. Mater. Sci. Eng. 2015, 74, 012002. [Google Scholar] [CrossRef]
  7. Foteinidis, G.; Paipetis, A.S. A novel composite with structural health monitoring functionality via 2D and 3D impedance mapping topography. Appl. Sci. 2021, 11, 1647. [Google Scholar] [CrossRef]
  8. Li, E.; Pan, Y.; Wang, C.; Liu, C.; Shen, C.; Pan, C.; Liu, X. Multifunctional and superhydrophobic cellulose composite paper for electromagnetic shielding, hydraulic triboelectric nanogenerator and Joule heating applications. Chem. Eng. J. 2021, 420, 129864. [Google Scholar] [CrossRef]
  9. Karalis, G.; Tzounis, L.; Tsirka, K.; Mytafides, C.K.; Voudouris Itskaras, A.; Liebscher, M.; Lambrou, E.; Gergidis, L.N.; Barkoula, N.M.; Paipetis, A.S. Advanced Glass Fibre Polymer Composite Laminate Operating as a Thermoelectric Generator: A Structural Device for Micropower Generation and Potential Large-Scale Thermal Energy Harvesting. ACS Appl. Mater. Interfaces 2021, 13, 24138–24153. [Google Scholar] [CrossRef]
  10. Karalis, G.; Mytafides, C.K.; Tzounis, L.; Paipetis, A.S.; Barkoula, N.M. An approach toward the realization of a through-thickness glass fibre/epoxy thermoelectric generator. Materials 2021, 14, 2173. [Google Scholar] [CrossRef]
  11. Mytafides, C.K.; Tzounis, L.; Karalis, G.; Formanek, P.; Paipetis, A.S. Fully printed and flexible carbon nanotube-based thermoelectric generator capable for high-temperature applications. J. Power Sources 2021, 507, 230323. [Google Scholar] [CrossRef]
  12. Karalis, G.; Tzounis, L.; Mytafides, C.K.; Tsirka, K.; Formanek, P.; Stylianakis, M.; Kymakis, E.; Paipetis, A.S. A high performance flexible and robust printed thermoelectric generator based on hybridized Te nanowires with PEDOT:PSS. Appl. Energy 2021, 294, 117004. [Google Scholar] [CrossRef]
  13. Kosarli, M.; Bekas, D.G.; Tsirka, K.; Baltzis, D.; Vaimakis-Tsogkas, D.; Orfanidis, S.; Papavassiliou, G.; Paipetis, A.S. Microcapsule-based self-healing materials: Healing efficiency and toughness reduction vs. capsule size. Compos. Part B Eng. 2019, 171, 78–86. [Google Scholar] [CrossRef]
  14. Kosarli, M.; Tsirka, K.; Chalari, S.; Palantza, A.; Paipetis, A.S. Recovery of Fracture Toughness on Self-Healing Epoxies Using Ternary Nanomodified Microcapsules: A Parametric Study. Key Eng. Mater. 2020, 827, 258–262. [Google Scholar] [CrossRef]
  15. Rodriguez, R.; Bekas, D.G.; Flórez, S.; Kosarli, M.; Paipetis, A.S. Development of self-contained microcapsules for optimised catalyst position in self-healing materials. Polymer 2020, 187, 122084. [Google Scholar] [CrossRef]
  16. Kosarli, M.; Foteinidis, G.; Tsirka, K.; Bekas, D.G.; Paipetis, A.S. Concurrent recovery of mechanical and electrical properties in nanomodified capsule-based self-healing epoxies. Polymer 2021, 227, 123843. [Google Scholar] [CrossRef]
  17. Tsilimigkra, X.; Bekas, D.; Kosarli, M.; Tsantzalis, S.; Paipetis, A.; Kostopoulos, V. Mechanical properties assessment of low-content capsule-based self-healing structural composites. Appl. Sci. 2020, 10, 5739. [Google Scholar] [CrossRef]
  18. Kosarli, M.; Bekas, D.; Tsirka, K.; Paipetis, A.S. Capsule-based self-healing polymers and composites. In Self-Healing Polymer-Based Systems; Elsevier: Amsterdam, The Netherlands, 2020; ISBN 9780128184509. [Google Scholar]
  19. Kosarli, M.; Polymerou, A.; Foteinidis, G.; Vazouras, C.; Paipetis, A.S. Healing efficiency of CNTs-modified-UF microcapsules that provide higher electrical conductivity and EMI shielding properties. Polymers 2021, 13, 2753. [Google Scholar] [CrossRef]
  20. Hult, J.; Rammerstorfer, F.G. Engineering Mechanics of Fibre Reinforced Polymers and Composite Structures; Springer: Berlin/Heidelberg, Germany, 1994; ISBN 9783211826522. [Google Scholar]
  21. Silberschmidt, V. Dynamic Deformation, Damage and Fracture in Composite Materials and Structures; Elsevier: Amsterdam, The Netherlands, 2016; ISBN 9789896540821. [Google Scholar]
  22. Safri, S.N.A.; Sultan, M.T.H.; Yidris, N.; Mustapha, F. Low velocity and high velocity impact test on composite materials—A review. Int. J. Eng. Sci. 2014, 3, 50–60. [Google Scholar]
  23. Falzon, B.G. Impact damage and repair of composite structures. Aeronaut. J. 2009, 113, 431–445. [Google Scholar] [CrossRef]
  24. Katunin, A.; Dragan, K.; Dziendzikowski, M. Damage identification in aircraft composite structures: A case study using various non-destructive testing techniques. Compos. Struct. 2015, 127, 1–9. [Google Scholar] [CrossRef]
  25. Moustakidis, S.; Anagnostis, A.; Karlsson, P.; Hrissagis, K. Non-destructive inspection of aircraft composite materials using triple IR imaging. IFAC-PapersOnLine 2016, 49, 291–296. [Google Scholar] [CrossRef]
  26. Harizi, W.; Chaki, S.; Bourse, G.; Ourak, M. Mechanical damage assessment of Polymer-Matrix Composites using active infrared thermography. Compos. Part B Eng. 2014, 66, 204–209. [Google Scholar] [CrossRef]
  27. Maio, L.; Memmolo, V.; Boccardi, S.; Meola, C.; Ricci, F.; Boffa, N.D.; Monaco, E. Ultrasonic and IR Thermographic Detection of a Defect in a Multilayered Composite Plate. Procedia Eng. 2016, 167, 71–79. [Google Scholar] [CrossRef]
  28. Genest, M.; Martinez, M.; Mrad, N.; Renaud, G.; Fahr, A. Pulsed thermography for non-destructive evaluation and damage growth monitoring of bonded repairs. Compos. Struct. 2009, 88, 112–120. [Google Scholar] [CrossRef]
  29. Armstrong, K.B.; Cole, W.; Bevan, G. Care and Repair of Advanced Composites; SAE International: Warrendale, PA, USA, 2005; ISBN 0768010624. [Google Scholar]
  30. Bekas, D.G.; Tsirka, K.; Baltzis, D.; Paipetis, A.S. Self-healing materials: A review of advances in materials, evaluation, characterization and monitoring techniques. Compos. Part B Eng. 2016, 87, 92–119. [Google Scholar] [CrossRef]
  31. Yang, Y.; Xu, Y.; Ji, Y.; Wei, Y. Functional epoxy vitrimers and composites. Prog. Mater. Sci. 2021, 120, 100710. [Google Scholar] [CrossRef]
  32. Weidmann, S.; Volk, P.; Mitschang, P.; Markaide, N. Investigations on Thermoforming of Carbon Fibre Reinforced Epoxy Vitrimer Composites. Compos. Part A Appl. Sci. Manuf. 2021, 154, 106791. [Google Scholar] [CrossRef]
  33. Zhou, F.; Guo, Z.; Wang, W.; Lei, X.; Zhang, B.; Zhang, H.; Zhang, Q. Preparation of self-healing, recyclable epoxy resins and low-electrical resistance composites based on double-disulfide bond exchange. Compos. Sci. Technol. 2018, 167, 79–85. [Google Scholar] [CrossRef]
  34. Puyadena, M.; Calafel, I.; González de San Román, E.; Martin, L.; González, A.; Irusta, L. Recyclable Epoxy Resin via Simultaneous Dual Permanent/Reversible Crosslinking Based on Diels–Alder Chemistry. Macromol. Chem. Phys. 2021, 222, 20–22. [Google Scholar] [CrossRef]
  35. Builes Cárdenas, C.; Gayraud, V.; Rodriguez, M.E.; Costa, J.; Salaberria, A.M.; Ruiz de Luzuriaga, A.; Markaide, N.; Dasa Keeryadath, P.; Calderón Zapatería, D. Study into the Mechanical Properties of a New Aeronautic-Grade Epoxy-Based Carbon-Fibre-Reinforced Vitrimer. Polymers 2022, 14, 1223. [Google Scholar] [CrossRef] [PubMed]
  36. De Luzuriaga, A.R.; Martin, R.; Markaide, N.; Rekondo, A.; Cabañero, G.; Rodríguez, J.; Odriozola, I. Epoxy resin with exchangeable disulfide crosslinks to obtain reprocessable, repairable and recyclable fibre-reinforced thermoset composites. Mater. Horiz. 2016, 3, 241–247. [Google Scholar] [CrossRef]
  37. Ruiz De Luzuriaga, A.; Solera, D.; Azcarate-Ascasua, I.; Boucher, V.; Grande, H.-J.; Rekondo, A. Chemical control of the aromatic disulfide exchange kinetics for tailor-made epoxy vitrimers. Polymer 2022, 239, 124457. [Google Scholar] [CrossRef]
  38. Luterbacher, R.; Coope, T.S.; Trask, R.S.; Bond, I.P. Vascular self-healing within carbon fibre reinforced polymer stringer run-out configurations. Compos. Sci. Technol. 2016, 136, 67–75. [Google Scholar] [CrossRef] [Green Version]
  39. Grammatikos, S.A.; Paipetis, A.S. On the electrical properties of multi scale reinforced composites for damage accumulation monitoring. Compos. Part B Eng. 2012, 43, 2687–2696. [Google Scholar] [CrossRef]
  40. Todoroki, A. Delamination Monitoring Analysis of CFRP Structures using Multi-Probe Electrical Method. J. Intell. Mater. Syst. Struct. 2008, 19, 291–298. [Google Scholar] [CrossRef]
  41. Vavouliotis, A.; Paipetis, A.; Kostopoulos, V. On the fatigue life prediction of CFRP laminates using the Electrical Resistance Change method. Compos. Sci. Technol. 2011, 71, 630–642. [Google Scholar] [CrossRef] [Green Version]
  42. Hine, P.J.; Brew, B.; Duckett, R.A.; Ward, I.M. Failure mechanisms in continuous carbon-fibre reinforced PEEK composites. Compos. Sci. Technol. 1989, 35, 31–51. [Google Scholar] [CrossRef]
  43. Hine, P.J.; Brew, B.; Duckett, R.A.; Ward, I.M. The fracture behaviour of carbon fibre reinforced poly(ether etherketone). Compos. Sci. Technol. 1988, 33, 35–71. [Google Scholar] [CrossRef]
Figure 1. Schematic illustration and dimensions of the lap strap geometry.
Applsci 12 07269 g001
Figure 2. (A) Setup of the lap strap specimens for ERCM, (B) the current path marked with red arrows before damage, and (C) the current path after debonding of the lap from the strap.
Applsci 12 07269 g002
Figure 3. Schematic of the setup used for the repair process.
Applsci 12 07269 g003
Figure 4. Representative plots of ILSS specimens (left) and knockdown effect for maximum strength (right).
Applsci 12 07269 g004
Figure 5. IS scans of (left) a representative RTM6 ILSS specimen before (black) and after damage (red), and (right) a 3R specimen before (black) and after damage (red).
Applsci 12 07269 g005
Figure 6. Representative plots of ILSS specimens (left) and repair efficiency of maximum strength (right).
Applsci 12 07269 g006
Figure 7. Impedance measurements of the 3R ILSS specimens before (left) and after (right) the repair process.
Applsci 12 07269 g007
Figure 8. Representative load/time and load/displacement plots of impacts at 9 J and 15 J of conventional and 3R specimens.
Applsci 12 07269 g008
Figure 9. Phased array and IR-thermography test plan on RTM6 impact specimens.
Applsci 12 07269 g009
Figure 10. Phased array and IR-thermography test plan on 3R impact specimens.
Applsci 12 07269 g010
Figure 11. Reference c-scan of a representative RTM6 (left) and 3R laminate (right).
Applsci 12 07269 g011
Figure 12. IR thermography of RTM6 (left) and 3R (right) laminates.
Applsci 12 07269 g012
Figure 13. A-scan, B-scans, and C-scan of RTM6 laminate after 9 J (left) and 15 J (right) low-velocity impact (A is the area, C is the circle length and D is the diameter of the circle).
Applsci 12 07269 g013
Figure 14. A-scan, B-scans, and C-scan of 3R laminate after 9 J (left) and 15 J (right) low-velocity impact (A is the area, C is the circle length and D is the diameter of the circle).
Applsci 12 07269 g014
Figure 15. IR thermography of damaged RTM6 laminates at 9 J (left) and 15 J (right).
Applsci 12 07269 g015
Figure 16. IR thermography of damaged initial 3R laminates at 9 J (left) and 15 J (right).
Applsci 12 07269 g016
Figure 17. Representative load/time and load/displacement plots of impacts at 9 and 15 J of initial and repaired specimens.
Applsci 12 07269 g017
Figure 18. Repaired 3R laminate: C-scan of a representative specimen.
Applsci 12 07269 g018
Figure 19. 3R laminate (a) initial, (b) repaired, and (c) a-scan, b-scan, and c-scan of defects.
Applsci 12 07269 g019
Figure 20. IR thermography pictures of the repaired 3R laminates after impact at 9 J (left) and 15 J (right).
Applsci 12 07269 g020
Figure 21. C-scan of repaired 3R laminate after 9 J (left) and 15 J (right) low-velocity impact (A is the area, C is the circle length and D is the diameter of the circle).
Applsci 12 07269 g021
Figure 22. Damage diameter comparison.
Applsci 12 07269 g022
Figure 23. IR Thermography of damage on repaired 3R laminates at 9 J (left) and 15 J (right).
Applsci 12 07269 g023
Figure 24. Representative stress–strain plots (left) and knockdown effect values (right) of lap strap specimens.
Applsci 12 07269 g024
Figure 25. Representative plots of amplitude (left) and AE hits (right) on RTM6 (top) and 3R (bottom) lap strap specimens.
Applsci 12 07269 g025
Figure 26. Representative lap strap test of RTM6 composite and ERCM monitoring (left) and zoom in the resistance before failure (right).
Applsci 12 07269 g026
Figure 27. Images from fractured surfaces of RTM6 lap strap specimen.
Applsci 12 07269 g027
Figure 28. Representative lap strap test of the 3R composite with ERCM monitoring.
Applsci 12 07269 g028
Figure 29. Representative stress–strain plots (left) and repair efficiency values (right) of lap strap specimens.
Applsci 12 07269 g029
Figure 30. Representative plots of amplitude (left) and AE hits (right) of repaired lap strap specimens.
Applsci 12 07269 g030
Figure 31. Schematic of lap strap repair.
Applsci 12 07269 g031
Figure 32. Representative lap strap test of the repaired 3R composite with ERCM monitoring.
Applsci 12 07269 g032
Table 1. Knockdown effect values of 9 and 15 J impacts.
9 J Impact
Type of CFRP SpecimenEnergy Absorbed (J)Knockdown Effect
Conventional Resin (RTM6)5.56 ± 0.12
3R Resin5.79 ± 0.05+4.1%
Type of CFRP SpecimenMax Load (N)Knockdown Effect
Conventional Resin (RTM6)6.42 ± 0.15
3R Resin6.30 ± 0.28−1.8%
15 J Impact
Type of CFRP SpecimenEnergy Absorbed (J)Knockdown Effect
Conventional Resin (RTM6)9.20 ± 0.09
3R Resin9.41 ± 0.17+2.2%
Type of CFRP SpecimenMax Load (N)Knockdown Effect
Conventional Resin (RTM6)8.42 ± 0.28
3R Resin8.11 ± 0.31−3.7%
Table 2. Delamination diameters of the impacted RTM6 laminates.
Debonding Diameter (mm)
Laminate9 J15 J
117.02
2 22.02
3 20.98
4 21.73
5 22.95
6 23.7
7 24.68
816.6
918.69
1014.19
1117.04
Average16.7122.68
SD1.621.37
Table 3. Delamination diameters of the impacted 3R laminates.
Debonding Diameter (mm)
Laminate9 J15 J
123.29
2 35.23
3 34.52
4 36.75
5 35.8
6 35.02
7 35.86
827.78
927.81
1028.75
1125.24
1225.69
Average26.4335.53
SD2.050.78
Table 4. Repair efficiency values of 9 and 15 J impacts.
9 J Impact
Type of CFRP SpecimenEnergy Absorbed (J)Repair Efficiency
3R Initial5.79 ± 0.05
3R Repaired5.76 ± 0.0699.3%
Type of CFRP SpecimenMax Load (N)Repair Efficiency
3R Initial6.30 ± 0.28
3R Repaired5.76 ± 0.1191.4%
15 J Impact
Type of CFRP SpecimenEnergy Absorbed (J)Repair Efficiency
3R Initial9.41 ± 0.17
3R Repaired9.95 ± 0.45105.8%
Type of CFRP SpecimenMax Load (N)Repair efficiency
3R Initial8.11 ± 0.31
3R Repaired7.08 ± 0.7687.3%
Table 5. Debonding diameters of the impacted 3R laminates.
Debonding Diameter (mm)
Before RepairAfter Repair
Laminate9 J15 J9 J15 J
123.29 34.27
2 35.23 46.31
3 34.52 51.32
4 36.75
5 35.8 Used for CAI
6 35.02
7 35.86
827.78 37.4
927.81 36.63
1028.75 Used for CAI
1125.24
1225.69
Average26.4335.5336.148.82
SD2.050.781.633.54
Table 6. Knockdown effect of compression after impact properties between conventional (RTM6) and 3R specimens.
9 J Impact
Type of CFRP SpecimenStrength (MPa)Knockdown Effect
Conventional Resin (RTM6)> 216.00
3R Resin212.43 ± 12.18≈−1.9%
Type of CFRP SpecimenMax Load (kN)Knockdown Effect
Conventional Resin (RTM6)> 105.00
3R Resin100.59 ± 4.75≈−3.0%
15 J Impact
Type of CFRP SpecimenStrength (MPa)Knockdown Effect
Conventional Resin (RTM6)207.80 ± 11.74
3R Resin205.54 ± 9.27−1.1%
Type of CFRP SpecimenMax Load (kN)Knockdown Effect
Conventional Resin (RTM6)98.93 ± 4.91
3R Resin94.69 ± 7.06−4.3%
Table 7. Repair efficiency values of compression after impact properties.
9 J Impact
Type of CFRP SpecimenStrength (MPa)Repair Efficiency
3R Initial212.43 ± 12.18
3R Repaired170.11 ± 12.3280.1%
Type of CFRP SpecimenMax Load (kN)Repair Efficiency
3R Initial100.58 ± 4.57
3R Repaired76.29 ± 4.9475.8%
15 J Impact
Type of CFRP SpecimenStrength (MPa)Repair Efficiency
3R Initial205.54 ± 9.25
3R Repaired153.76 ± 9.2774.8%
Type of CFRP SpecimenMax Load (kN)Repair Efficiency
3R Initial94.69 ± 7.06
3R Repaired58.28 ± 4.6061.5%
Publisher’s Note: MDPI stays neutral with regard to jurisdictional claims in published maps and institutional affiliations.

