Article

Characterization, Luminescence and Optical Resonant Modes of Eu-Li Co-Doped ZnO Nano- and Microstructures

Departamento de Física de Materiales, Facultad de Ciencias Físicas, Universidad Complutense de Madrid, Ciudad Universitaria s/n, 28040 Madrid, Spain
*
Author to whom correspondence should be addressed.
Appl. Sci. 2022, 12(14), 6948; https://doi.org/10.3390/app12146948
Submission received: 10 May 2022 / Revised: 15 June 2022 / Accepted: 7 July 2022 / Published: 8 July 2022
(This article belongs to the Special Issue Advanced Characterization of Functional Materials)

Abstract

:
ZnO nano- and microstructures co-doped with Eu and Li with different nominal concentrations of Li were grown using a solid vapor method. Different morphologies were obtained depending on the initial Li content in the precursors, varying from hexagonal rods which grow on the pellet when no Li is added to ribbons to sword-like structures growing onto the alumina boat as the Li amount increases. The changes in the energy of the crystallographic planes leading to variations in the growth directions were responsible for these morphological differences, as Electron Backscattered Diffraction analysis shows. The crystalline quality of the structures was investigated by X-ray diffraction and Raman spectroscopy, showing that all the structures grow in the ZnO wurtzite phase. The luminescence properties were also studied by means of both Cathodoluminescence (CL) and Photoluminescence (PL). Although the typical ZnO luminescence bands centered at 3.2 and 2.4 eV could be observed in all cases, variations in their relative intensity and small shifts in the peak position were found in the different samples. Furthermore, emissions related to intrashell transitions of Eu3+ ion were clearly visible. The good characteristics of the luminescent emissions and the high refraction index open the door to the fabrication of optical resonant cavities that allow the integration in optoelectronic devices. To study the optical cavity behavior of the grown structures, µ-PL investigations were performed. We demonstrated that the structures not only act as waveguides but also that Fabry–Perot optical resonant modes are established inside. Quality factors around 1000 in the UV region were obtained, which indicates the possibility of using these structures in photonics applications.

1. Introduction

Although ZnO has been extensively studied for many years, recently, it has become more relevant in the frame of different applications of high technological interest.
As it is well known, ZnO is a wide bandgap II-VI semiconductor (3.37 eV) with a native concentration of donor defects that makes it conductive; hence it is one of the most studied Transparent Conductive Oxides (TCO). In addition to the wide bandgap, the large exciton binding energy (60 meV), the chemical stability and some properties associated with the wurtzite structure (lack of a symmetrical center) make this material a perfect candidate for a variety of applications in the field of optoelectronics, sensing, photocatalysis or piezoelectricity [1,2,3,4]. In the nano- and microscale, an enhancement of the electroconductivity or a high specific area must be added, widening the scope for new applications [5,6,7,8]. On the other hand, when we move to the micro- and nanoscale, the morphology of the structures plays a key role, and many of the properties of the material, for instance, luminescent properties, are strongly dependent on morphology [8,9,10]. Behind the morphology-dependent properties are the crystal structure and the surface and surface defect structure derived from it. The most stable crystal structure for ZnO is hexagonal wurtzite that may be described as alternating Zn2+ and O2− planes stacked along the z-axis in tetrahedral coordination. The highest surface energy corresponds to the (0001) basal planes; then, the most common growth morphology is that of rods along the c-axis, which minimizes the surface of the basal planes. However, different morphologies can be obtained by several synthesis procedures, giving rise to different surface configurations and hence different properties. As an example, in Figure 1, a scheme of the faces that may appear in the most common morphologies is drawn [4,11,12,13,14].
The role of dopants in improving the properties of semiconductor materials is well known; in fact, it is the primary route to modify and control them, either by the direct supply of carriers or by the modification of the defect structure necessary to accommodate the impurities. For instance, in our focus material, ZnO, the conductivity increases up to 10 orders of magnitude due to the presence of impurities and native defects. An important drawback, however, is the difficulty of obtaining p-type ZnO due to self-compensation mechanisms [15,16,17,18,19].
Among the different dopants used, rare-earth (RE) elements occupy a prominent position, and the number of studies of RE-doped ZnO-based systems with good luminescent properties has increased considerably [8,20,21,22,23]. Although one major interest is in the telecom field, in particular for Er doping, the technological interest in RE doping goes further beyond this field [21]. Rare-earth or lanthanides elements are those found between La and Yb in the periodic table. They are characterized by an electronic structure of the form [Xe]4fn6s2, with a partially filled 4f shell shielded by the 5s25p6 electrons. In lanthanide ions, three basic types of optical transitions may occur: 4f-4f; 5d-4f and charge transfer between the host and the dopant. The 4f-5d transitions are allowed and have short lifetimes, in the order of nanoseconds; 5d orbitals are strongly affected by the crystal field and polarizability of the host material, which allows easy tuning in the visible region by changing some characteristics of the host [22]. The f orbitals are shielded by the 5s and 5p and they are very insensitive to the environment, i.e., the crystal field, providing very sharp transitions from UV to infrared. Contrary to the 4f-5d, the 4f-4f transitions are parity forbidden, hence with much longer lifetimes, in the order of microseconds; however, in proper hosts, the influence of the ligand field or non-centrosymmetric interactions may lead to a relaxation of the parity rule, giving rise to sharp emission lines [24,25]. Since the main field of application of lanthanide-doped oxides is luminescence, a major goal is the enhancement of the intensity of the luminescence emission. There are two basic approaches to improving the luminescent properties of RE-doped materials. The first consist of the use of a suitable sensitizer, a very effective radiation absorber that can transfer energy to the lanthanide ion. The second way is to modify the host lattice so that the transitions at lanthanide ions are favored; commonly, Li+ is used for this purpose [20,24,26]. Nevertheless, due to the mismatch between ionic radii (Zn+2~0.74 Å; and Eu+3~0.94 Å) and charge unbalance (the most frequently used are the RE trivalent ions), effective doping of ZnO with rare elements is still challenging. In this regard, co-doping with alkali metals, particularly Li, is a very good option [24,27,28,29,30].
In the current work, ZnO nano- and microstructures co-doped with Eu and Li were obtained by a solid vapor method. To gain better information on the role of the Li ions as co-dopants, the amount of Eu was kept constant, and Li precursor content was varied. This allowed us to observe the evolution of the morphology and relate it to the lattice deformation due to the incorporation of dopants and the consequent defect structure. The amount and morphologies of structures obtained depend strongly on the initial lithium content. XRD and Raman experiments were performed to assess the crystal structure, and luminescence investigations were conducted to obtain information about the optical properties and local defect structure. Microphotoluminescence measurements (µ-PL) showed that the structures obtained support resonant modes and hence can be used as lightguides and resonant cavities with good quality factors. The study of this kind of structure has received much attention in recent years, and comprehensive reviews can be found in works by Yang et al. [31] and Johnson et al. [32]. A good analysis of the influence of geometry on the establishment of the different resonant modes can also be found in work by Dong et al. [33].

2. Experimental Method

The samples were prepared from a mixture of ZnS, Eu2O3 and Li2O powders as precursors, with purities of 99.99, 99.99 and 99.5%, respectively. In all cases, the Eu2O3 was maintained at 5 wt%, while the Li2O content was varied from 0 to 10 wt%. The notation of the samples is provided in Table 1.
The powders were mixed and homogenized by ball milling (20 mm agate balls) for 5 h. The centrifugal ball mill was operated at 300 rpm. After the milling process, the powders were compacted under a compressive load of 2 T in the form of disk-shaped pellets with a diameter of about 7 mm and a thickness of 2 mm. The samples were placed on an alumina boat and inserted into the central (hottest) part of the quartz tube of a horizontal furnace (CHESA). The pellets were then submitted to a thermal treatment at 950 °C for 10 h, under an N2 flux of 1.5 L/min. The experimental setup for vapor-solid growth has been described elsewhere [9].
The characterization of the samples was carried out using a variety of techniques. Morphology was studied by Scanning Electron Microscopy (Secondary Electron mode, SEM-SE), and images were recorded either in a Leica 440 SEM (Wetzlar, Germany) or FEI Inspect SEM (Hillsboro, OR, USA). Cathodoluminescence (CL) spectra were recorded using an Hitachi S2500 SEM at room temperature with beam energy between 15 and 20 keV using a HAMAMATSU PMA-11 (Hamamatsu, Japan) charge-coupled device camera. Composition was assessed by X-ray microanalysis (EDS) performed with a Bruker AXS Quantax system (Billerica, MA, USA) attached to a Leica 440 SEM. Electron Backscattered Diffraction (EBSD) analysis was carried out using an FEI Inspect SEM equipped with a Bruker Quantax e-Flash 1000 EBSD system. Optical spectroscopy measurements (micro-photoluminescence (µ-PL) and Raman) were performed at room temperature using an Horiba Jobin Yvon LabRAM HR800 (Kyoto, Japan) confocal microscope with a He-Cd (λex = 325 nm) or He-Ne (λex = 632.8 nm) laser as an excitation source, respectively. For µ-PL, a custom-designed module allowed us to separate excitation and collection points [34]. Finally, XRD measurements were performed using a Philips diffractometer using Cu Kα radiation.

3. Results and Discussion

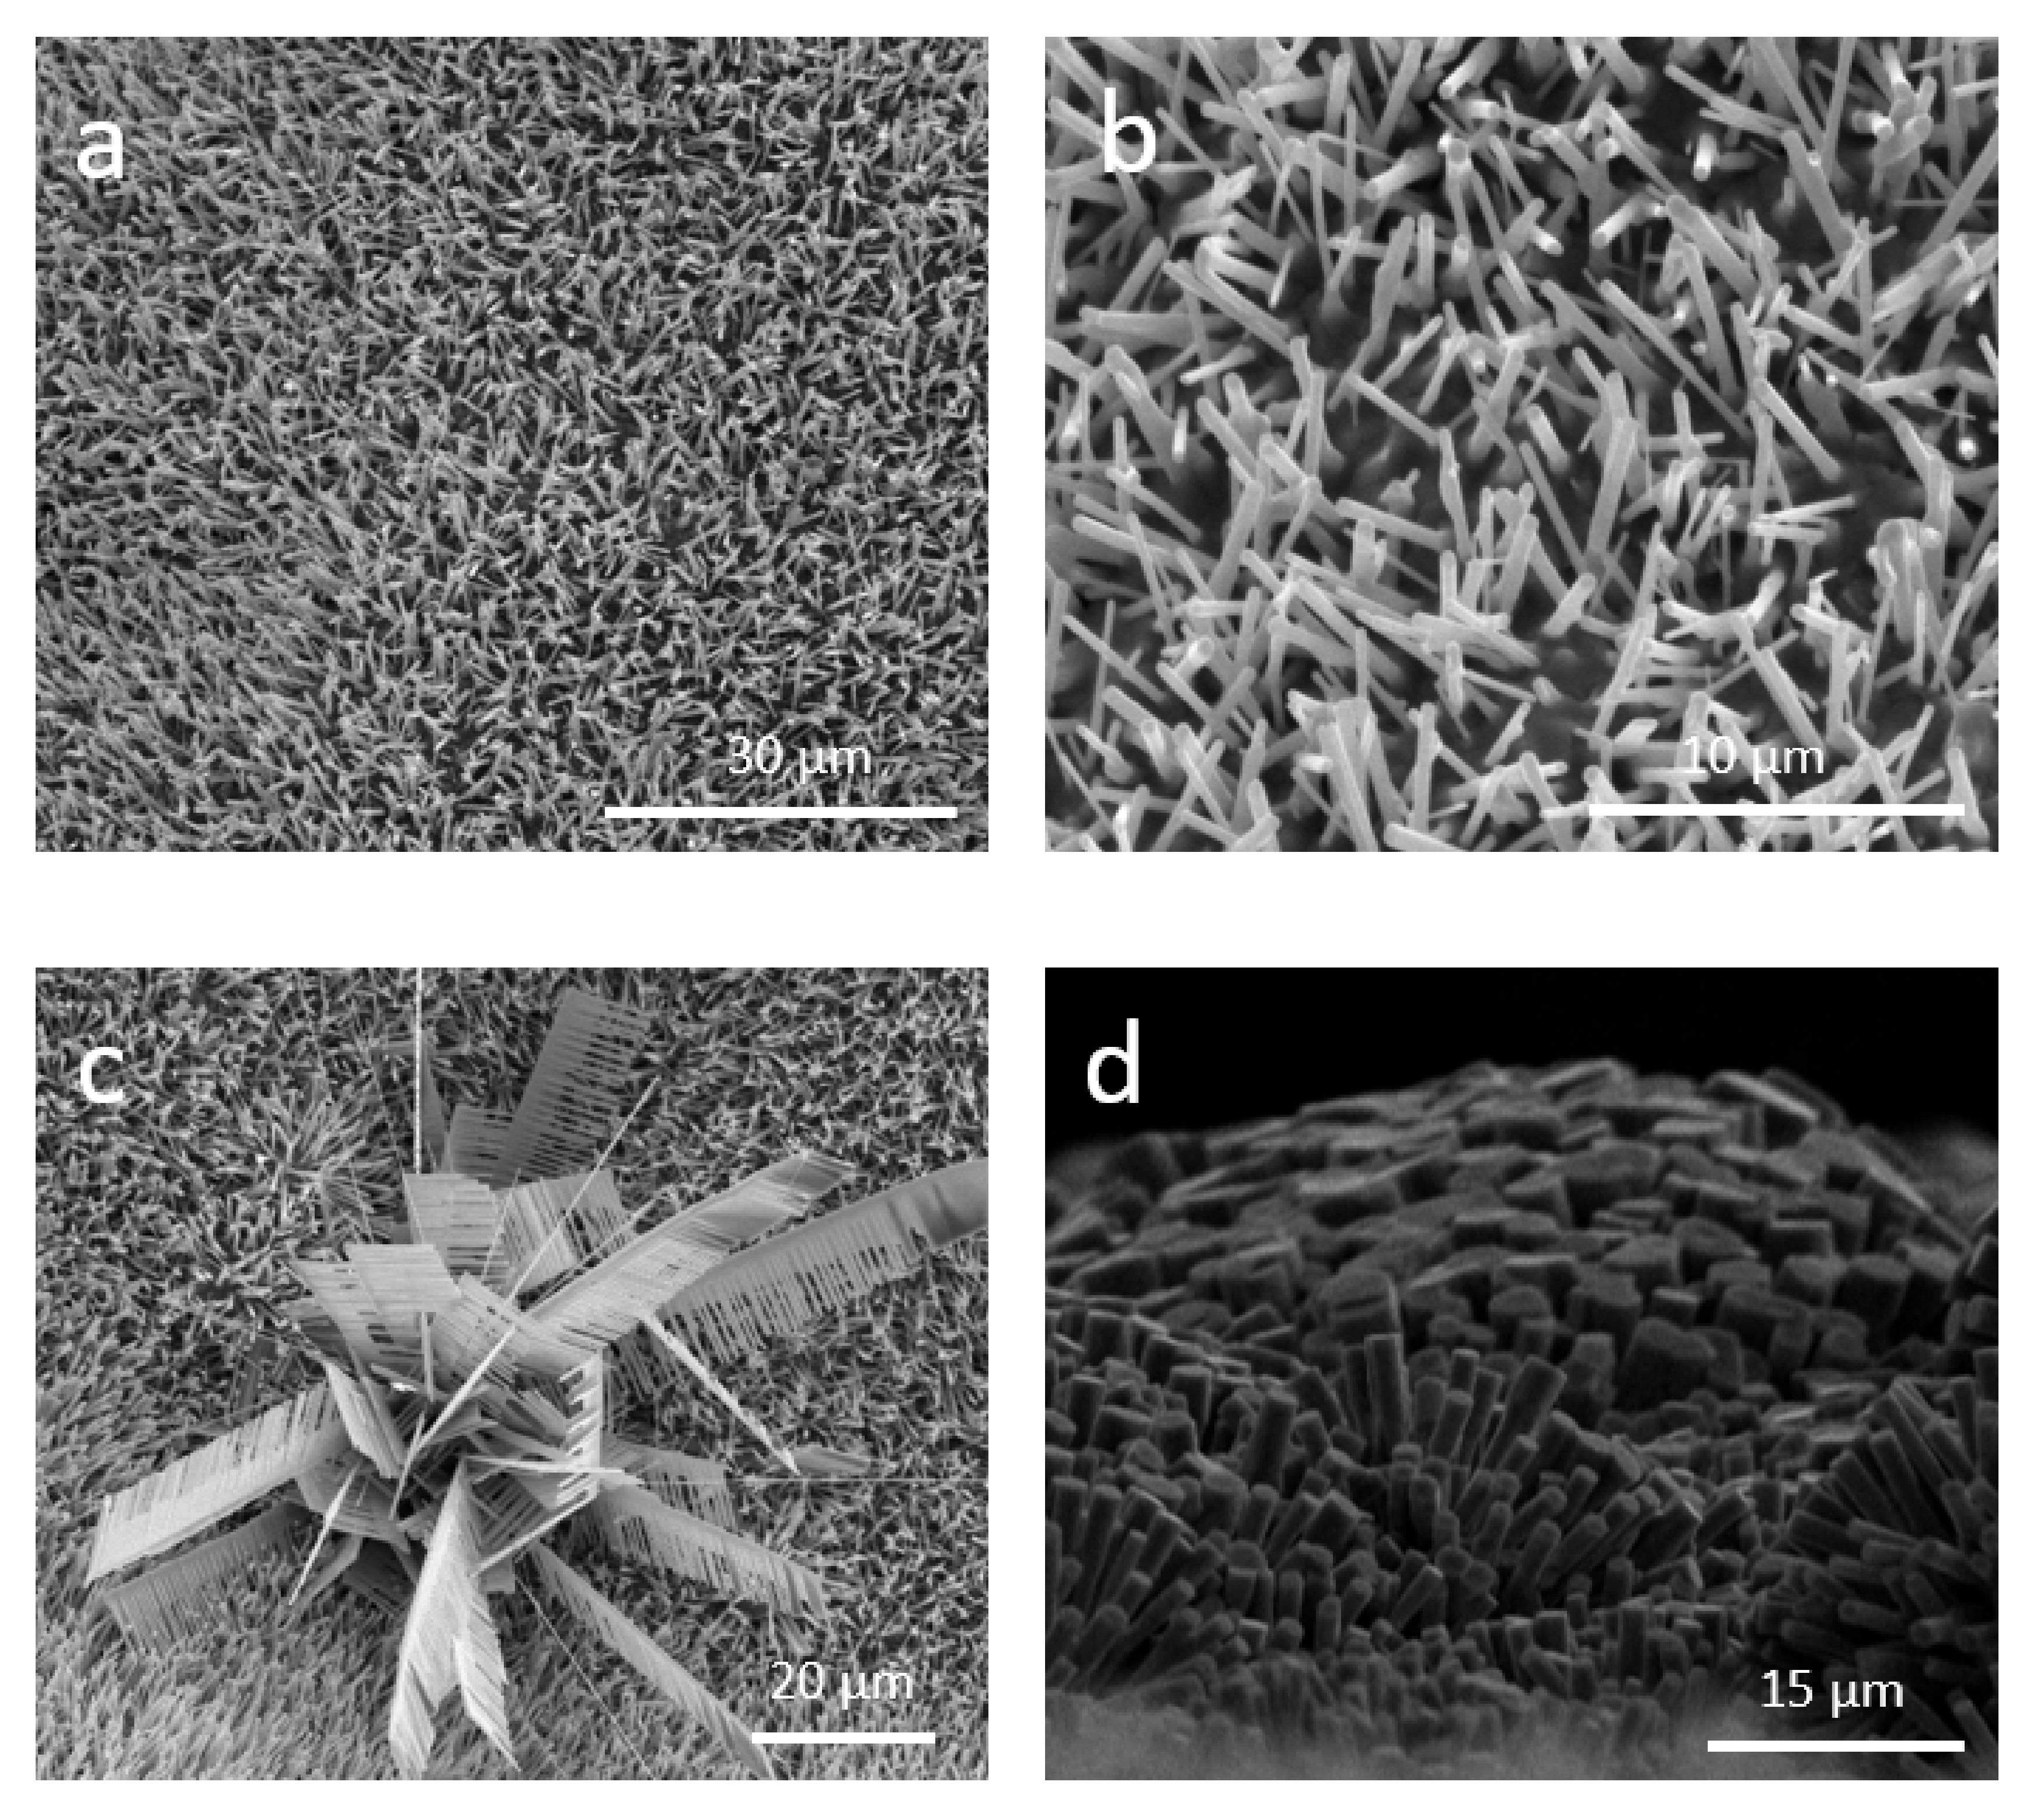
Let us first describe the morphology of the structures grown from the sample without lithium used as reference. A very dense shell of structures grew onto the pellet that simultaneously acted as a source and substrate (Figure 2a). As shown in Figure 2b, the grown structures were mainly in the form of wires or rods with a hexagonal cross-section with diameters of a few hundred nanometers and lengths of several microns. In some cases, bundles of comb-like structures (Figure 2c) also appeared. Due to the flux distribution at the edges of the pellet, the structures were more regularly arranged, demonstrating columnar growth, with columns larger than the rods observed in the central part of the sample (Figure 2d).
Beyond the differences in morphology, the influence of lithium doping was clear even for the lowest Li content. When Li was present, the growth occurred mainly on the alumina boat, and only for the lowest Li content did a few structures grow onto the pellet. On the other hand, the density of grown structures was much lower in samples Eu5_Li1 and Eu5_Li10, and only for the intermediate Li content (Eu5_Li5) was a density of structures comparable to that of the samples without Li (Eu5) observed.
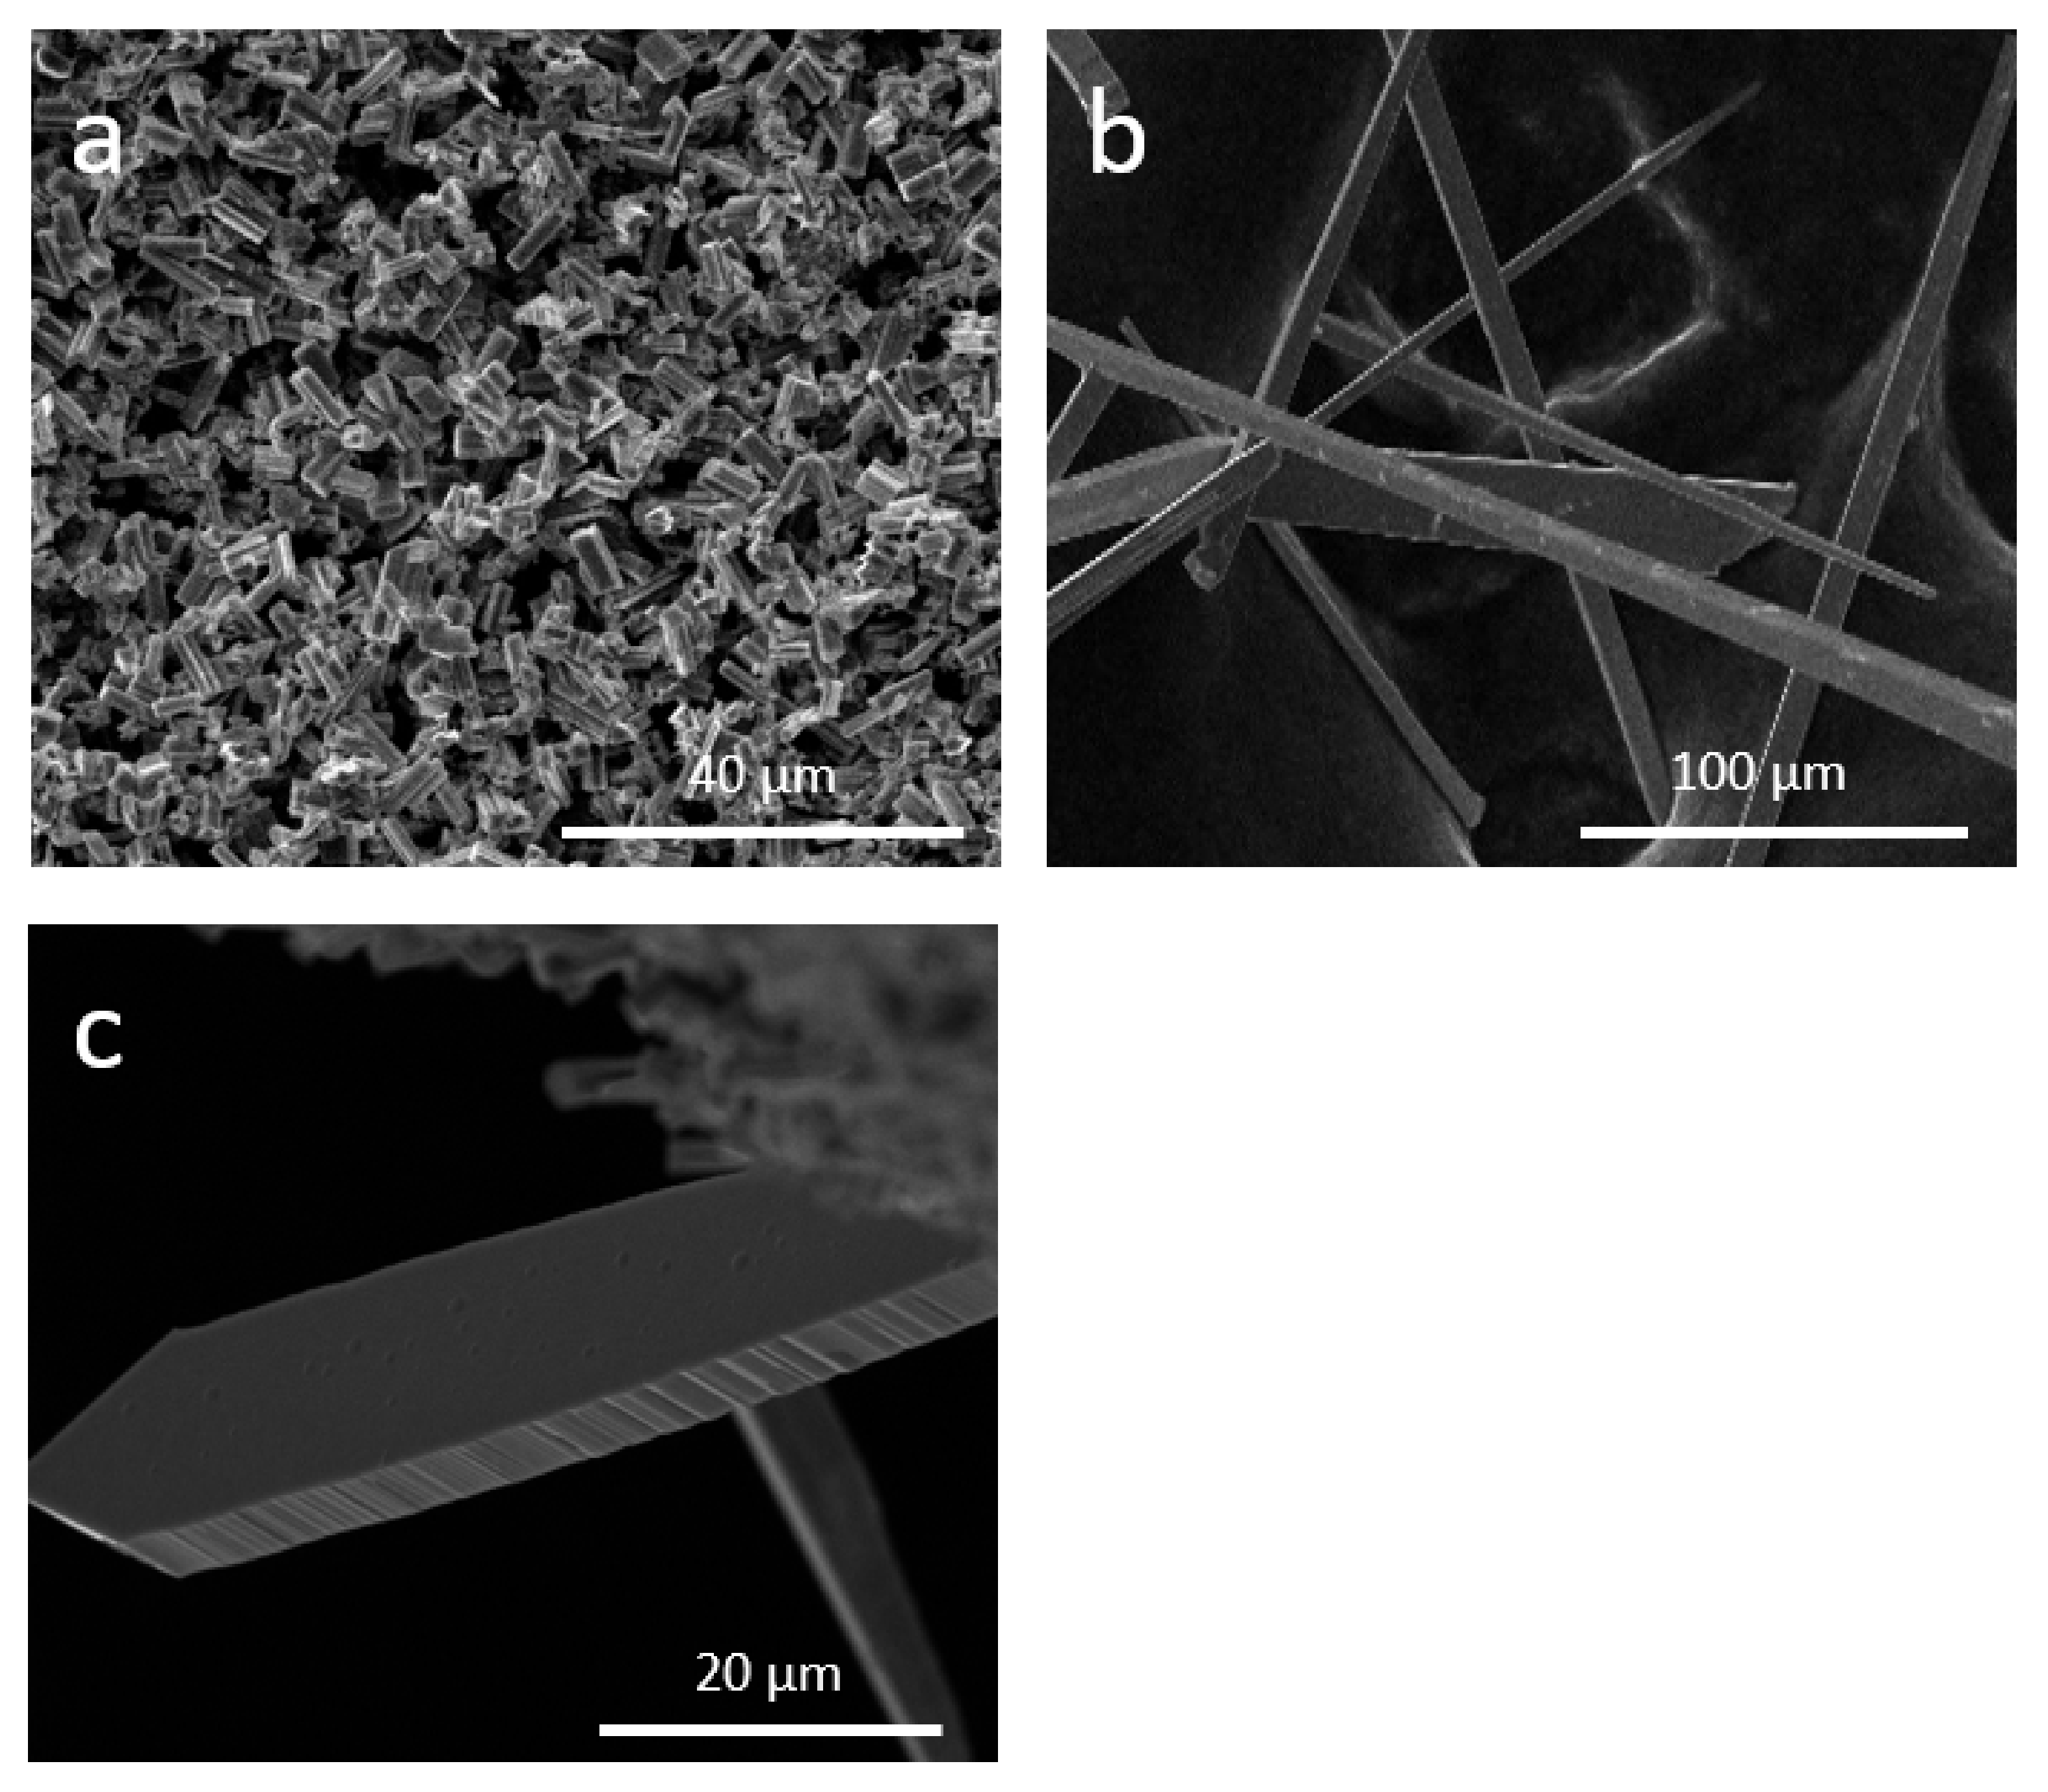
As mentioned, in the Eu5-Li1 sample, a few structures in the form of hexagonal rods grew onto the pellet. They were smaller than those observed in the sample Eu5, with diameters between 2 and 6 μm and 10–20 μm in length, and did not show any preferred orientation (Figure 3a). The structures grown onto the alumina boat or at the rims of the pellets were mainly ribbons or sword-like, around 15 μm wide, several hundred microns long and a few microns thick (Figure 3b,c).
The Eu5_Li5 sample showed the highest density of structures among all the co-doped samples. The structures, mainly in the form of ribbons, grew onto the alumina boat. As shown in Figure 4, they have very large aspect ratios, with lateral dimensions in the range of several tens of microns and several millimetres long. With a closer look, let us propose a growth model in which the comb-like structures constitute the first step. The formation of comb-like structures is related to different activities shown by the polar faces of ZnO. The preferential growth would take place on the Zn terminated face, and then initially, the prongs would develop from it (Figure 4b). Finally, the space between prongs would progressively fill, forming the ribbons (Figure 4c).
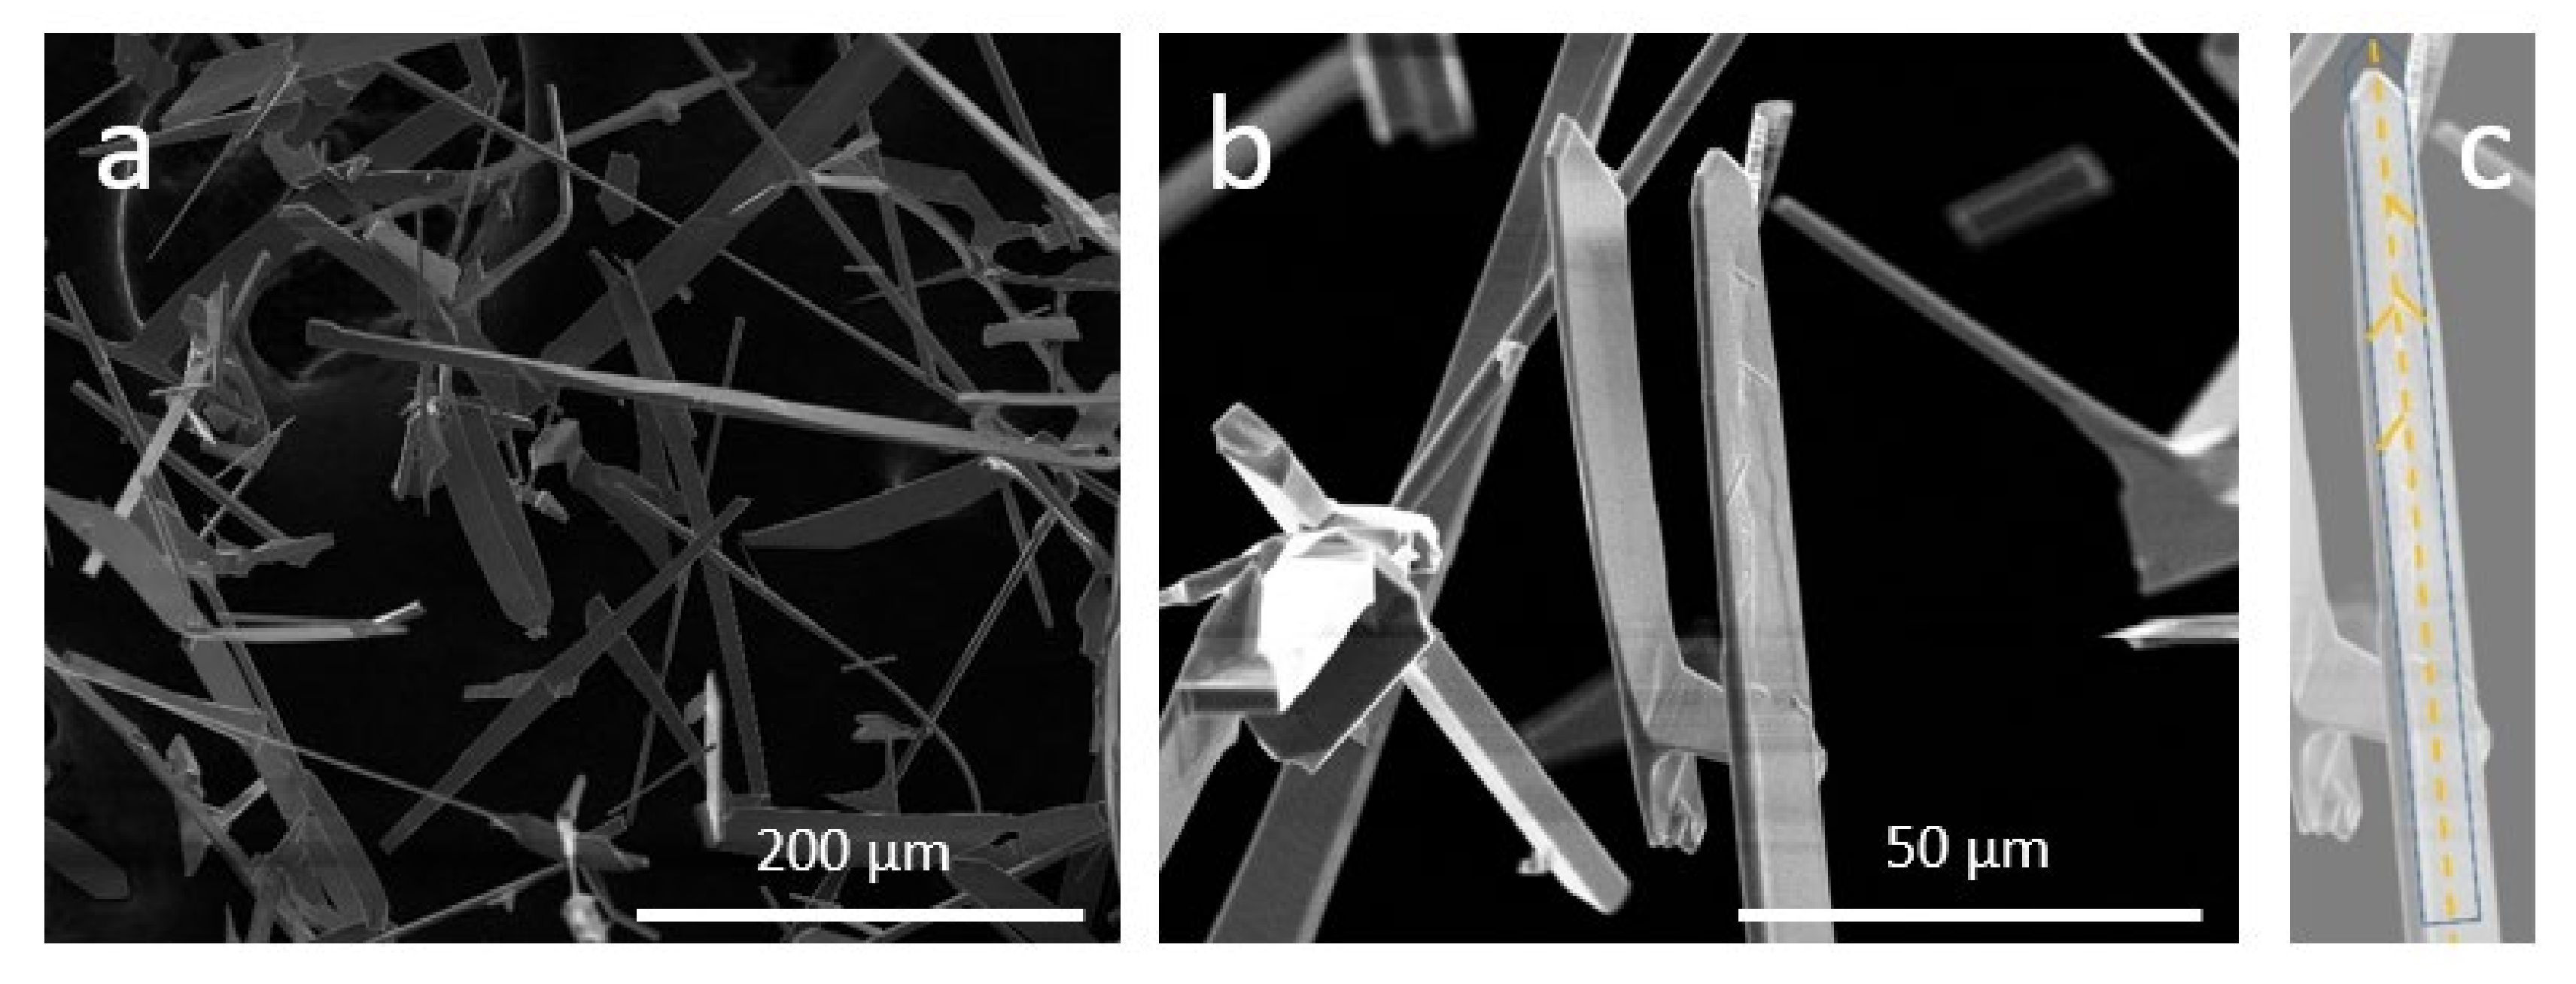
Finally, in the Eu5_Li10 samples, the growth was much scarcer and occurred on the alumina boat. The structures were less regular, ribbons, swords and wires, sometimes interlinked, and with dimensions of a few tens of microns (width) and hundreds of microns in length, as shown in Figure 5a. In some cases, small plates, very well oriented with respect to the crystallographic directions, are observed in Figure 5b. As drawn in part c of this figure, this suggests a growth modelsuch as that described in Figure 1 (middle).
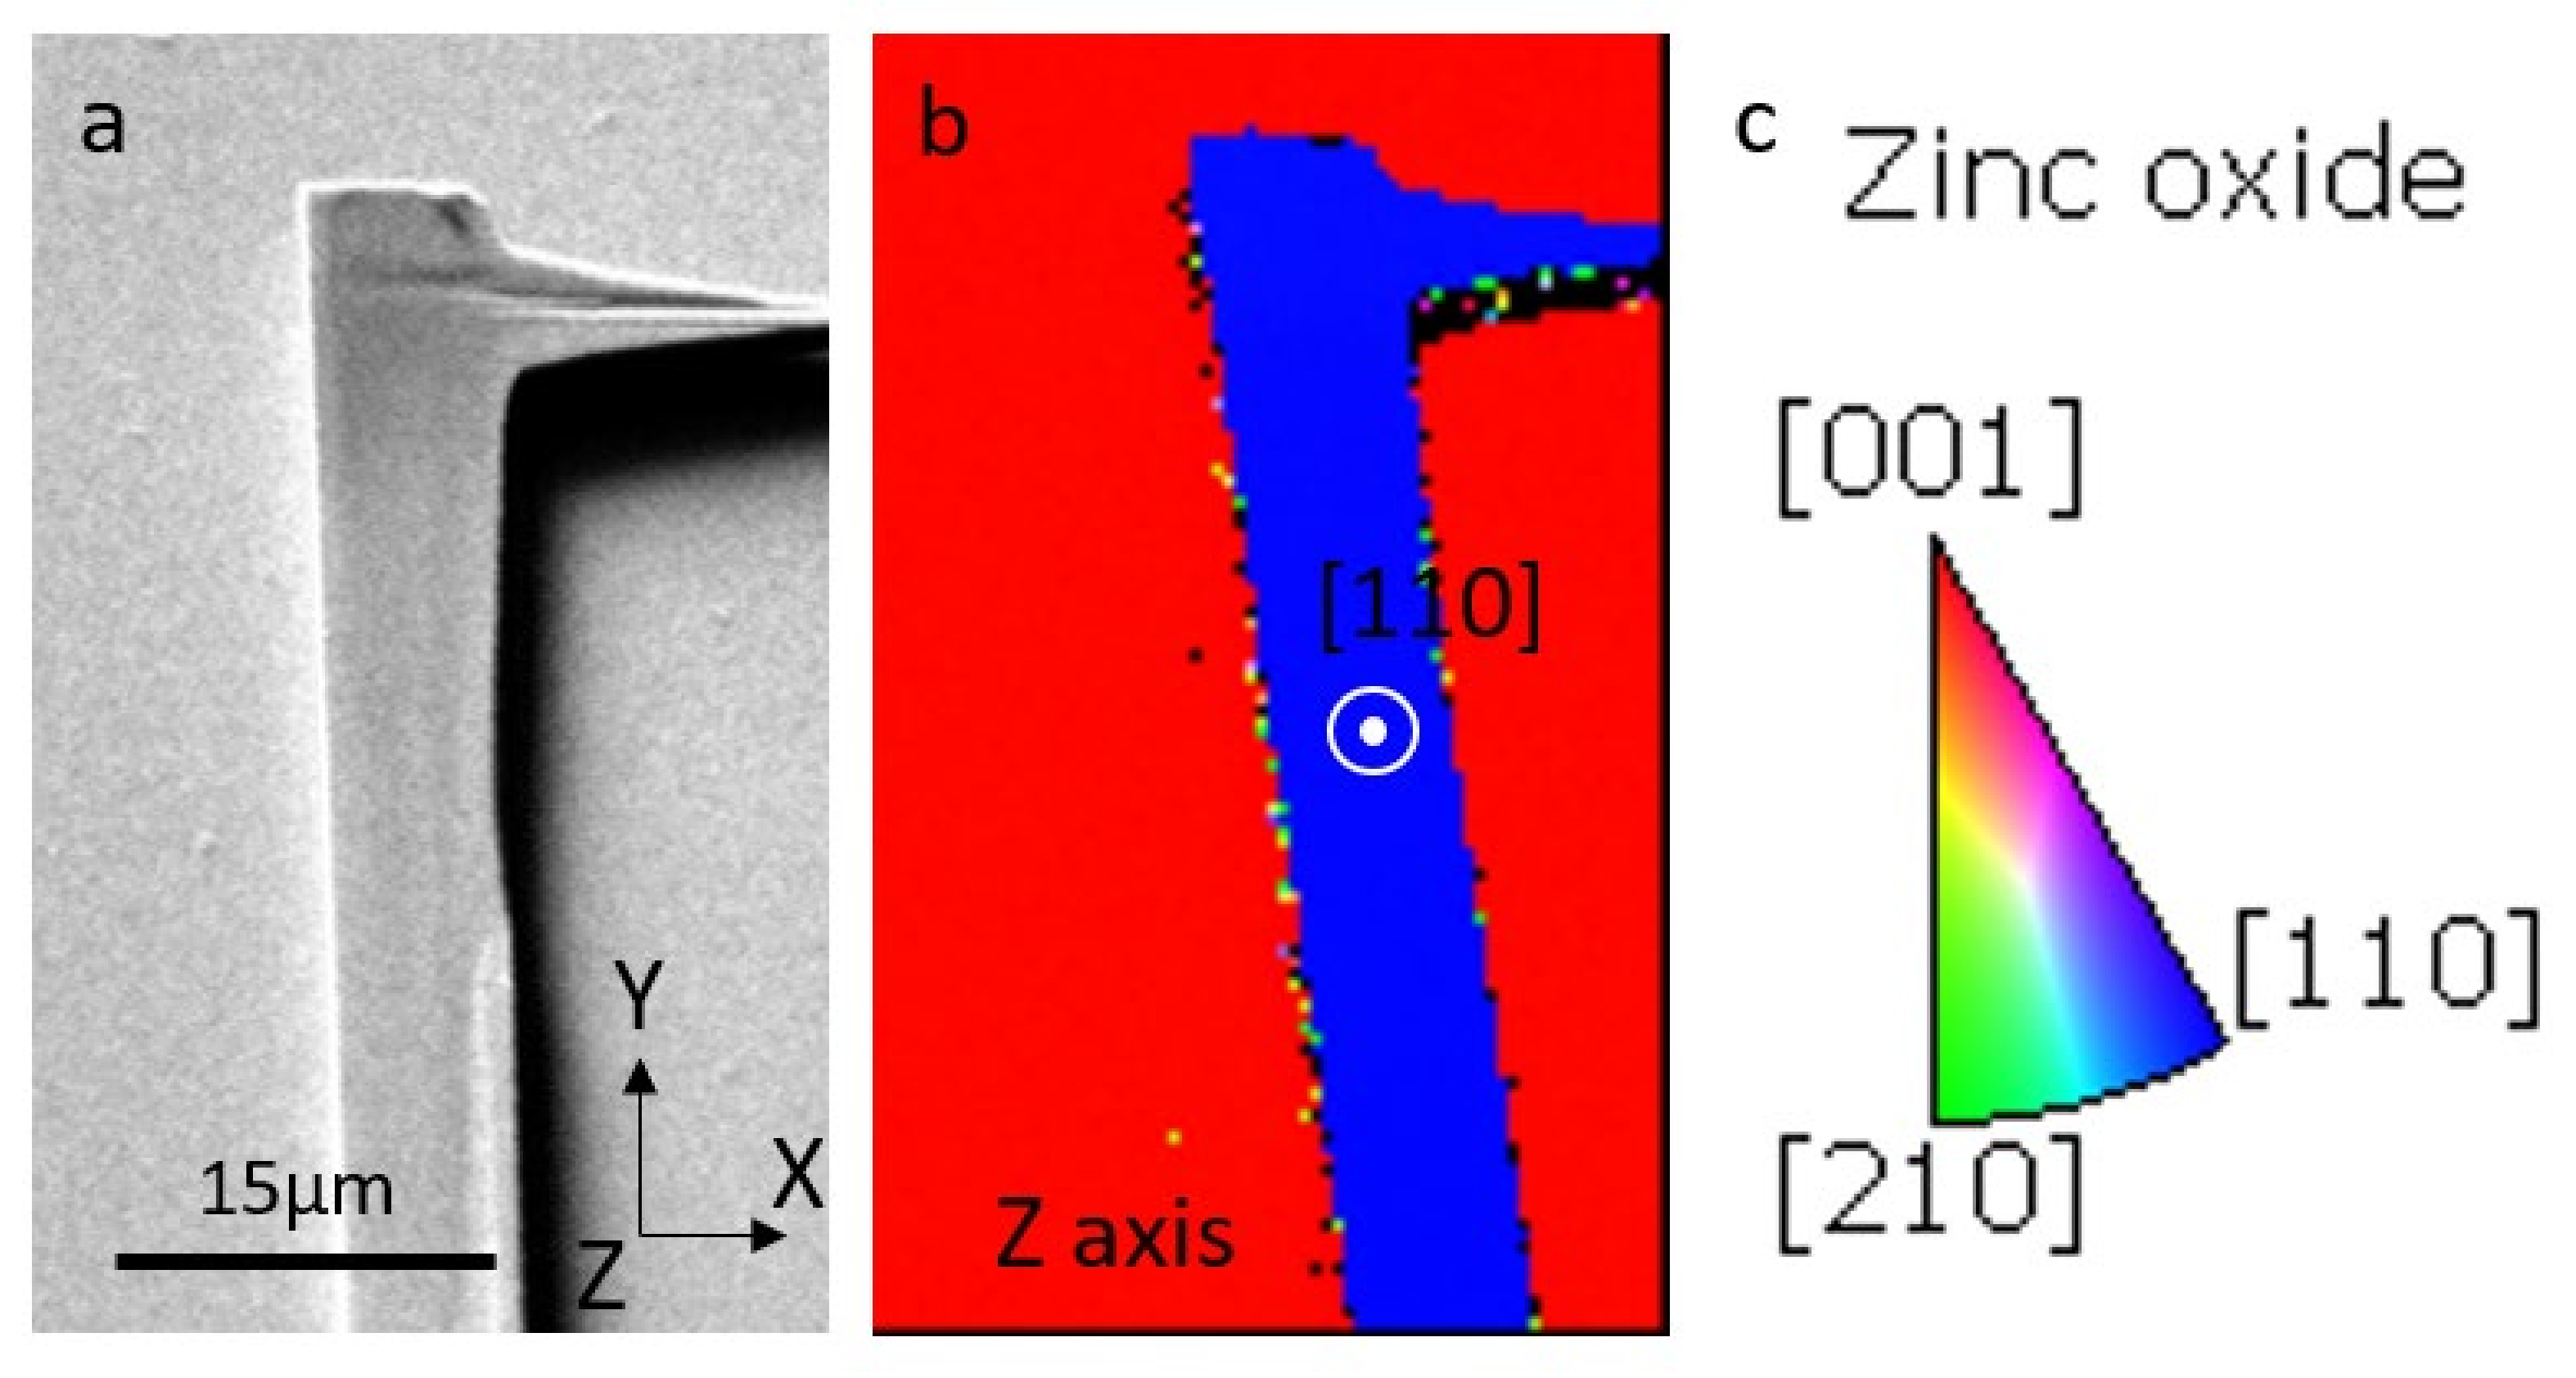
To further investigate the crystalline orientations of the structures, Electron Backscattered Diffraction (EBSD) was performed in one of the combs, which showed secondary growth in one of its lateral faces (Figure 6). Part a of the figure shows the SEM image of the selected structure, which was isolated and deposited on a silicon wafer; the orientation of the detector is indicated by the X, Y and Z axes drawn in the lower right corner. Figure 6b show the orientation map on the Z-axis. As can be seen, both the comb and the secondary prone are in the same orientation. From the color legend shown in Figure 6c, this orientation corresponds to [110] directions indicating that the growth is producing a face orientation as schemed in Figure 1c; the growth axis changes between the comb and the prone due to the different reactivity of the lateral faces exposed.
Compositional analysis of the structures was performed by EDX in the SEM. Although the percentage of dopants incorporated into the structures cannot be determined because Li is not detectable by the technique, EDX spectra recorded on the structures show the presence of Eu peaks. Furthermore, the compositional maps (Figure 7) also show that the Eu is homogeneously distributed throughout the structures.
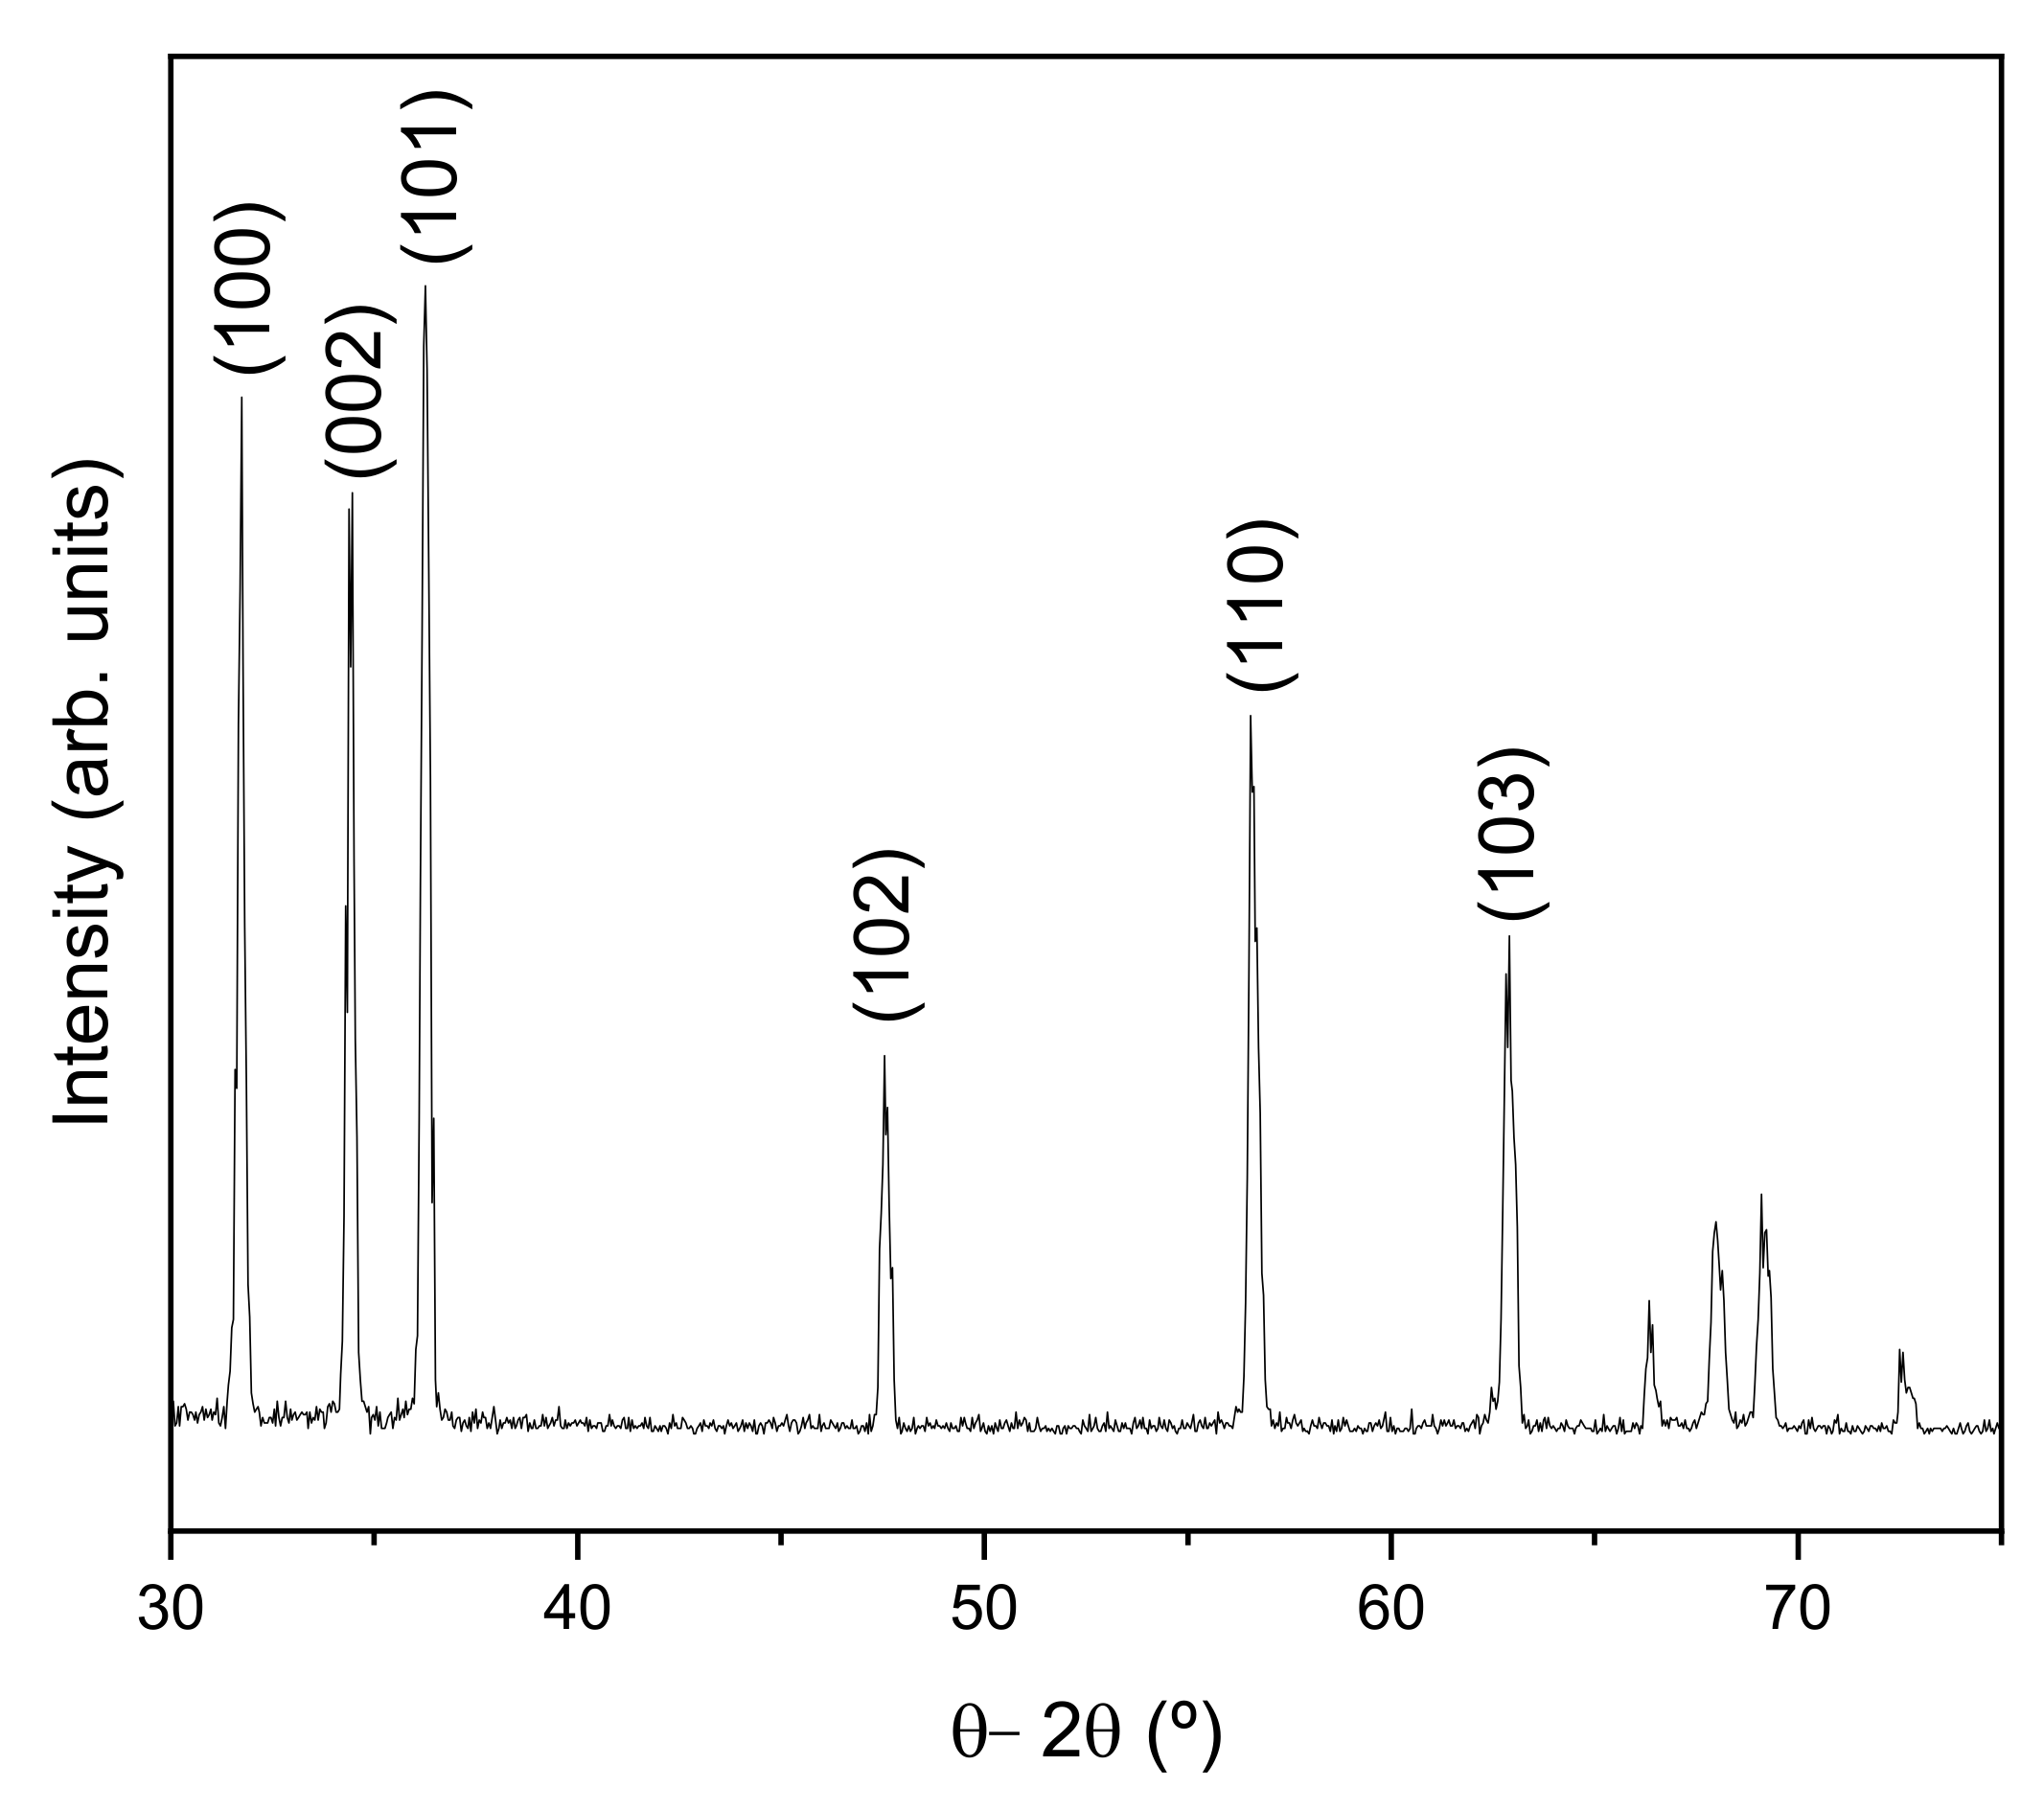
XRD measurements were performed on the structures grown in all samples. Figure 8 show the pattern obtained from the structures grown on the sample with 5 wt%. Li; as can be seen, all the diffraction peaks can be identified as the wurtzite phase of ZnO (JCPDS 00-036-1451), indicating the good crystallinity of the grown structures. No significant shifts in the positions of the reflections were observed when the Li content changed.
Raman spectroscopy measurements show the most characteristic peaks of ZnO. In Figure 9, the Raman spectra from isolated rod-like structures, normalized to the 438 cm−1 peak, are shown. The observed peaks correspond to the E2low and E2high of the wurtzite structure (98 and 438 cm−1, respectively), although they are shifted with respect to the position in undoped ZnO [35]. To show this shift more clearly, a zoom of the 438 cm1 is shown in Figure 9b. Upon Eu doping, the peaks shift towards lower frequencies, which corresponds to the incorporation of a heavier atom. When Li is introduced, the peak moves back towards higher frequencies, although the original position of ZnO is not reached. In the spectra, a peak at 320 cm−1 corresponding to A1 mode ( E 2 high E 2 low ) is also visible [35]. To study isolated structures, they are scratched from the pellet and deposited onto a Si substrate; the peak at 300 cm−1 corresponds to the silicon substrate [36].
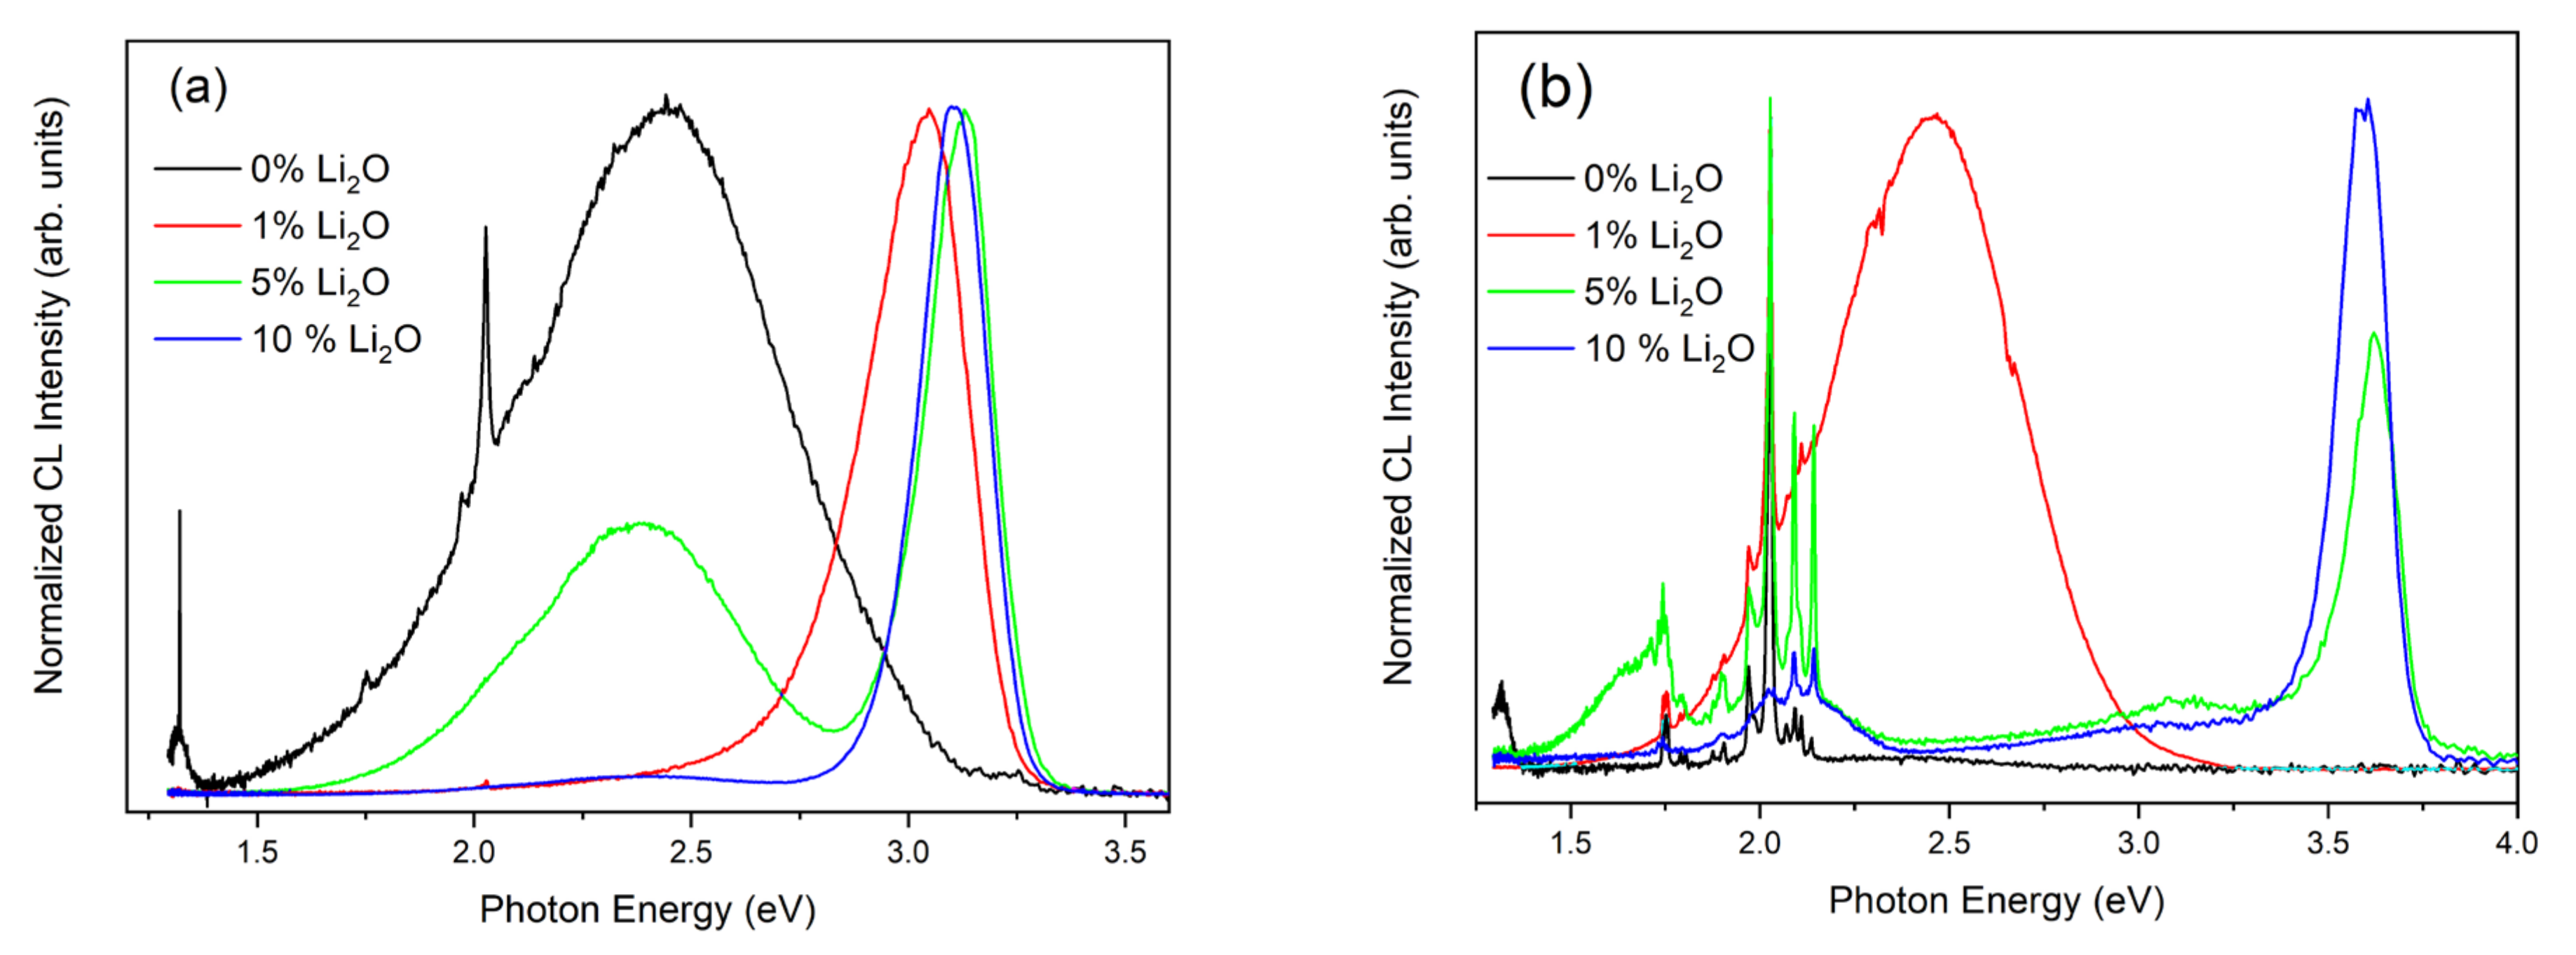
Cathodoluminescence (CL) spectra were recorded from isolated structures as well as from the pellet. To isolate the structures, we scratched them from the surface and deposited them onto a piece of graphite tape. The spectra from the pellet were recorded in areas in which no growth occurred. The results are shown in Figure 10. Part a of the figure show the normalized spectra recorded on structures. The spectrum is, in general, typical of ZnO with two clear bands, the first around 3.1 eV, which corresponds to the band edge, and the second wide and with the maximum around 2.4 eV, which corresponds to the band of deep centers. The origin of these emissions is still under revision due to the complex character of the band. The main native defects in ZnO are oxygen and zinc vacancies (VO and VZn) and their different charge states; oxygen and zinc interstitials (Oi, Zni) and zinc antisites (OZn) [21,23,37,38,39,40,41]. However, there are significant differences between the spectra taken in each sample. The first remark is that the emission of the band edge can hardly be seen in the structures of the sample without Li (Eu5) (black line); in this spectrum, the highest intensity corresponds to the deep level band [20]. Some narrow emissions that correspond to intraionic transitions of the Eu3+ centered on 2.02, 1.96 and 1.75 eV (612, 628 and 707 nm, respectively), can be clearly observed, overlapping with the deep level band [23,26,42,43]. The first two lines correspond to the multiplet 5D07F2, and the third one corresponds to the transition 5D07F3. On the other hand, by adding Li to the samples, the relative intensity of the bands changes completely, becoming the most intense emission of the band edge. The lines of the Eu are no longer clearly seen (the 612 nm is seen in the sample with less Li) although a shoulder is observed around the same energy values that could correspond to the emission of the ion that it is not completely resolved. On the other hand, the position of the band edge emission shifts slightly between the samples, has the maximum at 3.04 eV for the sample with less Li (red line), at 3.13 eV for the sample with intermediate content (green line) and at 3.11 eV for the sample with the highest amount of Li (blue line). As with other dopants, there are several emissions involved in the band whose relative weight causes the maximum to shift slightly [9]. In fact, in the sample with the lowest Li content (red line), the asymmetry of the band that has a wide tail in the low energy zone is clearly observed. Regarding the spectra made on the surface of the pellet once the structures have been removed (Figure 10b), it should be noted that in all of them, several sets of narrow emission lines that correspond to the multiplets of the Eu3+ that were seen in the spectra made on the structures, although in this case more lines are seen and better resolved. There are more differences between the spectra. In the sample without Li (black line), there are no additional emissions to those mentioned in the Eu. However, after adding Li, more emissions are observed. In the sample with the lowest Li content (red line), Eu emissions overlap with a broadband whose maximum is 2.45 eV and which could correspond to the green band of the ZnO. On the contrary, in the two samples with more Li (green and blue lines), this band is not observed. In its place appears an intense emission around 3.6 [44], which could be due to the band-band emission of the ZnS that is used as a precursor and that remains in the pellet, and also another little intense band around 3.1 eV that could be due to the presence of a little ZnO existing in the pellet that has been formed during the thermal treatment.
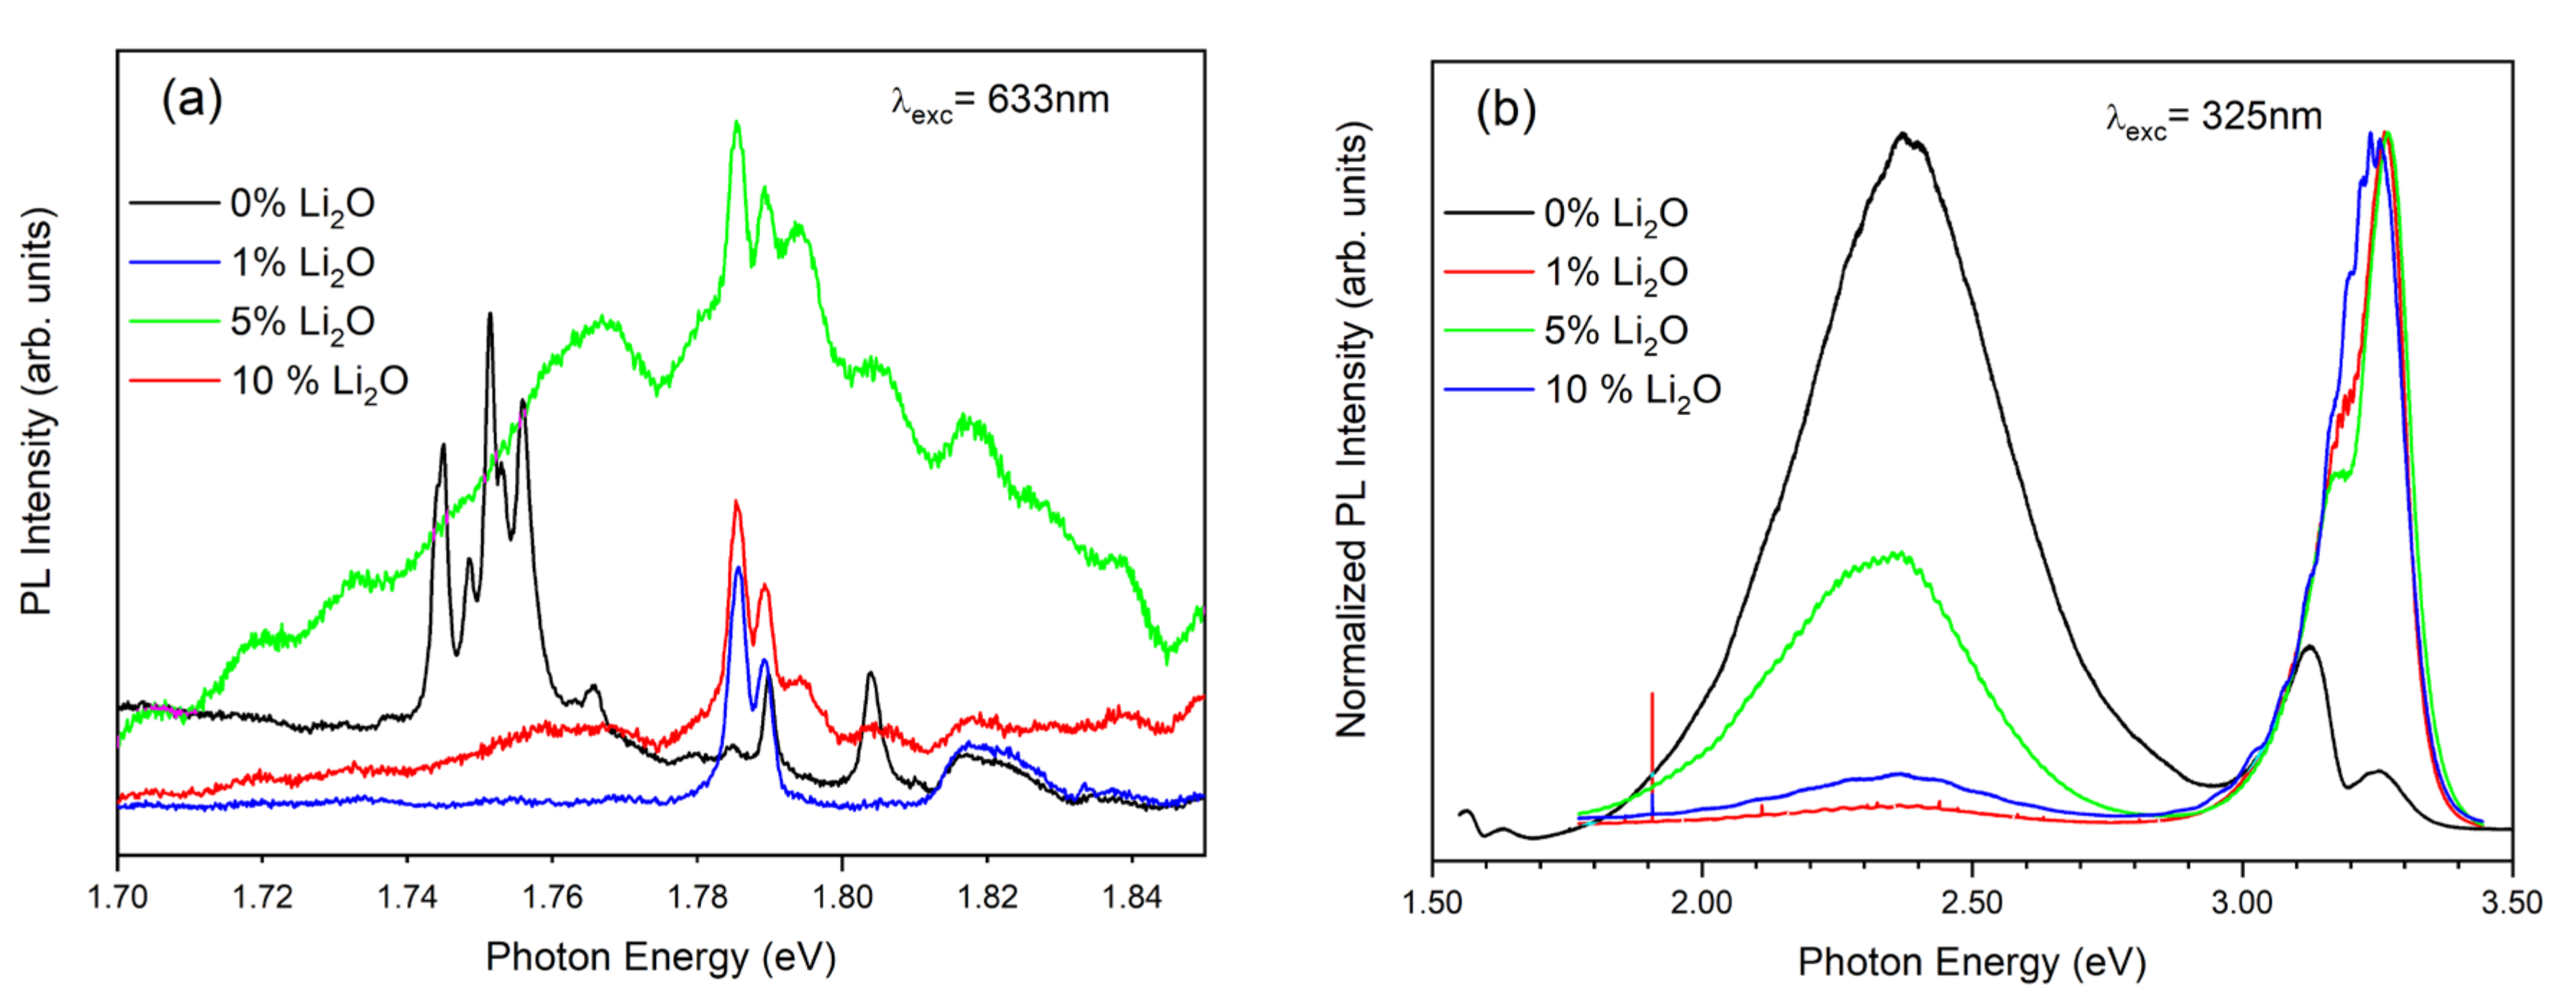
PL spectra were also developed in the structures both exciting with the UV laser and with the red. Let us start by describing the results obtained under excitation with the red laser (Figure 11a). In these conditions, we did not excite the luminescence of the ZnO, but it is possible to excite emissions from the Eu. The spectra were performed on clusters of various structures because the signal from a single structure was not very large. In all cases, emission lines were observed that may correspond to intraionic emissions of the Eu3+; however, there were significant differences between the spectra taken in the structures to which Li was not added and those of the structures that did have Li. In the first case (black line), three sets of lines were observed, an emission in 1.8 eV (687 nm), a double in 1.79 and 1.784 eV (692 and 694 nm) in which the emission of greater intensity was the one with the highest energy and a multiplet with emissions in 1.765, 1.755, 1.752, 1.749 and 1.745 eV (702, 706, 708, 709 and 711 nm). The last multiplet was already observed in the CL spectra and corresponded to the transitions 5D07F3; however, the emission at 1.8 eV and the multiplet, not observed in CL spectra, would correspond to the transitions 5D07F4. When introducing the Li in the structures, the emissions of the multiplet disappeared completely, and we only observed the lines of the double that we mentioned previously peaked at 1.79 and 1.784 eV (692 and 694 nm). In addition, in this case, the relative intensities of both emissions were the opposite of the previous case; the component of lower energy was more intense. Finally, a small band at 1.794 eV (691 nm) can be seen in the spectra taken on the structures of 5 and 10% Li that was not seen in the other cases.
In the case of spectra made by excitation with the UV laser, most of the time, what is observed is a large number of modulations, both in the emission of the band edge and in the band of defects when it appears. By selecting any of the spectra in which the modulations are not so pronounced, differences can be observed, especially in the emission of the band edge (Figure 11b). In the spectrum taken on structures in which there is no Li (black line), two emissions in that range centered on 3.12 and 3.25 eV can be clearly seen. In this case, the most intense emission corresponds to the component of lower energy. In addition, the relative intensity of the band edge emission is less than the band defects that are clearly observed. By adding Li (red, green and blue lines), the overall relative intensity of the band edge increases and, if we look at the two components that are resolved, it can be clearly seen that the component of 3.25 eV increases while that of 3.12 eV decreases until it is almost not resolved in the sample with the highest content in Li (blue line); it may be masked by the existence of modulations in that area.
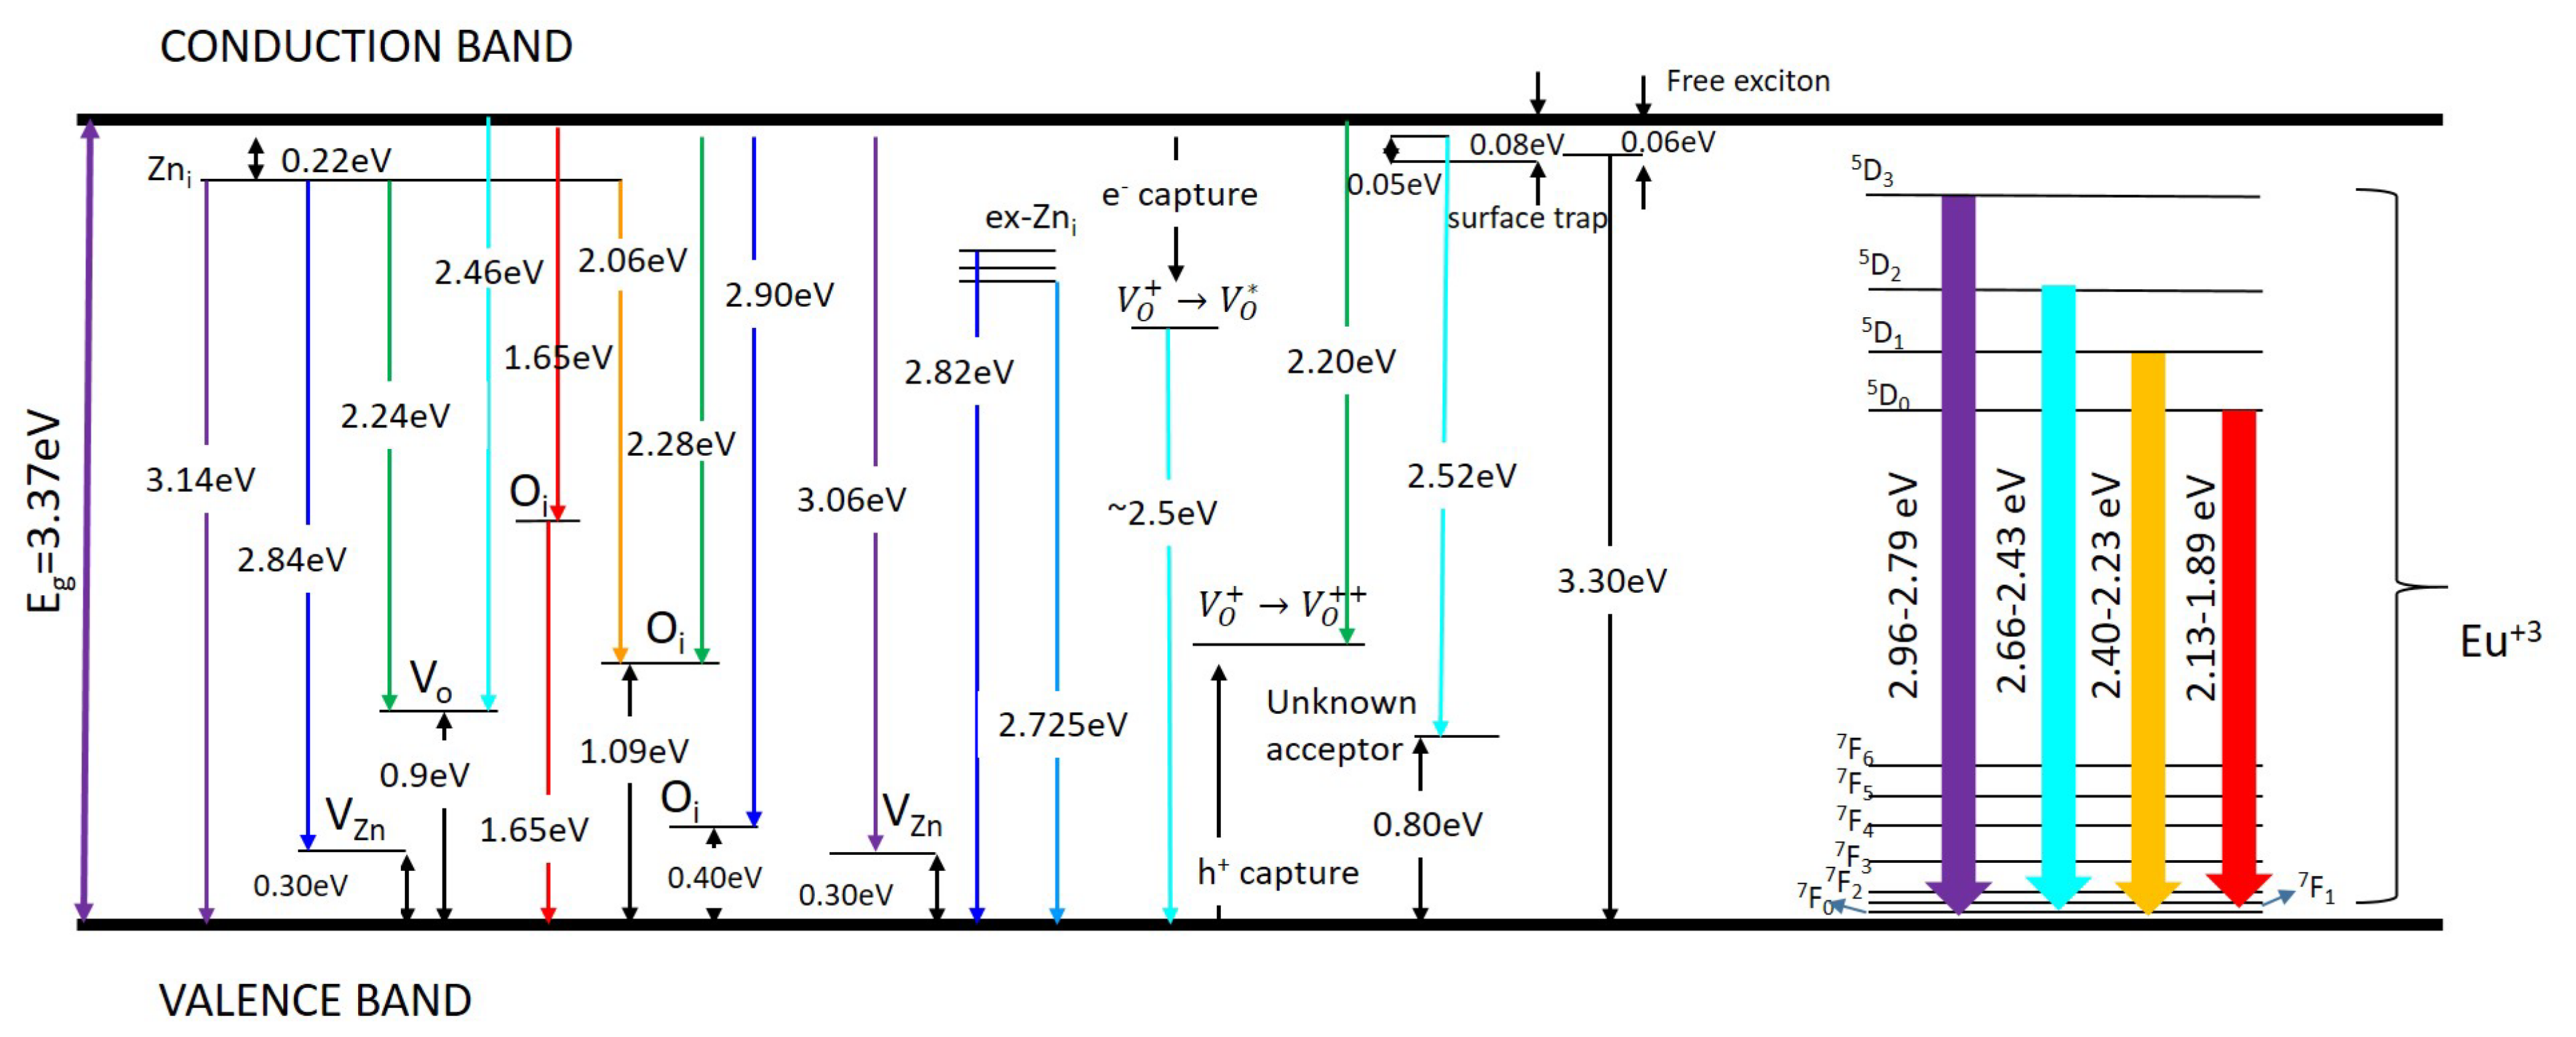
Figure 12 show a summary of the electronic levels involved in the transitions mentioned above [21,23,45,46].
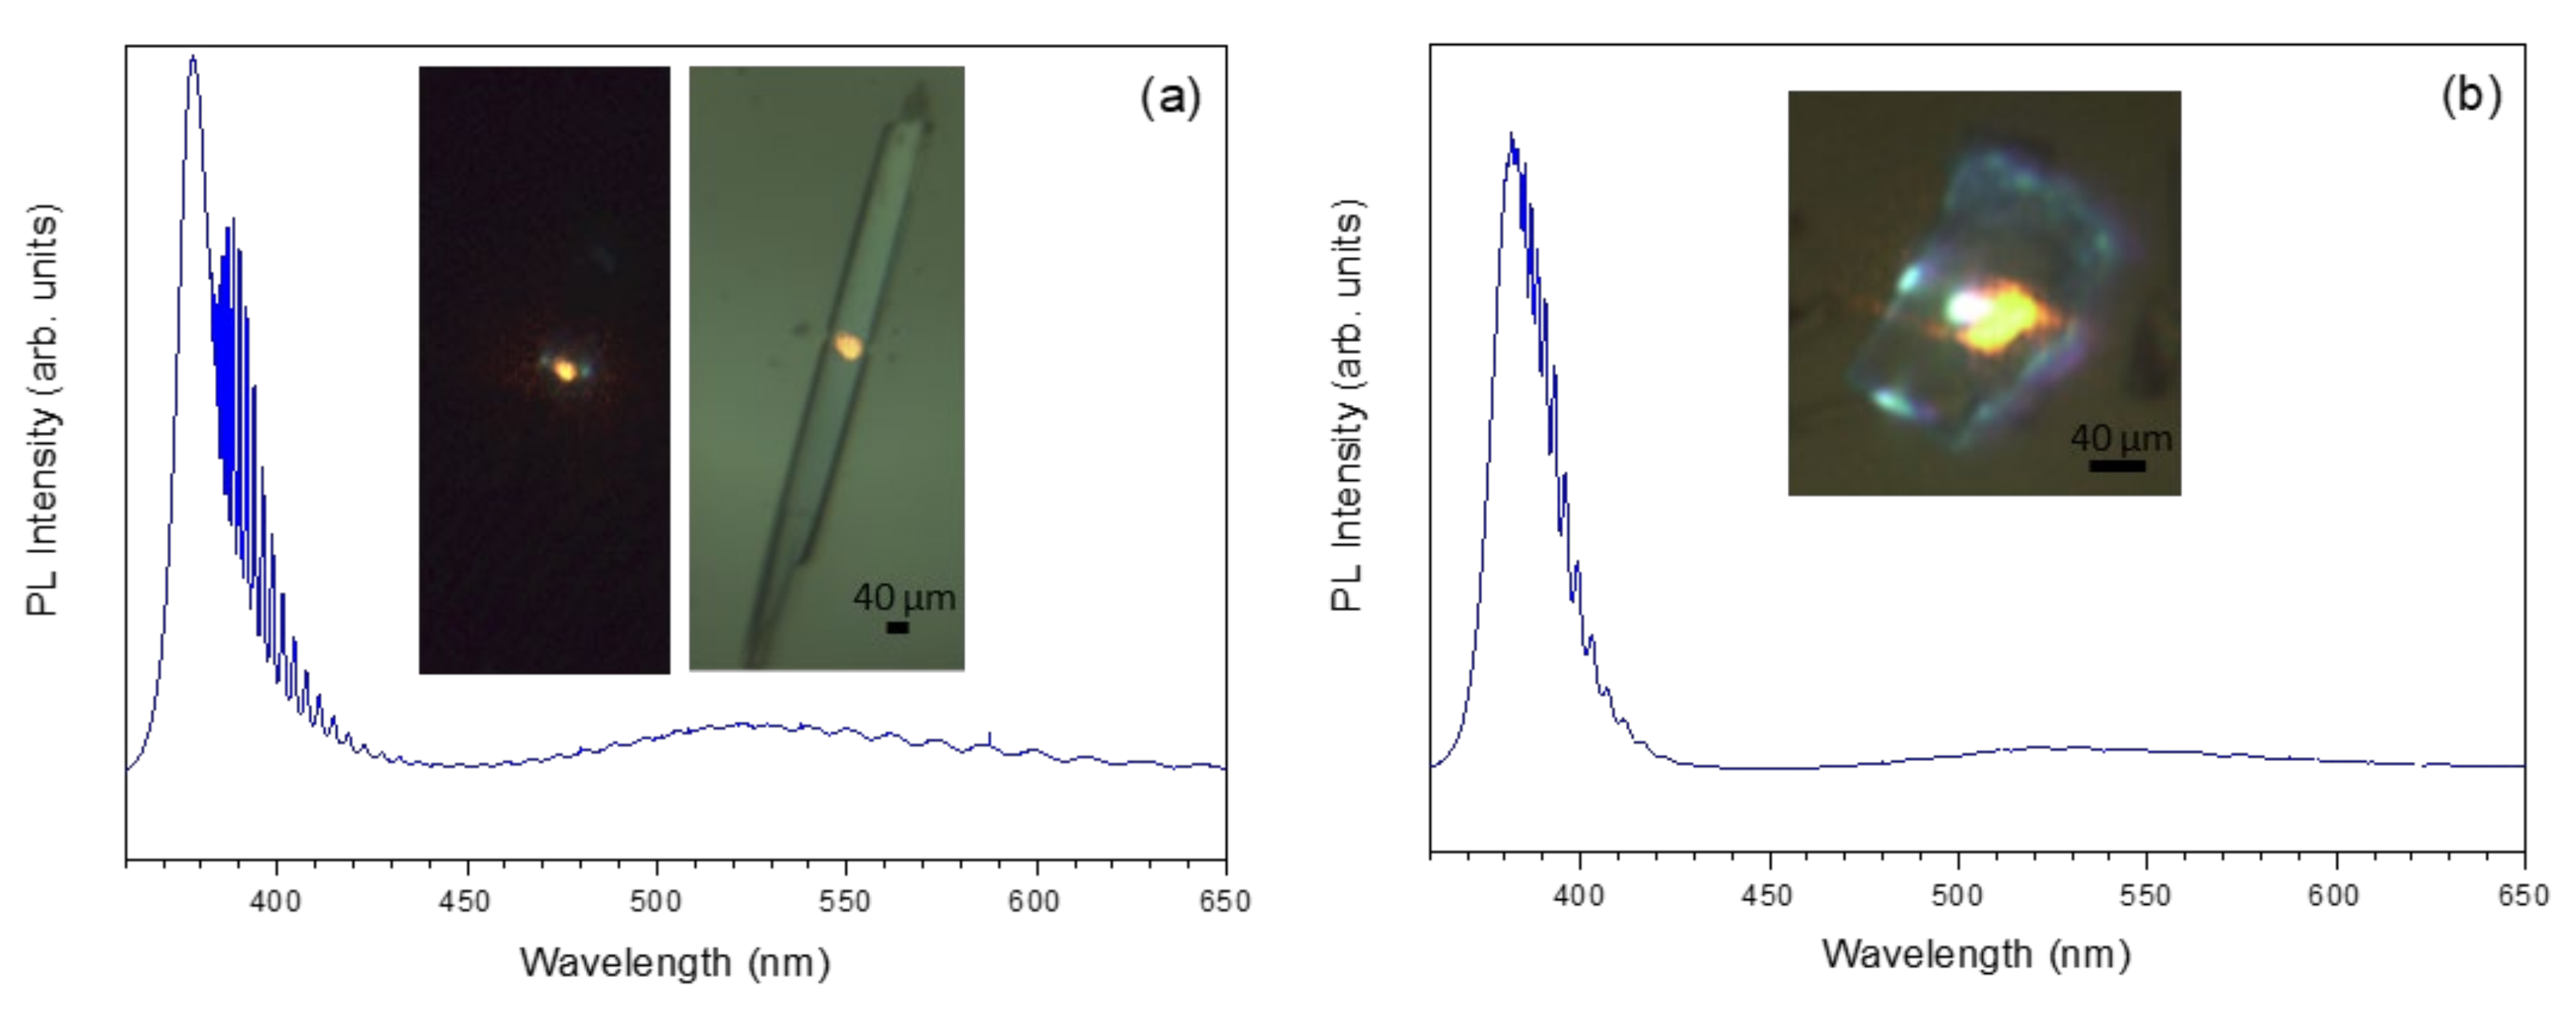
As we have mentioned, the appearance of modulations was clear in almost all the structures investigated of all the samples containing Li. For the reference sample without Li, the structures were smaller (both in length and diameter), and it was not possible to measure individual structures in which the effect was appreciated. Figure 13 show two examples of structures acting as optical resonators; part a corresponds to a tape-like structure in the sample with 5% Li2O, and in part b, a rectangular plate of the sample with 10% Li2O can be observed. In both cases, there are very clear modulations in the area of the lower energy band edge. In the images of μ-PL, the behavior as light guides of both structures is also observed.
Due to the high refractive index of ZnO (nZnO ≈ 2) with respect to that of the surrounding medium (nair ≈ 1) and the cross-section geometry of the structures, the light can be confined inside by internal reflections. The light beams travel the same optical path within the cavity, producing interference between successive beams. This interference pattern is reflected in the form of modulations in the photoluminescence spectrum, as observed in the spectra of Figure 13. To further assess the origin of these modulations, calculations were performed for the structure and spectra are shown in part a of the figure. In this case, the cross-section is a rectangle which allows two types of resonant modes, Fabry–Perot (FP) or Whispering Gallery (WG). However, for this particular structure, since some of the angles are well below the critical angle for internal reflection, which is around 30°, the WG modes cannot be established, and FP modes are more likely to occur. For an FP cavity, the length of the optical path (δop) can be calculated as:
Δ λ = λ 2 δ o p n
where n is the material refractive index, λ is the wavelength and Δλ is the separation between resonant modes. This calculation gives an optical path length of 36 µm for our case, in agreement with the lateral dimension of the structure measured from the optical image. The quality factor (Q) and finesse (F) of the cavity can also be calculated (Table 2). The results are very promising, with a Q value of 1022 for a wavelength of 384 nm, which indicates that these structures can be used in photonics applications in the UV range. The incorporation of Li into the structures improves their crystallinity and shape regularity which drastically enhances their behavior as optical resonators, as already reported in previous works [28,29,30].

4. Conclusions

In this work, we demonstrated the influence of Li co-doping on the morphology and optical properties of the ZnO:Eu nano and microstructures. By varying the co-dopant amount, we were able to observe the different positions that Li ions can occupy and their effect on the defect structure. On the other hand, the incorporation of Li considerably improves the behavior of the structures as optical resonant cavities compared to the structures that only contain Eu.
A large variety of nano- and microstructures of ZnO co-doped with Eu and Li were obtained by a vapor solid growth method. The changes in the energies of the crystallographic and, thus, in the growth directions due to the incorporation of the dopants lead to different morphologies depending on the initial Li content. While hexagonal rods which grow on the pellets were obtained in the samples where no Li was added, ribbons, sword-like and comb-like structures were more likely to appear as the Li amount increases. In some cases, secondary growths on the lateral faces of the comb-like structures were observed. The EBSD analysis performed in this type of structure confirmed that the growth direction changes between the plate and the prongs. XRD patterns and Raman spectroscopy indicated that the structures have good crystalline quality and grow in the ZnO wurtzite phase. Luminescence investigations showde both the well-known UV and green emission bands of ZnO; however, differences in the relative intensity as well as in the peak position were observed due to changes in the concentration of defects related to variations in the incorporation of dopants within the structures. In addition, emission lines associated with Eu3+ intrashell transitions were detected in all samples, although differences in the levels involved were observed between the samples with or without Li. Finally, the waveguiding behavior and the establishment of FP optical resonant modes inside the structures were demonstrated. Quality factors around 1000 in the UV region were calculated, which opens the possibility of using these structures in photonic nano- and microdevices.

Author Contributions

Validation, F.P., A.U. and P.F.; Formal analysis, F.P., A.U. and P.F.; Investigation, F.P., A.U. and P.F.; Writing—original draft preparation, F.P., A.U. and P.F.; Visualization, F.P., A.U. and P.F.; Conceptualization, A.U. and P.F.; Methodology, A.U. and P.F.; Writing—review & editing, A.U. and P.F.; Supervision, A.U. and P.F.; Resources, P.F.; Project administration, P.F.; Funding acquisition, P.F. All authors have read and agreed to the published version of the manuscript.

Funding

This work was founded by the Complutense University of Madrid—Banco Santander via project UCM-Santander 2019 (PR87/19-22613) and Complutense University—Comunidad de Madrid via project PR65/19-22464.

Institutional Review Board Statement

Not applicable.

Informed Consent Statement

Not applicable.

Conflicts of Interest

The authors declare no conflict of interest.

References

  1. Wang, Z.L. Novel nanostructures of ZnO for nanoscale photonics, optoelectronics, piezoelectricity, and sensing. Appl. Phys. A Mater. Sci. Process. 2007, 88, 7–15. [Google Scholar] [CrossRef]
  2. Kolodziejczak-Radzimska, A.; Jesionowski, T. Zinc oxide-from synthesis to application: A review. Materials 2014, 7, 2833–2881. [Google Scholar] [CrossRef] [PubMed] [Green Version]
  3. Skompska, M.; Zarȩbska, K. Electrodeposition of ZnO nanorod arrays on transparent conducting substrates-a review. Electrochim. Acta 2014, 127, 467–488. [Google Scholar] [CrossRef]
  4. Wang, Z.L. ZnO nanowire and nanobelt platform for nanotechnology. Mater. Sci. Eng. R Rep. 2009, 64, 33–71. [Google Scholar] [CrossRef]
  5. Ronning, C.; Gao, P.X.; Ding, Y. Manganese-doped ZnO nanobelts for spintronics. Appl. Phys. Lett. 2004, 84, 783. [Google Scholar] [CrossRef] [Green Version]
  6. Wadeasa, A.; Nur, O.; Willander, M. Zinc oxide nanorod-based heterostructures on solid and soft substrates for white-light-emitting diode applications, (n.d.). New J. Phys. 2009, 11, 125020. [Google Scholar] [CrossRef]
  7. Willander, M.; Nur, O.; Sadaf, J.R.; Qadir, M.I.; Zaman, S.; Zainelabdin, A.; Bano, N.; Hussain, I. Luminescence from zinc oxide nanostructures and polymers and their hybrid devices. Materials 2010, 3, 2643–2667. [Google Scholar] [CrossRef]
  8. Daksh, D.; Agrawal, Y.K. Rare Earth-Doped Zinc Oxide Nanostructures: A Review. Rev. Nanosci. Nanotechnol. 2016, 5, 1–27. [Google Scholar] [CrossRef]
  9. Ariza, R.; Pavón, F.; Urbieta, A.; Fernández, P. Study of the influence of dopant precursor on the growth and properties of Li-doped ZnO. J. Phys. Chem. Solids 2020, 139, 109354. [Google Scholar] [CrossRef]
  10. Urbieta, A.; Fernández, P.; Piqueras, J. Nanowires and stacks of nanoplates of Mn doped ZnO synthesized by thermal evaporation-deposition. Mater. Chem. Phys. 2012, 132, 1119–1124. [Google Scholar] [CrossRef]
  11. Wang, Z.L.; Kong, X.Y.; Zuo, J.M. Induced growth of asymmetric nanocantilever arrays on polar surfaces. Phys. Rev. Lett. 2003, 91, 185502. [Google Scholar] [CrossRef]
  12. Wander, A.; Schedin, F.; Steadman, P.; Norris, A.; McGrath, R.; Turner, T.S.; Thornton, G.; Harrison, N.M. Stability of polar oxide surfaces. Phys. Rev. Lett. 2001, 86, 3811–3814. [Google Scholar] [CrossRef] [Green Version]
  13. Li, W.J.; Shi, E.W.; Zhong, W.Z.; Yin, Z.W. Growth mechanism and growth habit of oxide crystals. J. Cryst. Growth 1999, 203, 186–196. [Google Scholar] [CrossRef]
  14. Ching, K.L.; Li, G.; Ho, Y.L.; Kwok, H.S. The role of polarity and surface energy in the growth mechanism of ZnO from nanorods to nanotubes. Cryst. Eng. Comm. 2016, 18, 779–786. [Google Scholar] [CrossRef]
  15. Galli, G. Solid-state physics: Doping the undopable. Nature 2005, 436, 32–33. [Google Scholar] [CrossRef]
  16. Zhang, F.; Wei, S.H.; Zunger, A. Microscopic origin of the phenomenological equilibrium “doping limit rule” inn-Type III-V semiconductors. Phys. Rev. Lett. 2000, 84, 1232–1235. [Google Scholar] [CrossRef] [Green Version]
  17. Tang, K.; Gu, S.L.; Ye, J.D.; Zhu, S.M.; Zhang, R.; Zheng, Y.D. Recent progress of the native defects and p-type doping of zinc oxide. Chin. Phys. B. 2017, 26, 047702. [Google Scholar] [CrossRef]
  18. Avrutin, V.; Silversmith, D.J.; Morkoç, H. Doping asymmetry problem in ZnO: Current status and outlook. Proc. IEEE. 2010, 98, 1269–1280. [Google Scholar] [CrossRef]
  19. Yan, Y.; Wei, S.H. Doping asymmetry in wide-bandgap semiconductors: Origins and solutions. Phys. Status Solidi Basic Res. 2008, 245, 641–652. [Google Scholar] [CrossRef]
  20. Pal, P.P.; Manam, J. Enhanced luminescence of ZnO: RE3+ (RE = Eu, Tb) nanorods by Li+ doping and calculations of kinetic parameters. J. Lumin. 2014, 145, 340–350. [Google Scholar] [CrossRef]
  21. Kenyon, J. Recent developments in rare-earthdoped materials for optoelectronics. Prog. Quantum Electron. 2002, 26, 225–284. [Google Scholar] [CrossRef]
  22. Gaggero, E.; Calza, P.; Cerrato, E.; Paganini, M.C. Cerium-, Europium- and Erbium-Modified ZnO and ZrO2 for Photocatalytic Water Treatment Applications: A Review. Catalysts 2021, 11, 1520. [Google Scholar] [CrossRef]
  23. Kumar, V.; Ntwaeaborwa, O.M.; Soga, T.; Dutta, V.; Swart, H.C. Rare Earth Doped Zinc Oxide Nanophosphor Powder: A Future Material for Solid State Lighting and Solar Cells. ACS Photonics 2017, 4, 2613–2637. [Google Scholar] [CrossRef]
  24. Singh, A.K.; Singh, S.K.; Rai, S.B. Role of Li+ ion in the luminescence enhancement of lanthanide ions: Favorable modifications in host matrices. RSC Adv. 2014, 4, 27039–27061. [Google Scholar] [CrossRef]
  25. Eliseeva, S.V.; Bünzli, J.-C.G.; Dreyer, D.R.; Park, S.; Bielawski, C.W.; Ruoff, R.S. Chemical Society Reviews Critical Review. Chem. Soc. Rev. 2010, 39, 189–227. [Google Scholar] [CrossRef]
  26. Krishna, R.; Haranath, D.; Singh, S.P.; Chander, H.; Pandey, A.C.; Kanjilal, D. Synthesis and improved photoluminescence of Eu:ZnO phosphor. J. Mater. Sci. 2007, 42, 10047–10051. [Google Scholar] [CrossRef]
  27. Khanum, R.; Das, N.M.; Moirangthem, R.S. Defect engineered ZnO whispering gallery modes via doping with alkali metal ions for label-free optical sensors. J. Appl. Phys. 2019, 125, 173107. [Google Scholar] [CrossRef]
  28. Ariza, R.; Sotillo, B.; Pavón, F.; Urbieta, A.; Fernández, P. Evolution of whispering gallery modes in Li-doped ZnO hexagonal micro-and nanostructures. Appl. Sci. 2020, 10, 8602. [Google Scholar] [CrossRef]
  29. Pavón, F.; Urbieta, A.; Fernández, P. Luminescence and light guiding properties of Er and Li codoped ZnO nanostructures. J. Lumin. 2018, 195, 396–401. [Google Scholar] [CrossRef]
  30. Pavón, F.; Ariza, R.; Urbieta, A.; Fernández, P. Morphology Luminescence, and Optical Properties of Tb- and Li-Codoped ZnO Elongated Nano- and Microstructures. Phys. Status Solidi Appl. Mater. Sci. 2022, 219, 2100805. [Google Scholar] [CrossRef]
  31. Yang, P.; Yan, H.; Mao, S.; Russo, R.; Johnson, J.; Saykally, R.; Morris, N.; Pham, J.; He, R.; Choi, H.J. Controlled growth of ZnO nanowires and their optical properties. Adv. Funct. Mater. 2002, 12, 323–331. [Google Scholar] [CrossRef]
  32. Johnson, J.C.; Yan, H.Q.; Yang, P.D.; Saykally, R.J. Optical cavity effects in ZnO nanowire lasers and waveguides. J. Phys. Chem. B. 2003, 107, 8816–8828. [Google Scholar] [CrossRef] [Green Version]
  33. Dong, H.; Liu, Y.; Sun, S.; Li, J.; Zhan, J.; Chen, Z.; Zhang, L. Geometry dependent evolution of the resonant mode in Zno elongated hexagonal Microcavity. Sci. Rep. 2016, 6, 19273. [Google Scholar] [CrossRef] [PubMed] [Green Version]
  34. Ma, R.M.; Wei, X.L.; Dai, L.; Liu, S.F.; Chen, T.; Yue, S.; Li, Z.; Chen, Q.; Qin, G.G. Light coupling and modulation in coupled nanowire ring-fabry-pérot cavity. Nano Lett. 2009, 9, 2697–2703. [Google Scholar] [CrossRef]
  35. Cuscó, R.; Alarcón-Lladó, E.; Ibáñez, J.; Artús, L.; Jiménez, J.; Wang, B.; Callahan, M.J. Temperature dependence of Raman scattering in ZnO. Phys. Rev. B. 2007, 75, 165202. [Google Scholar] [CrossRef]
  36. Kurgan, N.; Karbivskyy, V.; Kasyanenko, V. Morphology and electronic structure of nanoscale powders of calcium hydroxyapatite. Nanoscale Res. Lett. 2015, 10, 41. [Google Scholar] [CrossRef] [Green Version]
  37. Djurisic, A.B.; Leung, Y.H.H.; Tam, K.H.H.; Ding, L.; Ge, W.K.K.; Chen, H.Y.Y.; Gwo, S.; Djurišić, A.B.; Leung, Y.H.H.; Tam, K.H.H.; et al. Green, yellow, and orange defect emission from ZnO nanostructures Influence of excitation wavelength. Appl. Phys. Lett. 2006, 88, 103107. [Google Scholar] [CrossRef] [Green Version]
  38. Djurišić, A.B.; Leung, Y.H.; Tam, K.H.; Hsu, Y.F.; Ding, L.; Ge, W.K.; Zhong, Y.C.; Wong, K.S.; Chan, W.K.; Tam, H.L.; et al. Defect emissions in ZnO nanostructures. Nanotechnology 2007, 18, 095702. [Google Scholar] [CrossRef]
  39. Özgür, Ü.; Alivov, Y.I.; Liu, C.; Teke, A.; Reshchikov, M.; Doǧan, S.; Avrutin, V.; Cho, S.J.; Morko, H. A comprehensive review of ZnO materials and devices. J. Appl. Phys. 2005, 98, 1–103. [Google Scholar] [CrossRef] [Green Version]
  40. Bruno, L.; Strano, V.; Scuderi, M.; Franzò, G.; Priolo, F.; Mirabella, S. Localized energy band bending in zno nanorods decorated with au nanoparticles. Nanomaterials 2021, 11, 2718. [Google Scholar] [CrossRef]
  41. Fabbri, F.; Villani, M.; Catellani, A.; Calzolari, A.; Cicero, G.; Calestani, D.; Calestani, G.; Zappettini, A.; Dierre, B.; Sekiguchi, T.; et al. Zn vacancy induced green luminescence on non-polar surfaces in ZnO nanostructures. Sci. Rep. 2014, 4, 5158. [Google Scholar] [CrossRef] [Green Version]
  42. Peres, M.; Cruz, A.; Pereira, S.; Correia, M.R.; Soares, M.J.; Neves, A.; Carmo, M.C.; Monteiro, T.; Pereira, A.S.; Martins, M.A.; et al. Optical studies of ZnO nanocrystals doped with Eu3+ ions. Appl. Phys. A Mater. Sci. Process. 2007, 88, 129–133. [Google Scholar] [CrossRef]
  43. Assadi, M.H.N.; Zhang, Y.; Zheng, R.K.; Ringer, S.P.; Li, S. Structural and electronic properties of Eu- and Pd-doped ZnO. Nanoscale Res. Lett. 2011, 6, 357. [Google Scholar] [CrossRef] [Green Version]
  44. Sotillo, B.; Fernández, P.; Piqueras, J. Growth by thermal evaporation of Al doped ZnS elongated micro- and nanostructures and their cathodoluminescence properties. J. Alloys Compd. 2014, 603, 57–64. [Google Scholar] [CrossRef]
  45. Vempati, S.; Mitra, J.; Dawson, P. One-step synthesis of ZnO nanosheets: A blue-white fluorophore. Nanoscale Res. Lett. 2012, 7, 470. [Google Scholar] [CrossRef] [Green Version]
  46. Hooda, A.; Khatkar, S.P.; Khatkar, A.; Malik, R.K.; Devi, S.; Dalal, J.; Taxak, V.B. Combustion synthesis, Judd–Ofelt parameters and optical properties of color tunable Ba3Y4O9: Eu3+ nanophosphor for near-UV based WLEDs. J. Mater. Sci. Mater. Electron. 2019, 30, 8751–8762. [Google Scholar] [CrossRef]
Figure 1. Scheme of the most common faces that appear in the growth of ZnO.
Applsci 12 06948 g001
Figure 2. SEM images of the different structures grown on the samples with no Li included: (a) Compacted shell of structures, (b) hexagonal wires and rods, (c) bundles of comb-like structures and (d) columnar growth observed in the rims of the pellets.
Applsci 12 06948 g002
Figure 3. SEM images of the structures obtained on the sample with 1 wt% Li. (a) Hexagonal rods grown on the pellet, (b,c) ribbons and sword-like structures grown both on the rims of the pellet and on the alumina boat.
Applsci 12 06948 g003
Figure 4. SEM images of the structures grown on the samples with 10 wt% Li. (a) Ribbons grown onto the alumina boat, (b) Secondary prongs grown from the lateral faces of the comb-like structures and (c) filling of the spaces between the ribbons to form the final ribbon morphology.
Applsci 12 06948 g004
Figure 5. SEM images of the structures grown on the samples with 10%wt. Li. (a) panoramic view of the diversity of morphologies obtained in this case, (b) oriented small plates and (c) scheme of the growth model suggested.
Applsci 12 06948 g005
Figure 6. EBSD analysis of the growth orientations of a comb-like structure. (a) Secondary electron image of a comb-like structure with secondary growth of a prone, the directions of the detector are fixed in the lower right corner, (b) Orientation map taken along the Z axis and (c) color legend used in the EBSD map.
Applsci 12 06948 g006
Figure 7. (a) SE image of a comb-like structure grown on the samples with 5 wt% of Li, and (b) corresponding EDX map of the distribution of Eu along the structure.
Applsci 12 06948 g007
Figure 8. XRD pattern obtained from the structures grown on the sample with 5 wt% Li. The peaks with higher intensity are labeled. All the diffraction peaks correspond to reflections of the ZnO wurtzite structure (JCPDS 00-036-1451).
Applsci 12 06948 g008
Figure 9. (a) Raman spectra recorded on individual rod-like structures grown on the different samples, (b) zoom-in of the E2high Raman mode (438 cmࢤ1) showing the shift of the frequency as the Li content varies. Spectrum from pure ZnO is also shown for comparison.
Applsci 12 06948 g009
Figure 10. CL spectra performed at room temperature on (a) individual structures grown on the different samples and (b) the surface of the pellet after the thermal treatments.
Applsci 12 06948 g010
Figure 11. PL spectra performed at room temperature on individual structures grown on the different samples using a laser with (a) λ = 633 nm and (b) λ = 325 nm as excitation sources.
Applsci 12 06948 g011
Figure 12. Scheme of the different electronic levels involved in the luminescence transitions of ZnO and Eu3+.
Applsci 12 06948 g012
Figure 13. µ-PL images and spectra recorded on individual structures grown on a sample with 5 wt% Li. In part (a), the selected structure is tape-like and part (b) a plate. In both cases, modulations are clearly observed in the near-band edge emissions. The images also show that the structures act as waveguides.
Applsci 12 06948 g013
Table 1. Notation of the samples.
SampleZnSEu2O3Li2O
Eu59550
Eu5_Li19451
Eu5_Li59055
Eu5_Li1085510
Table 2. Calculation of the quality factor (Q) and finesse (F) for the structure shown in Figure 13a.
Wavelength (nm)Quality Factor (Q)Fineness (F)
384.51022.883.09
385.66959.783.26
386.97860.703.16
388.39788.933.39
390.06723.673.41
391.9663.903.47
393.95602.743.44
396.2555.523.53
Publisher’s Note: MDPI stays neutral with regard to jurisdictional claims in published maps and institutional affiliations.