Article

A Method for Evaluating the Influence of the Field Wind Environment on Cross-Country Skiing Performance

1
School of Civil Engineering, Northeast Forestry University, Harbin 150040, China
2
Heilongjiang Research Institute of Sports Science, Harbin 150008, China
*
Authors to whom correspondence should be addressed.
Appl. Sci. 2022, 12(14), 6902; https://doi.org/10.3390/app12146902
Submission received: 1 June 2022 / Revised: 24 June 2022 / Accepted: 4 July 2022 / Published: 7 July 2022
(This article belongs to the Special Issue Sports Fluid Mechanics)

Abstract

:
Aerodynamic drag plays an important role in high-speed skiing. The wind-induced thrust or resistance of athletes, the sliding speed, and the work to overcome the aerodynamic drag are greatly affected by wind; therefore, reducing wind-induced drag is a focus of sport science. This paper proposes a method for evaluating the influence of wind on cross-country skiing performance, which is based on the athlete’s aerodynamic-drag-work relative to the environmental wind field and the establishment of a racetrack wind field model. Aiming at an athlete’s typical sport posture in the Yabuli Ski Field, the impact of field wind on the skier’s speed, the work done by the athlete to overcome aerodynamic drag, and the ratio of the field wind-induced work to the athlete’s total work are analyzed. Through the analysis of the athlete’s work to overcome aerodynamic drag and the wind resistance energy dissipation ratio in three training cases, it is shown that the field wind has a great influence on the athlete’s performance during sliding, which verified the effectiveness of the method. This method will provide coaches and sport researchers with accurate wind resistance energy dissipation data and provide a scientific basis for routine athletic training.

1. Introduction

Ski racing has a distinct competitiveness and unique characteristics. The performance of a skier is not only related to the performance of the ski equipment and the state of the sport at that time, but it is also closely related to the wind environment of the ski field during the race. The field wind environment directly acts on the athlete’s body in the form of wind load, which affects the athlete’s running drag and thus has an impact on performance [1,2,3,4,5]. Effectively evaluating the impact of changing wind environments on an athlete’s achievements is of great significance for objectively evaluating performance and individual skill, optimizing the physical distribution of the athlete during the race, and improving the athlete’s competitive skills.
In order to evaluate the influence of the field wind environment on cross-country skiing athletes’ performance, the first step is to obtain the wind-induced aerodynamic drag of the athletes in the ski field wind environment. In recent years, many researchers have carried out research work on the acquisition of athletes’ wind-induced aerodynamic drag through numerical calculation methods based on computational fluid dynamics (CFD) and wind tunnel experiments [6,7,8,9]. Chen [10] used steady and unsteady models to simulate 2D athlete models, and the results indicated that wind and posture affect the aerodynamic performance of a skier during the flight stage. Meyer [11] tested the aerodynamic characteristics of skiers in a wind tunnel while holding nine different skiing postures, established drag coefficient models, and analyzed the aerodynamic energy dissipation between dynamic and compact skiing techniques. Barry [12] conducted experiments on a team of four athletes in the Monash University Wind Tunnel to study the interactions of aerodynamic drag between cyclists riding in a team as a function of their riding position. Mannion [13] performed full-scale CFD simulations of the tandem cycling postures of upright, crouched, time-trial, and frame-clench and studied the influence of the aerodynamic interactions between both tandem athletes. Gardan [14] created a CFD model based on wind tunnel tests to assess the effect of athlete posture and speed on their aerodynamic performance during the early flight phase of ski jumping. Elfmark [15] studied the aerodynamics of the alpine skiing tuck position through CFD numerical simulation, and the CFD simulation results showed that the airflow around the lower legs had a noticeable impact on the skier’s drag, accounting for 40–50% of the total drag area in the low tuck position and, based on the study, found that the drag area could be reduced by adjusting the torso angle. Although the aforementioned studies performed aerodynamic assessments of the wind-induced drag of athletes, they overlooked the wind environment of the athletes’ sports site, which is frequently subjected to weather conditions and venue terrain.
Another important step is to obtain the field wind environment, which changes with time on complex terrain, so as to study the influence of the field wind environment on athlete performance. Many scholars have carried out effective research on the establishment of wind field models under complex terrain [16,17,18,19,20]. For example, Uchida [21] developed the RIAM-COMPACT program based on the large-eddy simulation turbulent model to successfully simulate field wind under complex terrain, and they analyzed the changes in field wind caused by topographic effects. Huang [22] simulated the actual terrain by establishing a terrain transition curve to build a buffer around the complex terrain, and compared the numerical simulation results with the field measured data to verify the feasibility of the mountain terrain modelling method based on the transition curve. Ren [23] established a spatial wind field prediction model based on the “triangle edge angle relationship” for the average wind speed and the spatial correlation analysis for the fluctuating wind, which reproduced the spatial field wind under complex terrain. At present, most research on wind field under complex terrain has concentrated on the construction of bridges in mountainous regions and the site selection of wind farms [24,25,26,27,28,29], and research less frequently involves sports science.
In conclusion, there are relatively mature techniques for determining the wind-induced aerodynamic drag of athletes and constructing the model of the racetrack wind field, which are fully merged in this study to evaluate the effect of the wind environment on cross-country skiing performance. Through the establishment of a racetrack field wind environment model and by obtaining an athlete’s wind-induced aerodynamic drag, this study is based on the establishment of an energy dissipation model for cross-country skiers to overcome aerodynamic drag during the race, thus establishing an evaluation method of the field wind’s influence on cross-country skiing performance.

2. Calculation Method of Aerodynamic-Drag-Work by Athletes during Sliding

2.1. Overcoming Wind Resistance Energy Dissipation

Athletes experience aerodynamic-drag-work during sliding [30,31,32], which is formed by the relative speed between the approaching wind and the athlete’s sliding movement. Aerodynamic drag is as follows:
F D = 1 2 C D A ρ U 2
where F D is the drag force experienced by the athlete [N]; C D is the drag coefficient of the athlete’s posture, with its value often determined by the athlete’s posture and measured using wind tunnel experiments; ρ is the air density [kg/m3]; U is the relative speed between the approaching wind at the athlete’s position and the athlete’s movement [m/s]; and A is the frontal area of the athlete’s sliding posture [m2], wherein the drag coefficient is not greatly affected by the relative wind speed within the athlete’s sliding speed range.
As shown in Figure 1, the athlete moves from point P i to point P i + 1 in period time Δ t i (times t i to t i + 1 ). The angle between the sliding direction and the direction of the geographic coordinate system (x-axis) is γ i , and the field wind direction is θ i + 1 at point P i + 1 and time t i + 1 . In a certain period of time Δ t i , the relative speed between the approaching wind and the athlete’s movement in the direction of the athletes’ movement is expressed as follows:
U i = V i + cos θ i + 1 γ i u i + 1
where V i is the average sliding speed of the athlete during a certain period of time Δ t i [m/s], and u i + 1 , θ i + 1 is the wind speed and direction of the field wind where the athlete is located at time t i + 1 , which is obtained by the instantaneous field wind interpolation function. The specific calculation in the following ski field racetrack wind modelling is proposed as follows. In a period of time Δ t i , the aerodynamic-drag-work to the athlete during skiing is as follows:
W a e r o i = F D i Δ s i
where Δ s i is the distance travelled by the athlete in the period of time Δ t i ,
Δ s i = V i Δ t i
The magnitude and direction of the athlete’s sliding speed, the field wind speed where the athlete is located, and the relative speed of the field wind and athlete all change with time. Therefore, the field wind may promote or hinder the skaters’ sliding. Equations (1) and (2) are rearranged to determine the calculations for F D i as follows:
F D i = 1 2 C D j A j ρ V i + cos θ i + 1 γ i u i + 1 V i + cos θ i + 1 γ i u i + 1
In a certain stage S j , where the athlete’s sport posture remains unchanged, C D j and A j remain unchanged. Sport posture is the basis for dividing the entire track into different stages. Therefore, C D j and A j on different stages are different. For S j , the skier has experienced n j time periods Δ t i . According to Formulas (3)–(5), the aerodynamic-drag-work to the athlete during the sliding can be expressed as follows:
W a e r o j = i = 1 n j 1 2 C D j A j ρ V j , i + cos θ j , i + 1 γ i u j , i + 1 V j , i + cos θ j , i + 1 γ i u j , i + 1   V i Δ t i
For the entire racetrack of the ski field, it can be divided into m stages according to different sports postures. The aerodynamic-drag-work to the athlete during the entire racetrack is as follows:
W a e r o = j = 1 m i = 1 n j 1 2 C D j A j ρ V i + cos θ j , i + 1 γ i u j , i + 1 V i + cos θ j , i + 1 γ i u j , i + 1   V i Δ t i
The aerodynamic drag dissipation that the athlete overcomes during the sliding can be expressed as follows:
E a e r o = W a e r o

2.2. Wind Resistance Energy Dissipation Ratio

The difference between the aerodynamic drag energy dissipation overcome by the athlete in field wind and the aerodynamic drag energy dissipation that the athlete overcomes in the static air is called the athlete overcoming field wind resistance energy dissipation. The ratio of overcoming field wind resistance energy dissipation to the absolute value of overcoming aerodynamic drag energy dissipation in static air is the athletes’ wind resistance energy dissipation ratio.
The wind resistance energy dissipation ratio of the athletes in stage S j can be expressed as follows:
r w j = E a e r o j E s t j E s t j
The athletes’ wind resistance energy dissipation ratio in the whole racetrack can be expressed as follows :
r w = E a e r o E s t E s t
In Formulas (9) and (10), E s t j and E s t are the energy dissipations of athletes in static air overcoming aerodynamic drag in stage S j and athletes in still air overcoming aerodynamic drag in the whole racetrack, respectively.
E s t j = W s t j
E s t = W s t
In Formulas (11) and (12), W s t j and W s t are the work done by the aerodynamic drag formed by the relative speed of the static air and the athlete in stage S j and in the entire track, respectively, which can be expressed as follows:
W s t j = i = 1 n 1 2 C D j A j ρ V i 3 Δ t i
W s t = j = 1 m i = 1 n 1 2 C D j A j ρ V i 3 Δ t i
The wind resistance energy dissipation ratio reflects the influence of the field wind environment on the energy dissipation of the athletes during sliding and reflects the assist or resistance effect of the field wind environment. When the wind resistance energy dissipation ratio of the athletes in Formulas (9) and (10) is positive, it means that the field wind environment mainly hinders the athlete’s sliding. When this parameter has a negative value, it means that the field wind environment mainly promotes the athlete’s sliding.

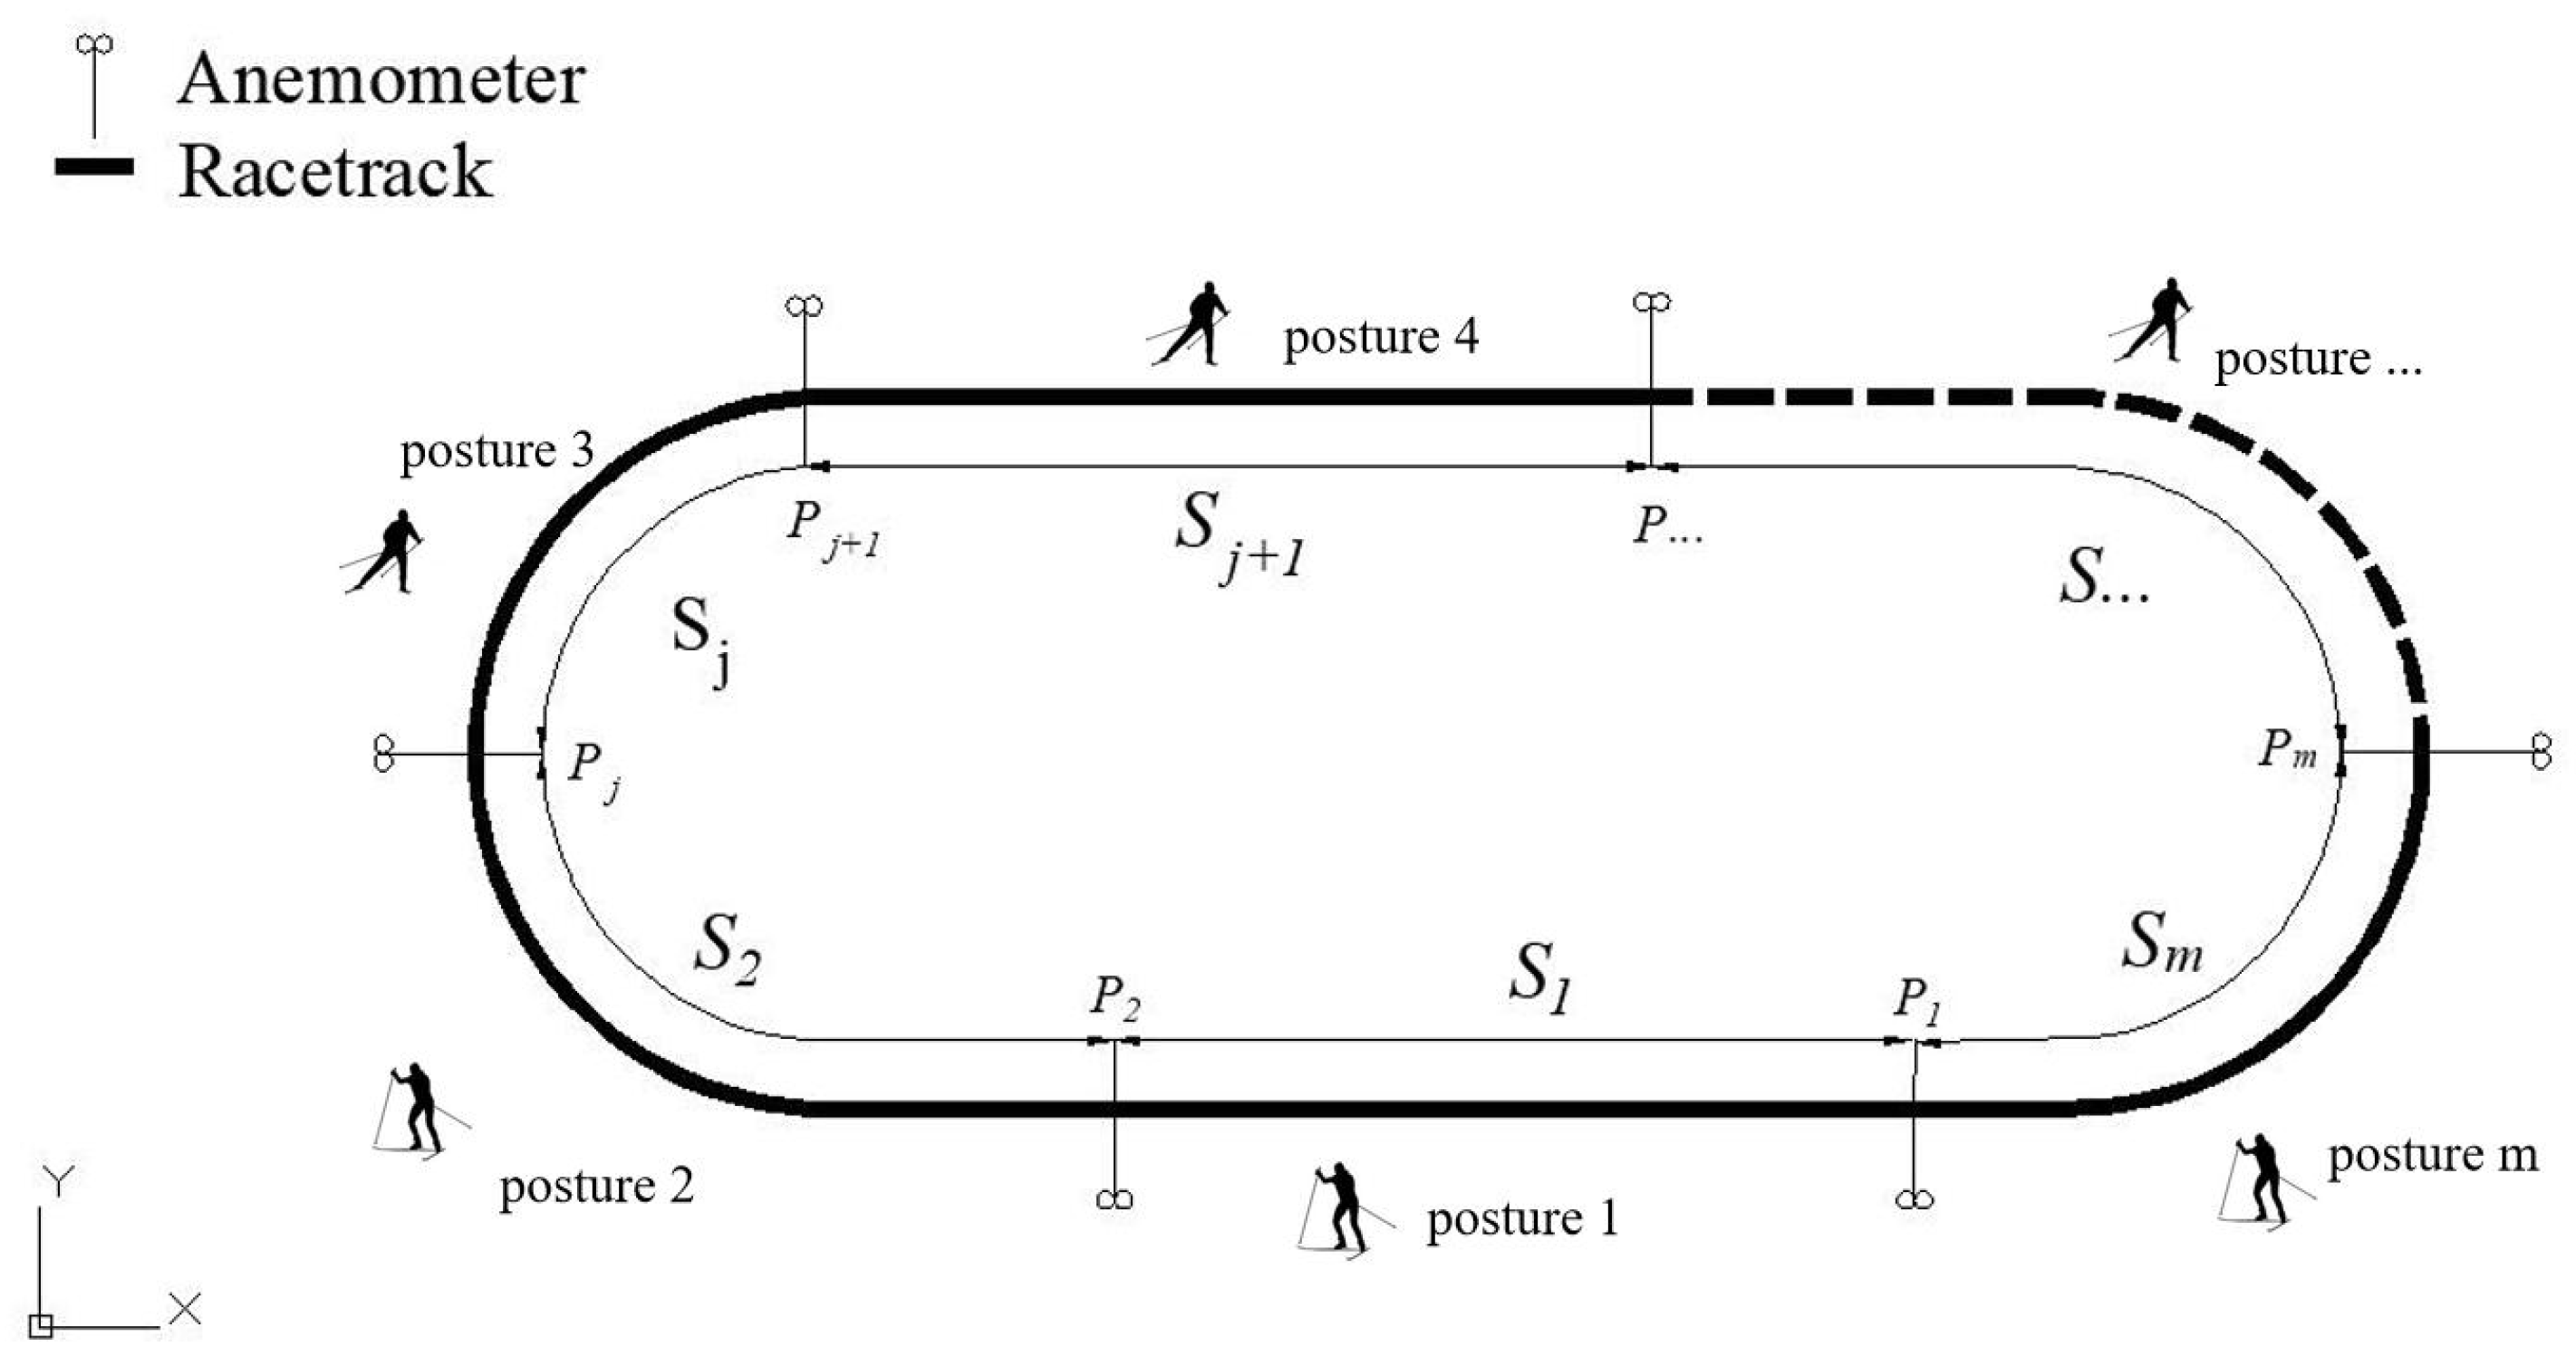
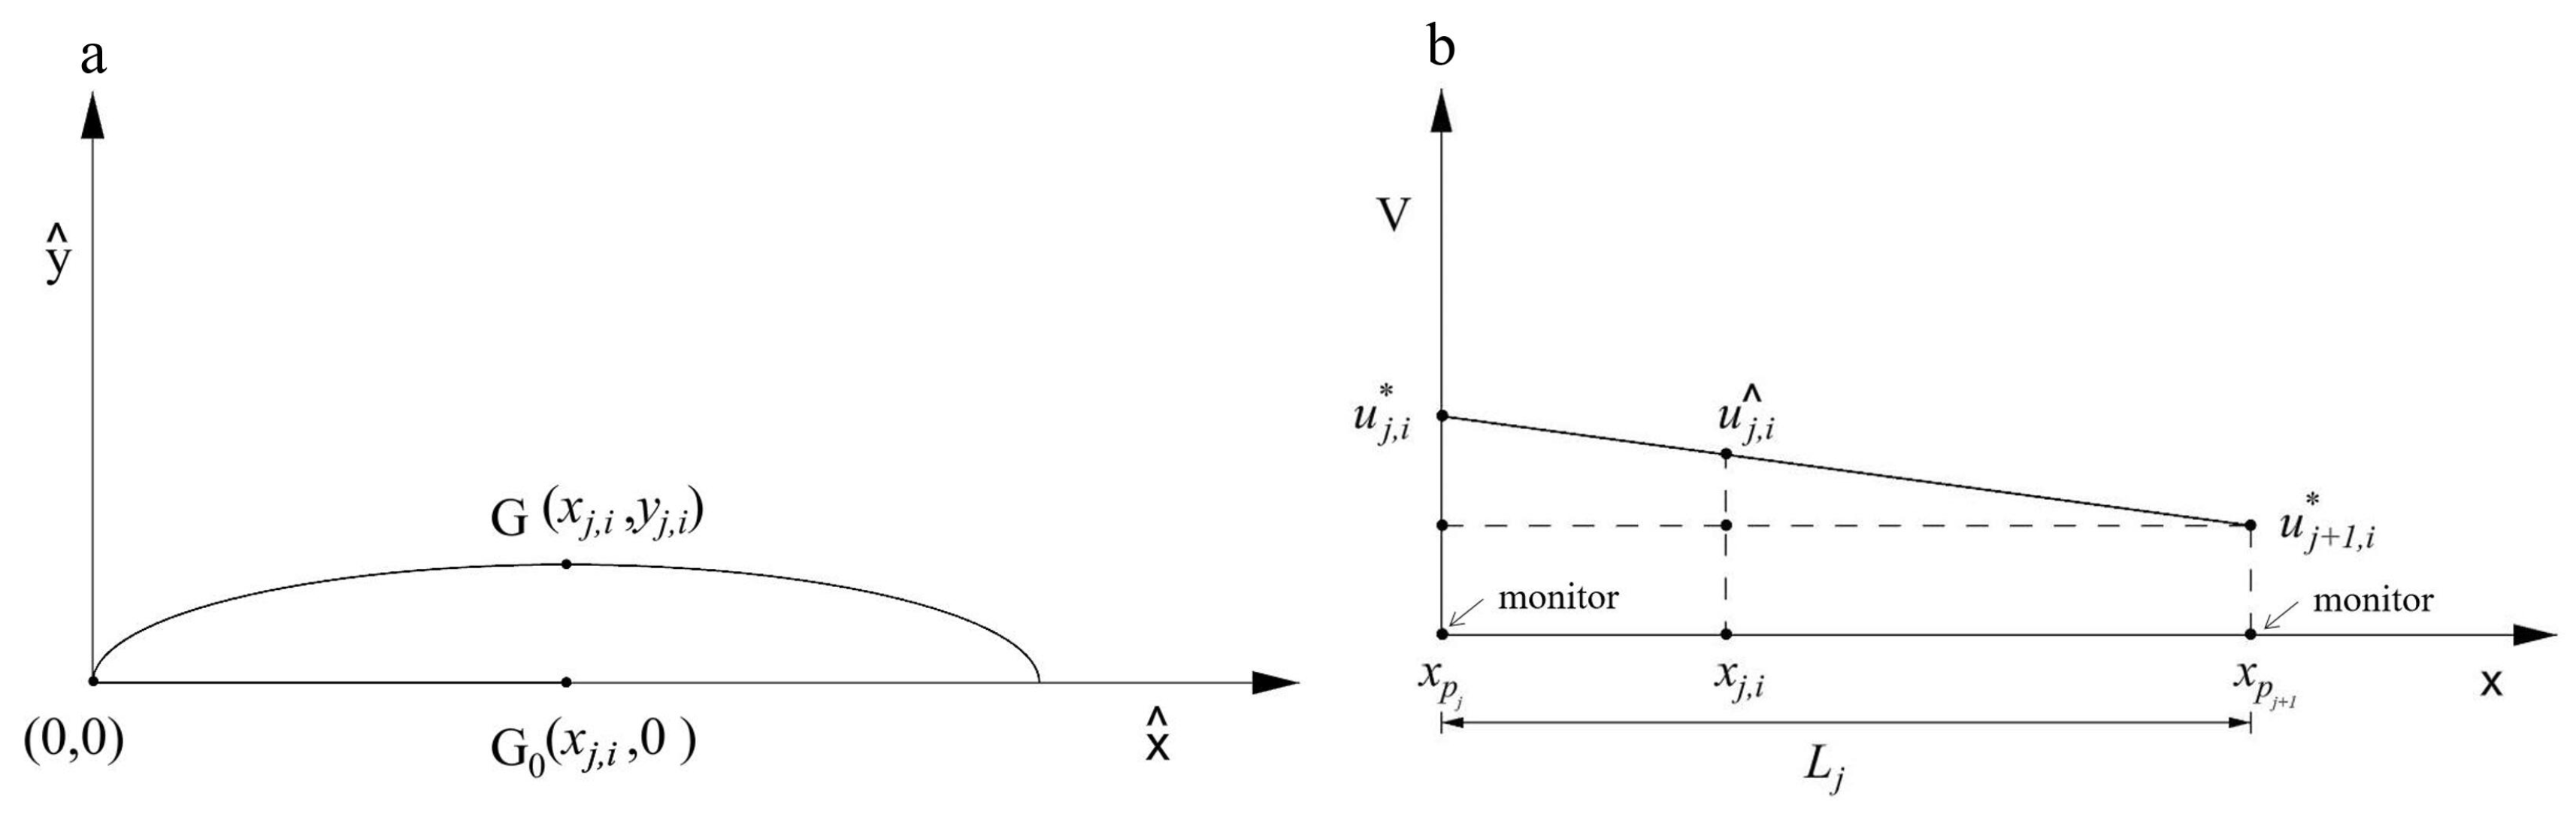
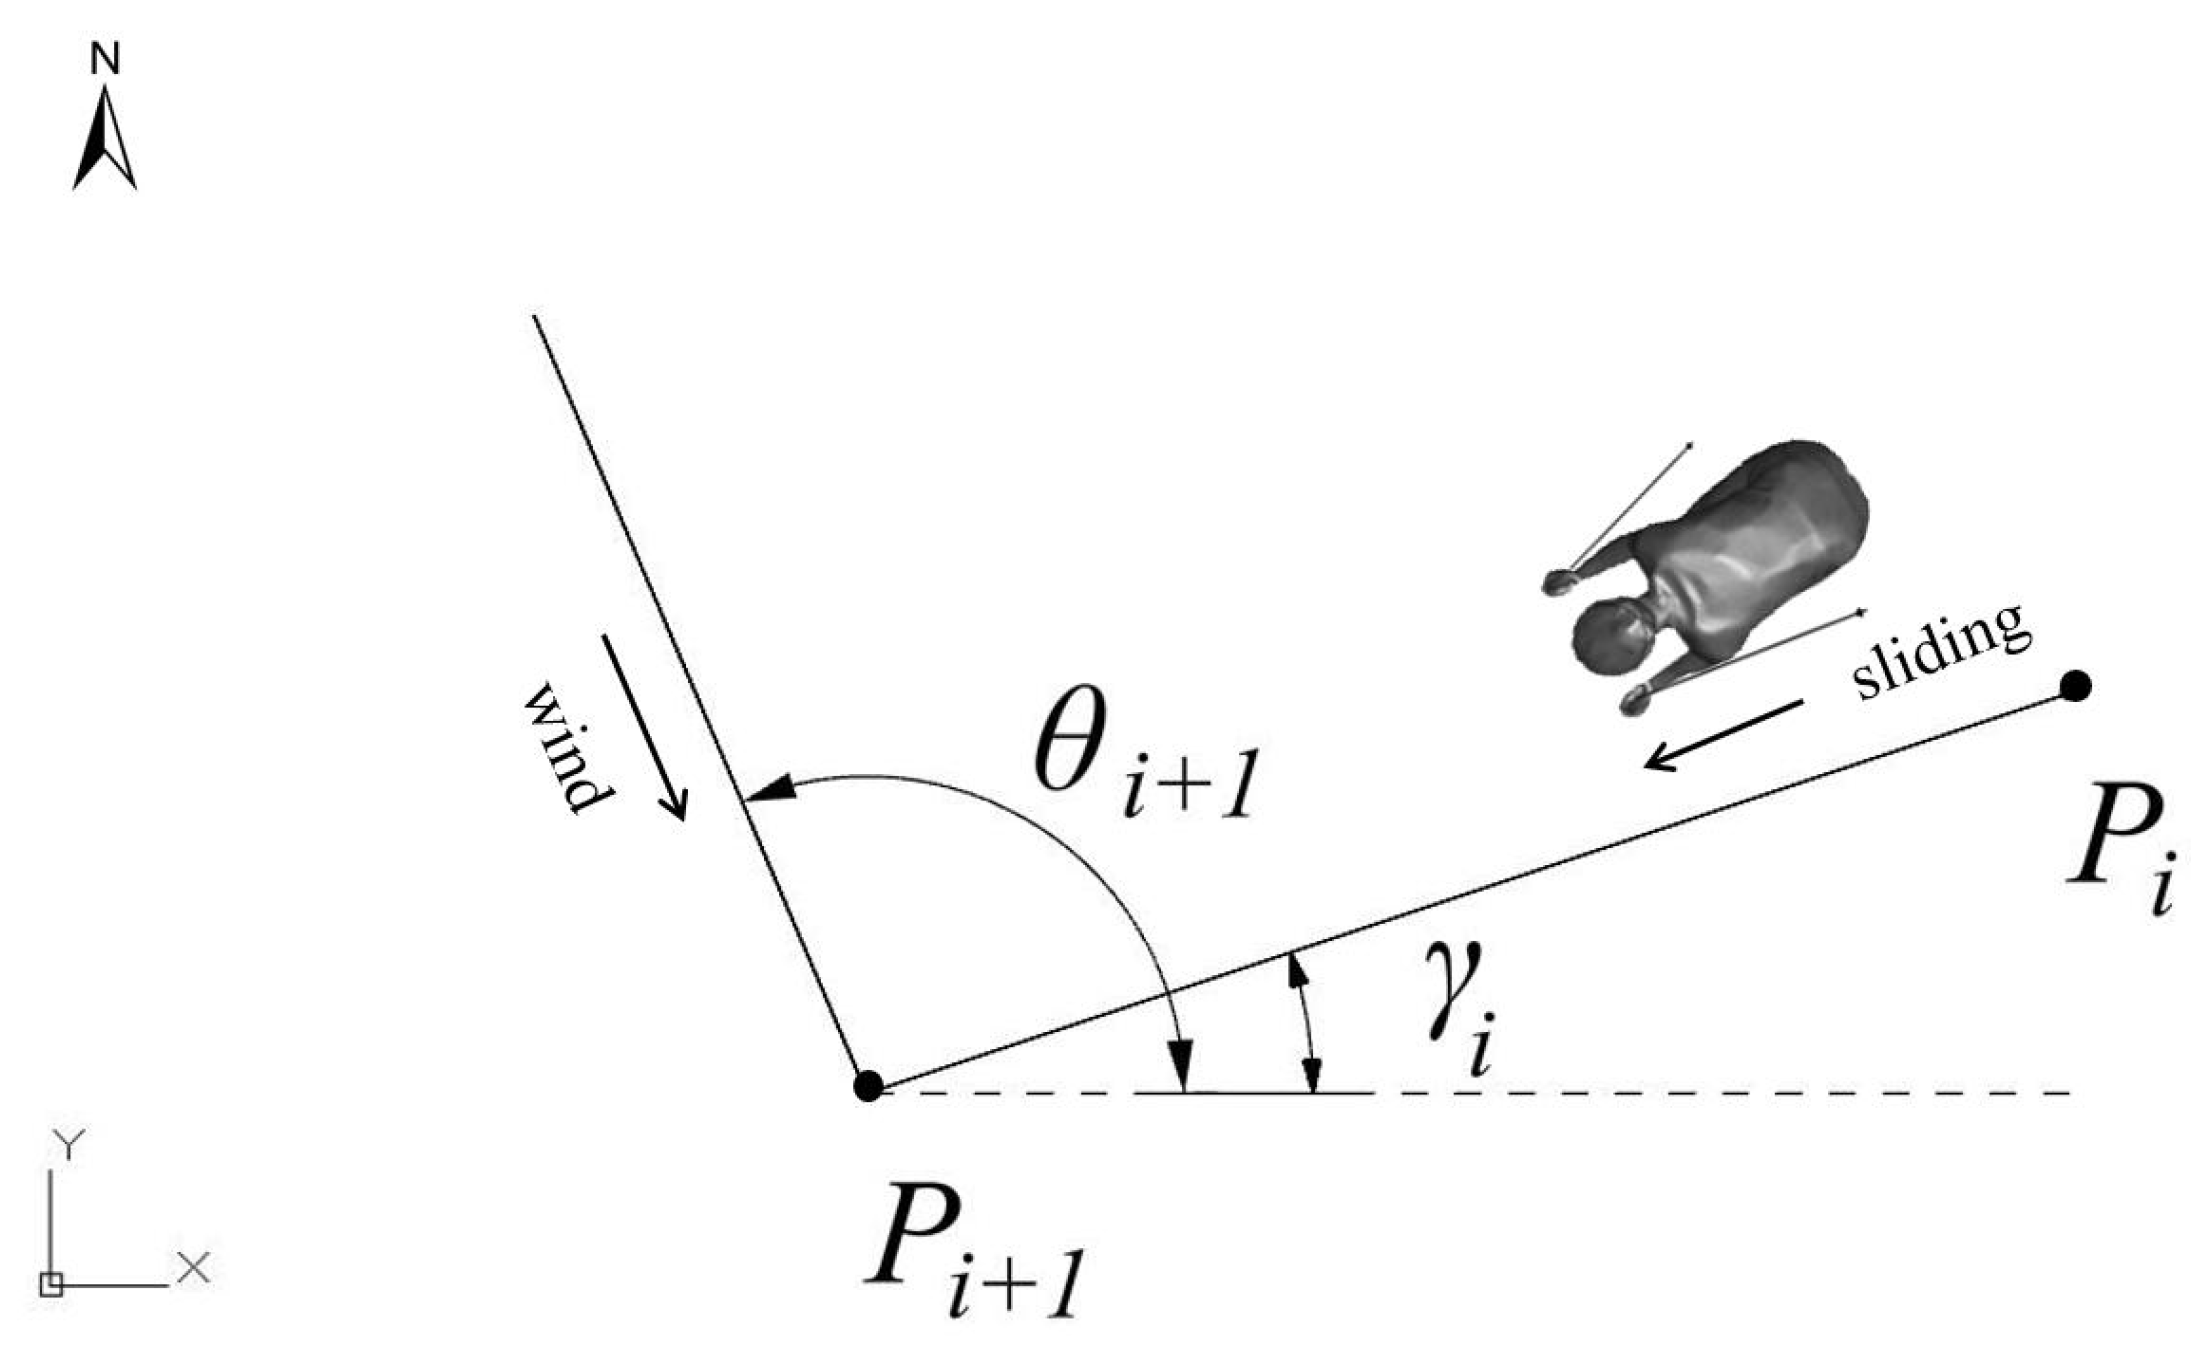
3. Racetrack Wind Field Model

To master the influence of the ski field wind on the athlete’s sliding, it is necessary to obtain the field wind parameters of the ski racetrack, such as the wind speed and wind direction. Field wind information can be collected in real time by installing several anemometers near the ski racetrack, and the field wind information of the racetrack location outside the anemometer needs to be calculated by establishing a ski field racetrack wind model. The racetrack wind field model is based on the measured data of several anemometers installed around the racetrack and is a mathematical expression of the field wind parameters for the entire racetrack formed by a mathematical regression calculation.
As shown in Figure 2, anemometers are installed at the starting points of different stages in the entire track, and the position of the anemometer is marked as P j ( j = 1 m ). For the starting and ending points of a certain stage S j , the wind speed and wind direction monitoring values at height h from the ground at the corresponding position are u j , i * , u j + 1 , i * , θ j , i , θ j + 1 , i . As shown in Figure 3a, at the position of the curved stage, the wind speed u j , i at point G 0 ( x j , i , y 0 ) of the ski field racetrack coordinate system is approximately equal to the wind speed u j , i at point G ( x j , i , y j , i ) of the geographic coordinate system. As shown in Figure 3b, at time i , the triangular similarity relationship between wind speed u j , i ^ at the athlete’s position x j , i ( x j , i [ x p j , x p j + 1 ] ) in S j stage and the wind speed u j , i * , u j + 1 , i * at the monitoring point positions x p j , x p j + 1 is as follows:
u j , i * u j + 1 , i * L j = u j , i ^ u j + 1 * x p j + 1 x j , i
In the formula, L j is the linear distance ( L j = x p j + 1 x p j ) between the start point and the end point of the two anemometer positions in stage S j . Formula (15) is rearranged. The wind speed at different positions in the ski field racetrack coordinate system is as follows:
u j , i ^ = u j , i u j + 1 , i x p j + 1 x j , i x p j + 1 x p j + u j + 1
According to the wind speed relationship between point G 0 of the ski field racetrack coordinate system and point G of the geographic coordinate system in Figure 3a, the wind speed at different positions near ground h in the stage is expressed as follows:
u j , i = u j , i * u j + 1 , i * x P j + 1 x j , i x P j + 1 x P j + u j + 1 *
The wind direction of the racetrack wind field model is obtained using the same mathematical method as in Figure 3a. The wind direction at different positions near the ground h in the stage can be expressed as follows:
θ j , i = θ j , i * θ j + 1 , i * x P j + 1 x j , i x P j + 1 x P j + θ j + 1 *
The same method is used to establish the racetrack wind field model of other stages and to obtain the wind environment information at any position in the entire track.

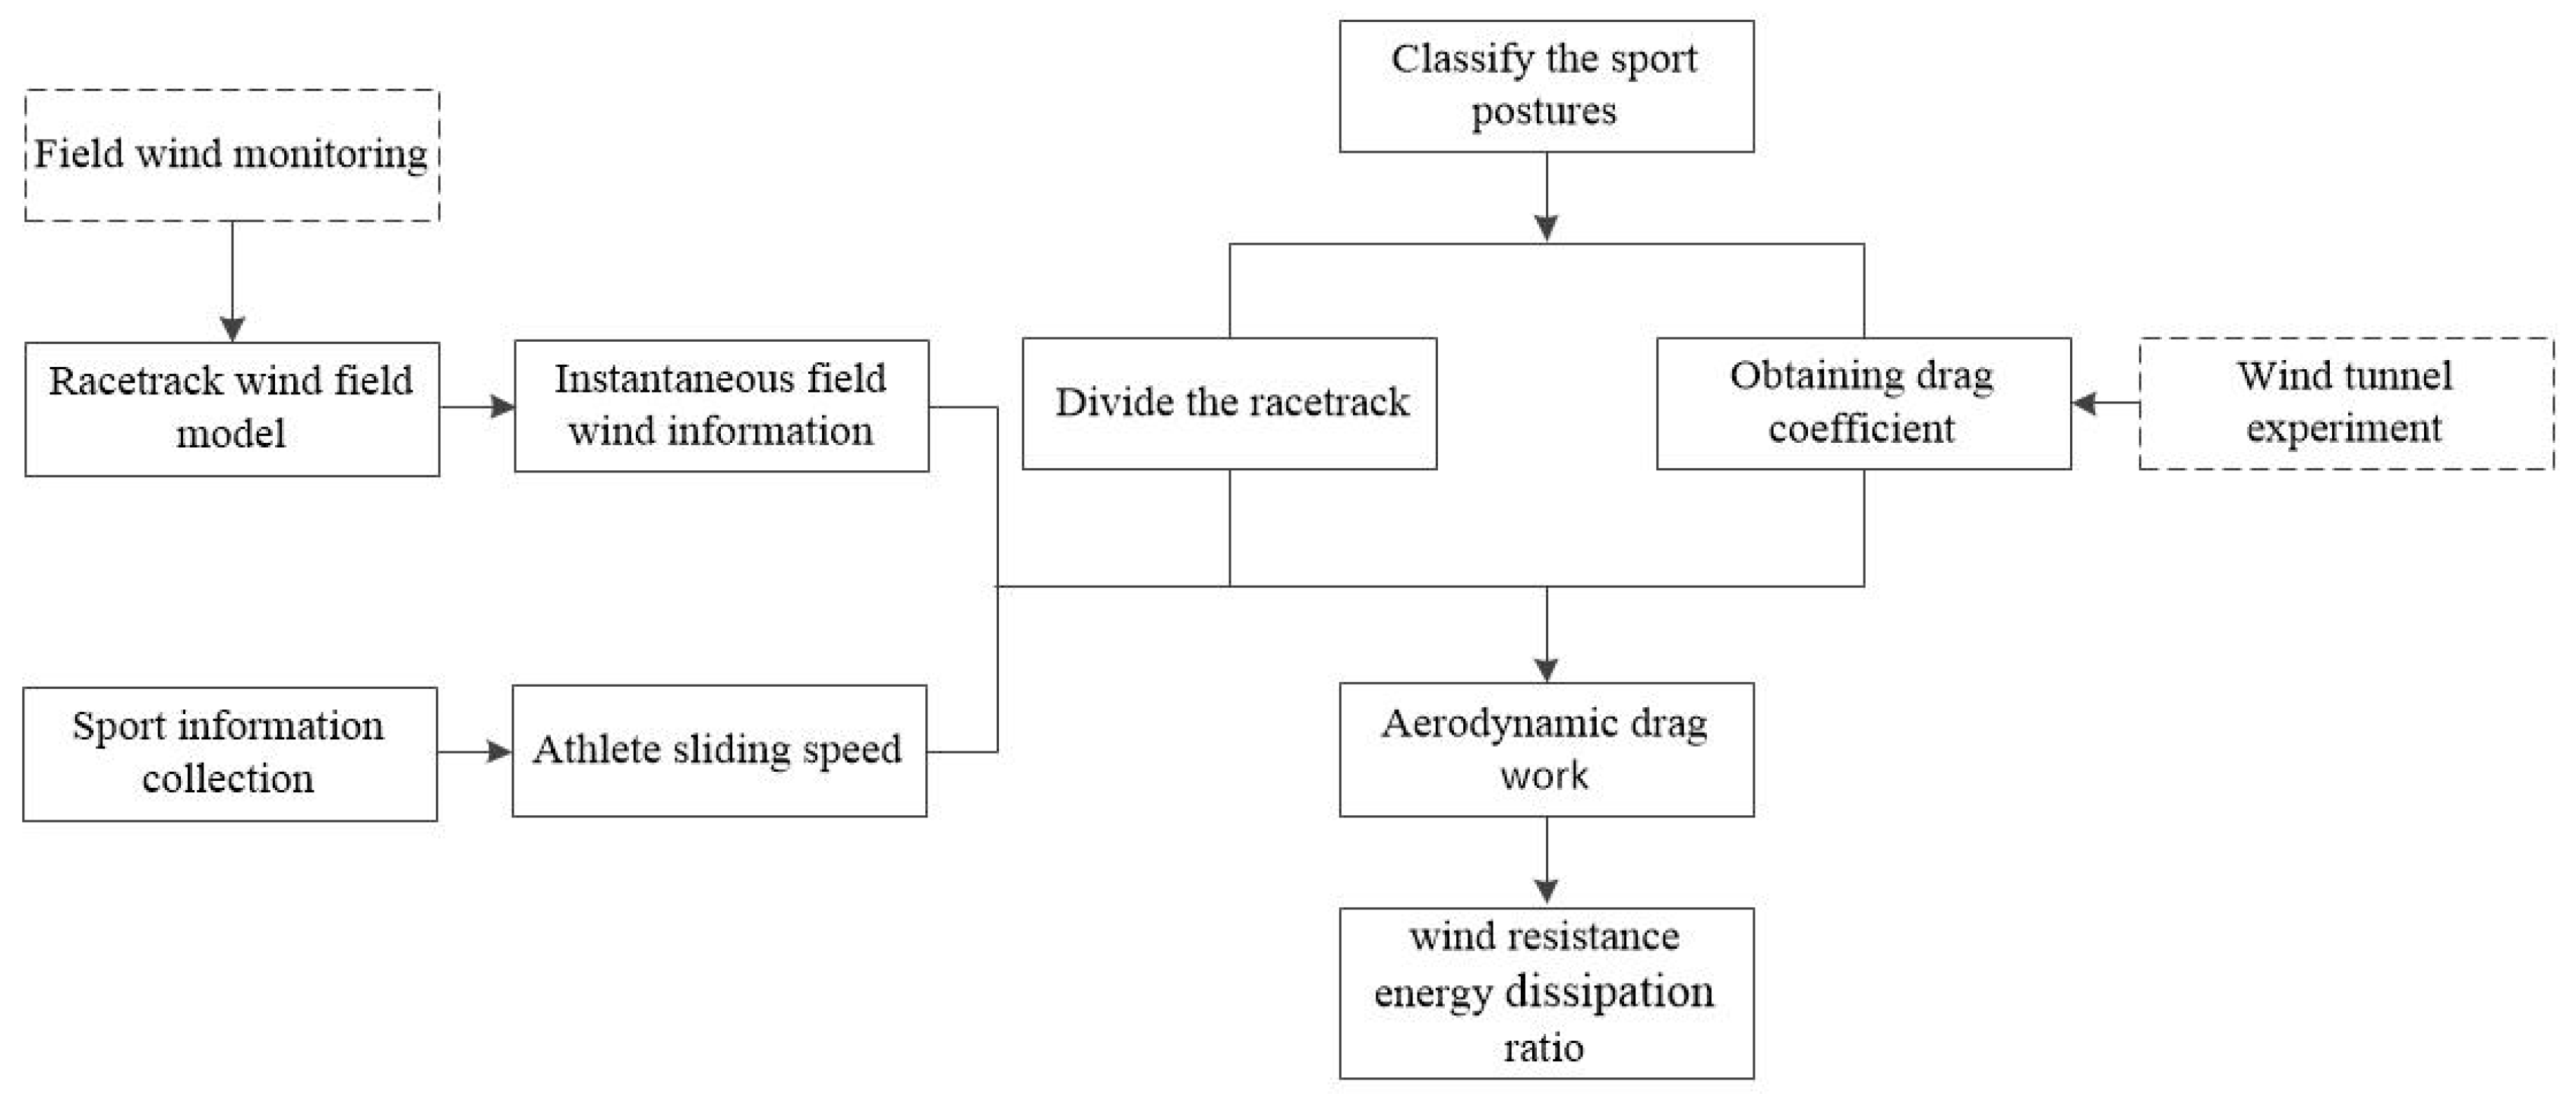
4. The Process of Evaluating the Overcoming Wind Resistance Energy Dissipation

The model of wind resistance energy dissipation expresses the aerodynamic-drag-work to athletes in a mathematical way, which reflects the restriction of the external field wind and relative wind speed on sport. It is an effective method to analyse the influence of the field wind on athlete performance, and the specific steps of wind resistance energy dissipation assessment are as follows:
  • Classify the typical sport postures of a certain athlete in a lap on the racetrack, and divide the entire racetrack into m stages according to the different ski sport postures, with the sport posture in each stage staying essentially the same.
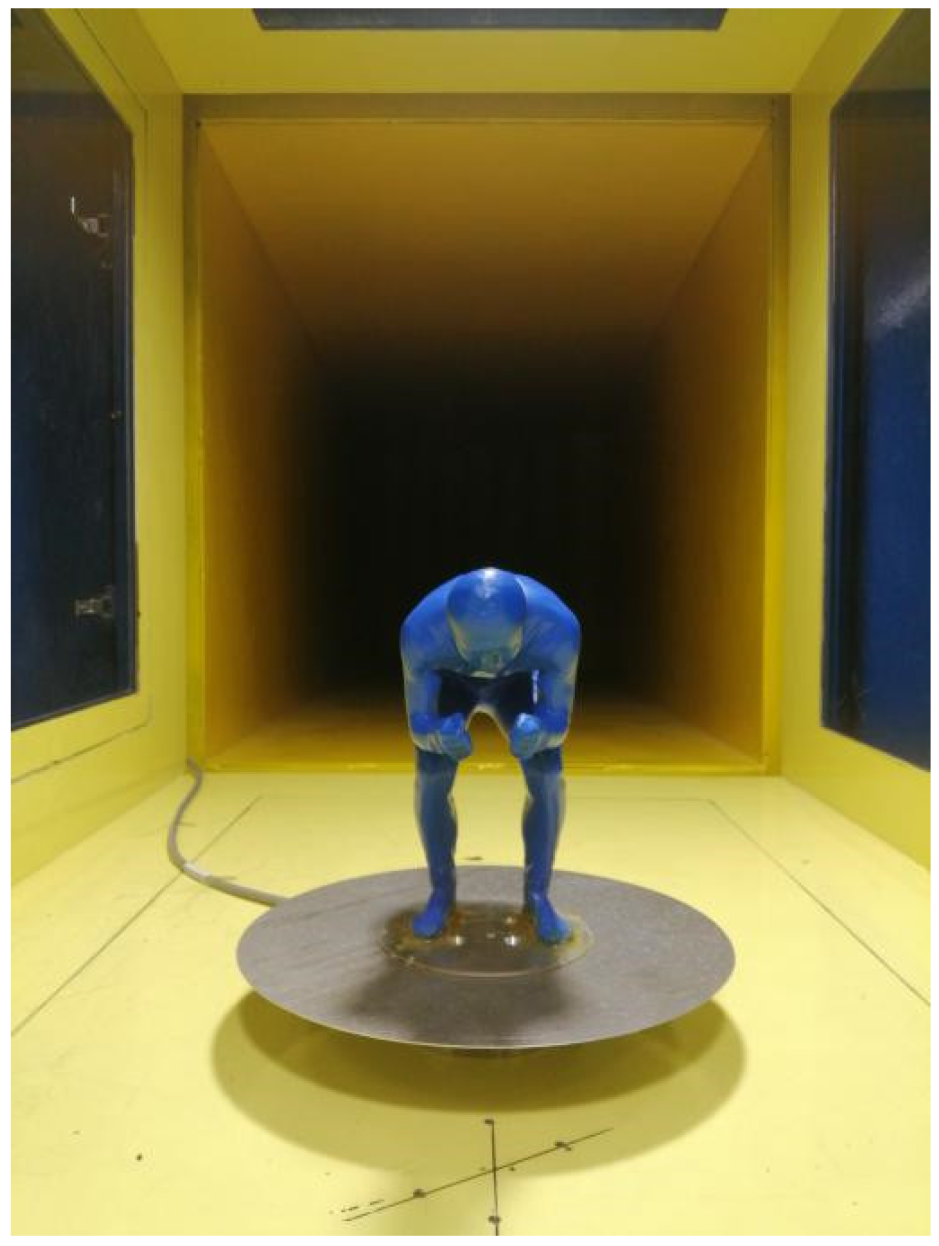
  • According to the different postures of the athletes, the drag coefficient C D j of the typical sport posture is obtained through wind tunnel experiments.
  • According to the real-time monitoring data of anemometers at multiple locations of the racetrack, the instantaneous wind speed u i + 1 and wind direction θ i + 1 at different locations of the track are obtained using the racetrack wind field model.
  • According to the athlete’s sliding speed V i collected on site during the sliding, combined with the above parameters, Formulas (6) and (7) are used to calculate the athlete’s aerodynamic-drag-work W a e r o j and W a e r o during sliding.
  • According to Formulas (9)–(14), the athlete’s wind resistance energy dissipation ratio is calculated, and the influence of the field wind environment on the athlete’s achievement is then evaluated.
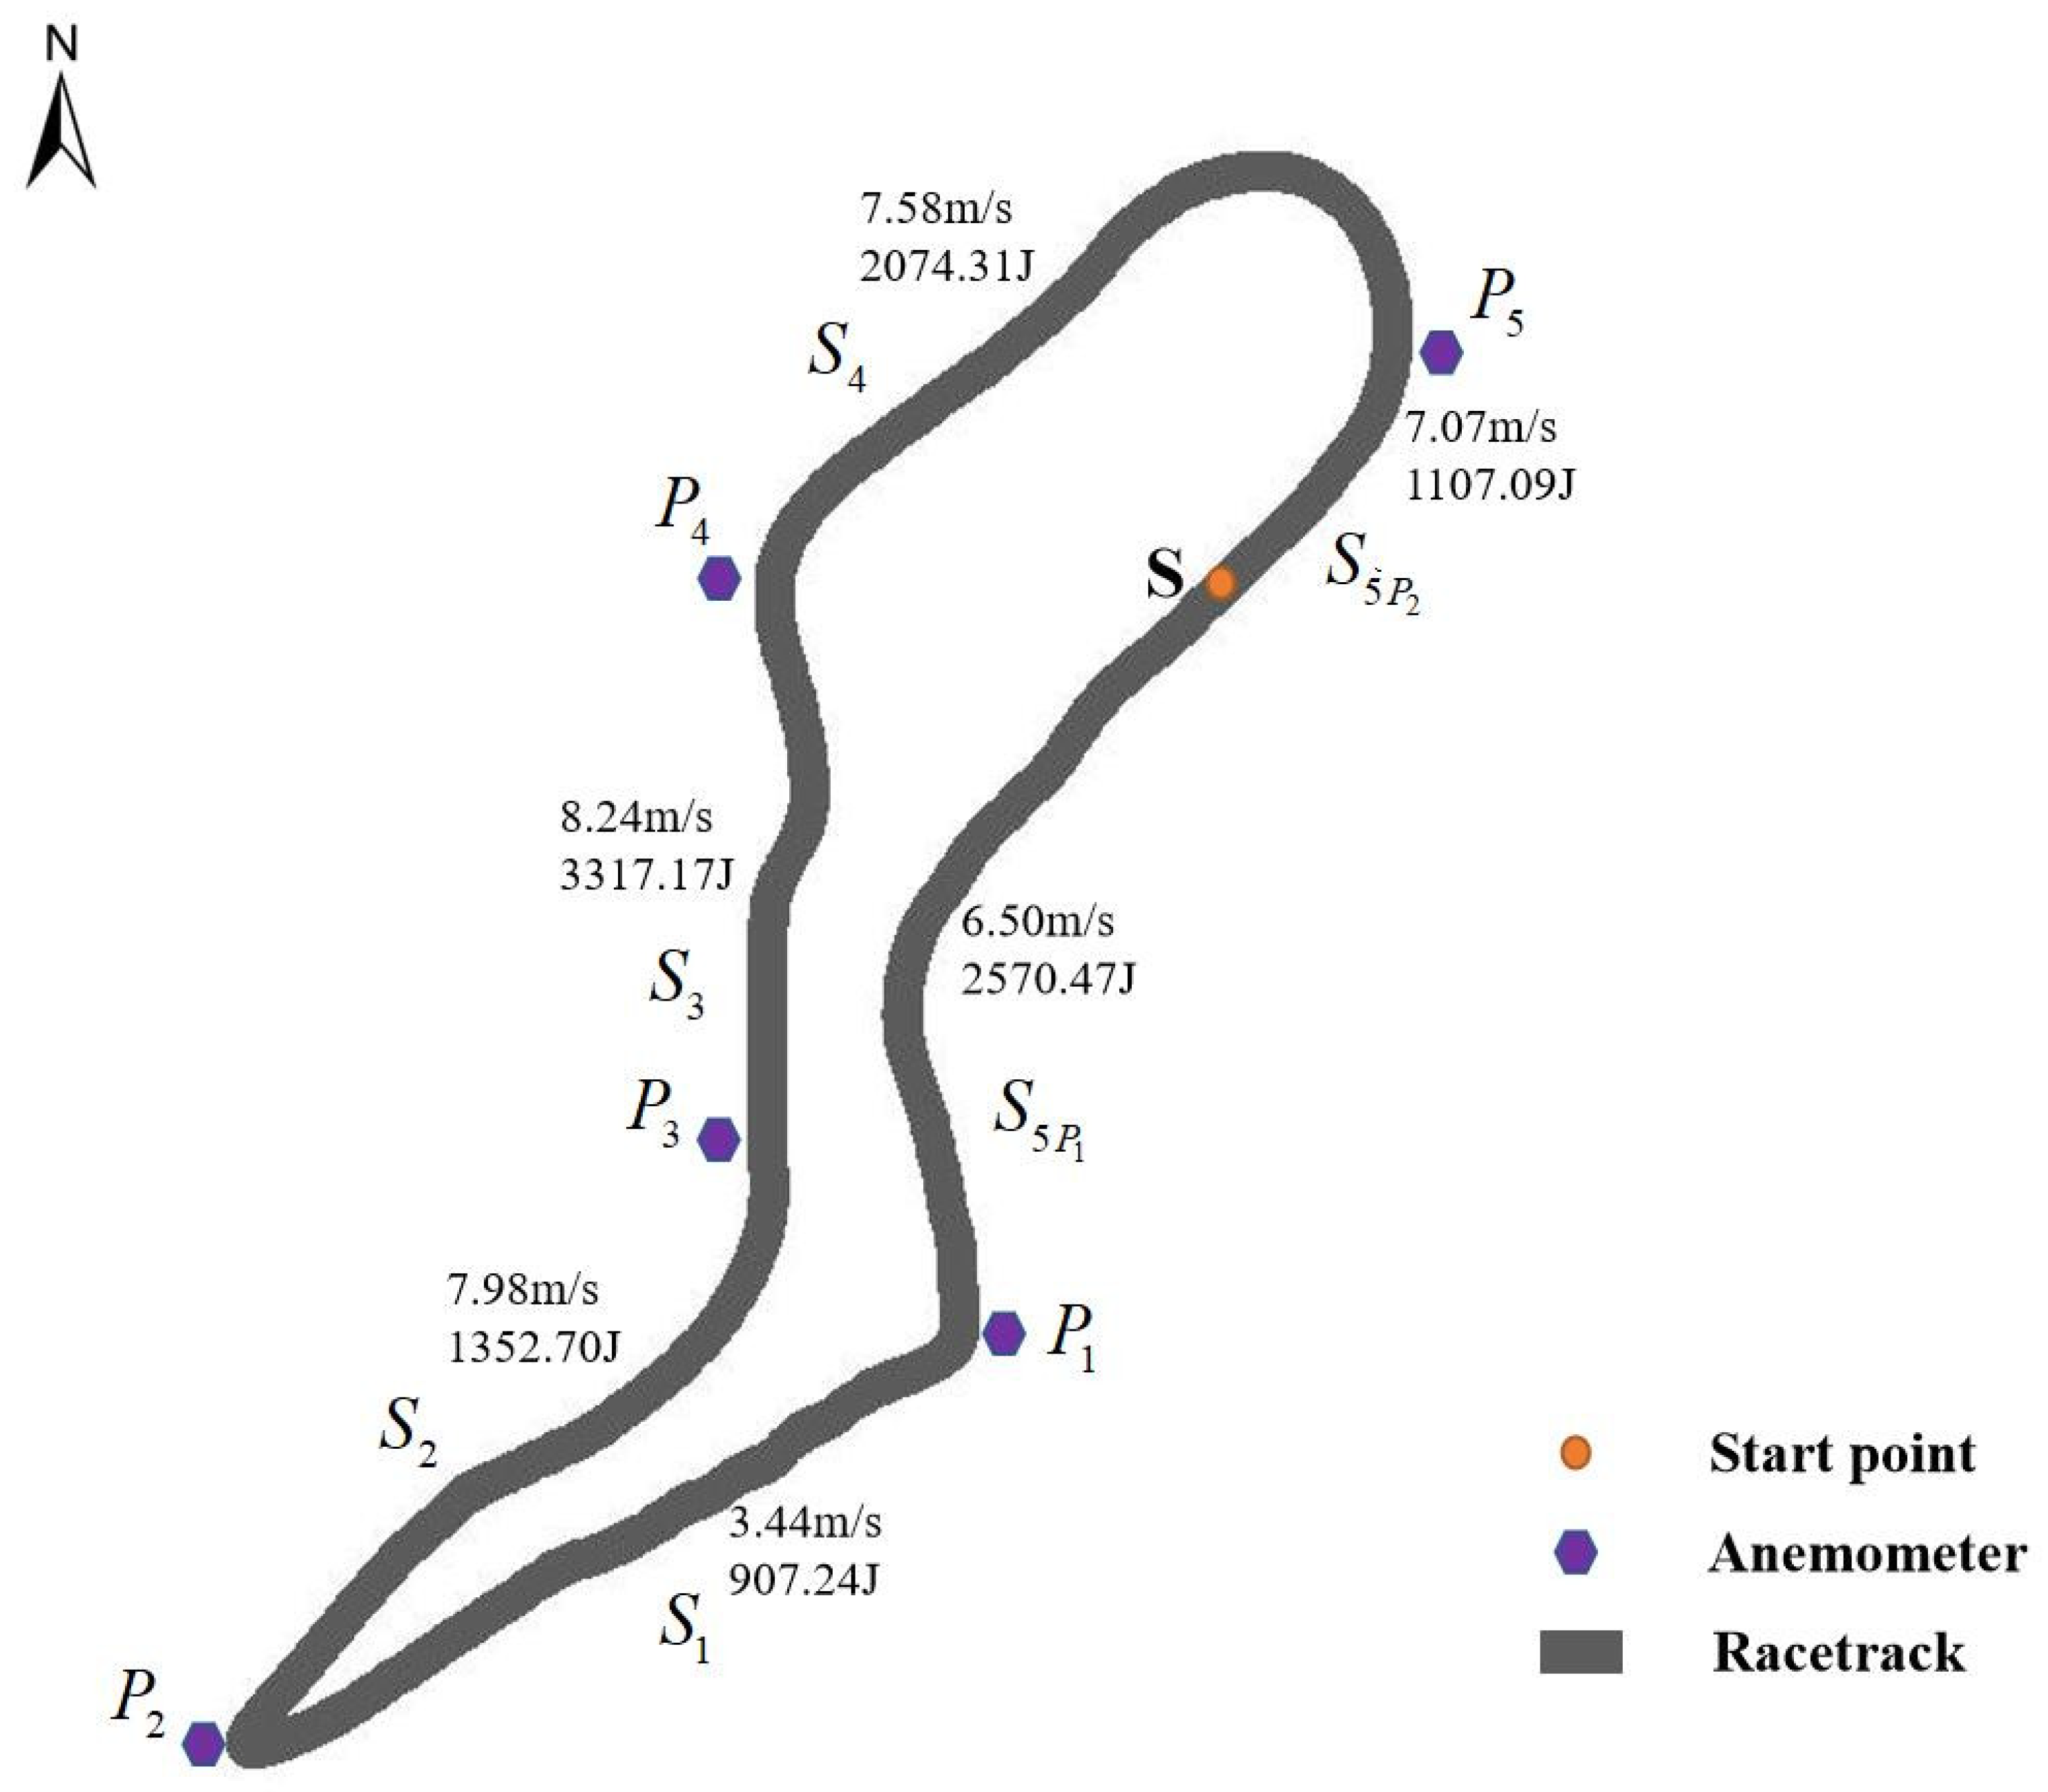
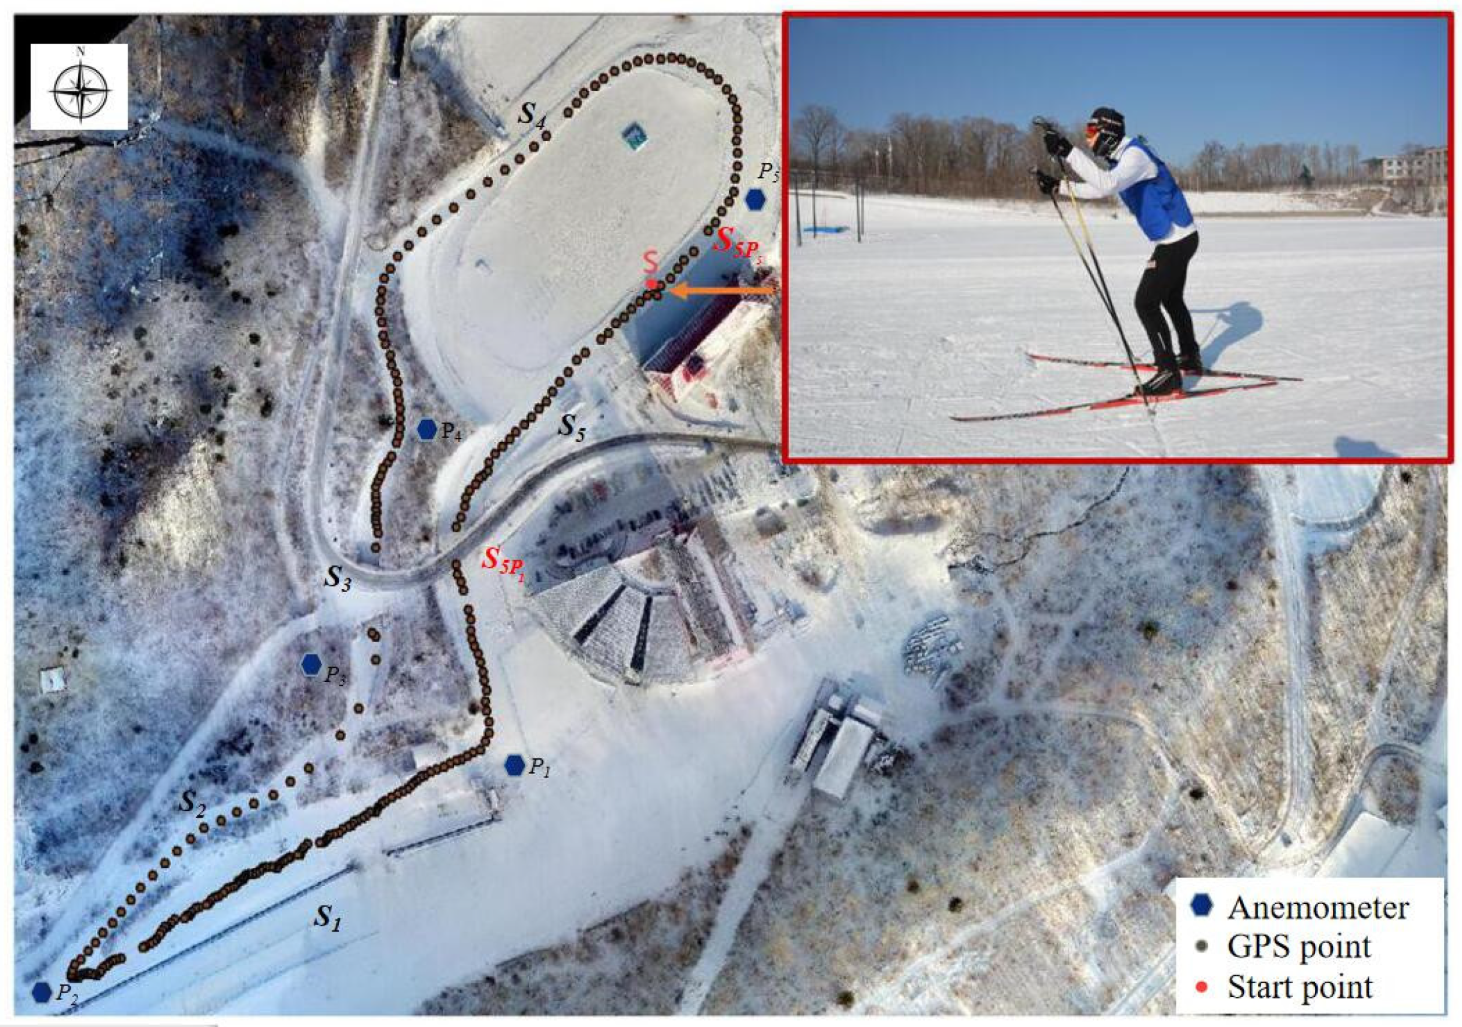
The above steps can be expressed as a flowchart, as shown in Figure 4.

5. Application Case

5.1. Sport Scene and Test System

The Yabuli Ski Field is located in Yabuli Town, Shangzhi City, Heilongjiang Province, with a total length of 1.2 km. The test subject is Athlete A, Athlete A is a male, aged 17 years, is 178 cm in height and weighs 62 kg. The racetrack and athletes are shown in Figure 5.
As shown in Figure 5, the Yabuli Ski Field racetrack is divided into five stages: S 1 stage is uphill, S 2 stage is downhill, S 3 stage is undulating (including uphill and downhill), S 4 stage is a gentle downhill, and S 5 stage is flat. According to the cross-country skiing instructor’s guidance and the typical freestyle cross-country skiing sport posture, the corresponding skiing posture of each stage was determined. The S 1 stage corresponds to the free uphill sport posture, the S 2 and S 4 stages correspond to the free downhill sport posture, the S 3 stage corresponds to the two-step one support sport posture, and the S 5 stage corresponds to the free flat road sport posture. The four typical cross-country skiing sport postures are shown in Figure 6.
The athlete’s sliding trajectory is shown in Figure 5. The athlete starts from the initial position of point S and returns to this point every lap for one training case. S 5 P 1 is the athlete’s starting stage (the stage between point S and P 1 ) and S 5 P 5 is the athlete’s sliding end stage (the stage between point S and P 5 ). Three training tests were conducted on athlete A on the afternoon of 13 January 2020. The field wind environment information selected the wind speed data of the corresponding period.
Five anemometers were set at the critical points of the racetrack. The British GILL ultrasonic anemometer was selected, with an accuracy of 0.01 m/s and a wind direction resolution of 1°. The Hi-Target Qbox 8 high-precision Beidou magic box was selected for the of the collection athlete’s sport parameters, and the anemometer and GPS collection frequency were uniformly set at 1 Hz.

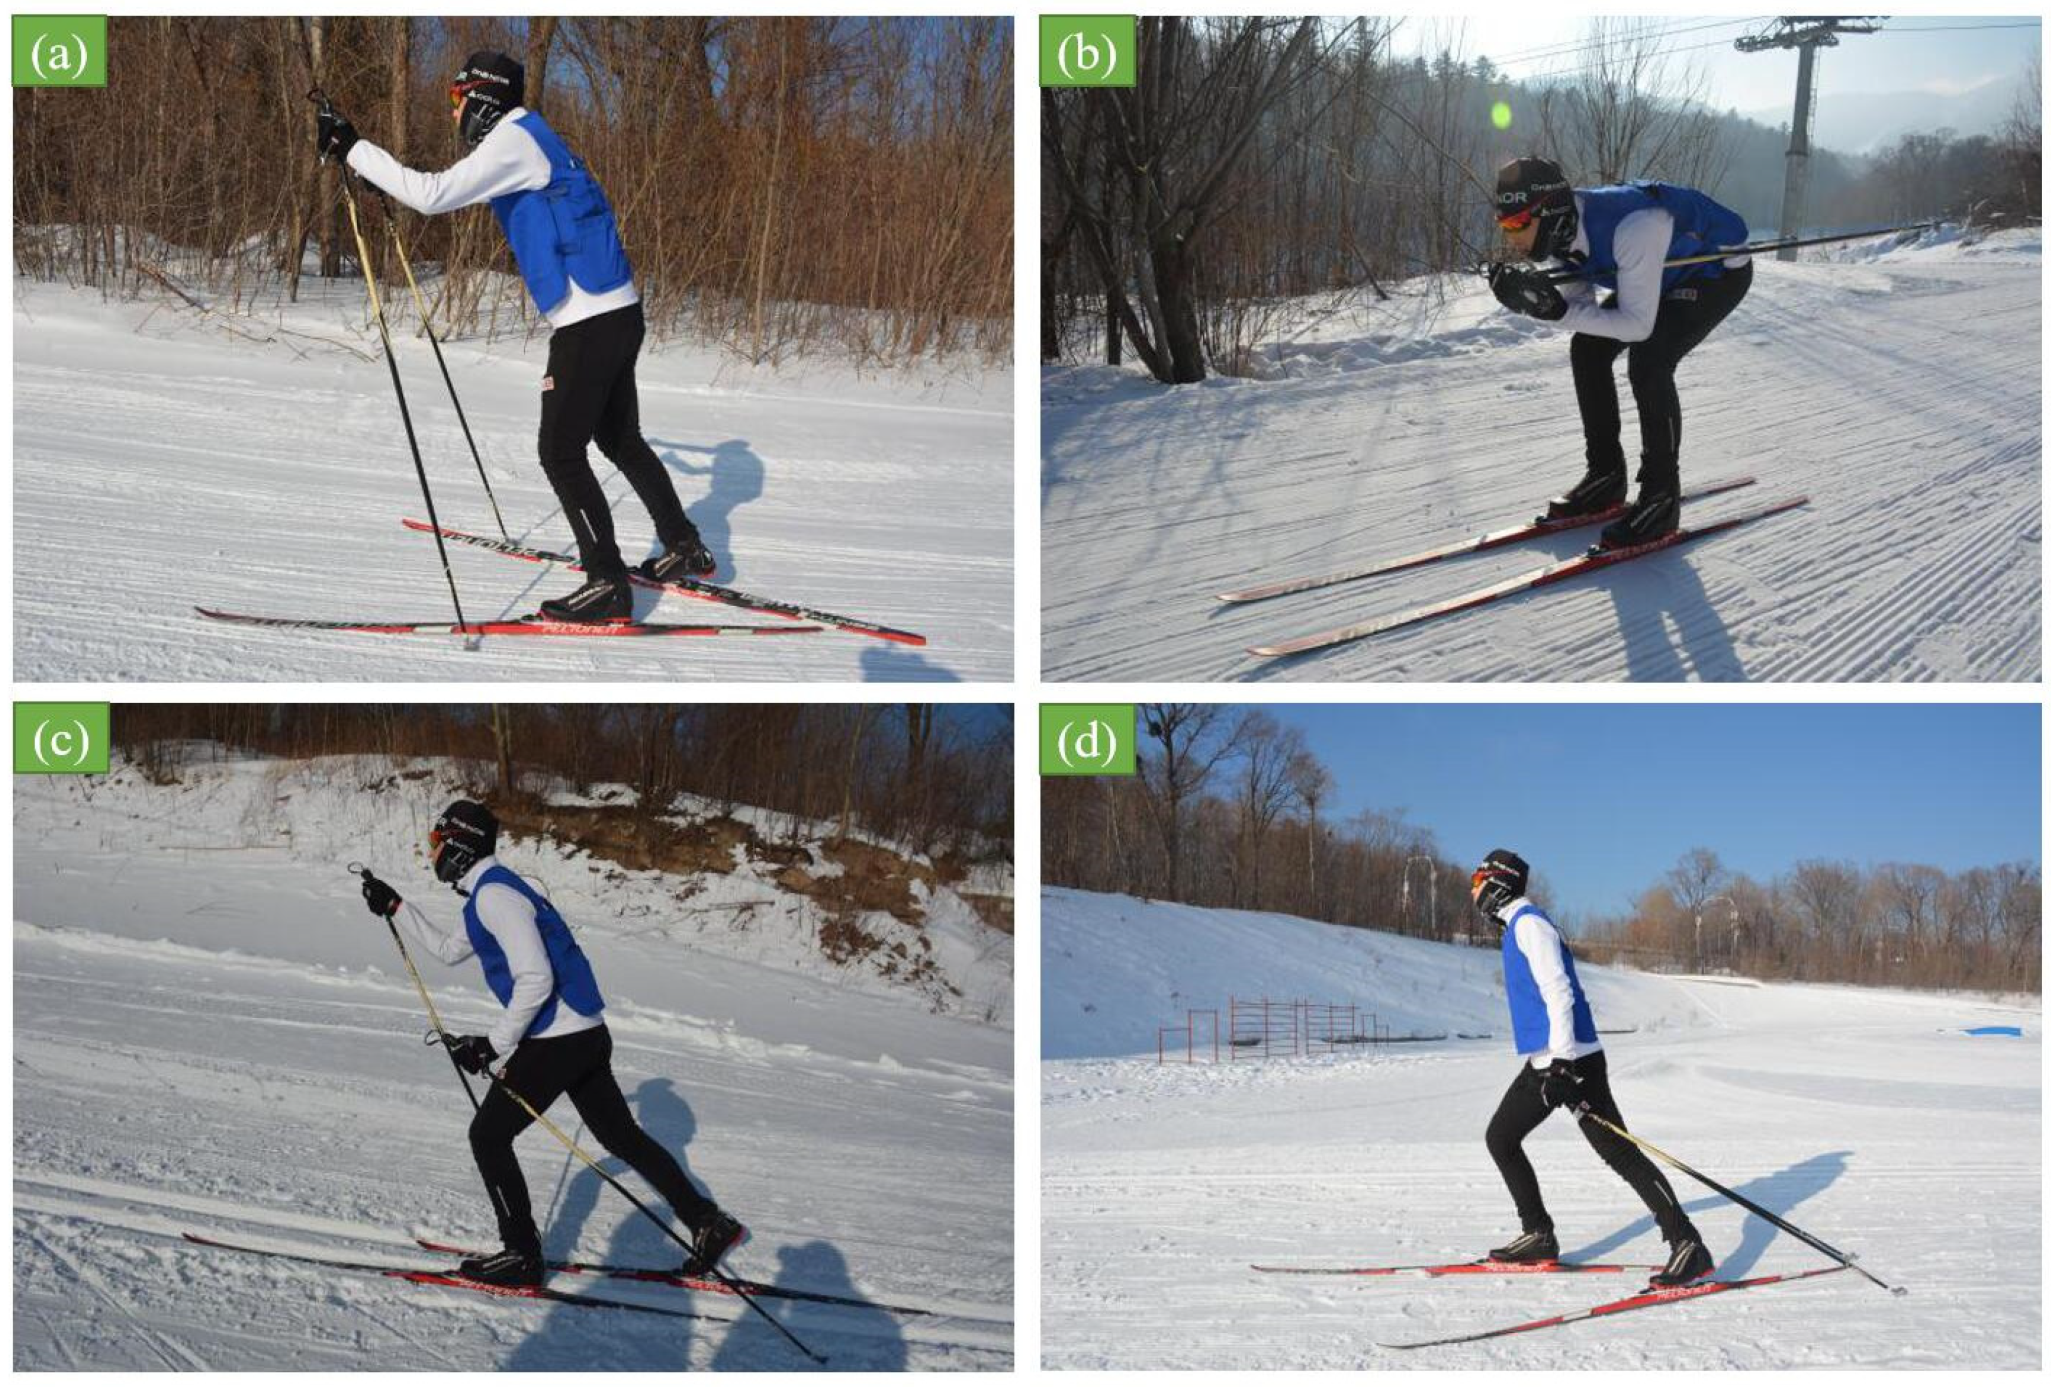
5.2. Experimental Results of Drag Coefficient

According to the athlete’s physical information, such as weight, height, and body shape, a 1:4 scale model of their typical posture was obtained by 3D scanning the athlete’s appearance using 3D printing technology, which was used as a wind tunnel experimental model for drag coefficient testing. The 3D scanning was carried out with a German Anthroscan Bodyscan 3D body scanner, and optical triangulation technology was adopted to obtain the 3D data and texture. The measurement range was 2100 mm (height) × 1000 mm (depth) × 1200 mm (width), and the average maximum girth error was 1 mm.
The drag resistance coefficient experiment of the sport posture was completed in the variable boundary layer wind tunnel laboratory of NEFU; the size of the test section was 5 m (length) × 0.8 m (width) × 1.0 m (height), and the maximum wind speed was 70.5 m/s (continuously adjustable). A force transducer was used to measure the model drag force parallel to the direction of the approaching wind. As shown in Figure 7, the model and force transducer were connected by a circular platform; the platform edge was smooth and sharp to minimize the circumfluence phenomenon when the wind passes through the platform.
Experiments on the drag coefficient were performed at high wind speeds (22 m/s) so that the Reynolds number of the wind tunnel model would be as close as possible to that of an actual athlete. Numerous studies have demonstrated that the Reynolds number has a negligible influence on the scale model, and many researchers have utilized scale models to study the drag coefficient [4,33]. The sampling frequency of the force data was 100 Hz, and the sampling duration was 20 s in the stable phase. The frontal area of the athlete was obtained by extracting the contour line of the athlete’s sport posture. The measurement results of the drag coefficient C D and the frontal area A are shown in Table 1.

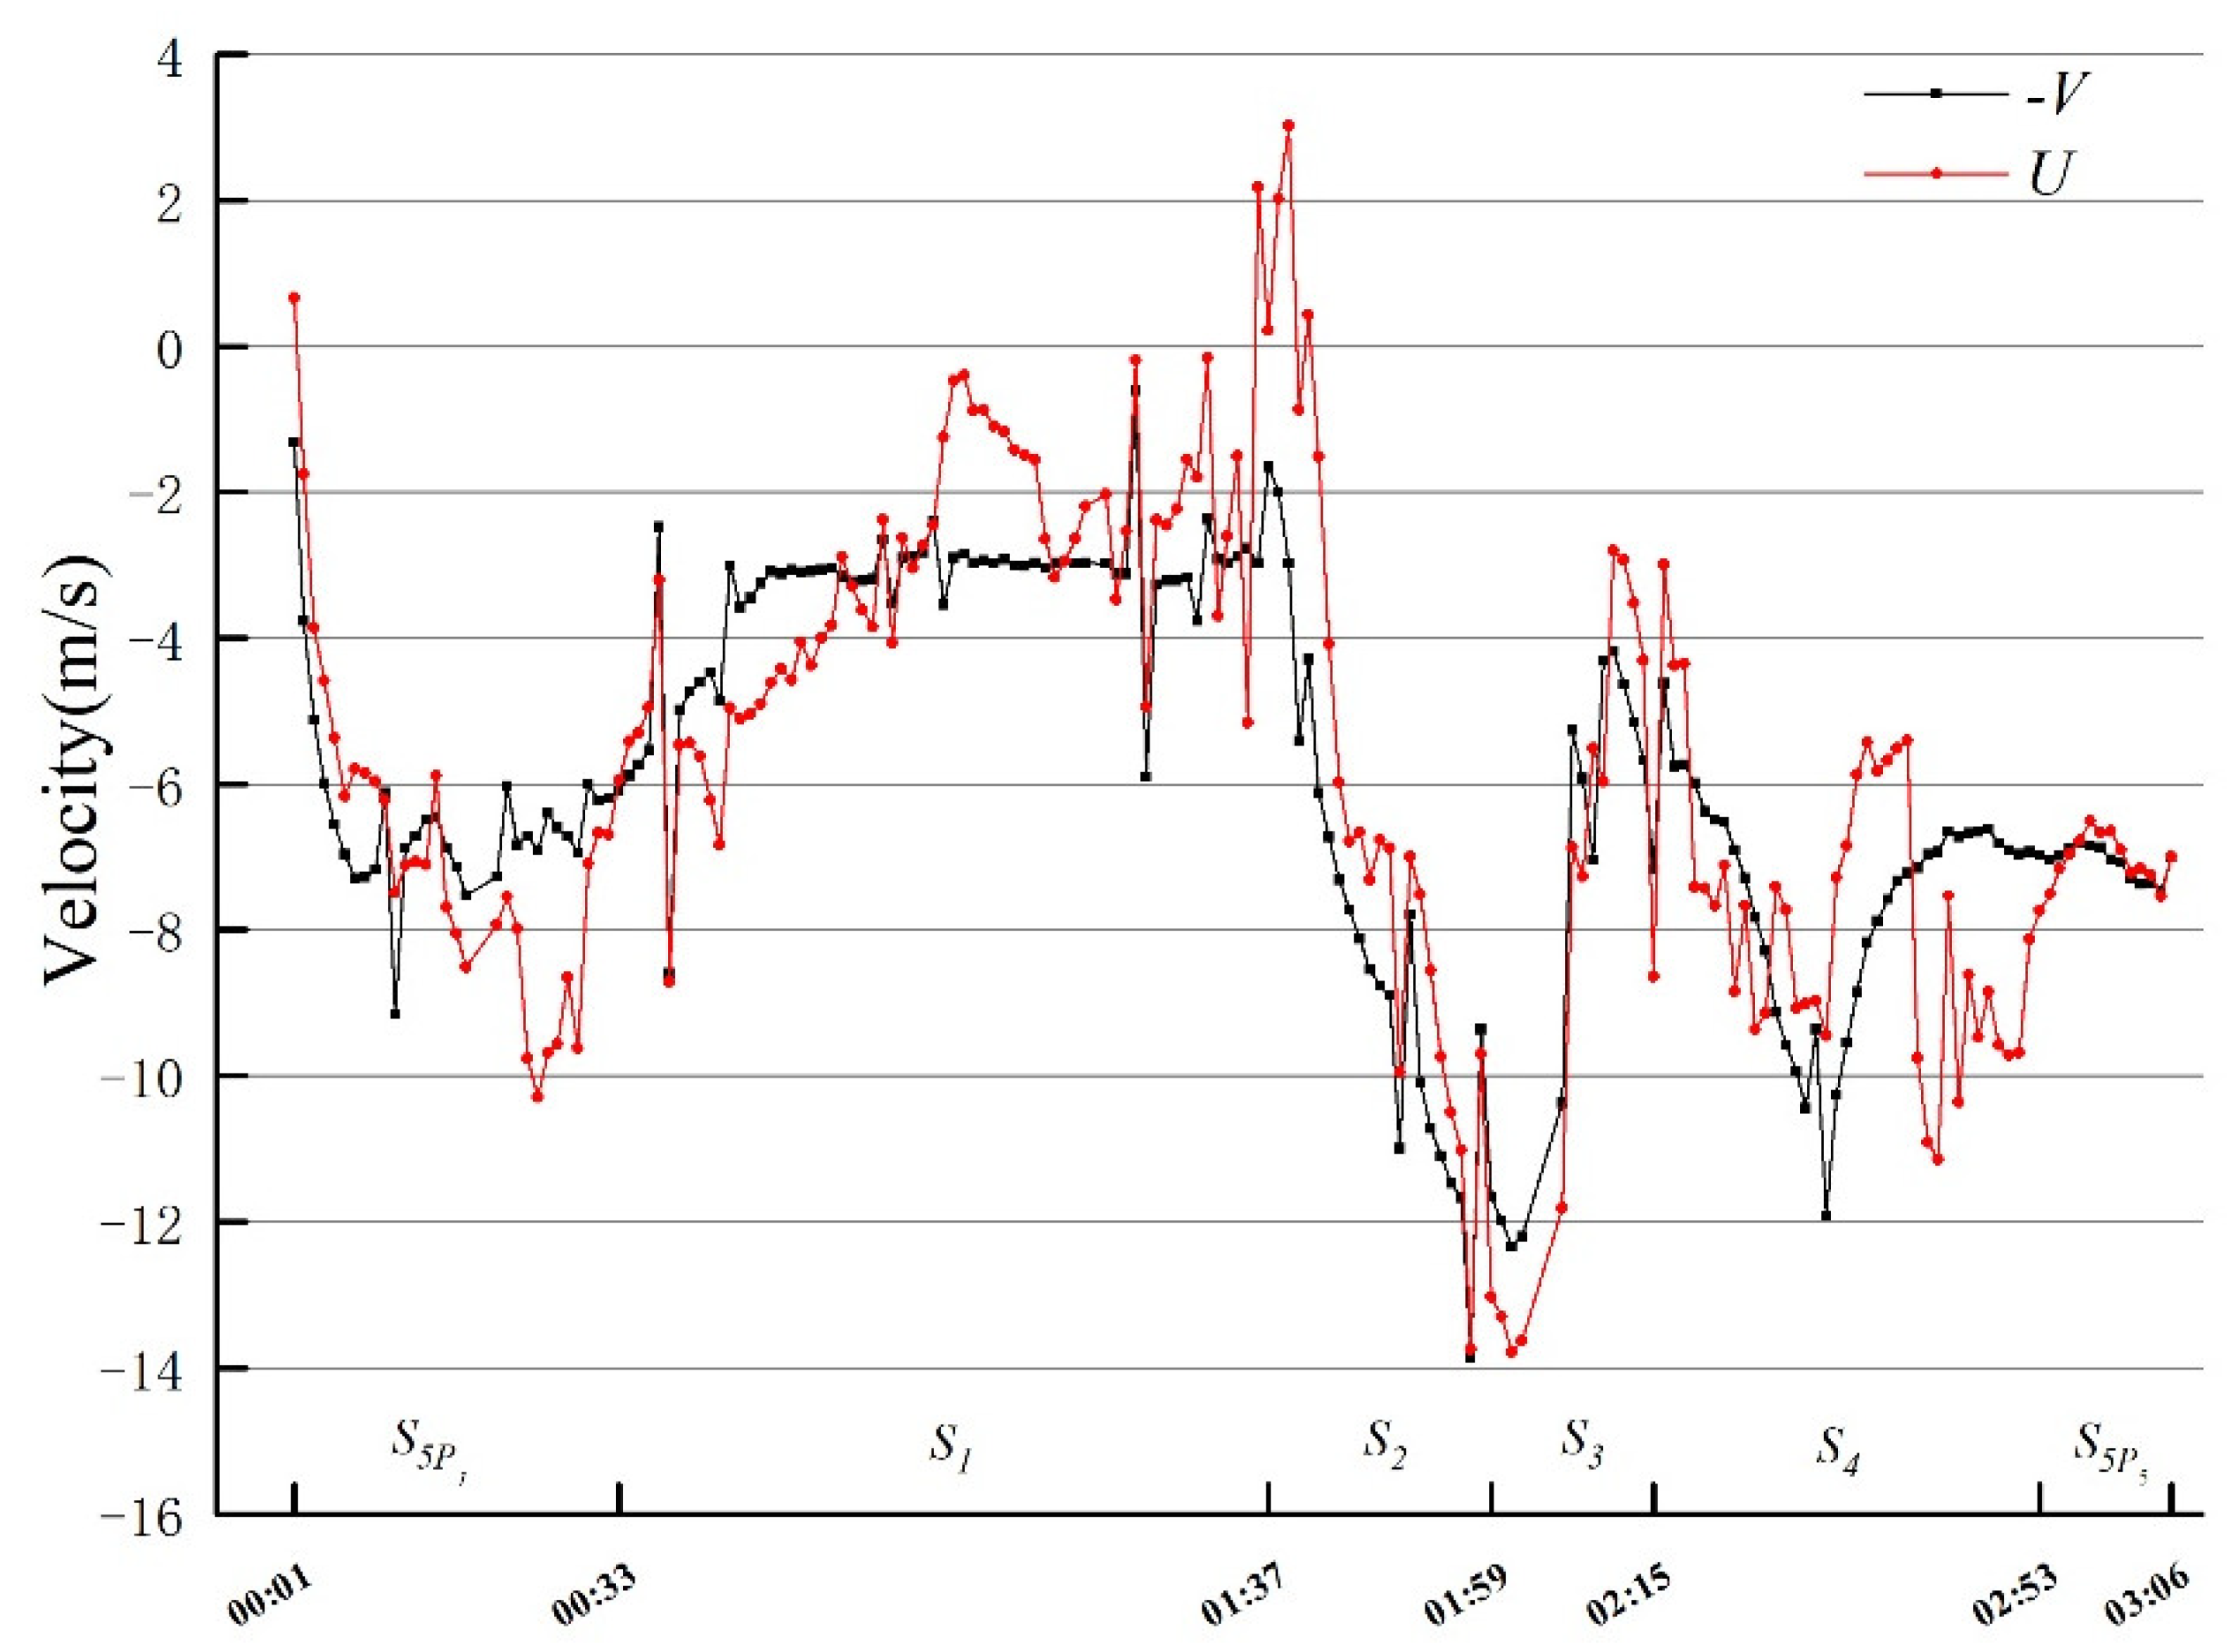
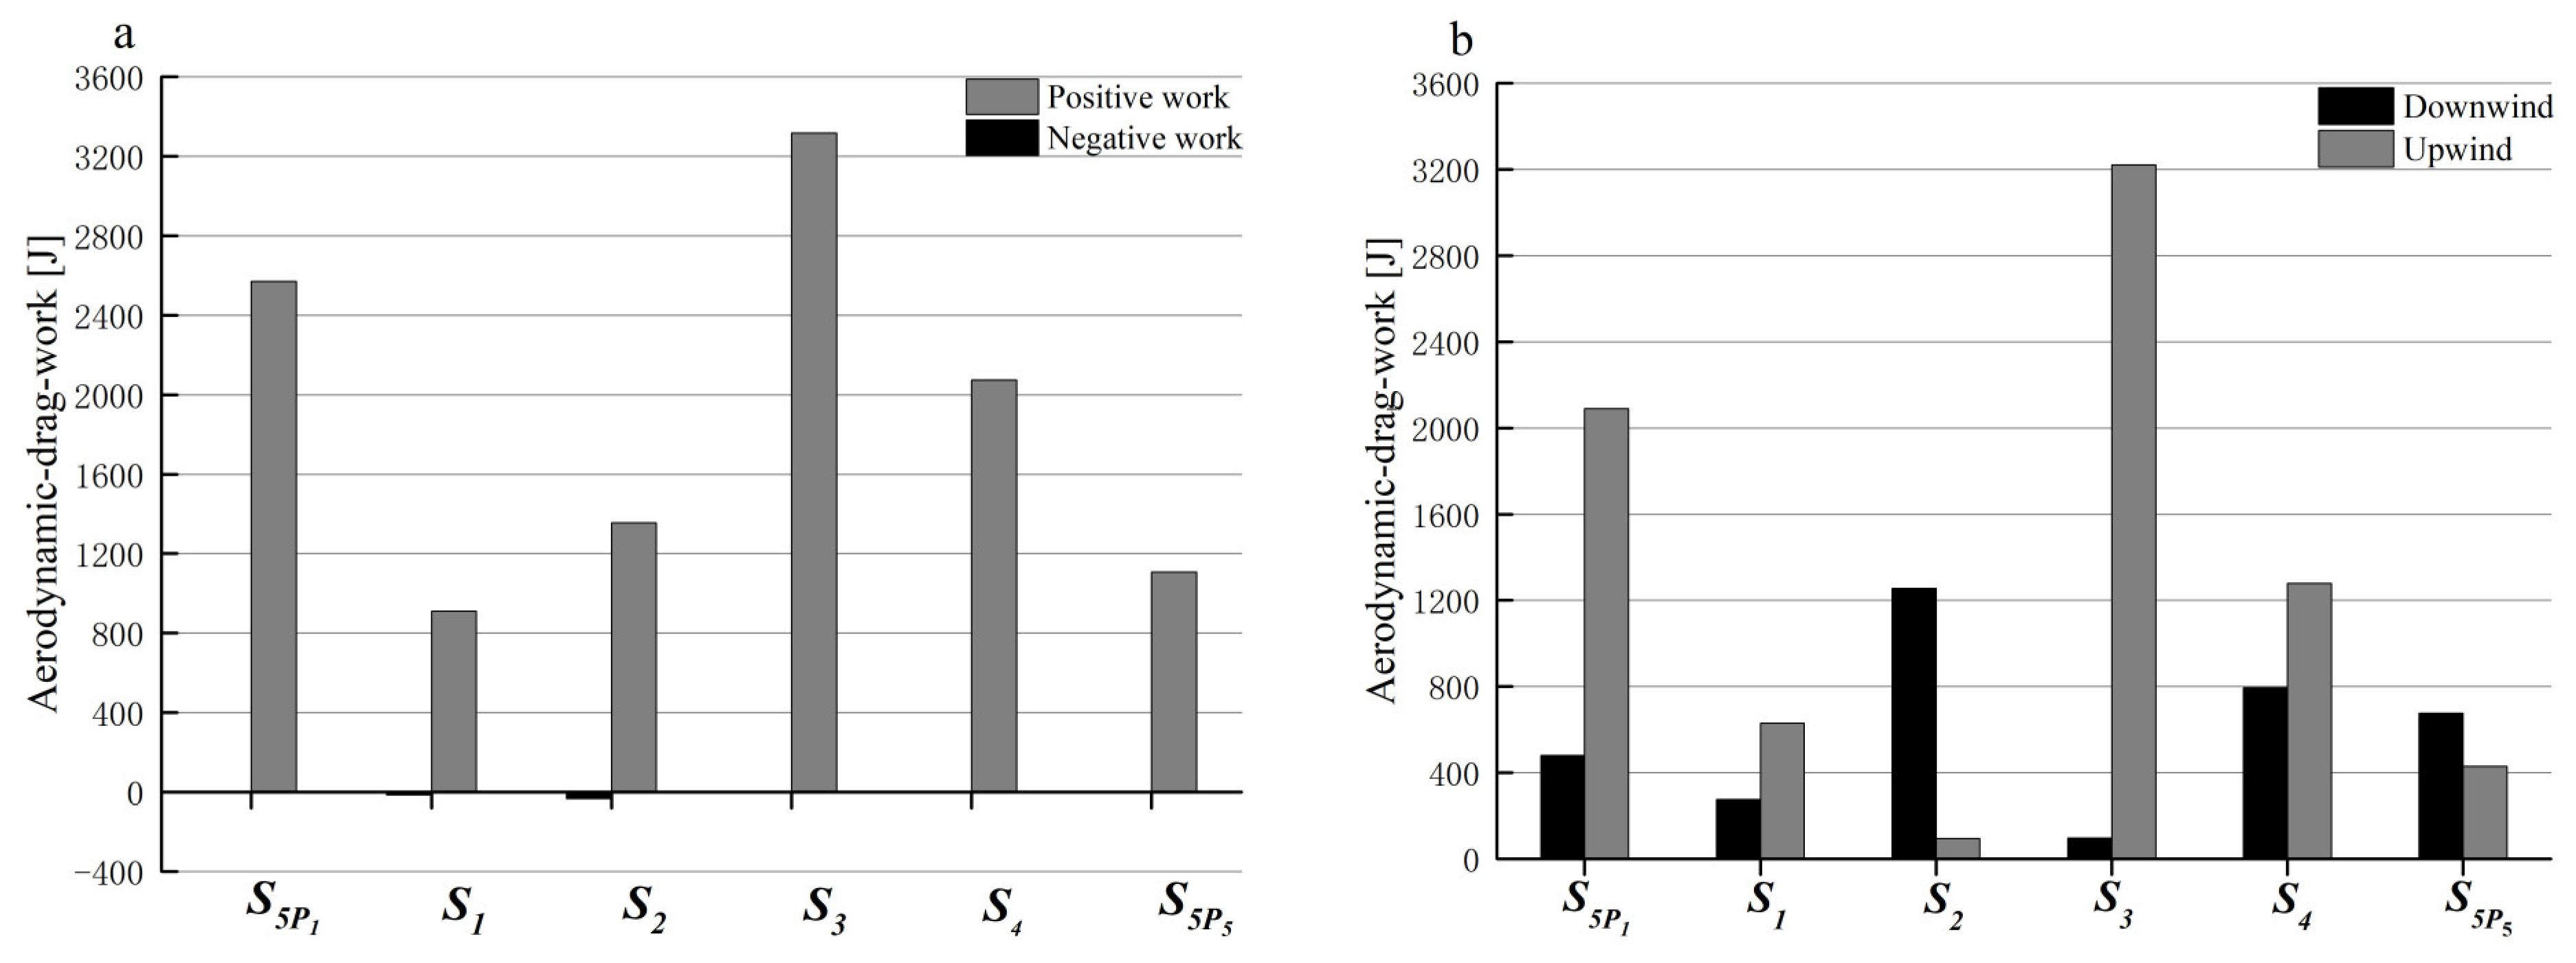
5.3. Analysis of Work by Overcoming Wind Resistance and Wind Environment Influence

According to Formulas (7), (10), (12), and (14), three training cases were calculated. The three training results for the athlete are listed in Table 2.
r w It can be seen from Table 2 that the athlete’s sliding distances are similar in training case 1, case 2, and case 3. The athlete’s sliding performance is determined according to the sliding time, and the lowest time is the best. The athlete’s training performance from high to low is case 2, case 1, and case 3. In the ideal state, the more work this athlete does to overcome aerodynamic drag in static air, the better their performance, and so the sliding time of training case 1 should be less than training case 2. However, the r w of training case 1 is 6.68%, and the field wind hinders the athlete, while the r w of training case 2 is −5.67%, and the field wind supports the athlete. In training case 3, the work to overcome aerodynamic drag in static air is less than that in training case 1, and the r w is 10.33%. The field wind will hinder the athlete from sliding more, and training case 3 will take longer. In conclusion, the field wind has a great influence on the athlete’s performance. The wind resistance energy dissipation ratio shows that the field wind has a promoting effect on the athlete in training case 2, which is one of the factors that resulted in training case 2 having the best performance among the three cases. In addition, the field wind in training case 1 and case 3 has a hindering effect on the athlete, and the field wind in training case 3 has a greater effect on the athlete, which is also the reason the performance of the athlete in training case 3 is worse than that in training case 1. Therefore, the wind resistance energy dissipation ratio is an important indicator to evaluate the impact of field wind on an athlete’s performance. When evaluating an athlete’s actual performance, the promotion or hindrance of the field wind to the athlete should be considered.
For training case 1, the relative speed between the approaching wind and the athlete’s movement ( U ) and the relative speed between the static air and the athlete’s movement ( V ) are shown in Figure 8.
Figure 8 shows that the athlete is greatly affected by the field environmental wind during sliding. In stage S 2 , the difference between U and V is clear, and the maximum difference is 6.00 m/s, which indicates that the field wind has an impact on the speed of the athlete. It can be seen that the relative speed between the approaching wind and the athlete’s movement and the relative speed between the static air and the athlete’s movement chart can also be used to qualitatively analyse the influence of the field wind on the athlete’s speed.
In each stage of training case 1, the athlete overcomes aerodynamic drag to do positive and negative work, as well as work in downwind and upwind conditions; the average speed and corresponding work of the athlete in each stage are depicted in Figure 9a,b and Figure 10.
For the athlete sliding a lap in training case 1, the work to overcome the aerodynamic drag was 3581.92 J under downwind conditions, and the work to overcome the aerodynamic drag was 7747.06 J under upwind conditions, accounting for 31.62% and 68.38% of the total work to overcome the aerodynamic drag, respectively. In the initial stage S 5 P 1 , the work to overcome the aerodynamic drag was 2570.47 J, and r w was 19.62%. As shown in Figure 10, the average speed of the athlete in the uphill stage S 1 is 3.43 m/s. The relative speed between the approaching wind and the athlete’s movement is relatively small, and the work to overcome the aerodynamic drag is the lowest, the work is 907.24 J and the r w is 4.29%. The downhill stage S 2 is mainly affected by the downwind conditions, and the r w is −23.5%. The field wind plays a major role in assisting the athlete, the athlete overcomes the aerodynamic drag to do some of the negative work, and the athlete can slide relatively easily in this stage. Because of the fluctuation of the terrain in stage S 3 , the athlete’s sport posture is converted into a two-step one support, the drag area is enlarged, and the work to overcome the aerodynamic drag does the most work, at 3317.17 J, and the r w is 22.96%. The athlete’s average speed in stage S 4 is relatively fast and the sliding distance is longer, so the work to overcome the aerodynamic drag is more than that in the other stages, and the r w is 2.27%. The athlete is less affected by the field wind in stage S 5 P 5 and the r w is 0.09%.

6. Conclusions

This paper proposes a method for evaluating the influence of field wind on cross-country skiing performance, which is based on the athlete’s aerodynamic-drag-work relative to the environmental wind field and the establishment of a racetrack wind field model. Through three training cases of a cross-country skier in the Yabuli Ski Field, the athlete’s wind resistance energy dissipation is discussed based on the typical sport posture of cross-country skiers, and the effectiveness of the method is verified. The specific conclusions are as follows:
  • The wind resistance energy dissipation assessment method proposed in this paper can analyse the impact of field wind on an athlete’s speed, whereby the work to overcome the aerodynamic drag and the ratio of the field wind environment play roles during skiing. This indicates that the method has strong practicability for evaluating the ski field environment on an athletes’ skills and tactics.
  • The field wind has a great effect on an athletes’ performance. When evaluating the real performance of the athlete, it is necessary to consider the promotion or hindrance of the field wind to the athlete, and the wind resistance energy dissipation ratio is an important indicator to evaluate the impact of field wind on the athletes’ performance. The relative speed between the approaching wind and the athlete’s movement and the relative speed between the static air and the athlete’s movement chart can be used to qualitatively analyse the influence of the field wind on the athletes’ speed.
  • In addition to the athlete’s sliding speed and field wind environment, the aerodynamic drag to the athlete’s work is also an important factor affecting an athlete’s drag area under a typical sport posture. It is necessary to improve the skiers’ skiing posture in complex terrain stages and to reduce the impact of wind-induced aerodynamic drag on sport achievement. The evaluation of wind resistance energy dissipation is closely related to the accuracy of the related equipment in the field test. In future research, the accuracy of GPS, anemometers, and other equipment should be improved to obtain more accurate information about an athlete’s wind resistance energy dissipation.

Author Contributions

Investigation, M.Z.; Methodology, J.H.; Project administration, D.X.; Supervision, L.Y.; Validation, M.Z.; Visualization, L.Y., Y.Z. and H.Z.; Data curation, Y.Z.; Resources, D.X.; Writing—original draft, J.H. All authors have read and agreed to the published version of the manuscript.

Funding

This research was funded by the Central Government Guides Local Science and Technology Development Project (grant number. ZY17C11), the Central University Science and Technology Platform Sustainable Development Project (grant number. 2572017PZ13), and the Fundamental Research Funds for the Central Universities (grant number. 2572019BJ06).

Institutional Review Board Statement

Not applicable.

Informed Consent Statement

Informed consent was obtained from all subjects involved in the study.

Data Availability Statement

Upon request data can be obtained from the authors.

Conflicts of Interest

The authors declare no conflict of interest.

References

  1. Shanebrook, J.R.; Jaszczak, R.D. Aerodynamic drag analysis of runners. Med. Sci. Sports 1976, 8, 43–45. [Google Scholar] [CrossRef] [PubMed]
  2. Spring, E.; Savolainen, S.; Erkkilä, J.; Hämäläinen, T.; Pihkala, P. Drag Area of a Cross-Country Skier. J. Appl. Biomech. 1988, 4, 103–113. [Google Scholar] [CrossRef]
  3. García-López, J.; Rodríguez-Marroyo, J.A.; Juneau, C.-E.; Peleteiro, J.; Martínez, A.C.; Villa, J.G. Reference values and improvement of aerodynamic drag in professional cyclists. J. Sports Sci. 2008, 26, 277–286. [Google Scholar] [CrossRef] [PubMed]
  4. Blocken, B.; van Druenen, T.; Toparlar, Y.; Andrianne, T. Aerodynamic analysis of different cyclist hill descent positions. J. Wind Eng. Ind. Aerodyn. 2018, 181, 27–45. [Google Scholar] [CrossRef]
  5. Elfmark, O.; Bardal, L.M. An Empirical Model of Aerodynamic Drag in Alpine Skiing. Multidiscip. Digit. Publ. Inst. Proc. 2018, 2, 310. [Google Scholar] [CrossRef] [Green Version]
  6. Arora, B.; Bhattacharjee, S.; Kashyap, V.; Khan, M.; Tlili, I. Aerodynamic effect of bicycle wheel cladding—A CFD study. Energy Rep. 2019, 5, 1626–1637. [Google Scholar] [CrossRef]
  7. Elfmark, O.; Ettema, G. Aerodynamic investigation of the inrun position in Ski jumping. Sports Biomech. 2021, 3, 1–15. [Google Scholar] [CrossRef]
  8. Wolfsperger, F.; Meyer, F.; Gilgien, M. Towards more valid simulations of slopestyle and big air jumps: Aerodynamics during in-run and flight phase. J. Sci. Med. Sport 2021, 24, 1082–1087. [Google Scholar] [CrossRef]
  9. Hong, S.; Asai, T. Aerodynamics of Cycling Skinsuits Focused on the Surface Shape of the Arms. Appl. Sci. 2021, 11, 2200. [Google Scholar] [CrossRef]
  10. Chen, Z.; Fang, H. The Effects of Wind and Posture on the Aerodynamic Performance During the Flight Stage of Skiing. J. Biomech. Eng. 2011, 133, 91001. [Google Scholar] [CrossRef]
  11. Meyer, F.; LE Pelley, D.; Borrani, F. Aerodynamic Drag Modeling of Alpine Skiers Performing Giant Slalom Turns. Med. Sci. Sports Exerc. 2012, 44, 1109–1115. [Google Scholar] [CrossRef]
  12. Barry, N.; Burton, D.; Sheridan, J.; Thompson, M.; Brown, N.A.T. Aerodynamic drag interactions between cyclists in a team pursuit. Sports Eng. 2015, 18, 93–103. [Google Scholar] [CrossRef]
  13. Mannion, P.; Toparlar, Y.; Blocken, B.; Clifford, E.; Andrianne, T.; Hajdukiewicz, M. Aerodynamic drag in competitive tandem para-cycling: Road race versus time-trial positions. J. Wind Eng. Ind. Aerodyn. 2018, 179, 92–101. [Google Scholar] [CrossRef]
  14. Gardan, N.; Schneider, A.; Polidori, G.; Trenchard, H.; Seigneur, J.; Beaumont, F.; Fourchet, F.; Taiar, R. Numerical investigation of the early flight phase in ski-jumping. J. Biomech. 2017, 59, 29–34. [Google Scholar] [CrossRef]
  15. Elfmark, O.; Giljarhus, K.E.T.; Liland, F.F.; Oggiano, L.; Reid, R. Aerodynamic investigation of tucked positions in alpine skiing. J. Biomech. 2021, 119, 110327. [Google Scholar] [CrossRef]
  16. Mattuella, J.; Loredo-Souza, A.; Oliveira, M.; Petry, A. Wind tunnel experimental analysis of a complex terrain micrositing. Renew. Sustain. Energy Rev. 2016, 54, 110–119. [Google Scholar] [CrossRef]
  17. Uchida, T. Computational Fluid Dynamics Approach to Predict the Actual Wind Speed over Complex Terrain. Energies 2018, 11, 1694. [Google Scholar] [CrossRef] [Green Version]
  18. Brogna, R.; Feng, J.; Sørensen, J.N.; Shen, W.Z.; Porté-Agel, F. A new wake model and comparison of eight algorithms for layout optimization of wind farms in complex terrain. Appl. Energy 2020, 259, 114189. [Google Scholar] [CrossRef]
  19. Tang, X.-Y.; Zhao, S.; Fan, B.; Peinke, J.; Stoevesandt, B. Micro-scale wind resource assessment in complex terrain based on CFD coupled measurement from multiple masts. Appl. Energy 2019, 238, 806–815. [Google Scholar] [CrossRef]
  20. Sharma, P.K.; Warudkar, V.; Ahmed, S. Application of a new method to develop a CFD model to analyze wind characteristics for a complex terrain. Sustain. Energy Technol. Assess. 2020, 37, 100580. [Google Scholar] [CrossRef]
  21. Uchida, T.; Ohya, Y. Large-eddy simulation of turbulent airflow over complex terrain. J. Wind Eng. Ind. Aerodyn. 2003, 91, 219–229. [Google Scholar] [CrossRef]
  22. Huang, G.; Cheng, X.; Peng, L.; Li, M. Aerodynamic shape of transition curve for truncated mountainous terrain model in wind field simulation. J. Wind Eng. Ind. Aerodyn. 2018, 178, 80–90. [Google Scholar] [CrossRef]
  23. Ren, H.; Laima, S.; Chen, W.-L.; Zhang, B.; Guo, A.; Li, H. Numerical simulation and prediction of spatial wind field under complex terrain. J. Wind Eng. Ind. Aerodyn. 2018, 180, 49–65. [Google Scholar] [CrossRef]
  24. Kikuchi, Y.; Ishihara, T. A study of topographic multiplier considering the effect of complex terrains and tropical cyclones. J. Wind Eng. Ind. Aerodyn. 2012, 104–106, 558–564. [Google Scholar] [CrossRef]
  25. Tse, K.; Li, S.; Fung, J. A comparative study of typhoon wind profiles derived from field measurements, meso-scale numerical simulations, and wind tunnel physical modeling. J. Wind Eng. Ind. Aerodyn. 2014, 131, 46–58. [Google Scholar] [CrossRef]
  26. Abdi, D.S.; Bitsuamlak, G.T. Wind flow simulations on idealized and real complex terrain using various turbulence models. Adv. Eng. Softw. 2014, 75, 30–41. [Google Scholar] [CrossRef]
  27. Blocken, B.; van der Hout, A.; Dekker, J.; Weiler, O. CFD simulation of wind flow over natural complex terrain: Case study with validation by field measurements for Ria de Ferrol, Galicia, Spain. J. Wind Eng. Ind. Aerodyn. 2015, 147, 43–57. [Google Scholar] [CrossRef]
  28. Dhunny, A.; Lollchund, M.; Rughooputh, S. Wind energy evaluation for a highly complex terrain using Computational Fluid Dynamics (CFD). In Renew. Energy; Elsevier: Amsterdam, The Netherlands, 2017; Volume 101, pp. 1–9. [Google Scholar] [CrossRef]
  29. Castellani, F.; Astolfi, D.; Mana, M.; Piccioni, E.; Becchetti, M.; Terzi, L. Investigation of Terrain and Wake Effects on the Performance of Wind Farms in Complex Terrain Using Numerical and Experimental Data. Wind Energy 2017, 20, 1277–1289. [Google Scholar] [CrossRef]
  30. Van Ingen Schenau, G.J. The influence of air friction in speed skating. J. Biomech. 1982, 15, 449–458. [Google Scholar] [CrossRef]
  31. Vogt, S.; Heinrich, L.; Schumacher, Y.O.; Blum, A.; Roecker, K.; Dickhuth, H.-H.; Schmid, A. Power Output during Stage Racing in Professional Road Cycling. Med. Sci. Sports Exerc. 2006, 38, 147–151. [Google Scholar] [CrossRef]
  32. Supej, M. Differential Specific Mechanical Energy as a Quality Parameter in Racing Alpine Skiing. J. Appl. Biomech. 2008, 24, 121–129. [Google Scholar] [CrossRef] [Green Version]
  33. Blocken, B.; van Druenen, T.; Toparlar, Y.; Malizia, F.; Mannion, P.; Andrianne, T.; Marchal, T.; Maas, G.-J.; Diepens, J. Aerodynamic drag in cycling pelotons: New insights by CFD simulation and wind tunnel testing. J. Wind Eng. Ind. Aerodyn. 2018, 179, 319–337. [Google Scholar] [CrossRef]
Figure 1. The relationship between the field wind direction and the angle of the athlete’s sliding direction.
Applsci 12 06902 g001
Figure 2. Schematic diagram of dividing the ski field racetrack.
Applsci 12 06902 g002
Figure 3. (a) The ski field racetrack coordinate system. (b) The relationship between the wind speed at any position point and the wind speed at the monitoring point.
Applsci 12 06902 g003
Figure 4. Process of evaluating wind resistance energy dissipation.
Applsci 12 06902 g004
Figure 5. Racetrack division and athletes’ sliding trajectory.
Applsci 12 06902 g005
Figure 6. Freestyle cross-country skiing typical sport postures: (a) free uphill; (b) free downhill; (c) two-step one support; (d) free flat.
Applsci 12 06902 g006
Figure 7. Scale models in the wind tunnel.
Applsci 12 06902 g007
Figure 8. The relative speed between the approaching wind and the athlete’s movement (U) and the relative speed between the static air and the athlete’s movement (−V) in training case 1.
Applsci 12 06902 g008
Figure 9. (a) The situation of overcoming aerodynamic drag to do positive work and negative work in each stage. (b) Work to overcome aerodynamic drag in the downwind and upwind conditions of each stage.
Applsci 12 06902 g009
Figure 10. Average speed and corresponding work of the athlete in each stage.
Applsci 12 06902 g010
Table 1. Frontal area, drag coefficient, and drag area for the four athletic postures.
PostureA (m2)CDCDA (m2)
free uphill0.3980.9290.370
free downhill0.2410.7010.169
two-step one support0.4750.6910.328
free flat0.4050.8530.345
Table 2. Three training results for the athlete.
Case123
static air work (J)11,328.989961.8811,306.24
field wind work (J)10,619.2210,560.3910,247.76
r w (%)6.68−5.6710.33
average velocity (m/s)6.046.145.99
time (s)186183188
distance (m)1122.661124.361125.78
Publisher’s Note: MDPI stays neutral with regard to jurisdictional claims in published maps and institutional affiliations.

