1. Introduction
Road safety, and ensuring road safety, are current topics in many areas of human activity. Transport, and the entire transport system, are no exceptions. The continuous reduction of the number of people killed and injured, whether seriously or slightly, is one of the basic ideas underlying strategic documents at the national and European level [
1].
The impact of advertising devices on road safety has been a topic of discussion for many years, both among the general public and experts. However, the risk of advertising devices does not only result from fixing the driver’s eye and limiting his attention to traffic flow, but they also represent a risk from a construction point of view, because their supporting structure may represent a fixed obstacle which may increase the consequences of a traffic accident.
In order to correctly analyze the whole issue and verify whether the advertising device is an element that distracts the driver’s attention, it is first necessary to focus on the driver and the way in which the driver understands the road area. The driver’s thinking and perception is a complex and complicated system, influenced by a number of internal and external inputs. The interaction between a person and a vehicle in relation to a specific traffic situation is mainly determined by the driver’s sense perception, which enables the persons to orientate themselves in a specific situation. Therefore, visual perception, which mediates the perception of the surrounding environment by up to 90%, is an absolutely essential perception [
2]. In cognitive demand, the main role is played by information competition between different simultaneously existing perceived objects. When the load of secondary tasks is high, the quality of visual percepts is reduced at the expense of the main task. This can endanger the reliability of the information required for safe driving.
One of the main aspects of the perception of the environment of communication is the attention and mental capacity of a human being. These two terms are closely related because the selectivity of attention protects the organism from information overload. Everything that is focused on by attention is better and processed at a greater length and subsequently also recalled in general and, in detail, from memory. Driving a car requires equally tense, moving attention, which can be increased at any time for short periods for maximum and multiple performances. It is not important to see and perceive as many stimuli as possible, but it matters much more whether the selected information is relevant and processed further. Of the available information, only a very small part is recognized as relevant and used for driving. Experimental measurements of attention spans have shown that humans are able to capture approximately six objects simultaneously with a single gaze (fixation interval 0.1–0.2 s) [
3,
4]. For this reason, it is essential to be able to appropriately prioritize information obtained from the road and its surroundings.
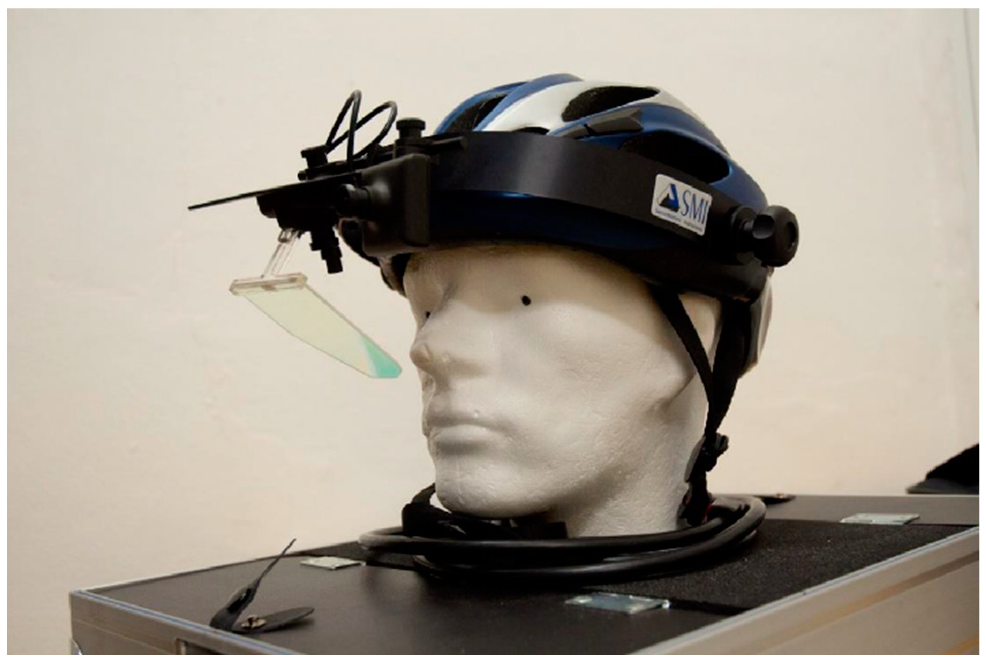
The aim of this research was to find a method of classification and evaluation of the risk of different types of advertising devices depending on the duration of fixation of the eye on these objects. One way of assessing and evaluating the aspect of a driver’s ability to attend to driving and how distracted they are from driving is through the use of eye tracking. This method focuses on tracking eye movement and the duration of gaze fixation on a particular object using a structured observation method. It is a way of directly measuring and observing human reaction behavior directly on test riders, in both real and simulated environments [
5]. The test objects were advertising devices of different sizes with different design characteristics (illuminated advertising surface, static/dynamic advertising surface, LED panel,...). The results contained in the final evaluation made it possible to establish a scale of severity for each advertising device depending on the duration of fixation of the eye on the object and thus to define the degree to which the driver of the vehicle is distracted by it.
2. Human Perception of Road by Sight
The essential human perception for distinguishing the surrounding information necessary for driving is sight. Sight is primarily focused on the perception of contrast, therefore it allows to see the contours of objects, their distance and significantly contributes to orientation in the area of the road. The human eye has a range of areas with different discriminating abilities, these are the so-called central and peripheral vision. Central vision has a range of only about 2° and is where visual sharpness and speed of color vision is best developed. The peripheral vision allows good recognition of movement and light changes, but hardly distinguishes shapes and colors.
Integrity of the field of view has been shown to be essential to driving ability. The normal limits of the visual field in each eye, measured in degrees from the fixation point, are approximately 60° upward, 75° downward, 90° to 100° temporally (toward the temple), and 60° nasally (toward the nose). The normal binocular field of view thus reaches approximately 135° vertically and 200° horizontally [
6].
From a psychological perspective, the concept of the usable field of view is also important. The concept of usable field of view can be defined from a psychological point of view as the section of the visual field in which an individual is able to perceive objects at a given moment. Only within its range the perceived information can influence the driver’s behavior [
7].
Based on eye movement research, drivers go through several stages of visual orientation when they are learning to drive. Firstly, they learn which input to consider during driving, in the second phase how to select it, and in the third phase how to use peripheral vision for stimuli coming from the sides [
3,
4]. The fixation of an object in central vision is conscious, while overlooking signals in the periphery is accounted for. The probability of not perceiving an object in the periphery decreases with the proximity of the object to central vision, with the salience of the object, and with the reduction of driver workload [
8].
Visual impairment affects the decision to stop driving. Drivers with impaired visual acuity are more likely to report driving difficulties, and drivers who stopped driving had worse average visual acuity than active drivers. Driving difficulties are also affected by impairments in other functions such as contrast sensitivity or slowing of visual information processing. Thus, some drivers stop driving even though their visual acuity still meets the required standard [
9,
10,
11].
To perceive most of the events in a traffic flow, central vision is required within 25° horizontally to the right and left of the line of sight and 15° up and several units of degrees down. A horizontal range is necessary, for example, when the driver wants to change road line and has to determine whether the adjacent road line is free by head or eye movements [
12].
Eye movements are also the most common human movements. Oscillating eye movements, called saccades, occur 3 to 4 times per second. The human eye can observe a visual field of about 200°, but only receives detailed information about 2°. In fact, the eye perceives sharply only a very small area of the retinal fovea (yellow spot). The peripheral vision monitors the surroundings, but is much less sharp and less able to distinguish colors, but sees better in twilight and darkness and responds better to rapid movement. The main task of peripheral vision is to select visually interesting, important or moving objects to which the eye’s fixation will jump at the next moment. The area of peripheral vision corresponds approximately to the thumbnail from the distance of the outstretched hand and moves across the visual field at speeds up to 500°/s.
Sight perception is not an instantaneous process. The human perception of light scenery is a kind of image of the events that have already taken place or are taking place. The processing and transmission of the signal from the eye to the brain introduces a certain delay. The speed of perception of a particular agency or object depends on the brightness of the object in the scene and the contrast against the background. For example, at a luminance of 0.15 cd·m−2, the visual perception is formed in about 1 s, while at a luminance of 1 cd·m−2 it is only half that, i.e., 0.5 s. Also, the duration of the visual perception exceeds the duration of the actual phenomenon. For example, in the case of a sudden intense change, the visual perception can last several times longer than the actual event (lightning, glare). All of these visual characteristics can be affected by advertising devices, increasing the driver’s reaction time and increasing the possibility of accidents.
3. Analysis of Current Knowledge
Research of the relationship of advertising devices to traffic accidents and driver influence is a frequent topic in scientific publications. Most focus on the psychological direction, on monitoring the driver’s attention or the number and length of gazes at the advertising devices.
3.1. Studies Discussing the Impact of Advertising Devices on Road Accident Occurrence
One of the first studies to address this topic was a study from the 1950s (USA, Michigan) in which rural area roads and their surroundings were studied. The roads were divided into equal length sections, where the occurrence of accidents, the causes of the occurrence, their distance from significant objects in the vicinity of the road and their possible influence on the occurrence of traffic accidents were analyzed in detail. As a result, it was found that the more complex the traffic situation (road crossings, number of traffic signs, significant objects in the vicinity attracting attention, density and intensity of traffic flow, speed), the more the number of accidents increases. The accident rate increases most in the area of both level and off-grade crossings, especially if there are advertising devices in the area of the intersection. In contrast, however, no direct and independent effect of advertising devices on the number of traffic accidents outside intersections has been demonstrated by data [
13].
The results of this research were confirmed by another study conducted in the USA (Minnesota). The approach of the authors was the same (road segmentation and traffic accidents analysis). The final results were also very similar—advertising devices in intersections increase accident rates. However, unlike the previous study, this fact was also confirmed with regard to intersection sections [
14]. Similar results were also reached by other authors who took a similar approach; however, the method of selecting the roads or parameters monitored differed [
15,
16].
One of the major studies was a 1967 study. It was a comparison of accident rates before and after the installation of advertising devices. The authors chose 12 advertising devices and monitored the accident trends for 12 months before and the same number of months after their introduction into service. They also selected so-called control sections for these advertising devices, where they recorded the overall accident trends, which could prevent other global influences from being projected. However, during the actual processing, it was found that consistent and relevant data were only available for three of the selected advertising devices [
17,
18,
19].
One of the other studies that did not clearly prove the negative impact of advertising devices is a study carried out in Sweden on the occasion of the commissioning of the first 12 advertising devices based on LED technology. This was a new element among advertising devices and its suitability was tested. The authors of the study followed the evolution of accident rates from 2003 to 2010, with 2009 being the key year in which all the devices were put into operation. The main negative aspect of the research was the short time interval after the start of operation of each advertising devices. For each facility, three sections were delineated—‘before advertising devices’, ‘during placement of advertising devices’ and ‘after advertising devices’. The first was the section from where the device could already be observed from the road, the second where the advertising device was clearly recognizable and the third behind the advertising device. The second and third s were generally chosen to be the same length. No increase in the number of accidents was found for these sections, which were at the level of the average of the selected period. Only for the first section (“before the advertising device”) an increase in the number of traffic accidents could be found, but there is no clear evidence that this is an effect of the LED advertising device [
20].
Another study that used accident data to demonstrate the effect of advertising devices on traffic safety also focused on LED advertising devices. Specifically, eight of these were located in Alabama and ten in Florida and were limited access highways with over 450 traffic accidents. The conclusion of the study was that the study sites were more accident-prone compared to similar control sites. There was a +25% increase in the accident rate in Florida and a +29% increase in Alabama [
21].
The study focusing on the impact of advertising devices on road users in the State of Israel was conducted in two time periods: 2008 and 2014 (different years due to a change in local legislation). In the first of these years, a provision was enacted according to which advertising devices were removed. This was changed four years later and the situation returned to its original state. The advertising devices has been rebuilt or reinstated. Eight sites or sections with relevant advertising devices and 6 control sites were selected, all of which were located on the Tel Aviv Ayalon highway. The authors found that after the removal or covering of advertising devices, there was a 30–40% decrease of traffic accidents with personal injury (for the total number of crashes it was an even greater decrease—up to 60%), while restoring their function was associated with a 30–45% increase of traffic accidents (in all categories—total number of crashes, crashes with material damage only and those with injuries to the participants) [
22,
23].
3.2. Applications of the Eye Tracking Method
Studies of drivers’ behavior can show how drivers are distracted by advertising devices. The study can use eye tracking, which is applicable while driving in real traffic and the test subject is directly affected by the external environment. Eye tracking is a measurement in which either the relative movement of the eye to the head or the direct point of view of the subject is recorded using an eye tracker.
Studies often focus on how often and for how long drivers watch certain types of devices near the road. They have been shown to look more often and longer at dynamic advertising devices [
3]. Based on this conclusion, a study was conducted on the impact of moving images on traffic safety. The eye movements of several drivers were observed while they drove through intersections both with and without dynamic advertising devices. The investigation showed that drivers did not look less at traffic signs when dynamic advertising devices were around, but that some drivers drove unsafely while looking at dynamic advertising devices [
24].
Regarding the number and duration of gaze fixation on the selected advertisements, for example, in the study [
25], no driver was found to have a gaze fixation time longer than 1 s. Other studies have compared drivers’ behavior in the presence and absence of advertising devices. A study [
26], which monitored driver behavior on a driving simulator, showed that when advertising areas are placed close to the road, drivers spend less time observing what is happening on the road. Another simulator study [
27] concluded that advertising devices close to a road are more likely to distract the driver’s gaze from what is happening on the road, but always “only for a short period of time”. However, this statement can be very misleading, as it is this ‘short time’ that can influence the delay in the initiation of braking.
The same study also showed that after the test, subjects were more likely to remember the last advertising message than the last road sign. This premise is somewhat consistent with the findings of a study [
28] that showed that drivers respond more slowly to traffic signs when influenced by advertising devices.
It is known that moving objects as well as objects that appear unexpectedly or objects with large brightness variability are very difficult to ignore while driving (see for example [
29,
30,
31]). Research in this area generally agrees that moving advertisements near the roads affect drivers’ attention more significantly than static ones. For example, one study [
32], which tested driver behavior directly in real traffic, found that drivers look at moving advertisements more often and for longer periods of time than at static ones. They reached identical conclusions by comparing static and moving advertisements in a simulator study [
33]. It can also be inferred from this work that drivers deviated from the direction of travel more frequently and drove more slowly in the presence of moving advertisements than in the presence of static ones. Finally, the study shows that in the presence of moving advertisements, drivers are more likely to brake at the last moment (e.g., before a pedestrian crossing).
In contrast, a study [
24] in Toronto found that moving advertisements did not substantially reduce drivers’ perception of traffic signs. However, the moving nature of the advertising messages increased the duration of the viewing area (1.5 s) and led to a reduction in the distance between cars (1 s or less).
The intensity of the driver’s attention is significantly related to the question of advertising device positioning. Devices located in the central field of view are more likely to catch the driver’s attention than those in the periphery [
33], and devices located at eye level are more likely to catch the driver’s attention than those located higher up [
28].
The Swedish Transport Administration has approved the trial installation of twelve LED advertising devices near a three-lane highway through the center of Stockholm. The aim of this study [
20], already mentioned above, was to assess the effect of these LED advertising devices on visual behavior and driving performance. A total of 41 drivers were interviewed and asked to drive an instrumented vehicle on a stretch passing four of these LED advertising devices under day and night conditions. Distraction by visual perception was found if the driver looked at the advertising message continuously for two seconds or if they took their eyes off the road for a percentage of the time. The dependent variables were eye movement (measured by the aforementioned eye-tracking method) and driving performance.
Based on the visual behavior data, it was found that drivers had significantly longer gaze fixation times, a higher number of gaze fixations and a longer maximum gaze fixation time when passing near LED advertising devices compared to other sources of visual perception on the same road. No differences were observed in relation to day/night factors and no effect on driving behavior data was found. LED advertising devices have an effect on gaze direction and duration (gaze behavior) as they attract more frequent and longer gazes than conventional road signs. It can be noted that the LED advertising devices caught more visual attention than the other types of road markings included in the study. In the case of LED advertising devices, longer dwell time, higher visual attention share, more frequent very long gazes and higher number of gaze fixations were observed. As the information on the LED advertising devices changed at regular intervals, the displayed messages had the potential to sustain drivers’ interest for a longer period of time.
Studies of the impact of advertising devices on driver behavior have generally shown that their presence has negative consequences on several levels: drivers’ observation capacity is reduced (they look away from the road more often and for longer periods of time), reaction time is increased (drivers react more slowly to important signals under the influence of advertising messages) and the quality of vehicle control is reduced (they deviate from the direction of travel more often). These adverse effects are more likely to occur in the presence of moving advertisements, or if the surfaces are located in the central field of view, contain emotionally important information or resemble road signs or traffic information panels.
Moreover, in an environment saturated with visual information, important traffic-related information is often lost. At the same time, dynamic advertising devices have been found to have an impact on gaze behavior, as they catch people’s eyes more often and for longer periods of time than standard traffic signs. This clearly shows that they impair traffic safety.
However, all the studies discussing the issues of the advertising device do not specify the risk of the object in question, but only point to the risk associated with distraction of the driver’s attention. On the basis of the knowledge gained, it is possible to implement a similar principle of testing, on the basis of which it will be possible to create a risk scale and define the severity of individual advertising devices in general.
6. Results
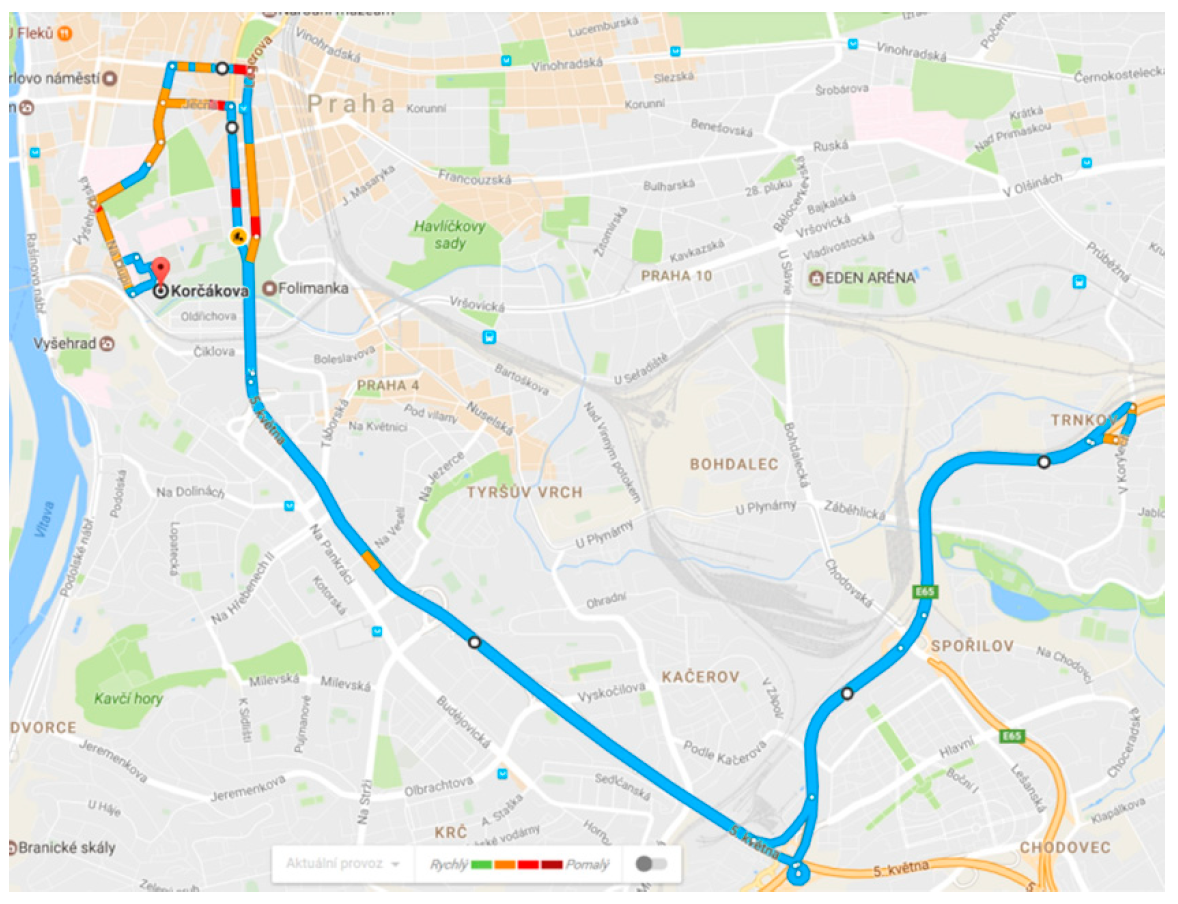
6.1. Results of Measurement in Real Traffic
As part of a comprehensive evaluation of test drives, it was possible to detect the driver’s focus of interest, including fixation time, in addition to the quality of driving of individual drivers and the prediction of the translation of attentional distortion due to advertising devices into driving safety. The fixations were divided according to their duration into four groups: flash fixations with a duration of up to 0.3 s, short fixations with a duration of 0.3 s to 0.6 s, long fixations that lasted more than 0.6 s, and repeated fixations (these are multiple views of the advertising devices, mostly flash fixations).
When examining the data, it can be concluded that there was no significant difference between the installed LED advertising devices and conventional static advertising devices in terms of the number and repetition of driver perspectives (recorded by the eye tracker). However, the average fixation time differed—for conventional advertising device types it was 0.59 s, whereas for LED advertising devices it was 0.76 s.
There was no significant difference between day and night routes. In terms of observing all advertising devices, the majority of drivers directed their gaze to the advertising devices during the day as often as at night. Directing their gaze to the advertising devices more at night than during the day was rather exceptional. It should be noted that 30 of the 40 drivers directed their gaze to at least four LED advertising devices out of the eight on the route.
In terms of the number and duration of gazes during the day and at night, we can state that during the day, drivers most often use the repeated gaze, followed by the flash gaze (up to 0.3 s). A gaze longer than 0.6 s is used least frequently by drivers. In contrast, when driving at night, drivers most often use a flash gaze of up to 0.3 s. Repeated gazes of drivers can be observed mainly at the time of dynamic contrast changes in the background of the advertising message displayed by the LED advertising devices.
Overall, based on objective data on the number and duration of gazes at each type of advertising device, it was shown that LED advertising devices are more distracting and therefore more dangerous for road traffic than other advertising devices, as 30 out of 40 drivers gazed at more than 50% of LED advertising devices, while on average drivers gazed at about one in four large-format, passive, illuminated advertising devices. Gaze fixation duration is 0.17 s longer.
It is appropriate to point out that even a brief loss of attention can have a major impact on the occurrence of an accident. The effect of braking delay, due to gaze fixation on the advertising device, on impact speed can be illustrated in the following
Table 1.
The values are calculated for a braking deceleration of 5.8 m·s
−2, corresponding to relatively intense but not extreme braking. Such braking usually does not yet produce braking marks and does not cause the vehicle to skid. However, any delay in the driver’s reaction increases not only the probability of an accident situation, but also the consequences of any accident due to the higher impact speed [
42,
43].
Overall, considering all the drivers tested, a total of 26 drivers perceived the LED advertising device as a cause for losing their attention. Their attention is disturbed by the color switching, the sharp illumination and the change of advertising message. All drivers agreed that LED advertising devices are more dangerous at night, especially because they are more glare-inducing. LED advertising devices are considered by all drivers to be more aggressive (more intrusive, more invasive) than conventional advertising devices, or “distracting”. They considered the biggest problem to be that the images and brightness change frequently. They reported that they notice LED advertising devices more than conventional advertising devices because they are more intense and visible (which was confirmed by objective test results).
In terms of demographic characteristics, particularly gender and age, no differences were found between drivers. This means that men and women, or older and younger drivers do not experience the presence of LED advertising devices differently. However, it should be noted that the sample was composed more of younger drivers (mean age 31 years) and 2/3 were men.
In relation to the driving mistakes made, no significant differences were found between the individual sections. It can be assumed that this is mainly due to a very complex environment and a large number of influencing factors (e.g., other road users, following the chosen route, etc.) in which the possible influence of the LED advertising device was not apparent. Depending on where drivers made mistakes, no differences were found between sections with and without LED advertising devices. Drivers were more likely to make mistakes in sections with conventional advertising devices, but there were more of these sections on the route. In total, only four drivers made more mistakes in the sections with LED advertising devices. Another six drivers made errors in almost the same number of sections with LED and conventional advertising devices.
Based on the experiment conducted with drivers in real traffic, it can be stated that compared to the effect of conventional advertising devices, no significant negative effect of the presence of LED advertising devices on the quality of driving (number and types of driving errors) was found objectively. However, similar to other studies, this is probably due to the complexity of the traffic environment and the complexity of the individual tasks performed by drivers, so that a specific positive or negative effect of LED advertising devices cannot be observed directly.
In the case of distraction (number and duration of views of the LED advertising devices) relative to the absolute number of advertising devices on the route travelled, it can be noted that the LED advertising devices had approximately 50% “viewing”, while the passive illuminated large-format areas had only 25%. In terms of the subjective experience of the presence of LED advertising devices and their relationship to road safety, a large proportion of drivers perceive their presence significantly negatively. They find LED advertising devices distracting, particularly due to color switching, sharp illumination, dynamic changes and glare, and therefore consider them to have a significantly negative impact on road safety.
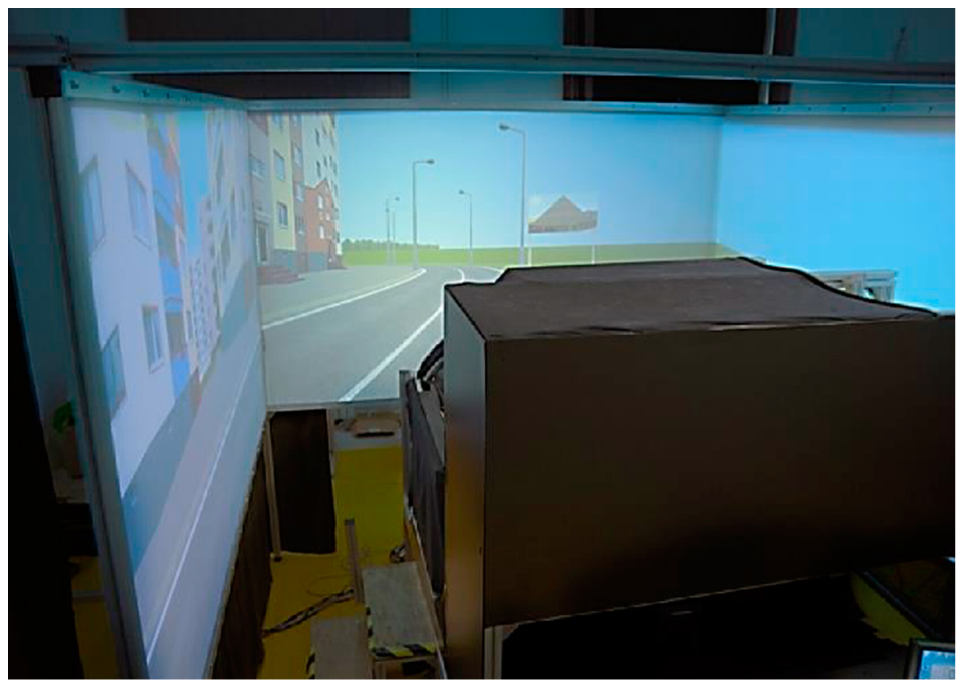
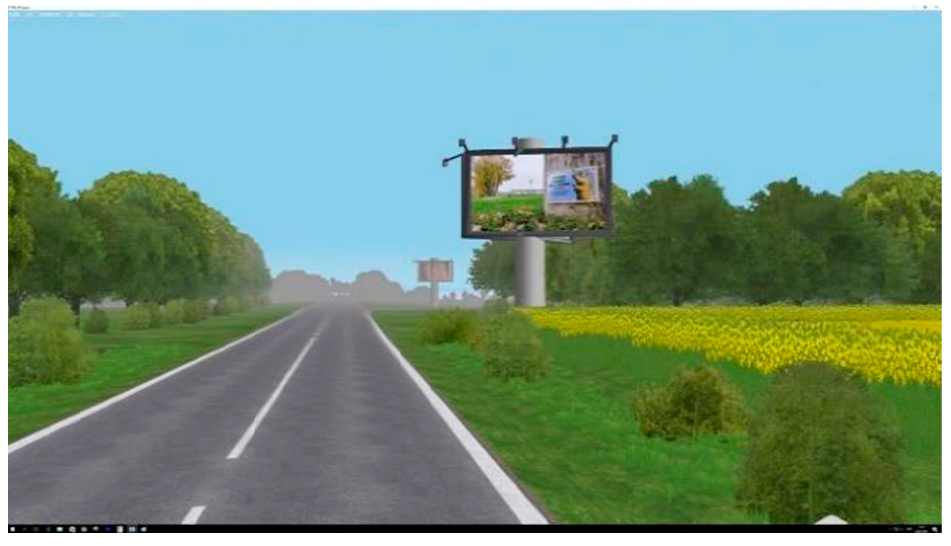
6.2. Results of the Measurement on Vehicle Simulator
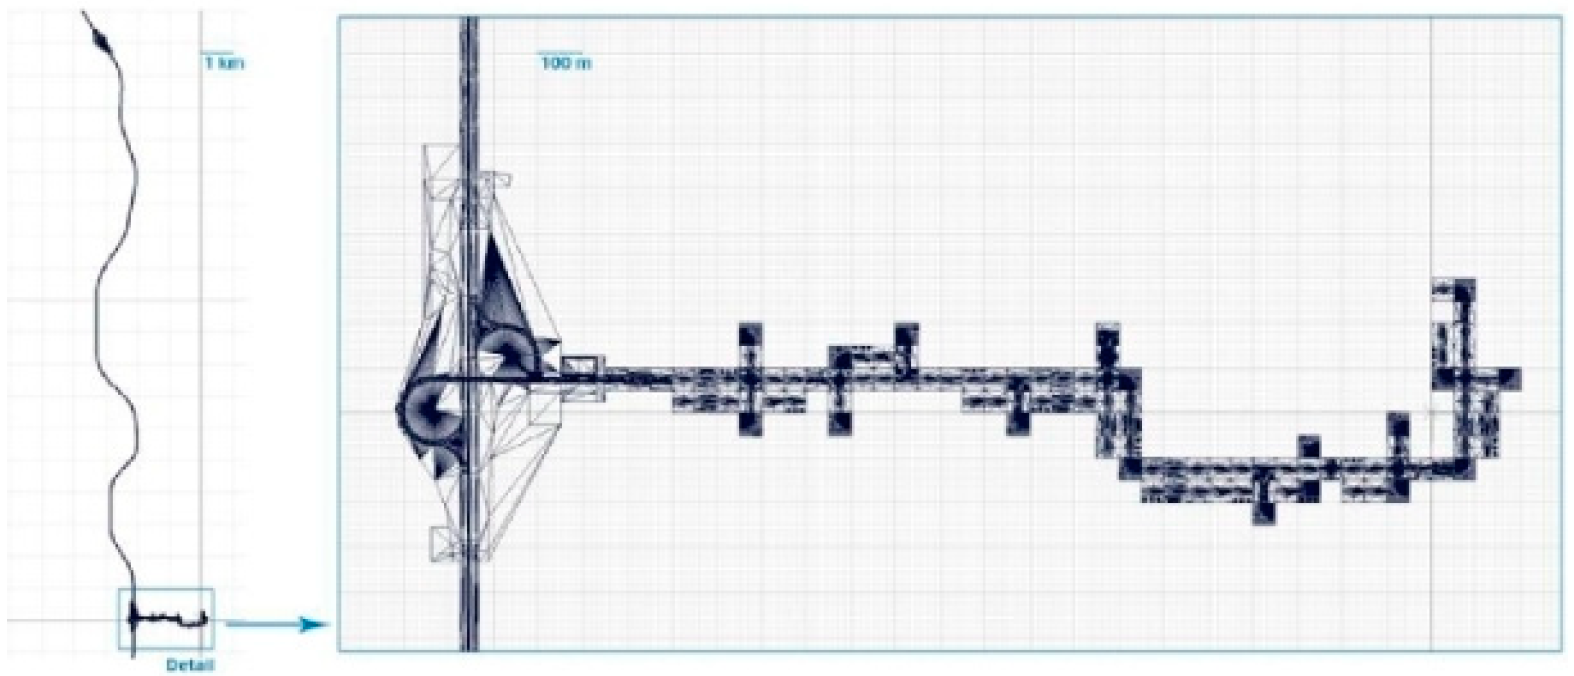
The data from the experiments were obtained from the physics module of the simulator, which stores vehicle data (i.e., for example, position, rotation, and state of individual controls) with a scan rate of 4 ms. The output of the eye tracking is a video recording with a resolution of 752 × 480 pixels and a sequence of 24 frames per second (the length of one frame, and the resulting measurement uncertainty, is ±0.042 s).
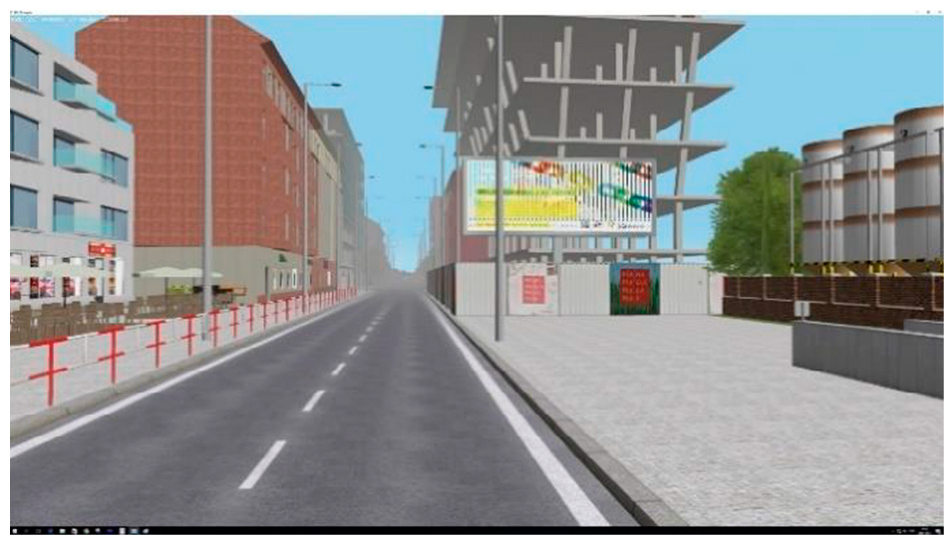
A total of 84 advertising devices are included in the test scenario, with the number of driver views and the duration of each view determined for each device. The same evaluation methodology was used as for the real vehicle runs in this project. Therefore, the durations of the advertising device views were divided into flash (less than 0.3 s), short (time interval 0.3–0.6 s) and long (longer than 0.6 s), while repeated views of a given advertising device were also counted. The resulting summary data are shown in
Table 2.
A total of 21 of the 27 drivers looked at the dynamic passive big advertising devices during the run, with an average gaze time of 1.4 s. Factors influencing the attractiveness of this type of advertising device include primarily size, location and distance relative to the roadway, as well as image dynamics (the large influence of the dynamic component of the image that attracts or draws the driver’s attention).
Some of the medium static advertising devices located along the highway attracted considerable attention from drivers. The influencing factor here was mainly to create an atmosphere where the driver becomes bored (i.e., few other stimulation for the driver, monotonous surroundings and low traffic) and focuses the attention on the visually attractive advertising device area. Another factor is the readability of the content of the advertising area (large, possibly contrasting text).
The large dynamic LED advertising devices attract drivers with their content, which is also linked to their long viewing time (up to 3.88 s). Influencing factors include the size of the advertising area, contrasting colors, dynamic image, clear road section, location directly in the road axis (close to the directional curve).
The results and the measured data themselves show the uncertainty resulting from the large number of parameters in the experiment. It can be reliably concluded that a major distractor is the change in the advertising area, especially when an animated sequence is running on a large dynamic LED advertising device.
On the other hand, the advertising devices that were not expected to have a high viewership, i.e., medium static advertising devices that drivers look at in the absence of other impulses, also have a high viewership. Another factor is color in relation to the surroundings; a different colored area will attract drivers, but if it is not close enough or does not change in animation, they will not follow it for a long time.
The course of monitoring the advertising area consists of several shorter gazes, between which the driver monitors the road condition, signs, speed or distance from the vehicle in front. When the driver had to pay attention to the surroundings (traffic level, intersections, pedestrian crossings, traffic signs), the advertising devices decreased in observation. In urban areas, some drivers even did not notice changing surfaces at all at some advertising devices. At times when the scenario was less demanding, the driver maintained a longer distance from the vehicle in front (especially on the highway).
Uncertainty in the results is also caused by the known specifics of the simulator measurements. This is the impossibility of dazzling the driver with a lit advertising device in night scenery. This may cause a higher visibility of areas that are significantly close and have exceptionally large text, or on the contrary, a reduction of interest in more difficult to read advertising devices. It is also affected by the low absolute contrast of the display (less than 1000:1), which does not allow to simulate glare during sudden brightness changes in large dynamic LED advertising devices. It can be concluded that with a realistic contrast, the viewability of illuminated advertising devices or LED areas would be even higher (especially at night), moreover glare can cause significant limitations in the driver’s vision, the duration of which depends on the age, health and current condition of the driver.
6.3. Summary of the Partial Results
Based on the results of the individual search activities and their synthesis, a scale with qualitative evaluation was created. This fact is due to the different perception of advertising devices by individual drivers, but also to the fact that each advertising device must also be assessed with consideration of its surroundings and the individual influences that represent a key role in its perception by human factors.
Among the essential parameters which had to be taken into account when compiling the scale and the final table and which influence the classification of the assessed advertising device into one of the levels are:
- 1.
Whether the advertising device, by design, creates a fixed obstacle increasing the potential risk of injury in a traffic accident;
- 2.
Whether the advertising device is dynamic or static;
- 3.
Whether the advertising device is located at an intersection or on a wide road and at what distance from the road;
- 4.
What is the traffic volume on the road, what is the maximum speed limit;
- 5.
Whether it is a location requiring increased attention from road users (typically a road intersection);
- 6.
Whether it is an advertising device with or without lighting and whether it is located in a lighted or unlighted scene (i.e., typically in a city or open countryside);
- 7.
What is the size of the advertising device and its location in the field of view;
- 8.
Whether there are also vertical traffic signs in the vicinity of the advertising device, or at what distance.
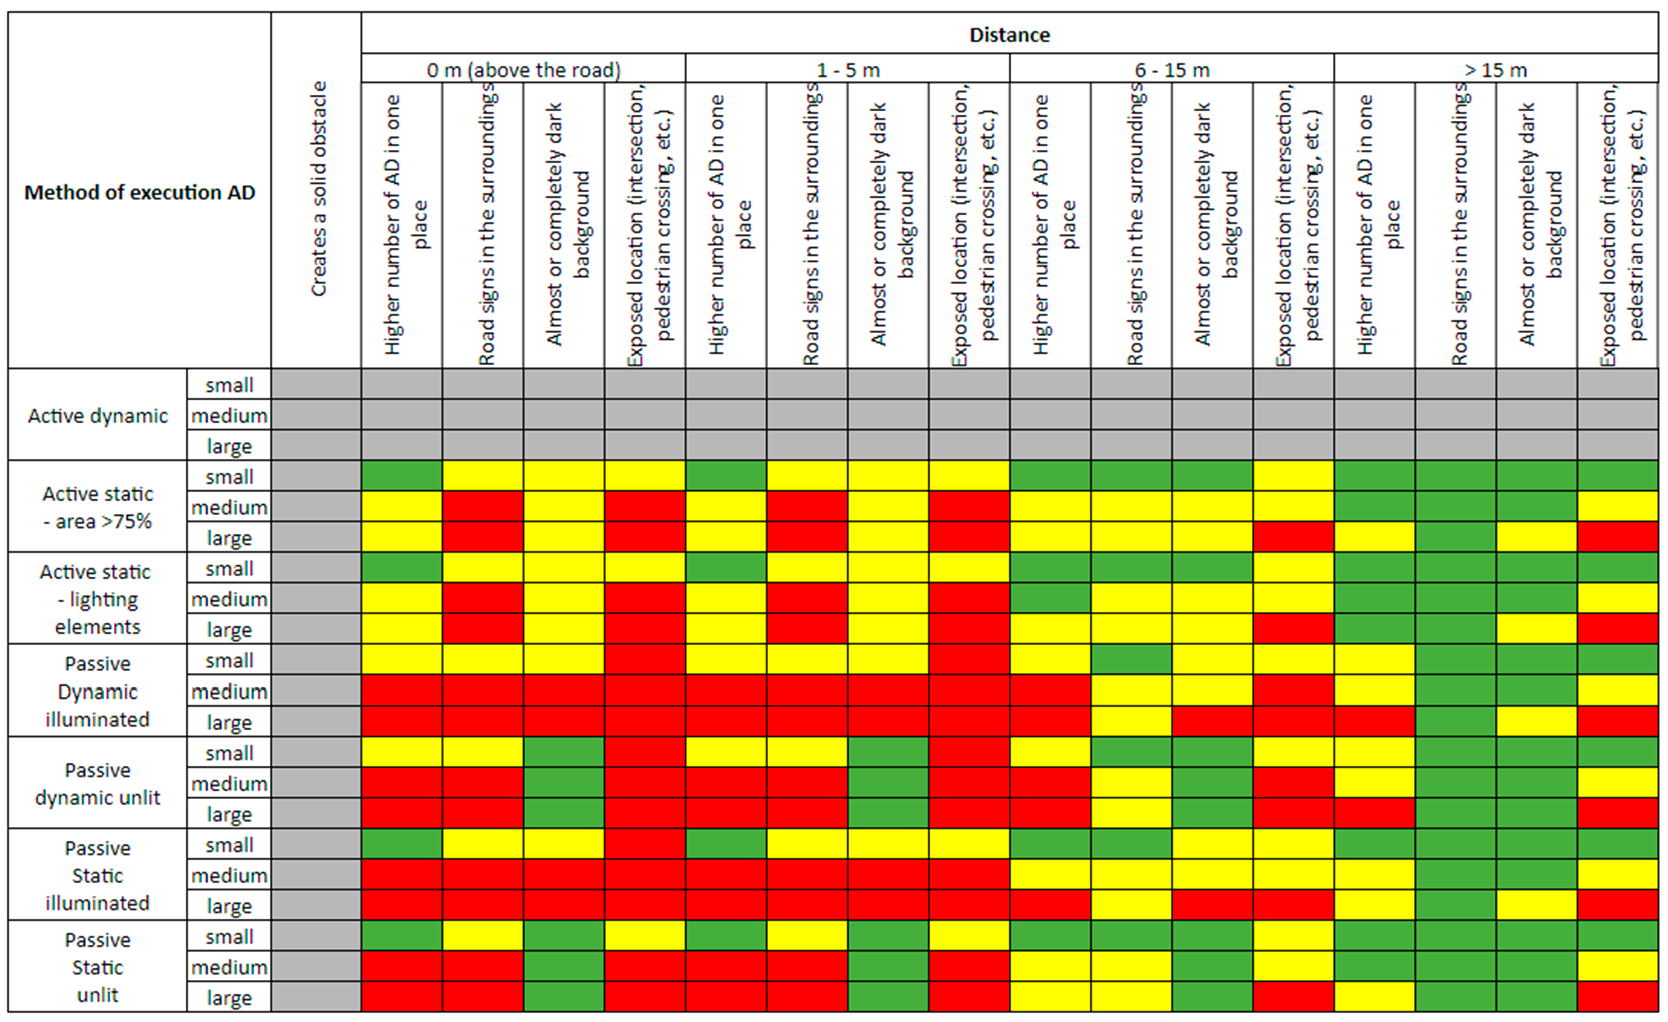
The resulting scale assessing the severity of the risks of individual advertising devices can be seen in
Table 3.
On the basis of this proposed risk scale, a final rating table for the riskiness of individual advertising devices was created (
Figure 7).
The color scale corresponds to the scale used in the advertising device severity scale, i.e., for a given advertising device type and distance, the factor determines the risk (black), problematic (red) or not suitable (yellow) severity for the advertising device, or the factor does not create severity (no risk, green).
For each of these factors, their separate impact was considered. In the case that a combination of these factors is present in the assessed advertising device, the resulting assessment should respect this fact. In this case, the assessment will be a summary of the severities, but all the specificities of the site must always be taken into account.
The severity scale of the advertising device was used to rate all the advertising devices found on the monitored road network in the Czech Republic. A total of 379 out of 4692 advertising devices were determined as risky, i.e., 8.08%. A total of 2329 advertising devices (49.64%) were found to be problematic, 1644 advertising devices (35.04%) were found to be not suitable and 340 advertising devices (7.25%) were counted as no risk.
7. Discussion
The paper presents a comprehensive classification procedure for assessing the influence of advertising devices on driver psychological behavior. The initial data sample used to obtain the results of the present work was based mainly on middle-aged drivers with regular driving experience. This group of people was also chosen because it is the most commonly represented percentage of active drivers.
Using a data sample of even less experienced drivers seems a good way to extend the existing research. This is mainly because a less experienced driver might have a longer visual fixation on the advertising device, as the driver is not as experienced in driving and thus might not be able to evaluate important traffic stimulations effectively enough.
Similar to a young driver with a lack of experience, a driver belonging to the oldest age group could show different, longer, time lags than those found in previous research. The reaction time of older drivers may no longer be fast enough and fixation on the advertising device could be longer. This may be due to both more significant visual indisposition and the brain’s ability to become aware of external sensations quickly enough or to filter them effectively.
Extended fixation of the eye on the advertising device can also be affected by driver tiredness or adverse weather conditions. The driver’s reactions are extended as it takes longer to concentrate on the object. It is also possible to calculate the resulting risk level for each monitored location by means of recorded conflict events between road users. In this way the relative conflict rate can be defined. The specific characteristics not only of roads (spatial layout, traffic layout, equipment, maximum speed limit) but also of advertising devices (method of display, specific parameters, position in relation to the road) may contain correlations between the nature of the area under study, including the advertising device, and the behavior of individual road users and the traffic flow as a whole.
Another potential extension of the research presented in this manuscript is the application of testing the predefined hypotheses and their subsequent validation. A method of how to verify these hypotheses could be the Bayesian dynamic modelling method presented in a study conducted in co-operation between Harbin Institute of Technology, China and The University of British Columbia, Canada [
44].
By comparing locations with and without the presence of advertising devices, it is possible to find a dependence of the increase in relative conflict in the case of advertising device location. However, this procedure cannot confirm that a relation between traffic conflict and the presence of advertising devices can be clearly demonstrated, as drivers may also be influenced by other distractions that occur frequently in road traffic, for example, in situations where the driver is on the phone, eating, drinking, or is affected by other distractions. To confirm this, however, it would be necessary to measure and investigate site-specific dependencies at a large sample of locations. This premise was discussed by the study regarding fatigue of the driver, inattention and aggressive driving [
45]. The results of the empirical analysis indicated that the influence of socio-demographic and behavioral factors on drivers’ perceptions and behavior may vary in traffic flow. Future analysis on this topic should be extended to take into account the specific behavior and current state of drivers, depending on age or physical or mental condition.
8. Conclusions
Road safety is a complex issue that is influenced by a number of factors. This research focuses on a selected segment of safety—advertising devices located near roads. The aim of the work was to introduce this issue and to evaluate the influence of advertising devices on road safety by currently available methods.
As part of the assessment of the direct impact on the driver, test drives were carried out to test attention in real traffic using the Wiener Fahrprobe structured observation method. At the same time, an advanced vehicle simulator was used to apply vehicle simulator theory and the principle of eye tracking, which was used in both real and virtual environment tests. These showed that, compared to the effect of conventional advertising devices, there was no objectively significant negative effect of the presence of dynamic advertising devices on the quality of driving (number and types of driving mistakes). In the case of distraction (number and duration of views of dynamic advertising devices) relative to the absolute number of advertising devices on the traveled route, it can be noted that these advertising devices had approximately 50% “viewership”, while passive illuminated large-format areas had only 25%. The average fixation time was also longer—for classic advertising device types it was 0.59 s in the real environment, while for dynamic advertising devices it was 0.76 s. In the simulated environment, the values were even higher.
In summary, the presence of advertising devices can in most cases have a negative impact on road safety due to the demonstrable distraction of the driver’s attention, particularly in situations of increased demands on the driver’s attention and decision-making, especially if they are dynamic advertising devices or if their content is interchangeable with road signs.
As a practical application, each advertising device was recorded in the database of the CEBASS system or Central Evidence of Road Safety Analysis [
34]. This is a system developed at the CTU in Prague, Faculty of Transportation Sciences in cooperation with the Road and Motorway Directorate of the Czech Republic. The application is used, among other purposes, for the processing of data obtained during road safety inspections and for their effective management, i.e., for the presentation of identified risks on the road network and their subsequent elimination. All the information on the advertising device in question has been categorized according to the workflow developed above for monitoring the characteristics and risks of the advertising device. The result of the work is the calculation of the amount of risk severity of each advertising device and the resulting risk level of each type of advertising device determined on the basis of the established correlations of the multicriteria assessment.


