Article

Evolutionary Game Analysis of Shared Manufacturing Quality Synergy under Dynamic Reward and Punishment Mechanism

1
School of Management, Xi’an University of Science and Technology, Xi’an 710054, China
2
School of Safety Science and Engineering, Xi’an University of Science and Technology, Xi’an 710054, China
*
Authors to whom correspondence should be addressed.
Appl. Sci. 2022, 12(13), 6792; https://doi.org/10.3390/app12136792
Submission received: 22 May 2022 / Revised: 25 June 2022 / Accepted: 2 July 2022 / Published: 5 July 2022

Abstract

:
Quality improvement is crucial for manufacturing, and existing research has paid less attention to the influence of regulatory factors and irrational factors of decision makers. Considering the impact of the reward and punishment strategy of the shared platform on quality decision-making, this paper introduces prospect theory and mental account theory into the process of multi-agent evolutionary game of shared manufacturing, constructs a co-evolutionary game model of shared manufacturing quality synergistic improvement under the dynamic reward and punishment mechanism, and analyzes the dynamic evolution law of each game agent. The research results show that: (1) The synergistic improvement of shared manufacturing quality is the consequence of the combined action of numerous interrelated and interacting factors, rather than the linear effect of a single element. (2) Although the combination of multiple incentive and punishment methods can significantly alter the effect of shared manufacturing quality synergy, there are certain effectiveness gaps. (3) The subsidy mechanism can effectively compensate for the effectiveness gap of the reward and punishment mechanism, and it can also strengthen the internal driving force of shared manufacturing quality coordination. The main management insights are as follows: (1) Consider strong external regulation to be the framework constraint, and positive internal control to be the detail specification. (2) Create a reliable reward and punishment mechanism and dynamically alter the intensity of rewards and penalties. (3) To close the effectiveness gap, strengthen the subsidy mechanism as an essential addition to the incentive and punishment mechanisms. This study can give a new reference path for quality improvement of shared manufacturing, allowing shared manufacturing to play a more constructive role in supporting the transformation and development of the manufacturing industry.

1. Introduction and Theoretical Assumptions

1.1. Introduction

With the rapid development of advanced information technology, Industry 4.0 and servitization continue to aid the sharing economy’s horizontal and vertical penetration into the manufacturing industry [1]; shared manufacturing is proposed and initially applied in practice. Shared manufacturing, an emerging smart manufacturing model [2], closely connects the supply and demand sides of manufacturing resources through big data matching, transforming idle manufacturing resources into “marketable” effective supply. Shared manufacturing, in contrast to other manufacturing models, is more interactive [3]. The roles of supply and demand players are temporary in the shared manufacturing model [4], individuals and businesses are allowed and encouraged to be both providers and consumers of services [1], and participants in shared manufacturing are intertwined in an active value co-creation [5]. This “role integration” provides new benefits to shared manufacturing value co-creation [6].
Quality, as the lifeblood of the manufacturing industry [7], is increasingly becoming the key to improving manufacturing enterprises’ core competitiveness. Shared manufacturing, an emerging intelligent manufacturing model, is still in its early stages of development, and its quality management process is highly uncertain [8], with issues such as low-quality level, difficulty in quality improvement, and uncertain product quality [9], particularly given that consumers are usually sensitive to the quality of shared products [10], which can pose a significant challenge to the industry if not handled properly. As a result, it has become an urgent issue for shared manufacturing to improve product quality levels in collaboration with each other by all shared manufacturing participants.
Since quality improvement and quality enhancement efforts are highly dynamic [11], many scholars have conducted extensive research on this topic using game theory. Based on a game model with the joint participation of manufacturers and supply sides, Xie et al. [12] discovered that quality improvement may reduce supply sides’ profits, causing supply sides to reject quality improvement strategies. Yang et al. [13] studied the evolutionary stabilization strategies of supply sides and producers using replicated dynamic equations, and the behavioral strategies were closely related to the input–output ratio, quality improvement effort cost, free-rider benefits, and initial strategies. Zhang et al. [14] built a service supply chain quality effort decision model with quality preferences and investigated the effect of quality preferences on quality improvement. The preceding studies examined the quality improvement problem from various perspectives, including cost sharing, quality gain, and quality preference, and provided ideas for this paper; however, the research objects of the preceding studies were mostly supply and demand sides, ignoring the influence of regulatory factors. It is well understood that the healthy development of shared manufacturing cannot be achieved without a shared manufacturing platform [15], and the shared platform’s strategy, as the internal regulator of shared manufacturing, has a significant impact on the quality improvement and quality improvement behaviors of both the supply and demand sides. As a result, this paper considers the impact of cost sharing on quality improvement, builds an evolutionary game model of shared manufacturing quality synergy using various reward and punishment mechanisms of shared platforms, and investigates a new path of shared manufacturing quality improvement.
Existing research has conclusively demonstrated that individual psychological characteristics influence behavioral decision-making [16]. Due to decision makers’ limited rationality and different psychological preferences, there are certain deviations in their perception of costs and benefits, making scientific explanation of decision behavior more difficult. The traditional evolutionary game, which is based on the classical expected utility theory [17], does not account for the fact that decision makers are easily influenced by psychological factors, and it ignores the possibility of decision makers’ value perception bias [18], resulting in an inability to explain decision-making behavior in complex scenarios. Kahneman et al. [19] proposed a prospect theory with higher explanatory validity for behavioral decisions to further investigate the influence of decision makers’ perception bias on decision behavior. Following that, a wide range of scholars [20,21,22] used prospect theory to further investigate and analyze decision behavior in various domains. Thale et al. [23] proposed a psychological account theory based on prospect theory in a subsequent study, arguing that behavioral decisions occur after one’s own comparison of gains and losses, further enriching the research basis of behavioral decisions.
In summary, prospect theory (PT) and mental account theory (MA) provide a more reasonable explanation and analysis of behavioral decisions from a variety of perspectives, including cost-benefit and perceived bias. At the same time, due to the high compatibility of prospect theory and psychological account theory with evolutionary game theory, evolutionary game analysis incorporating prospect theory and psychological account theory can provide a more scientific and accurate picture of decision makers’ behavioral evolution. As a result, this paper develops an evolutionary game model of shared manufacturing quality synergistic improvement, based on PT MA theory, investigates decision makers’ quality synergy behavior under various reward and punishment mechanisms, and investigates the synergistic improvement path of shared manufacturing quality level. This study can give a new reference path for quality improvement of shared manufacturing, allowing shared manufacturing to play a more constructive role in supporting the transformation and development of the manufacturing industry.

1.2. Theoretical Assumptions

Prospect theory is used to characterize decision-makers’ decision-making behavior in uncertain settings based on risk predictions. Prospect theory, in contrast to traditional anticipated utility theory, thinks that decision makers are bounded rational, concentrating on and characterizing illogical conduct in behavioral decision-making, which is an important study result of behavioral economics. Prospect theory contains the following elements: (1) Determination effect. When presented with certain rewards, decision makers will exhibit some risk aversion. (2) The refraction effect. When confronted with two options, most decision makers will take on additional risk in order to maximize their rewards. (3) Reference reliance. The relative utility level achieved according to a certain reference point influences the decision-making utility of the decision maker, not the absolute utility level. (4) Aversion to loss. Most decision makers are more sensitive to losses than to equal-sized profits. (5) Decision weights that are nonlinear. In the process of behavioral decision-making, most decision-makers will translate the likelihood of occurrences into a nonlinear decision weight, overestimating the occurrence of low-probability events and underestimating the occurrence of high-probability events.
The Prospect function is represented by V , whose formula is as follows [19]: V = T ( Δ π ) w ( ε ) .
Here: T ( Δ π ) represents the value function, Δ π represents the difference between the perceived value and the reference point, w ( ε ) represents the decision function, ε represents the probability and the decision function has the following properties: w ( 0 ) = 0 , w ( 1 ) = 1 , lim ε 0   w ( ε ) > ε , lim ε 1   w ( ε ) < ε .
Decision makers divide wealth into multiple accounts for psychological management, and each accounts have distinct accounting systems and psychological calculation rules, and make psychological decisions based on the incidence of irrational decision-making behaviors. explained. This study begins with the “cost-benefit” of behavior and, using the theory of mental accounts, divides it into a valence account that controls benefits and a cost account that manages costs, based on the difference in perception of gains and losses by decision makers. Both the valence and cost accounts have associated reference points and value functions that represent the relative benefit and relative cost perceptions that influence behavioral decision-making.
The valence account and cost account functions are expressed as follows [24]:
P ( x ) = { ( x U 0 ) β , x U 0 λ ( U 0 x ) θ , x < U 0
C ( x ) = { δ ( x U 1 ) υ , x U 1 ( U 1 x ) σ , x < U 1
P ( x ) represents the value function of the valence account, λ represents the sensitivity to valence loss aversion, U 0 represents the valence reference point, β , θ represents the risk preference coefficient when the valence is relative to gain-loss; C ( x ) represents the value function of the cost account, δ represents the sensitivity to cost loss aversion degree, ν , σ represents the risk preference coefficient when the cost is relative to the loss-benefit, and U 1 represents the cost reference point.
The decision weight function is expressed as follows [25]:
w ± ( ε ) = ε ι [ ε ι + ( 1 ± ε ) ι ] 1 ι
Here, ± represents the valence or cost, ι represents the decision sensitivity coefficient.
To summarize, the evolutionary game based on PT MA theory differs from standard evolutionary games in two major ways:
(1)
Unlike the expected utility theory, the evolutionary game based on the PT MA theory introduces a novel approach of calculating utility by including the decision maker’s reference effect, risk preference, and other subjective considerations into the utility calculation.
(2)
Non-linear handling of decision weights.
As a result, evolutionary game analysis based on PT MA theory can, to some extent, overcome the shortcomings of traditional game theory in the irrational dimension in theory and practice, and can more objectively and accurately describe the subjective factors of each participant in shared manufacturing influence on behavioral decisions.

2. Game Model Construction

2.1. Basic Assumptions

Assumption 1.
The supply side, demand side, and shared platform are the three key players in the three-party game of shared manufacturing quality synergy. In the game process, each subject is rationally constrained and adheres to the value perception function. Each game subject’s behavior plan is determined by their own value perception rather than real utility. The supply side strategic decision can be separated into (quality improvement, no quality improvement); the demand side strategic choice can be divided into (cost sharing, no cost sharing); and the shared platform strategic option can be divided into (active supervision, passive supervision).
Assumption 2.
The behavioral strategy choices of the supply side and the demand side have complementary effects. The stability of quality synergy can be guaranteed if and only if both supply sides choose positive behaviors, i.e., quality improvement, cost sharing; otherwise, quality hazards would occur. The quality risk will be passed from the passive strategy chooser to the active strategy chooser according to the risk transfer principle. According to the risk spillover principle, the shared platform serves as the internal supervisor of the shared production model, and quality risk is transferred from both supply sides to the shared platform.
Assumption 3.
When the supply side improves quality, the quality of the shared-manufactured products improves to some extent, and the product value also increases to some extent; when the supply side does not improve quality, the quality of the shared-manufactured products improves according to the quality of “advance or retreat”. There will be some deterioration, and the product value will also fall to some amount. To encourage supply sides’ passion for quality improvement, the shared platform decides to reward or penalize supply sides based on their tactics, with a defined quantity of rewards and penalties.

2.2. Model Construction

The cost and valence created throughout the process of behavioral decision-making are sorted and summarized into matching accounts and handled by independent computing procedures, according to the PT_MA theory. Table 1 depicts the benefit perception matrix.
The specific parameter settings of the benefit perception matrix are shown in Table 2.

3. Model Analysis under the Static Reward and Punishment Mechanism

3.1. Analysis of Supply Side Strategy Stability

The value perception of “quality improvement” and “no quality improvement” in the supply side are T 1 p and T 2 p , respectively.
T 1 p = T ( Δ π ) w ( ε ) = w ( e ) [ w ( g ) ( P ( H a + H b + R ) C ( ( 1 K ) C p h ) ) + w ( 1 g ) ( P ( H a + H b ) C ( ( 1 K ) C p h ) ) ] + w ( 1 e ) [ w ( g ) ( P ( H a + H b + R ) C ( C p h + ϕ ψ L w ( q ) ) ) + w ( 1 g ) ( P ( H a + H b ) C ( C p h + ϕ ψ L w ( q ) ) ) ]
T 2 p = T ( Δ π ) w ( ε ) = w ( e ) [ w ( g ) ( P ( K C p h ) C ( F + ψ L w ( q ) ) ) + w ( 1 g ) ( P ( K C p h ) C ( ψ L w ( q ) ) ) ] + w ( 1 e ) [ w ( g ) ( C ( F + L w ( q ) ) ) + w ( 1 g ) ( C ( L w ( q ) ) ) ]
The average value perception of supply side is T p ¯ .
T p ¯ = p T 1 p + ( 1 p ) T 2 p
The dynamic equation of supply side replication is F ( p ) .
F ( p ) = d p / d t = p ( T 1 p T p ¯ ) = p ( 1 p ) ( T 1 p T 2 p ) = p ( 1 p ) { w ( e ) [ w ( g ) ( P ( H a + H b + R ) C ( ( 1 K ) C p h ) ) + w ( 1 g ) ( P ( H a + H b ) C ( ( 1 K ) C p h ) ) ] w ( e ) [ w ( g ) ( P ( K C p h ) C ( F + ψ L w ( q ) ) ) + w ( 1 g ) ( P ( K C p h ) C ( ψ L w ( q ) ) ) ] + w ( 1 e ) [ w ( g ) ( P ( H a + H b + R ) C ( C p h + ϕ ψ L w ( q ) ) ) + w ( 1 g ) ( P ( H a + H b ) C ( C p h + ϕ ψ L w ( q ) ) ) ] w ( 1 e ) [ w ( g ) ( C ( F + L w ( q ) ) ) + w ( 1 g ) ( C ( L w ( q ) ) ) ] }
For the convenience of calculation, the simplified formula is:
F ( p ) = p ( 1 p ) [ w ( e ) A + w ( 1 e ) B ]
Parameter A represents the difference between the supply side quality improvement value function and the non-quality improvement value function when the demand side cost is allocated; parameter B represents the difference between the supply side quality improvement value function and the non-quality improvement value function when the demand side cost is not allocated.
Proposition 1.
To find the partial derivative of the supply side replica dynamic equation, there are the following relationships:
F ( p ) H a > 0 , F ( p ) H b > 0 , F ( p ) C p h < 0 , F ( p ) F > 0 , F ( p ) R > 0 .
According to Proposition 1, the probability of supply side quality improvement is positively correlated with the loss reduced by quality improvement, the increased benefit, the reward and punishment of the shared platform, and is negatively correlated with the perceived labor cost of quality improvement. The supply side’s ultimate stability strategy in the shared manufacturing mode is quality improvement, which is achieved by enhancing the loss and the increased income of quality improvement, the reward and punishment of the shared platform, and the perception of labor cost of quality improvement.

3.2. Stability Analysis of Demand Side Strategy

The value perception of “cost sharing” and “no cost sharing” in the demand side are T 1 e and T 2 e , respectively.
T 1 e = T ( Δ π ) w ( ε ) = w ( p ) [ P ( H d ( Q b Q a ) ) C ( K C p h ) ] + w ( 1 p ) [ C ( k C p h + H d ( Q a Q c ) + ϕ ψ L w ( q ) ) ]
T 2 e = T ( Δ π ) w ( ε ) = w ( p ) [ P ( H d ( Q b Q a ) ) C ( ψ L w ( q ) ) ] + w ( 1 p ) [ C ( H d ( Q a Q c ) + L w ( q ) ) ]
The average value perception of demand side is T e ¯ .
T e ¯ = e T 1 e + ( 1 e ) T 2 e
The dynamic equation of demand side replication is F ( e ) .
F ( e ) = d e / d t = e ( T 1 e T e ¯ ) = e ( 1 e ) ( T 1 e T 2 e ) = e ( 1 e ) { w ( p ) [ P ( H d ( Q b Q a ) ) C ( K C p h ) ] w ( p ) [ P ( H d ( Q b Q a ) ) C ( ψ L w ( q ) ) ] + w ( 1 p ) [ C ( k C p h + H d ( Q a Q c ) + ϕ ψ L w ( q ) ) ] w ( 1 p ) [ C ( H d ( Q a Q c ) + L w ( q ) ) ] }
For the convenience of calculation, the simplified formula is:
F ( e ) = e ( 1 e ) [ w ( p ) E + w ( 1 p ) F ]
The parameter E represents the difference between the demand side cost-sharing value function and the non-cost-sharing value function when the supply side quality is improved; the parameter F represents the demand side cost-sharing value function and the non-cost-sharing value function when the supply side does not improve quality.
Proposition 2.
To find the partial derivative of the demand side replica dynamic equation, there are the following relationships:
F ( e ) H d > 0 , F ( e ) Q b Q a > 0 , F ( e ) Q a Q c > 0 , F ( e ) ϕ > 0 , F ( e ) L > 0 .
According to Proposition 2, the probability of the demand side participating in quality synergy is positively correlated with unit profit/loss, product quality increase when quality is improved, product quality reduction when quality is not improved, quality accident risk, and quality risk transfer coefficient. The final demand side’s stability strategy in the shared manufacturing mode is to participate in quality synergy by increasing unit revenue/loss, product quality increment when quality is improved, product quality reduction when quality is not improved, quality accident risk, and the quality risk transfer coefficient.

3.3. Stability Analysis of Shared Platform Strategy

The value perception of “positive regulation” and “negative regulation” in the shared platform are T 1 g and T 2 g , respectively.
T 1 g = T ( Δ π ) w ( ε ) = w ( p ) [ w ( e ) ( P ( H c ) C ( C g h + R ) ) + w ( 1 e ) ( P ( H c ) C ( C g h + α L + R ) ) ] + w ( 1 p ) [ w ( e ) ( P ( H c + F ) C ( C g h + α L ) ) + w ( 1 e ) ( P ( H c + F ) C ( C g h + L ) ) ]
T 2 g = T ( Δ π ) w ( ε ) = w ( p ) [ w ( 1 e ) ( C ( α L ) ) ] + w ( 1 p ) [ w ( e ) ( C ( α L ) ) + w ( 1 e ) ( C ( L ) ) ]
The average value perception of demand side is T g ¯ .
T g ¯ = g T 1 g + ( 1 g ) T 2 g
The dynamic equation of shared platform replication is F ( g ) .
F ( g ) = d g / d t = g ( T 1 g T g ¯ ) = g ( 1 g ) ( T 1 g T 2 g ) = g ( 1 g ) { w ( p ) [ w ( e ) ( P ( H c ) C ( C g h + R ) ) + w ( 1 e ) ( P ( H c ) C ( C g h + α L + R ) ) ] w ( p ) [ w ( 1 e ) ( C ( α L ) ) ] + w ( 1 p ) [ w ( e ) ( P ( H c + F ) C ( C g h + α L ) ) + w ( 1 e ) ( P ( H c + F ) C ( C g h + L ) ) ] w ( 1 p ) [ w ( e ) ( C ( α L ) ) + w ( 1 e ) ( C ( L ) ) ] }
For the convenience of calculation, the simplified formula is:
F ( g ) = g ( 1 g ) [ w ( p ) M + w ( 1 p ) N ]
The parameter M represents the difference between the platform’s active supervision value function and the passive supervision value function when the quality of the supply side is improved; the parameter N represents the difference between the platform’s active supervision value function and the passive supervision value function when the supply side does not improve quality.
Proposition 3.
To find the partial derivative of the shared platform replica dynamic equation, there are the following relationships:
F ( g ) H c > 0 ,   F ( g ) α > 0 ,   F ( g ) C g h < 0 ,   F ( g ) L > 0 ,   F ( g ) F > 0 .
According to Proposition 3, the probability of active supervision of a shared platform is positively correlated with the perceived benefit of active supervision, the spillover coefficient of quality risk, the risk of quality accidents, and the severity of punishment, and negatively correlated with the perceived labor cost of active supervision. In the shared manufacturing mode, the final stability strategy of the shared platform is active supervision, which improves the perception of benefits, quality risk spillover coefficient, quality accident risk, and punishment of active supervision while decreasing the perception of labor costs of active supervision.

3.4. Stability Analysis of Strategy Portfolio

From Equation (4), it follows that the supply side can achieve local stability by choosing the strategy of quality improvement when p = 0 , p = 1 .
From Equation (9), it follows that the demand side can achieve local stability by choosing the strategy of cost sharing when e = 0 , e = 1 .
From Equation (13), it follows that the shared platform can achieve local stability by choosing the strategy of positive regulation when g = 0 , g = 1 .
It can be seen that the eight local equilibrium points of the system evolution are:
E 1 ( 0 , 0 , 0 ) ,   E 2 ( 1 , 0 , 0 ) ,   E 3 ( 0 , 1 , 0 ) ,   E 4 ( 0 , 0 , 1 ) ,   E 5 ( 1 , 1 , 0 ) ,   E 6 ( 1 , 0 , 1 ) ,   E 7 ( 0 , 1 , 1 ) ,   E 8 ( 1 , 1 , 1 ) .
According to Lyapunov’s first law, the Jacobian matrix of the replica dynamic system is:
J = [ F ( p ) / p F ( p ) / e F ( p ) / g F ( e ) / p F ( e ) / e F ( e ) / g F ( g ) / p F ( g ) / e F ( g ) / g ]
The stability analysis of the strategy combination is shown in Table 3.

3.5. Analysis of Results

According to the stability analysis of the strategy combination in 3.4, the local equilibrium points E 1 ( 0 , 0 , 0 ) , E 2 ( 1 , 0 , 0 ) , E 3 ( 0 , 1 , 0 ) , E 4 ( 0 , 0 , 1 ) , E 5 ( 1 , 1 , 0 ) , E 6 ( 1 , 0 , 1 ) , E 7 ( 0 , 1 , 1 ) and E 8 ( 1 , 1 , 1 ) are all saddle points, and certain conditions must be met to become the stable points of the system. Under the assumption of unconstrained constraints, it is clear that there is no equilibrium point in the shared system. In terms of shared manufacturing practice, it is difficult for decision makers to make theoretically optimal behavioral decisions due to bounded rationality and different risk attitudes of decision makers, resulting in systematic deviations in the behavior of shared participants, and it is difficult for the shared system to achieve the optimal state.
This paper examines the non-theoretical optimal behavior decision of decision makers and the non-optimal state of shared systems from the perspective of “cost-benefit” from the perspective of valence-cost perception bias, reference dependence, risk preference, and so on. A detailed explanation is provided below.
(1)
Valence-cost perception bias
The valence perception of supply side quality improvement, demand side cost sharing, and active shared platform supervision is often lower than that of its opposing behavior in the shared manufacturing quality synergy model; supply side quality improvement, demand side cost sharing, and active shared platform supervision’s cost perception is often higher than that of its opposing behavior. The choice of behavioral decision-making is the consequence of balancing the advantages and negatives in terms of valence-perceived bias, but the appearance of the free-rider strategy choice will disrupt this condition. When the cost is shared by the supply side, the supply side can choose not to increase the quality in order to get “extra income,” and the demand side can choose not to pay the cost when the supply side’s quality is improved in order to reap the advantages. To save money on self-discipline, adopt passive supervision. In terms of cost-perceived variation, the shared platform dynamically matches the supply and demand sides based on big data and sophisticated algorithms in the shared manufacturing mode, and this dynamic matching process has higher uncertainty. Because the creation, distribution, and consumption of shared services are synchronous operations, the shared platform must establish a more flexible and responsive supply chain than the traditional supply chain, and the supply and demand sides must work harder to match resource supply and demand.
(2)
Reference dependency
Prospect theory holds that before making a choice, people will select a reference point and then evaluate the difference between the behavioral result and the reference point. The Mental Accounts Theory splits the behavioral reference point further on this basis into a valence reference point and a cost reference point. Because of the existence of the reference effect, the establishment of distinct reference points for different actions will result in varied assessment outcomes for the same conduct, influencing behavior choice. For example, the perception of loss reduced by the quality improvement of the supply side is H a = 4 , when the reference point of valence perception is U 0 = 1 , the perception of relative gain of the supply side to the quality improvement is Δ 1 = H a U 0 = 4 1 = 3 ; when the reference point of valence perception is U 0 = 1.5 , the perception of relative gain of the supply side to the improvement of quality is Δ 2 = H a     U 0 = 4 1.5 = 2.5 . Because of Δ 2 < Δ 1 , when the valence perception reference point is U 0 = 1.5 , the relative benefit perception of quality improvement by the supply side is low, and the convenience of supply will reduce the choice of quality improvement behavior. The specific mechanism by which the reference point change affects the decision-maker’s behavioral choice will be discussed in detail in the simulation analysis part of this paper.
(3)
Risk appetite
Prospect theory holds that before making a choice, people will select a reference point and then evaluate the difference between the behavioral result and the reference point. The Mental Accounts Theory splits the behavioral reference point further on this basis into a valence reference point and a cost reference point. Because of the existence of the reference effect, the establishment of distinct reference points for different actions will result in varied assessment outcomes for the same conduct, influencing behavior choice. The risk preference coefficient of valence is relatively large at this time, and the sensitivity of valence loss aversion is small; the cost-aware scenario, will show more risk preference; at this time, the risk preference coefficient is larger when the cost is relative to the loss-return, and the sensitivity of cost loss avoidance is smaller.

4. Model Analysis under the Dynamic Reward and Punishment Mechanism

Under the static reward and punishment strategy scenario, the decision-making body’s strategy choice is not always theoretically optimal, and the decision-making system does not reach the ideal state. As a result, an optimized dynamic reward and punishment strategy is introduced, and the punishment and reward execution strategy is modified. It is assumed that the platform’s reward and punishment policies for the supply side are related to the supply side’s strategy choice, that is, the strength of the shared platform’s reward and punishment policies and the improvement of the supply side’s quality. The probability is proportional. The reward R and punishment F amount is optimized from the original fixed constant, (assuming this is the highest reward and punishment amount) to a dynamic linear function R ( p ) = p R , F ( p ) = ( 1 p ) F . The reward and punishment strategies are combined in pairs to study the behavioral decision-making rules of each game subject under three different reward and punishment strategies: (static reward, dynamic punishment), (dynamic reward, static punishment), (dynamic reward, dynamic punishment).

4.1. Static Rewards and Dynamic Penalties

Assuming that the punishment strategy of the shared platform to the supply side is related to the strategy choice of the supply side, that is, let the punishment of the shared platform to the supply side be F ( p ) = ( 1 p ) F , and the reward is still a fixed constant R . In the scenario of static reward and dynamic punishment strategy of shared platform, the three-dimensional evolutionary game analysis of supply side, demand side and shared platform is as follows.
The supply side replication dynamic equation is F ( p ) .
F ( p ) = d p / d t = p ( T 1 p T p ¯ ) = p ( 1 p ) ( T 1 p T 2 p ) = p ( 1 p ) { w ( e ) [ w ( g ) ( P ( H a + H b + R ) C ( ( 1 K ) C p h ) ) + w ( 1 g ) ( P ( H a + H b ) C ( ( 1 K ) C p h ) ) ] w ( e ) [ w ( g ) ( P ( K C p h ) C ( ( 1 p ) F + ψ L w ( q ) ) ) + w ( 1 g ) ( P ( K C p h ) C ( ψ L w ( q ) ) ) ] + w ( 1 e ) [ w ( g ) ( P ( H a + H b + R ) C ( C p h + ϕ ψ L w ( q ) ) ) + w ( 1 g ) ( P ( H a + H b ) C ( C p h + ϕ ψ L w ( q ) ) ) ] w ( 1 e ) [ w ( g ) ( C ( ( 1 p ) F + L w ( q ) ) ) + w ( 1 g ) ( C ( L w ( q ) ) ) ] }
The demand side replica dynamic equation is F ( e ) .
F ( e ) = d e / d t = e ( T 1 e T e ¯ ) = e ( 1 e ) ( T 1 e T 2 e ) = e ( 1 e ) { w ( p ) [ P ( H d ( Q b Q a ) ) C ( K C p h ) ] w ( p ) [ P ( H d ( Q b Q a ) ) C ( ψ L w ( q ) ) ] + w ( 1 p ) [ C ( k C p h + H d ( Q a Q c ) + ϕ ψ L w ( q ) ) ] w ( 1 p ) [ C ( H d ( Q a Q c ) + L w ( q ) ) ] }
The dynamic equation of the shared platform replica is F ( g ) .
F ( g ) = d g / d t = g ( T 1 g T g ¯ ) = g ( 1 g ) ( T 1 g T 2 g ) = g ( 1 g ) { w ( p ) [ w ( e ) ( P ( H c ) C ( C g h + R ) ) + w ( 1 e ) ( P ( H c ) C ( C g h + α L + R ) ) ] w ( p ) [ w ( 1 e ) ( C ( α L ) ) ] + w ( 1 p ) [ w ( e ) ( P ( H c + ( 1 p ) F ) C ( C g h + α L ) ) + w ( 1 e ) ( P ( H c + ( 1 p ) F ) C ( C g h + L ) ) ] w ( 1 p ) [ w ( e ) ( C ( α L ) ) + w ( 1 e ) ( C ( L ) ) ] }

4.2. Dynamic Rewards and Static Penalties

Assuming that the reward strategy of the shared platform to the supply side is related to the strategy choice of the supply side, that is, the reward of the shared platform to the supply side is set as R ( p ) = p R , and the penalty is still a fixed constant F . In the scenario of dynamic reward and static punishment strategy of shared platform, the three-dimensional evolutionary game analysis of supply side, demand side, and shared platform is as follows.
The supply side replication dynamic equation is F ( p ) .
F ( p ) = d p / d t = p ( T 1 p T p ¯ ) = p ( 1 p ) ( T 1 p T 2 p ) = p ( 1 p ) { w ( e ) [ w ( g ) ( P ( H a + H b + p R ) C ( ( 1 K ) C p h ) ) + w ( 1 g ) ( P ( H a + H b ) C ( ( 1 K ) C p h ) ) ] w ( e ) [ w ( g ) ( P ( K C p h ) C ( F + ψ L w ( q ) ) ) + w ( 1 g ) ( P ( K C p h ) C ( ψ L w ( q ) ) ) ] + w ( 1 e ) [ w ( g ) ( P ( H a + H b + p R ) C ( C p h + ϕ ψ L w ( q ) ) ) + w ( 1 g ) ( P ( H a + H b ) C ( C p h + ϕ ψ L w ( q ) ) ) ] w ( 1 e ) [ w ( g ) ( C ( F + L w ( q ) ) ) + w ( 1 g ) ( C ( L w ( q ) ) ) ] }
The demand side replica dynamic equation is F ( e ) .
F ( e ) = d e / d t = e ( T 1 e T e ¯ ) = e ( 1 e ) ( T 1 e T 2 e ) = e ( 1 e ) { w ( p ) [ P ( H d ( Q b Q a ) ) C ( K C p h ) ] w ( p ) [ P ( H d ( Q b Q a ) ) C ( ψ L w ( q ) ) ] + w ( 1 p ) [ C ( k C p h + H d ( Q a Q c ) + ϕ ψ L w ( q ) ) ] w ( 1 p ) [ C ( H d ( Q a Q c ) + L w ( q ) ) ] }
The dynamic equation of the shared platform replica is F ( g ) .
F ( g ) = d g / d t = g ( T 1 g T g ¯ ) = g ( 1 g ) ( T 1 g T 2 g ) = g ( 1 g ) { w ( p ) [ w ( e ) ( P ( H c ) C ( C g h + p R ) ) + w ( 1 e ) ( P ( H c ) C ( C g h + α L + p R ) ) ] w ( p ) [ w ( 1 e ) ( C ( α L ) ) ] + w ( 1 p ) [ w ( e ) ( P ( H c + F ) C ( C g h + α L ) ) + w ( 1 e ) ( P ( H c + F ) C ( C g h + L ) ) ] w ( 1 p ) [ w ( e ) ( C ( α L ) ) + w ( 1 e ) ( C ( L ) ) ] }

4.3. Dynamic Rewards and Punishments

It is assumed that the reward and punishment strategies of the shared platform to the supply side are related to the strategy choice of the supply side, that is, the reward and punishment of the shared platform to the supply side are set as R ( p ) = p R , F ( p ) = ( 1 p ) F . Under the dynamic reward and punishment strategy scenario of the shared platform, the three-dimensional evolutionary game analysis of the supply side, the demand side, and the shared platform is as follows.
The supply side replication dynamic equation is F ( p ) .
F ( p ) = d p / d t = p ( T 1 p T p ¯ ) = p ( 1 p ) ( T 1 p T 2 p ) = p ( 1 p ) { w ( e ) [ w ( g ) ( P ( H a + H b + p R ) C ( ( 1 K ) C p h ) ) + w ( 1 g ) ( P ( H a + H b ) C ( ( 1 K ) C p h ) ) ] w ( e ) [ w ( g ) ( P ( K C p h ) C ( ( 1 p ) F + ψ L w ( q ) ) ) + w ( 1 g ) ( P ( K C p h ) C ( ψ L w ( q ) ) ) ] + w ( 1 e ) [ w ( g ) ( P ( H a + H b + p R ) C ( C p h + ϕ ψ L w ( q ) ) ) + w ( 1 g ) ( P ( H a + H b ) C ( C p h + ϕ ψ L w ( q ) ) ) ] w ( 1 e ) [ w ( g ) ( C ( ( 1 p ) F + L w ( q ) ) ) + w ( 1 g ) ( C ( L w ( q ) ) ) ] }
The demand side replica dynamic equation is F ( e ) .
F ( e ) = d e / d t = e ( T 1 e T e ¯ ) = e ( 1 e ) ( T 1 e T 2 e ) = e ( 1 e ) { w ( p ) [ P ( H d ( Q b Q a ) ) C ( K C p h ) ] w ( p ) [ P ( H d ( Q b Q a ) ) C ( ψ L w ( q ) ) ] + w ( 1 p ) [ C ( k C p h + H d ( Q a Q c ) + ϕ ψ L w ( q ) ) ] w ( 1 p ) [ C ( H d ( Q a Q c ) + L w ( q ) ) ] }
The dynamic equation of the shared platform replica is F ( g ) .
F ( g ) = d g / d t = g ( T 1 g T g ¯ ) = g ( 1 g ) ( T 1 g T 2 g ) = g ( 1 g ) { w ( p ) [ w ( e ) ( P ( H c ) C ( C g h + p R ) ) + w ( 1 e ) ( P ( H c ) C ( C g h + α L + p R ) ) ] w ( p ) [ w ( 1 e ) ( C ( α L ) ) ] + w ( 1 p ) [ w ( e ) ( P ( H c + ( 1 p ) F ) C ( C g h + α L ) ) + w ( 1 e ) ( P ( H c + ( 1 p ) F ) C ( C g h + L ) ) ] w ( 1 p ) [ w ( e ) ( C ( α L ) ) + w ( 1 e ) ( C ( L ) ) ] }

5. Simulation Analysis

In order to more intuitively show the influence of key elements on the behavior evolution of supply side, demand side, and shared platform, take Mould Lao, a typical benchmark enterprise of shared manufacturing in China as an example. Some parameters refer to the random experimental data of [25,26], and use MATLAB R2020b to simulate the evolution trajectory of each game party.
The initial settings of the parameters are shown in Table 4.

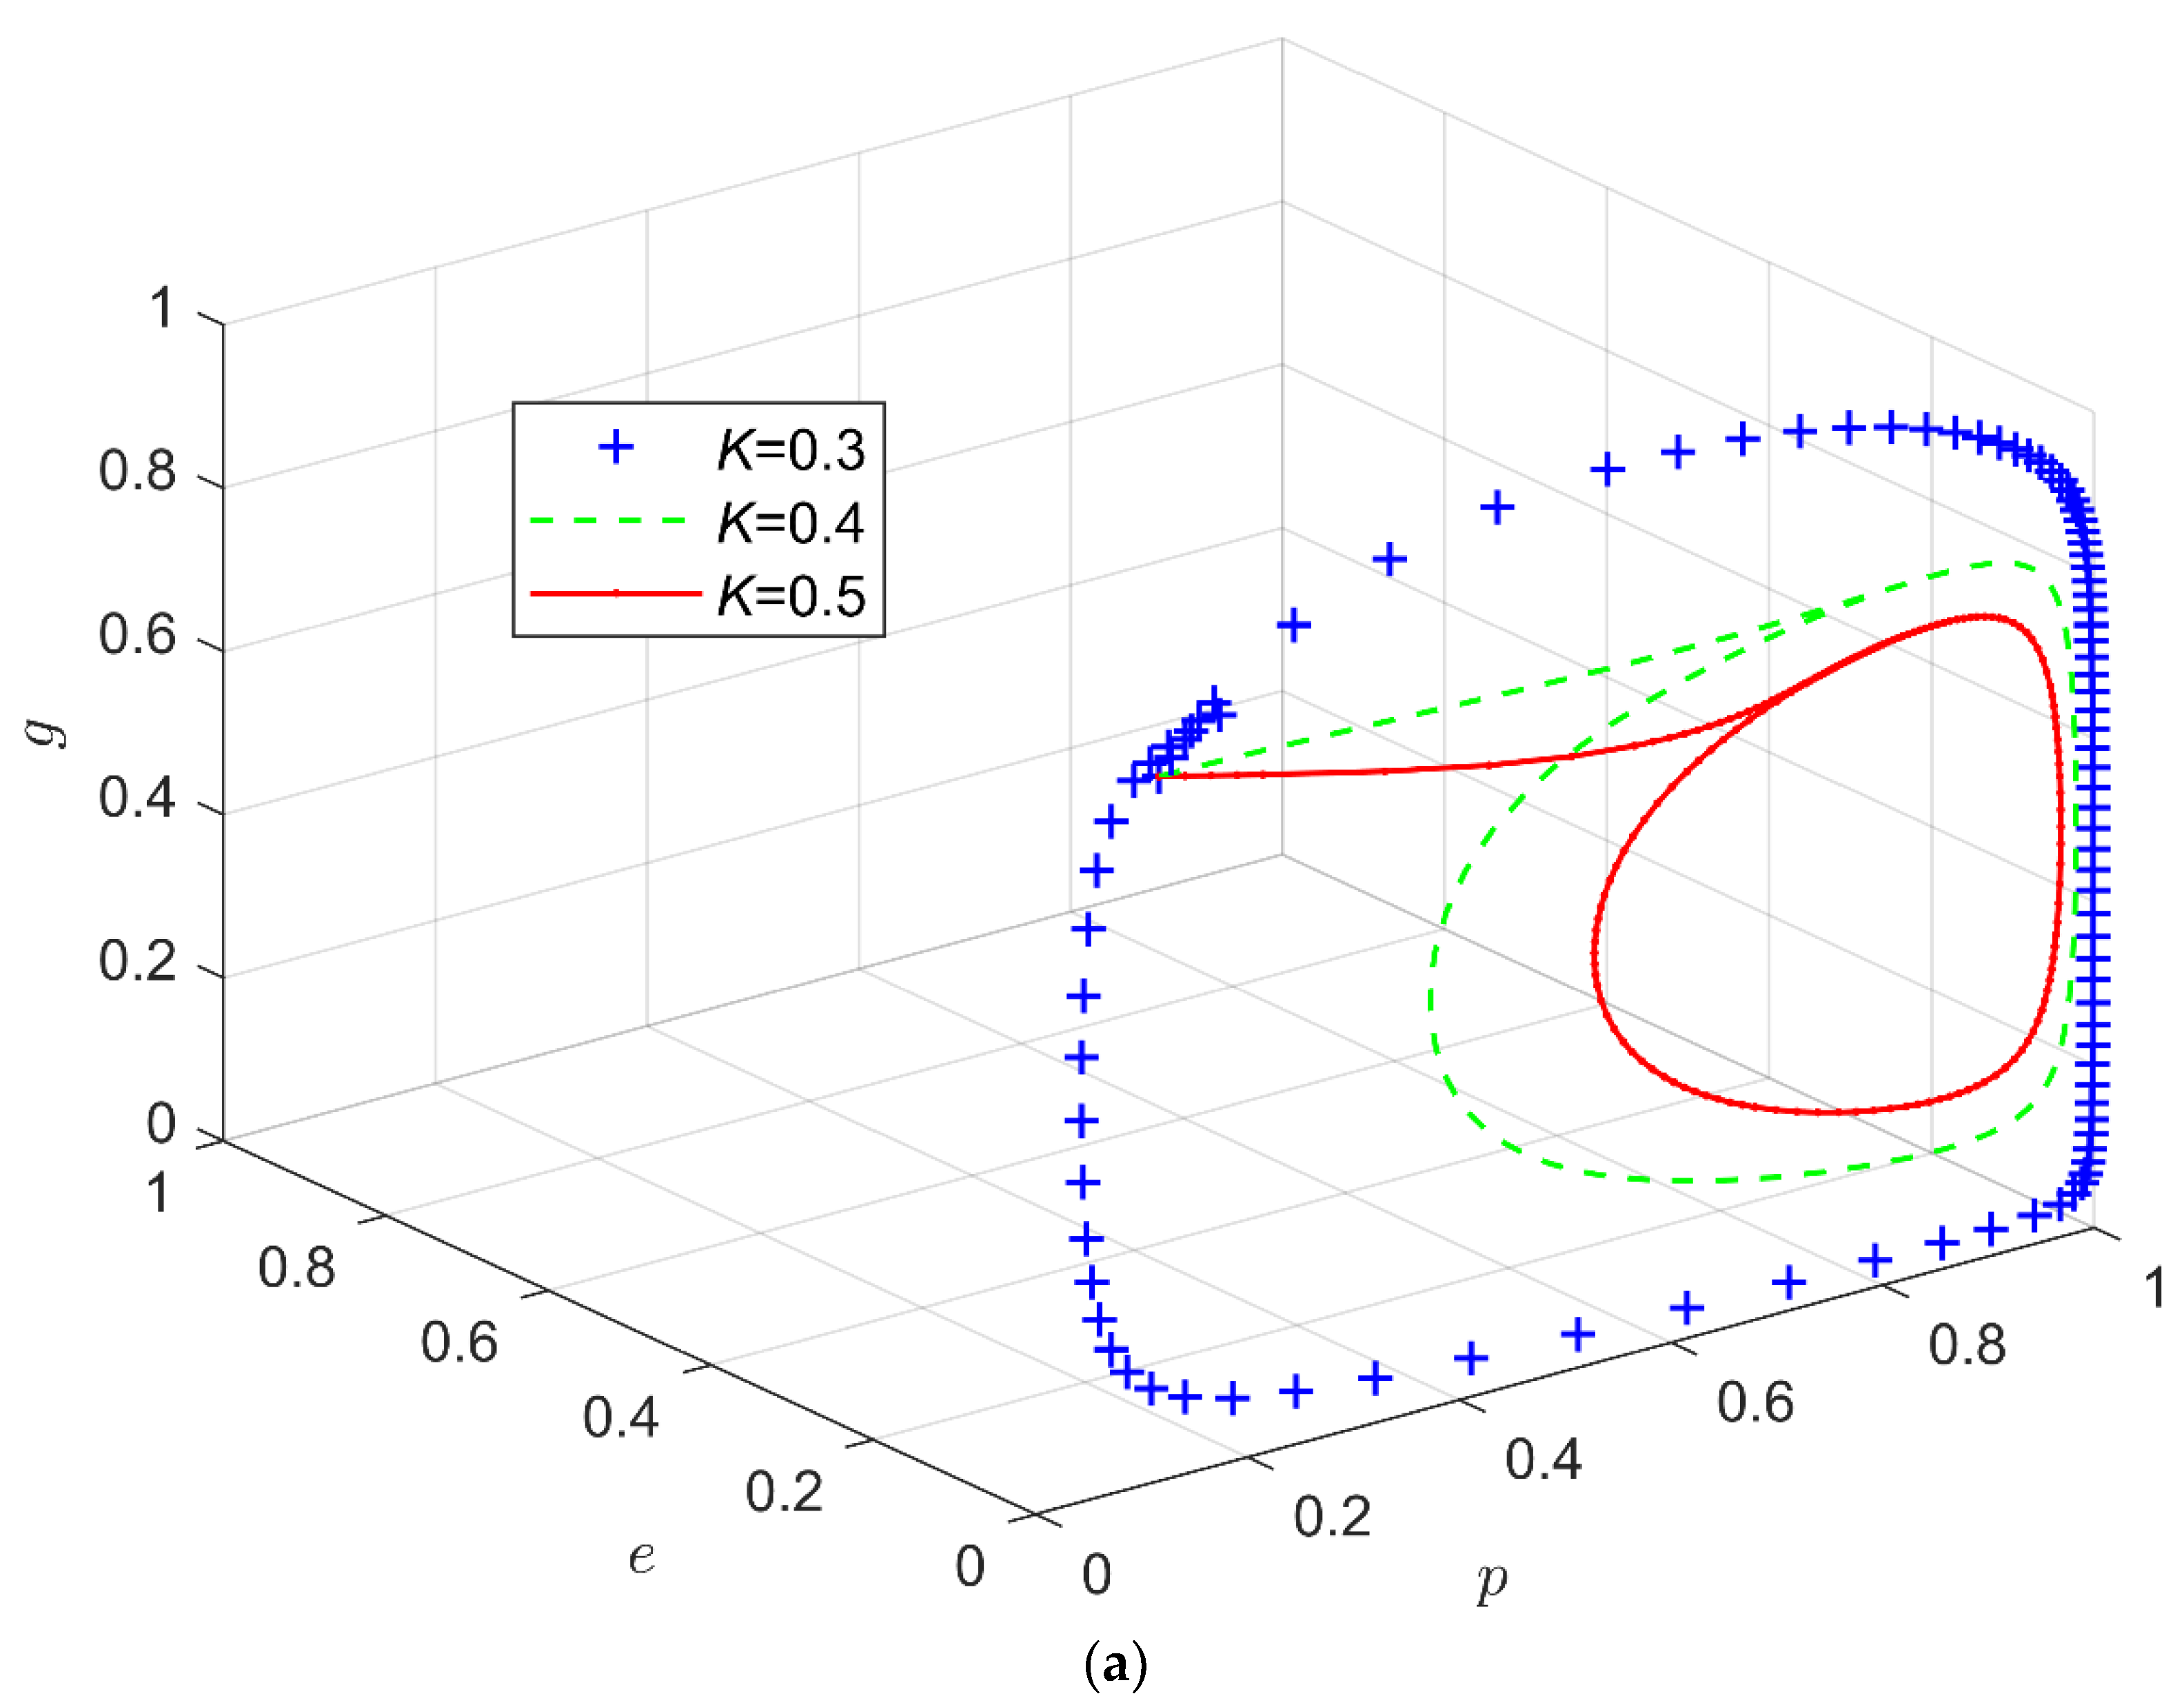
5.1. Influence of Reward and Punishment Mechanism

Figure 1a–d shows that the systems in Figure 1a,b do not have an evolutionary stable state, whereas the systems in Figure 1c,d do. When the evolution paths of the system are compared under different reward and punishment mechanisms, it is clear that there is no evolutionary stable state of the system under the static reward and static punishment mechanism, dynamic reward and dynamic punishment mechanism, and the system is more unstable under the dynamic reward and dynamic punishment mechanism. Obviously, under the static reward and dynamic punishment mechanism, the dynamic reward and dynamic punishment mechanism, compared with the unstable state under the static reward and static punishment mechanism, the system has an evolutionary stable state. Additionally, under the dynamic reward and dynamic punishment mechanism, the rate of evolution convergence is faster, and the probability of supply side quality improvement is greater.
Therefore:
(1)
In terms of the combined effectiveness of different mechanisms, dynamic reward and dynamic punishment mechanism, static reward and dynamic punishment mechanism can effectively change the system’s unstable state, causing the system to gradually evolve and stabilize in a certain stable state. Under the dynamic reward and dynamic penalty mechanism, the slope of the trajectory and the position of the stable point, the system evolution converges faster, and the probability of supply side quality improvement is greater. As a result, the dynamic reward and punishment mechanism outperforms the static reward and punishment mechanism.
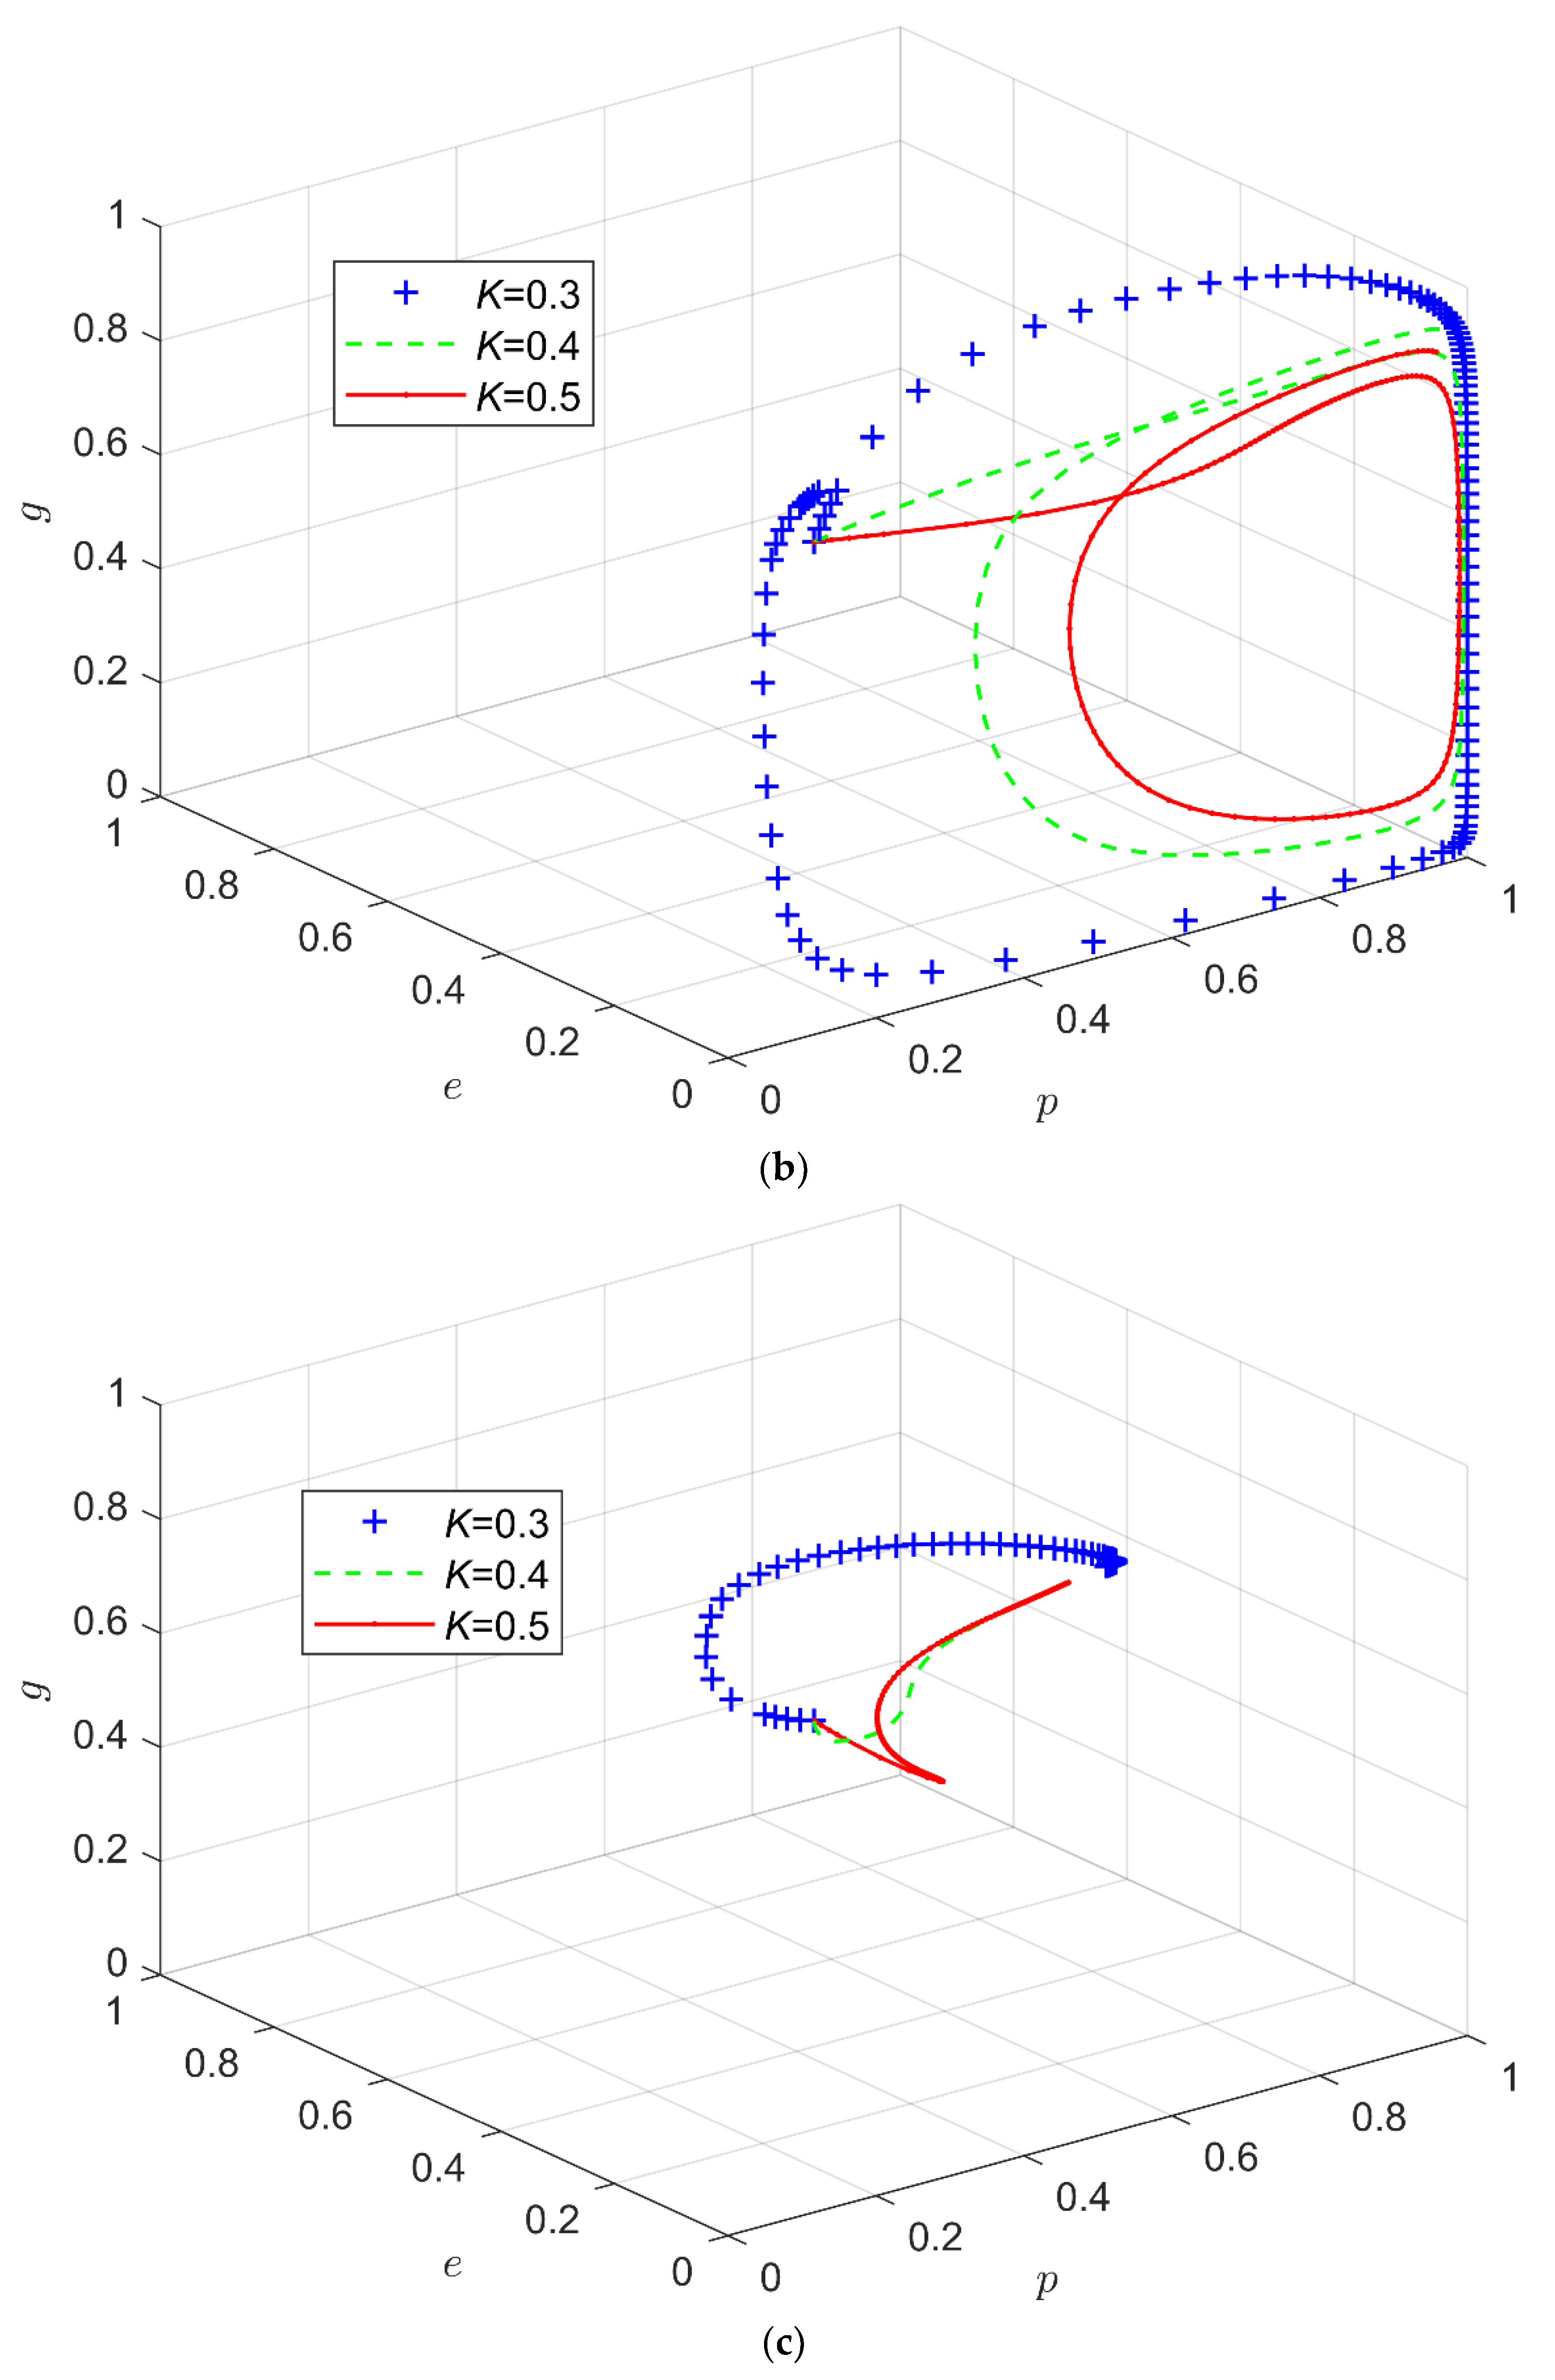
(2)
The system does not have an evolutionary stable state under the static reward and static punishment mechanism or the dynamic reward and dynamic punishment mechanism. In terms of the stability of strategy combination, the system’s stability under the static reward and static penalty mechanism is stronger, and the static reward and static penalty mechanism is better than the dynamic reward and static penalty mechanism; in terms of the stability of strategy evolution, although the dynamic reward and static penalty mechanism is better, the static reward and static penalty mechanism is better. The degree of instability of the system is more obvious under the reward and dynamic punishment mechanism, but the probability that the supply side chooses quality improvement and the shared platform chooses active supervision is also higher. The dynamic reward and static punishment mechanism is better than the static reward and static punishment mechanism.
(3)
The system does have an evolutionary stable state under the dynamic reward and dynamic punishment mechanism, and the static reward and dynamic punishment mechanism. However, by analyzing the position of the stable point, it can be seen that the probability of active supervision of the shared platform is high at this time, but the probability of quality improvement on the supply side is medium, the probability of cost sharing on the demand side is low, and the enthusiasm for the shared manufacturing to directly participate in the quality improvement of both parties is low, the driving force of quality coordination mainly comes from the external supervision and regulation of the shared platform. The endogenous driving force from the supply side and the demand side is weak, which is not conducive to the effective progress of quality improvement work and the long-term development of the shared manufacturing model.

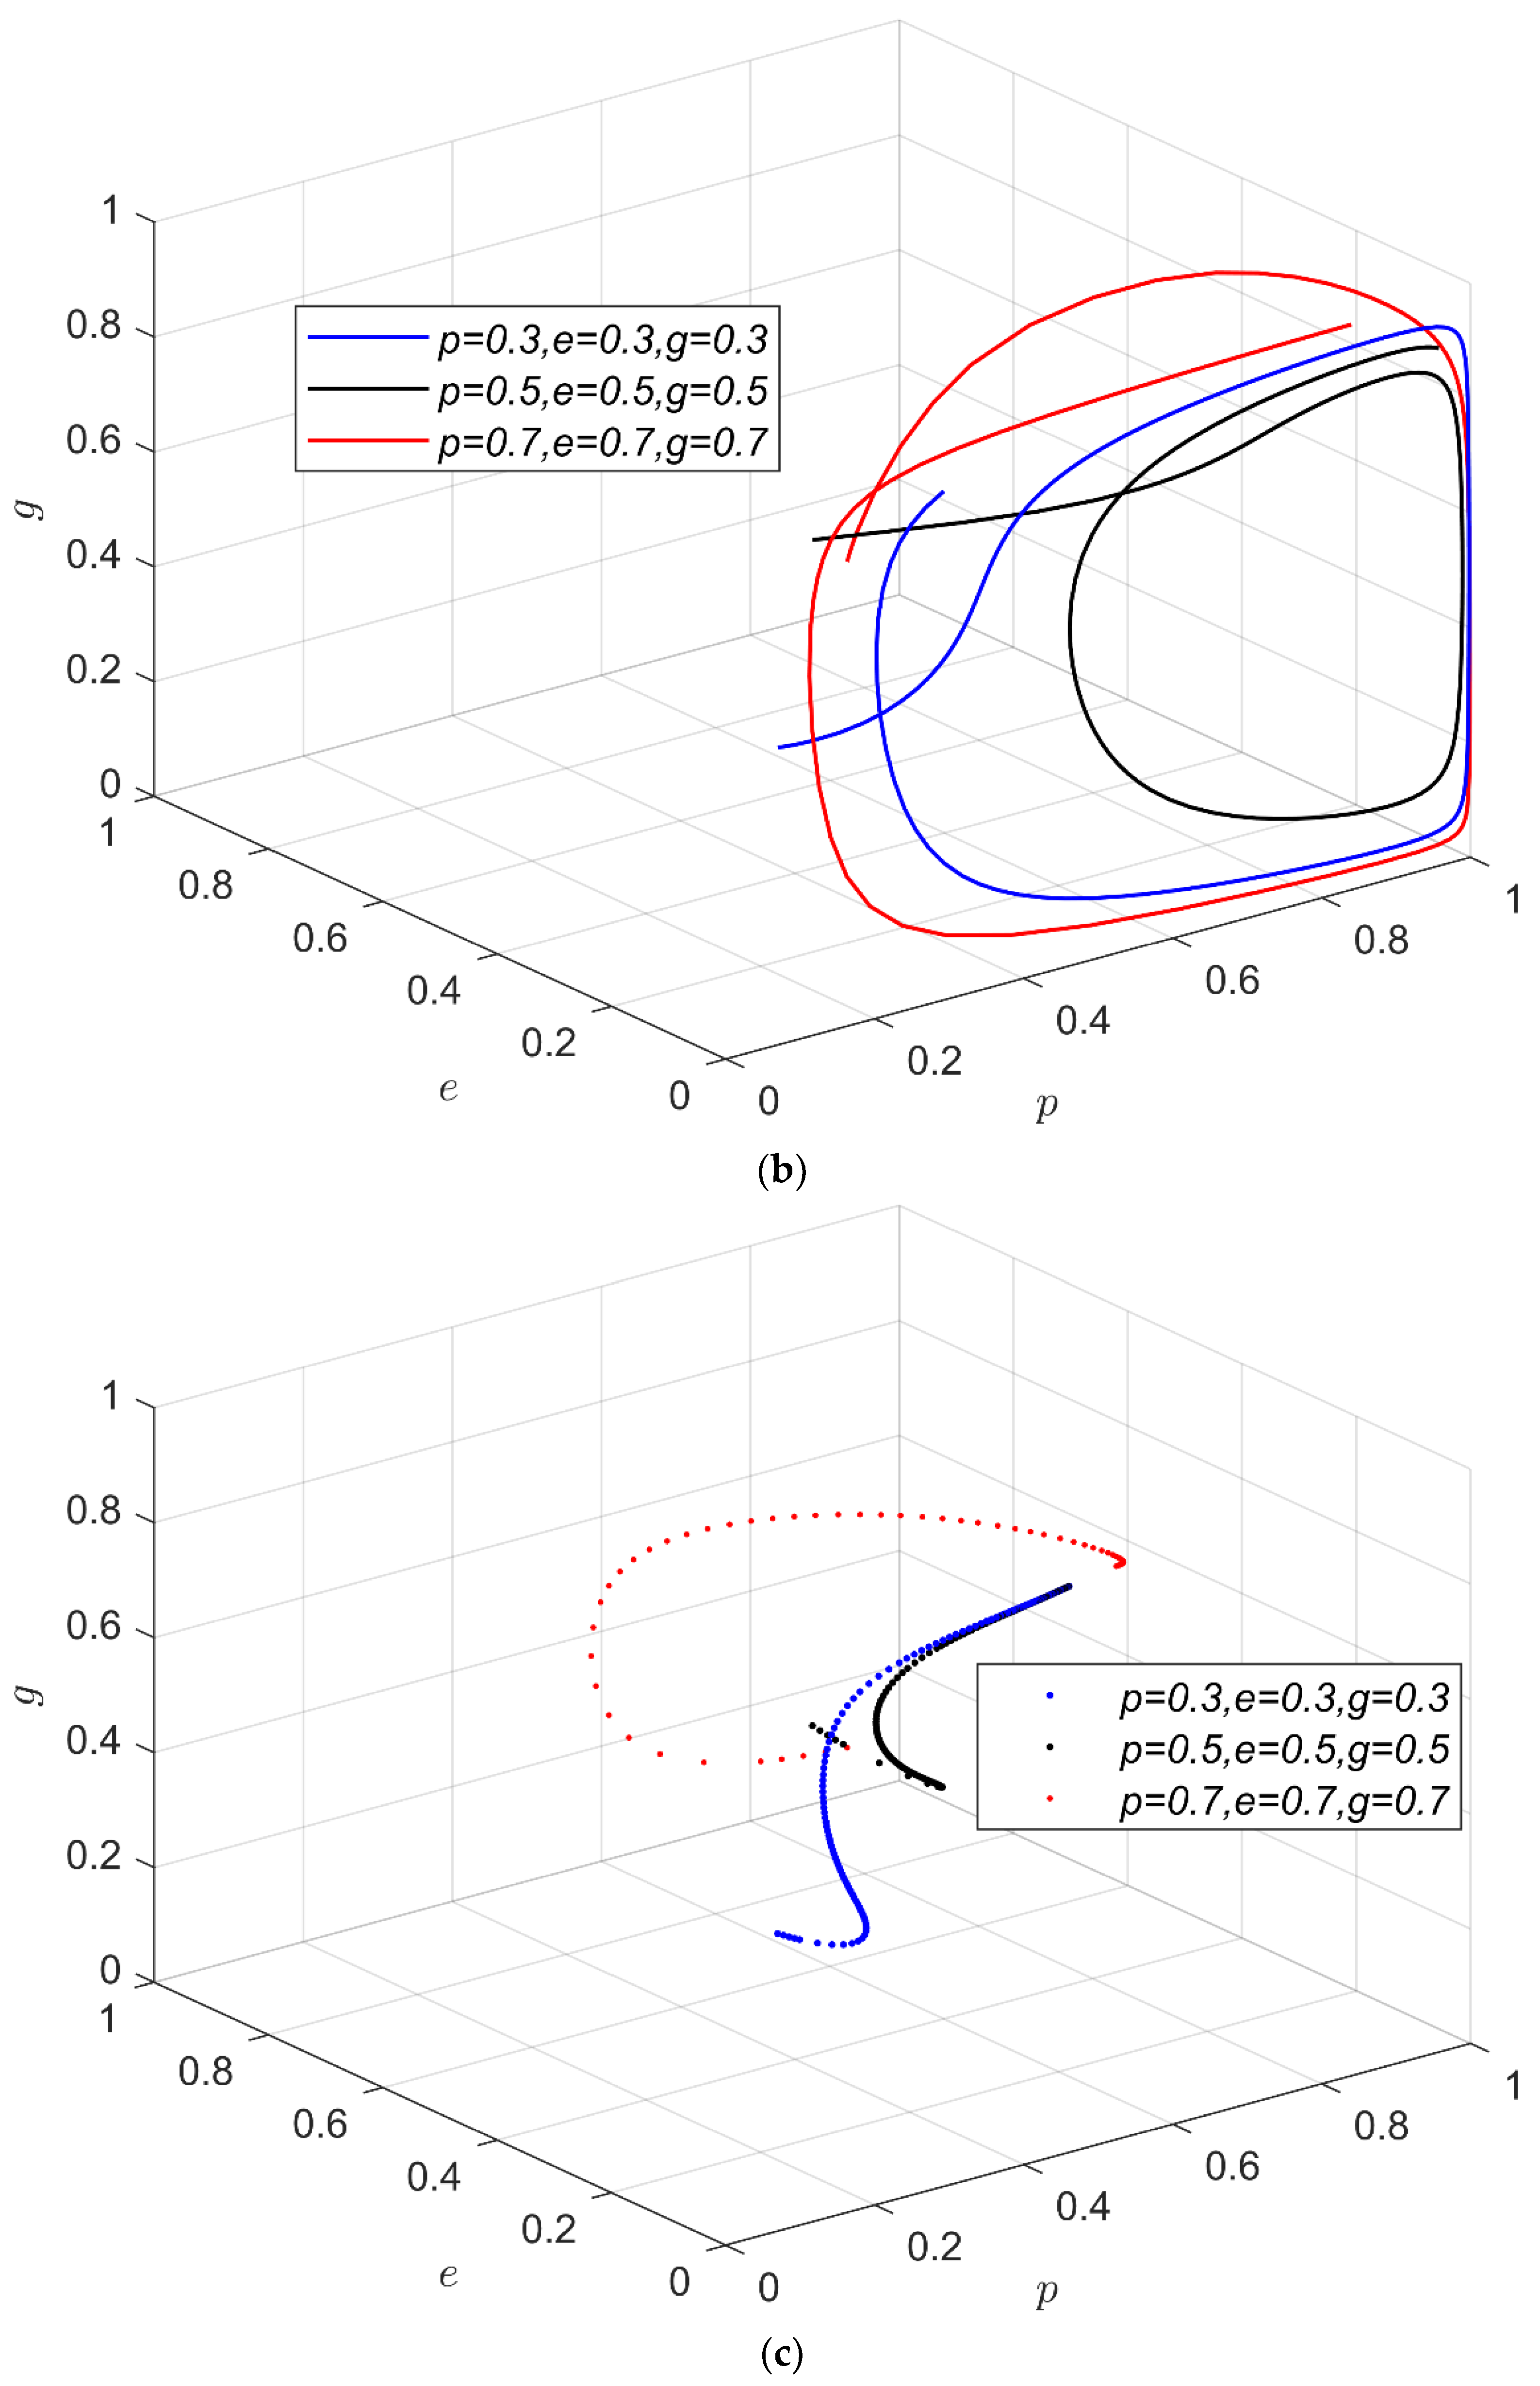
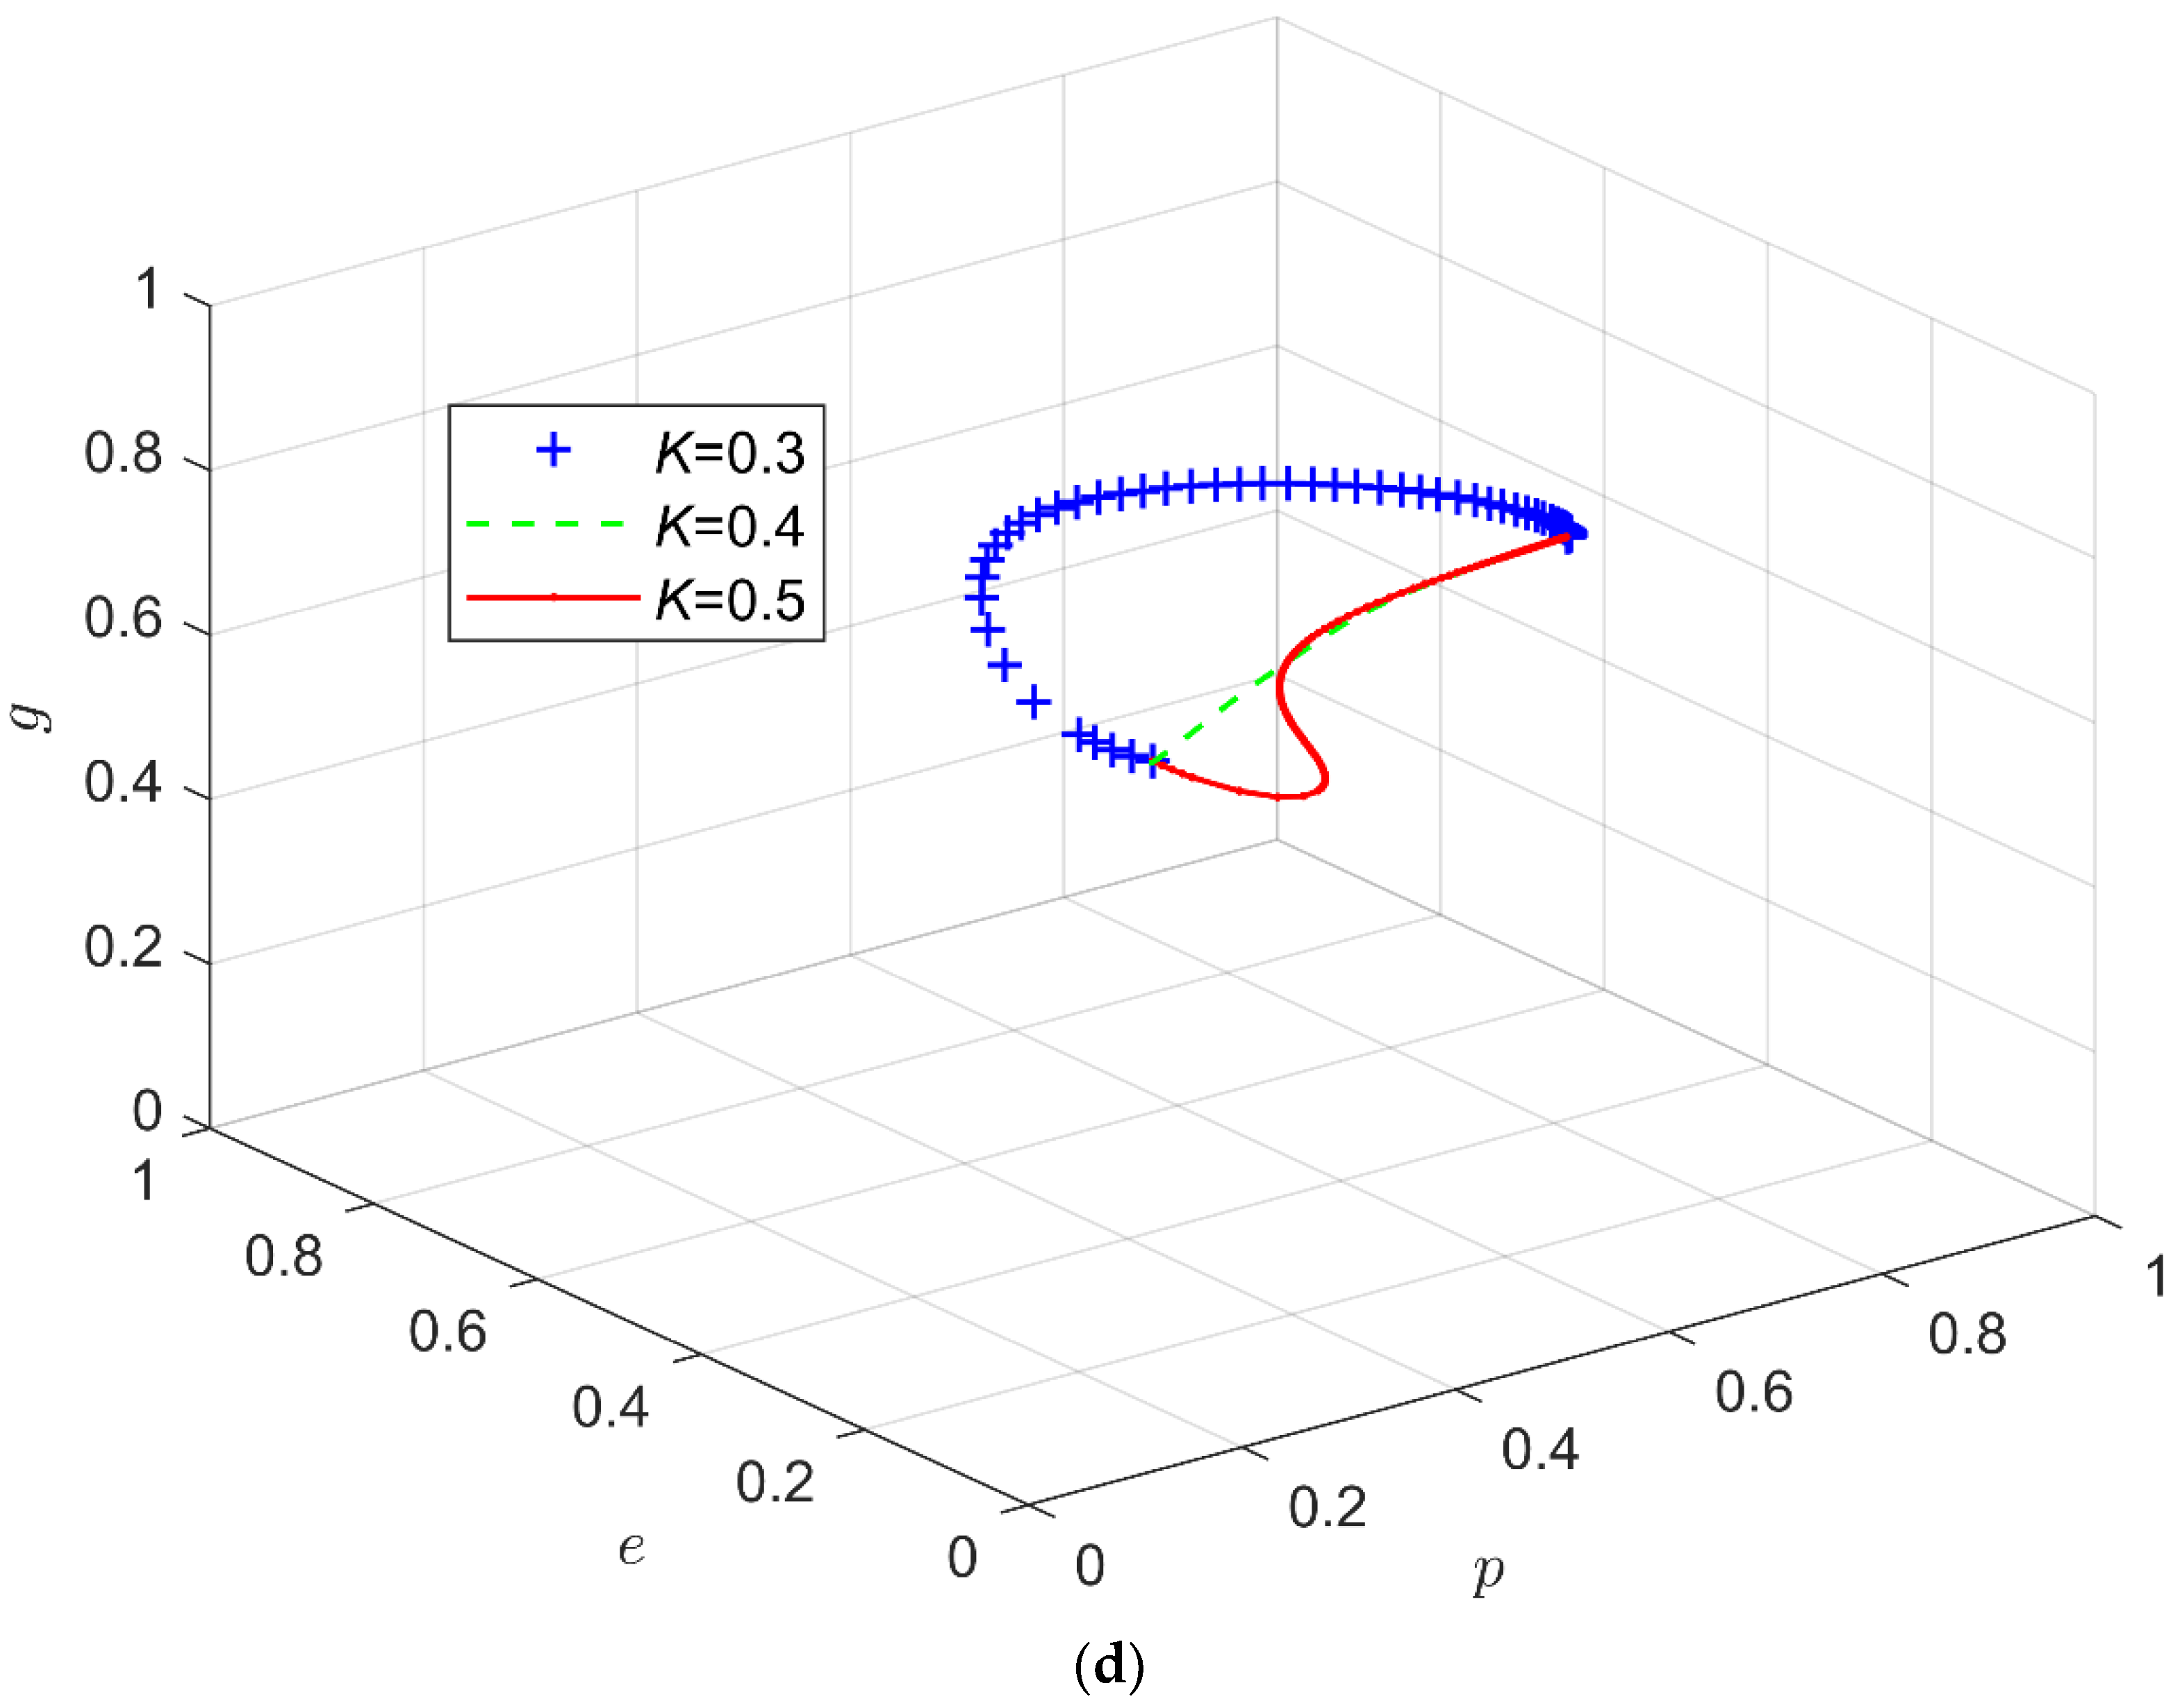
5.2. Influence of Cost Allocation Ratio

Take { K = 0.3 , K = 0.4 , K = 0.4 } , the strategy evolution process and results are shown in Figure 2.
Figure 2a–d shows that as the cost allocation ratio increases, the stable state of the system evolution does not change significantly. Under the static reward and static punishment mechanisms, dynamic reward and dynamic punishment mechanisms, the most obvious change of the system evolution characteristic is the oscillation amplitude, and the oscillation amplitude of the system evolution gradually decreases as the cost allocation ratio increases. The most obvious change in the system evolution characteristic under the mechanism, dynamic reward and dynamic punishment mechanism, is the convergence speed, and the speed of evolution convergence gradually becomes slower as the cost allocation ratio increases.
It is clear that there is no direct and obvious linear relationship between the cost allocation ratio and the system evolution’s stability. As a result, an appropriate cost allocation ratio should be chosen in the synergistic practice of shared manufacturing quality. The strategy of pursuing high-cost allocation blindly cannot ensure the effectiveness of quality coordination and will also become a cost burden for demanders.

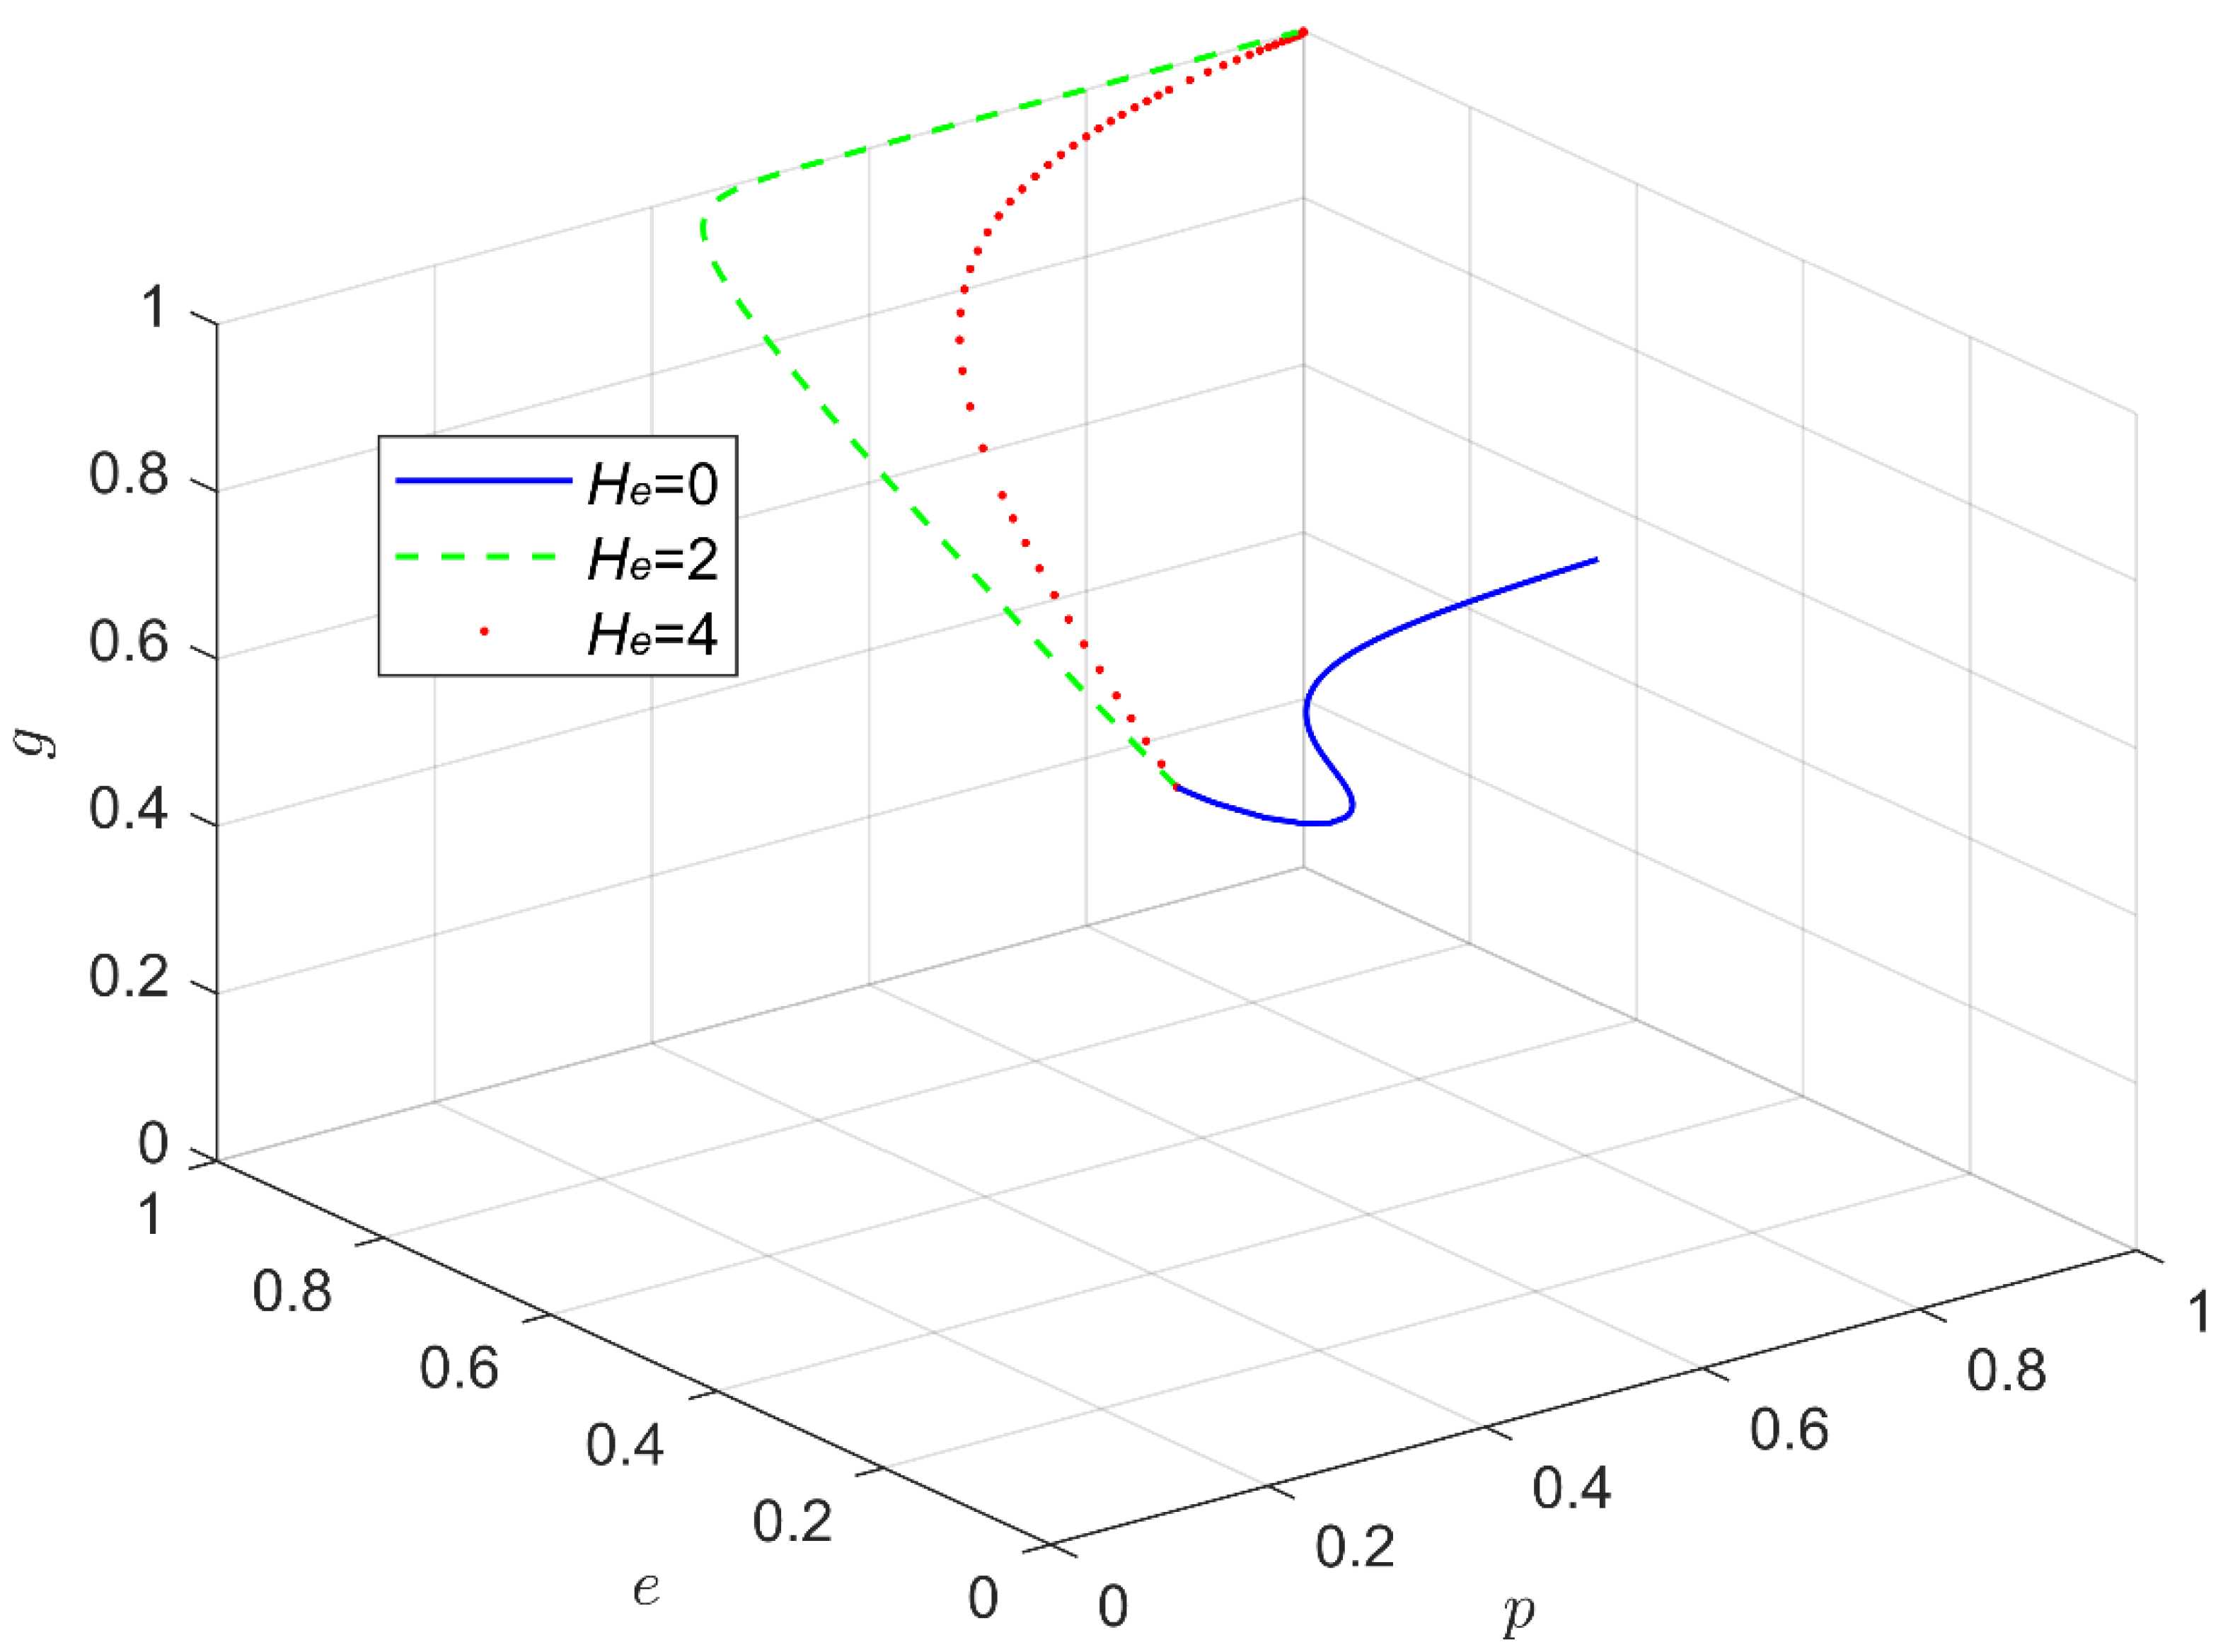
5.3. Impact of Quality Improvement Gains

Take { H a = 4 , H b = 4 } , { H a = 1 , H b = 1 } , { H a = 8 , H b = 8 } , the strategy evolution process and results are shown in Figure 3.
The change in the quality improvement benefit can considerably influence the steady state of the system evolution, as shown in Figure 3a–d. In terms of the probability of quality improvement on the supply side, as the benefits of quality improvement increase, so does the probability of quality improvement on the supply side; similarly, as the benefits of quality improvement increase, so does the probability of active supervision on the shared platform. The probability of party cost sharing and active supervision of the shared platform has fallen dramatically.
When the advantages of quality improvement are low, the supply side’s endogenous incentive to carry out quality improvement is insufficient, and subjective willingness to carry out quality improvement is lacking. In recent years, the supply side’s motivation to increase quality stems mostly from cost allocation and external control of shared platforms. The return on investment in quality improvement by the supply side has soared as the benefits of quality improvement have increased, and the internal driving power of the supply side in quality improvement is sufficiently strong. Without the interference of other stakeholders, the supply side can retain a high level of excitement for quality improvement at this time.

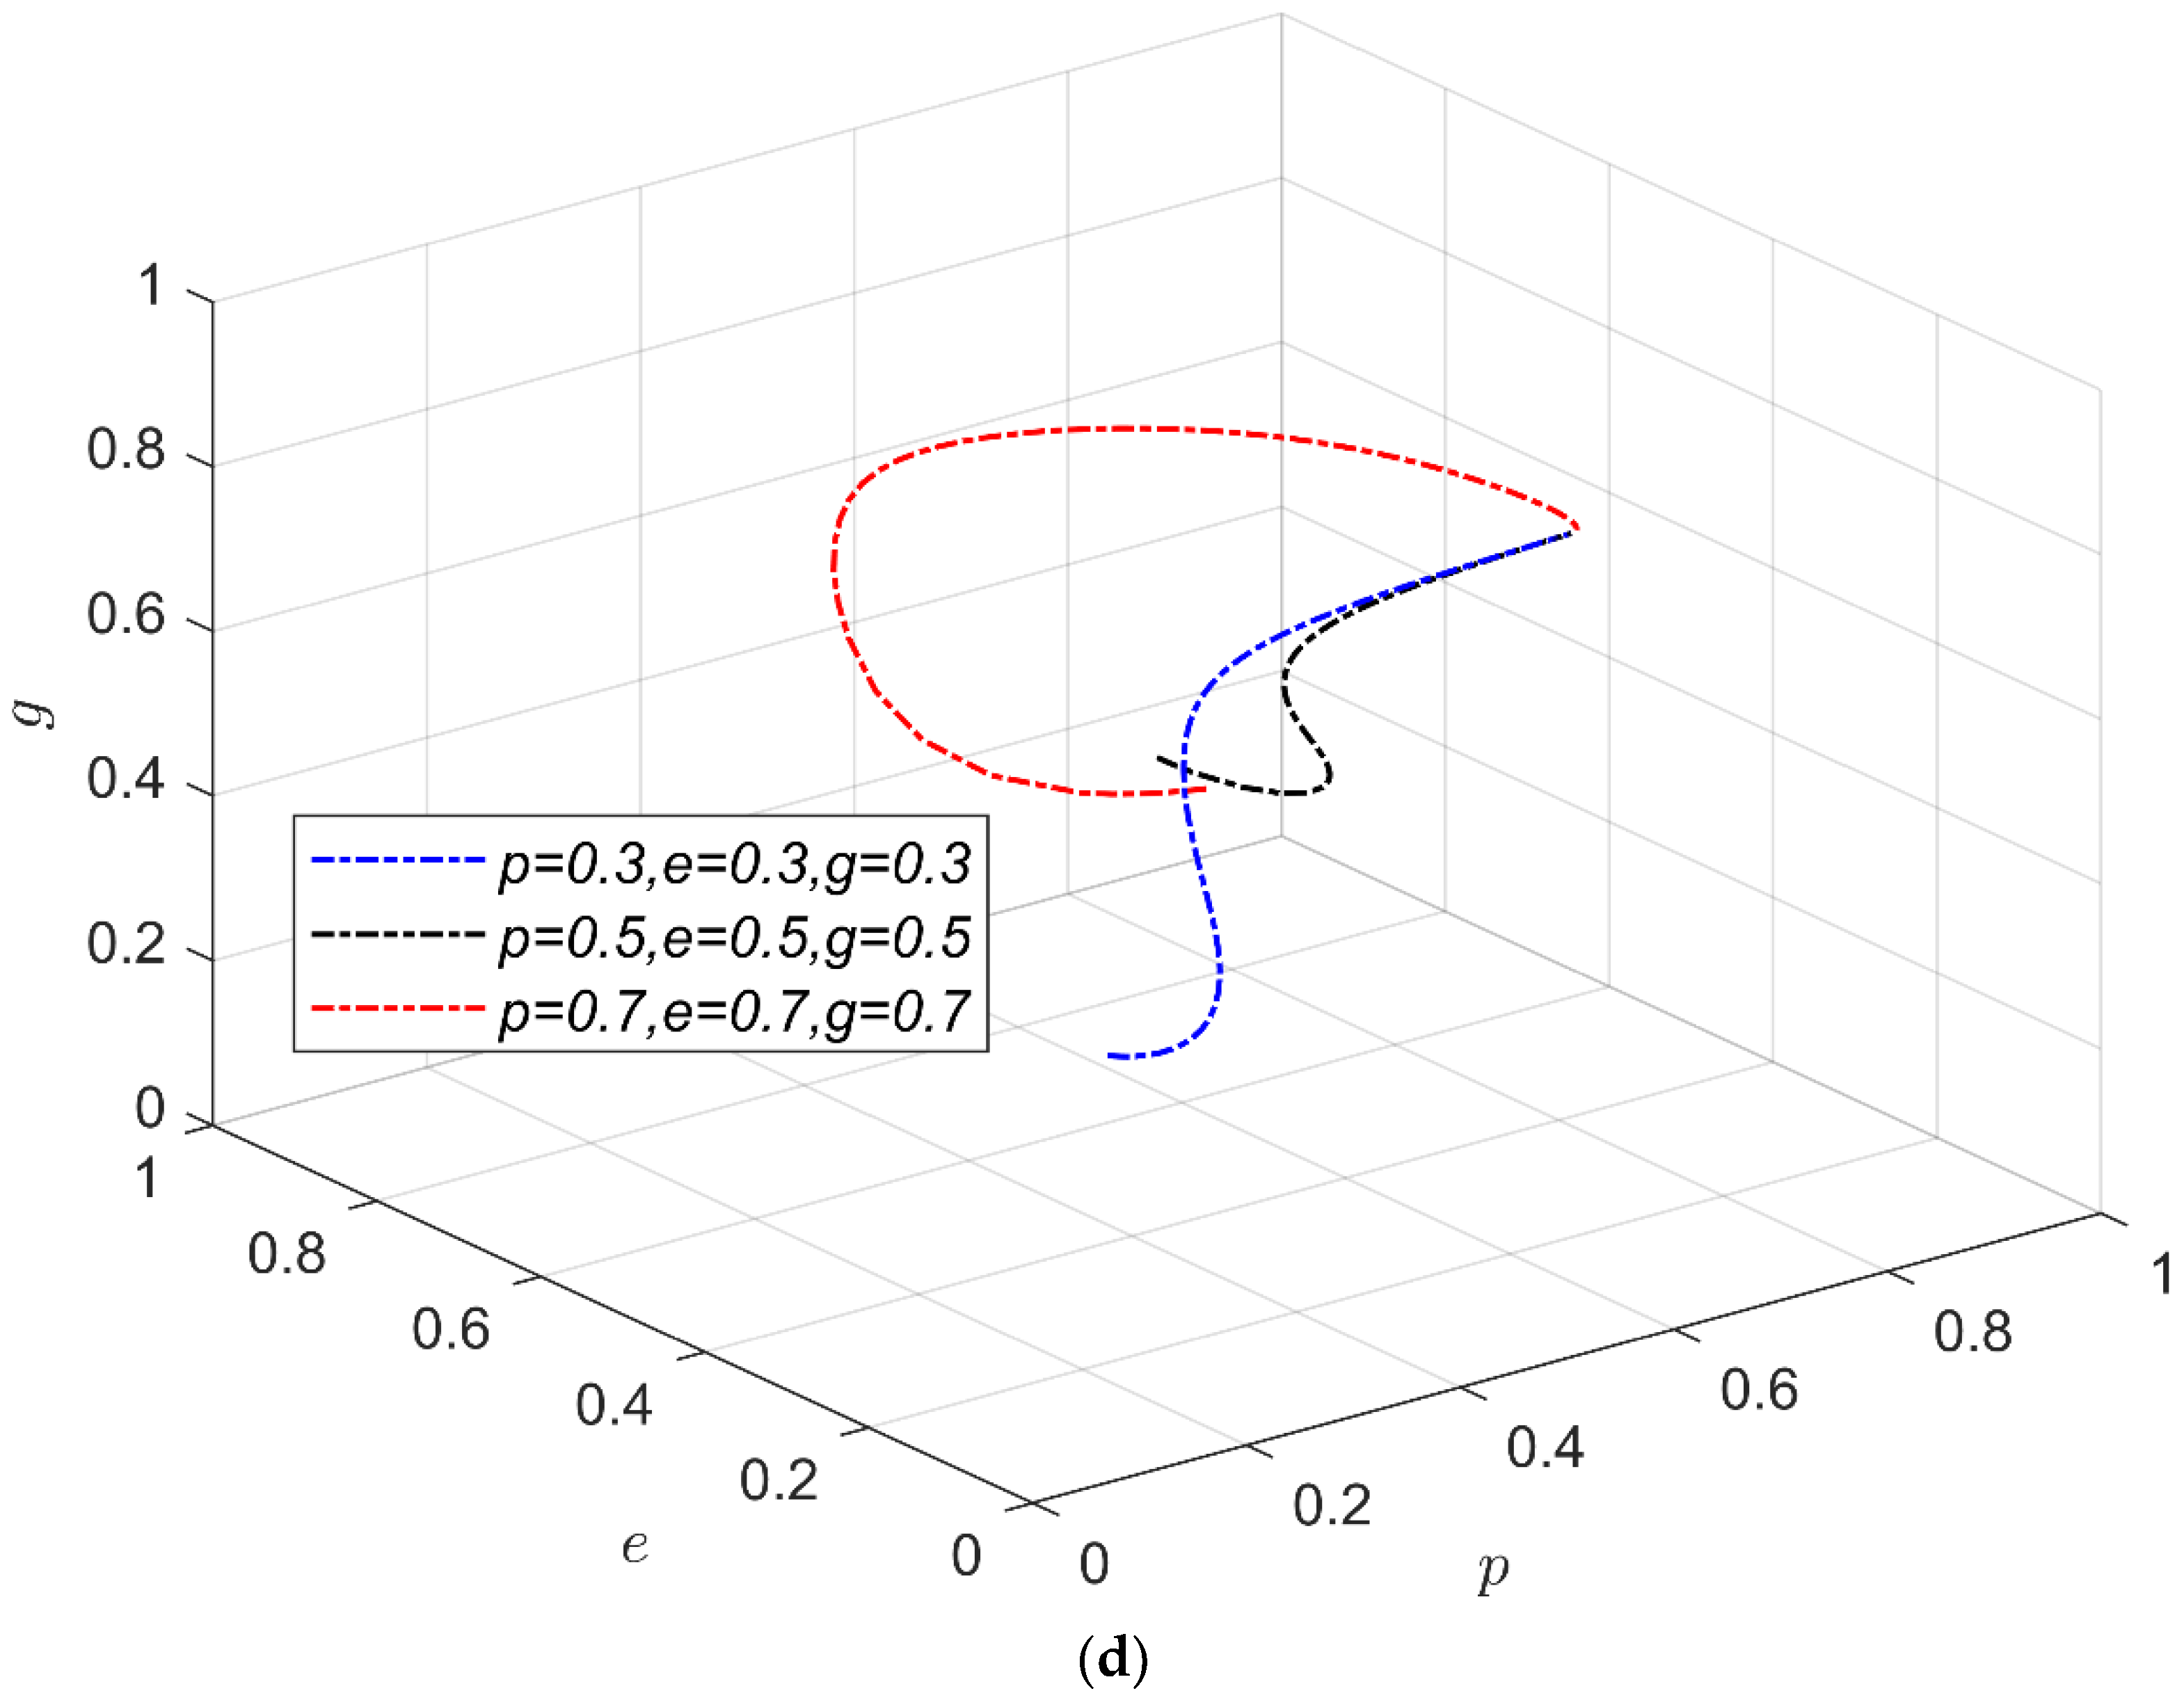
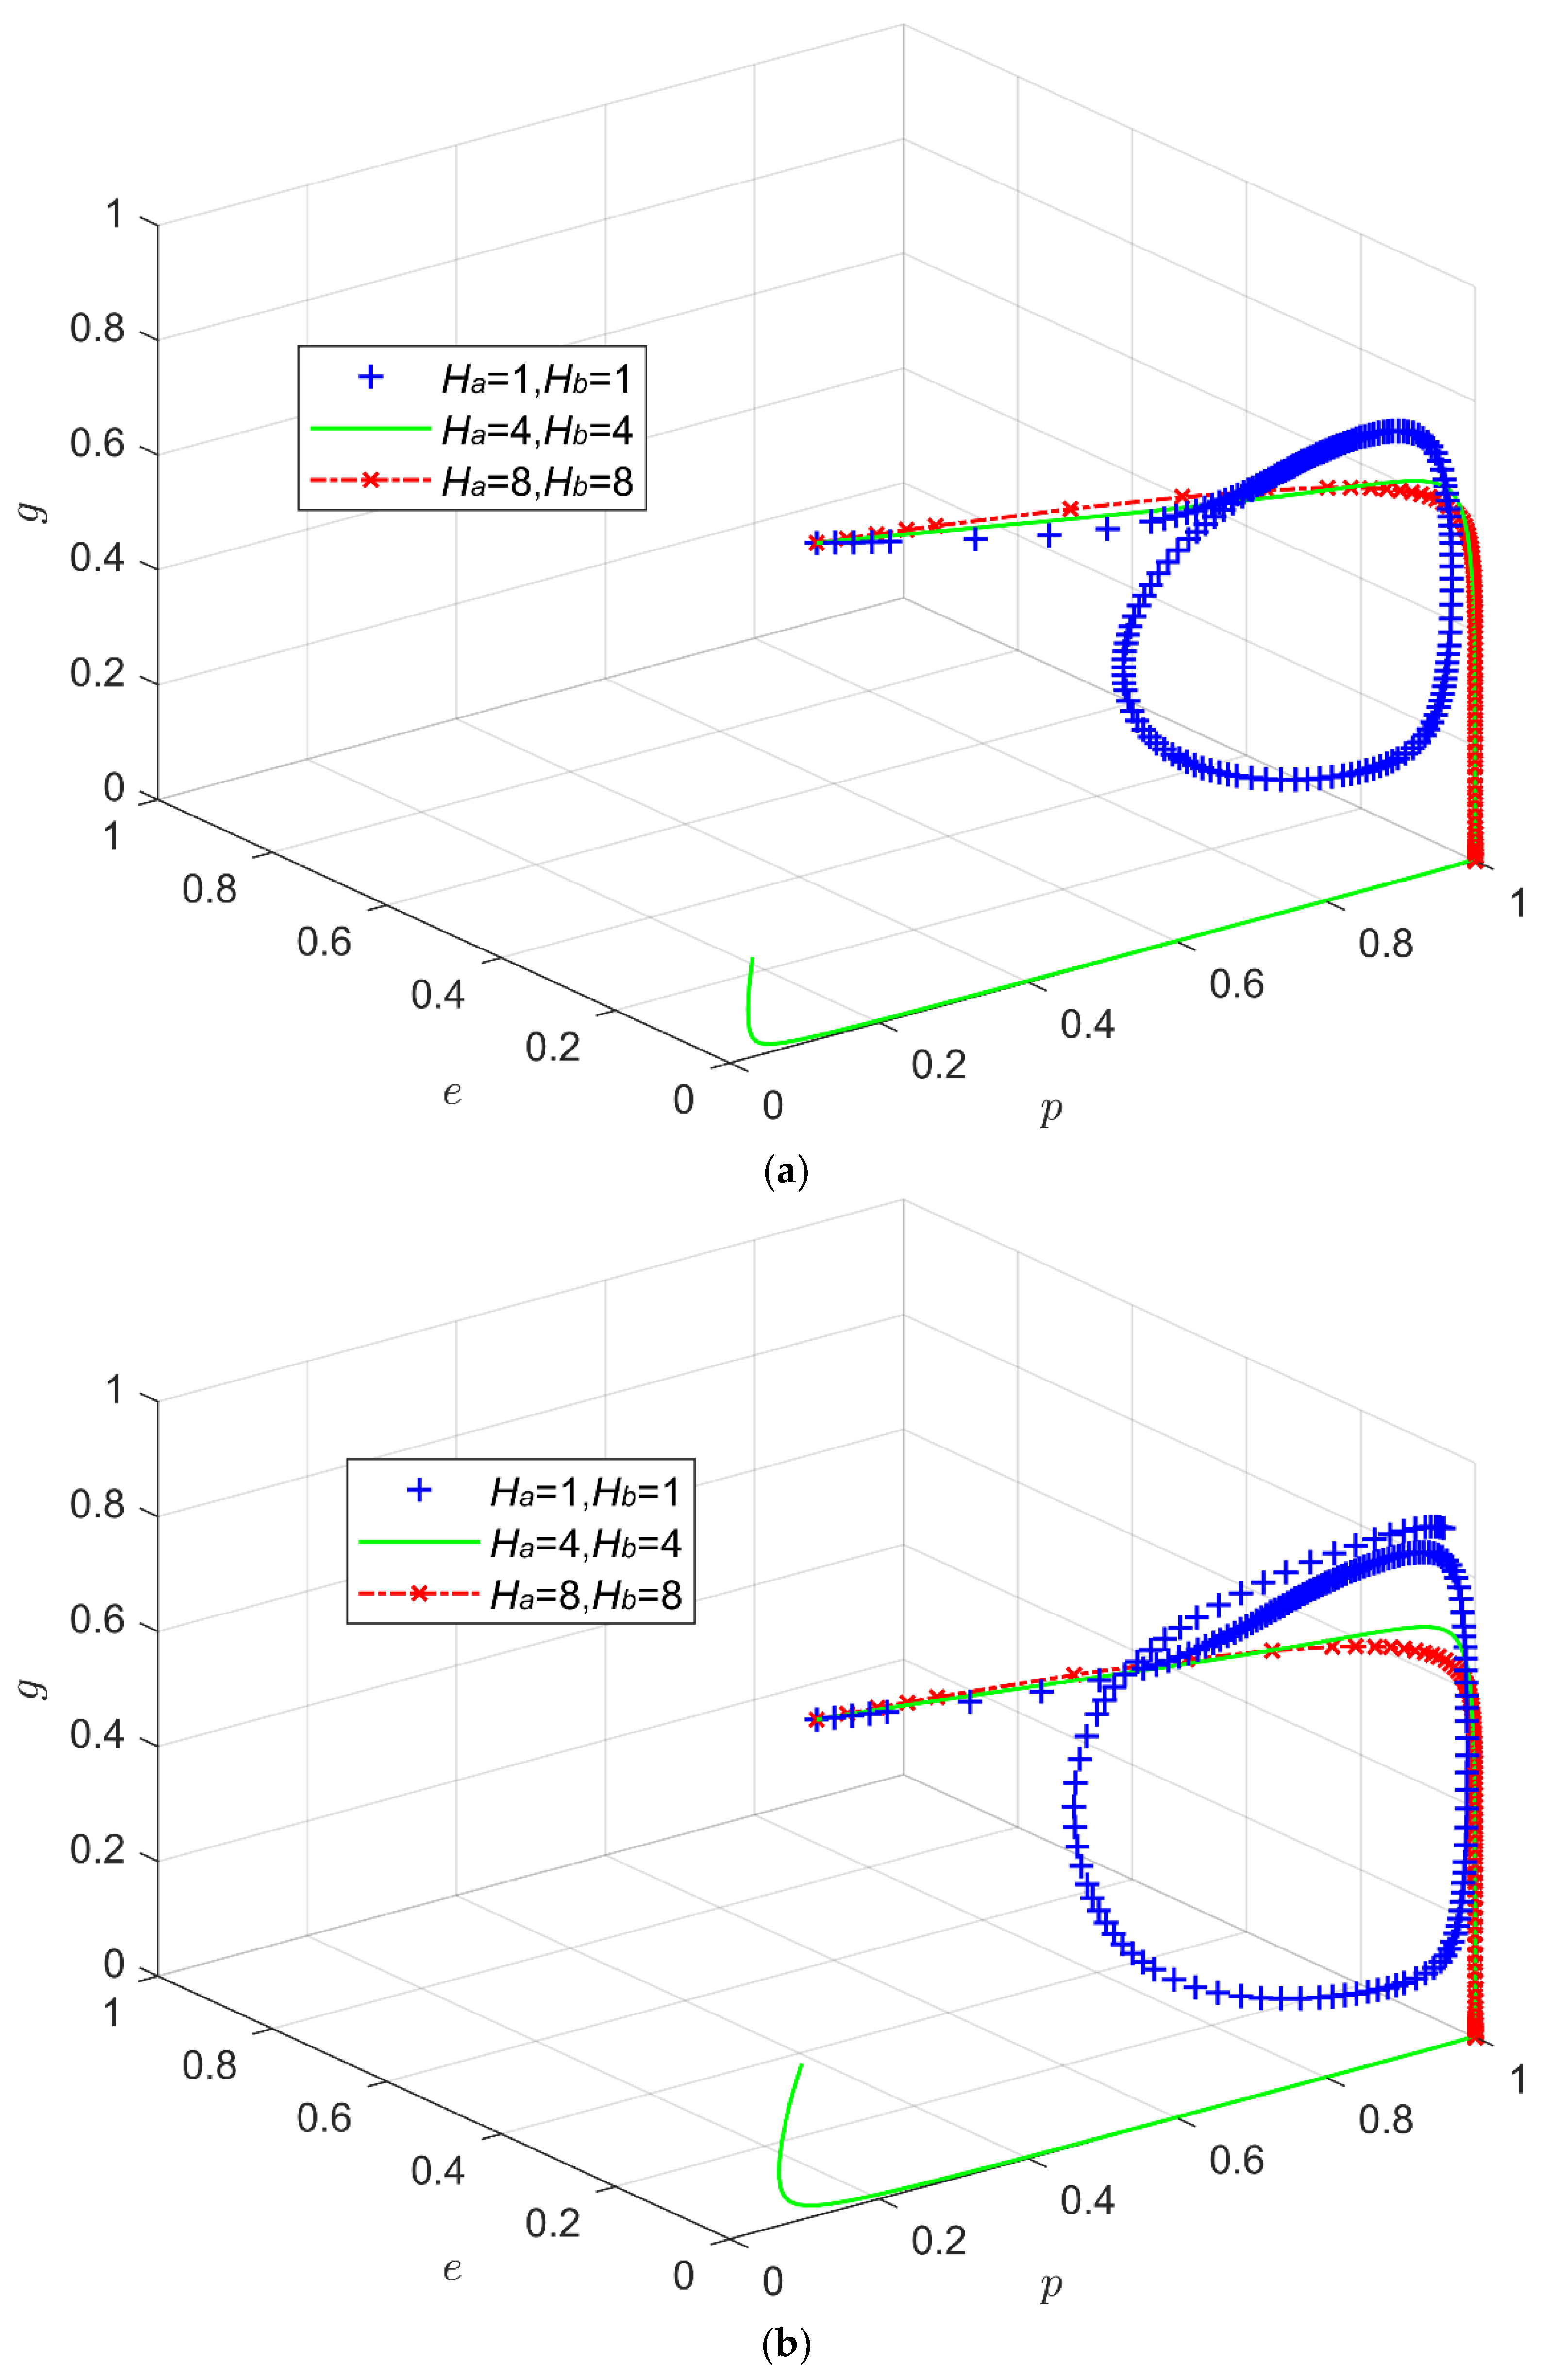
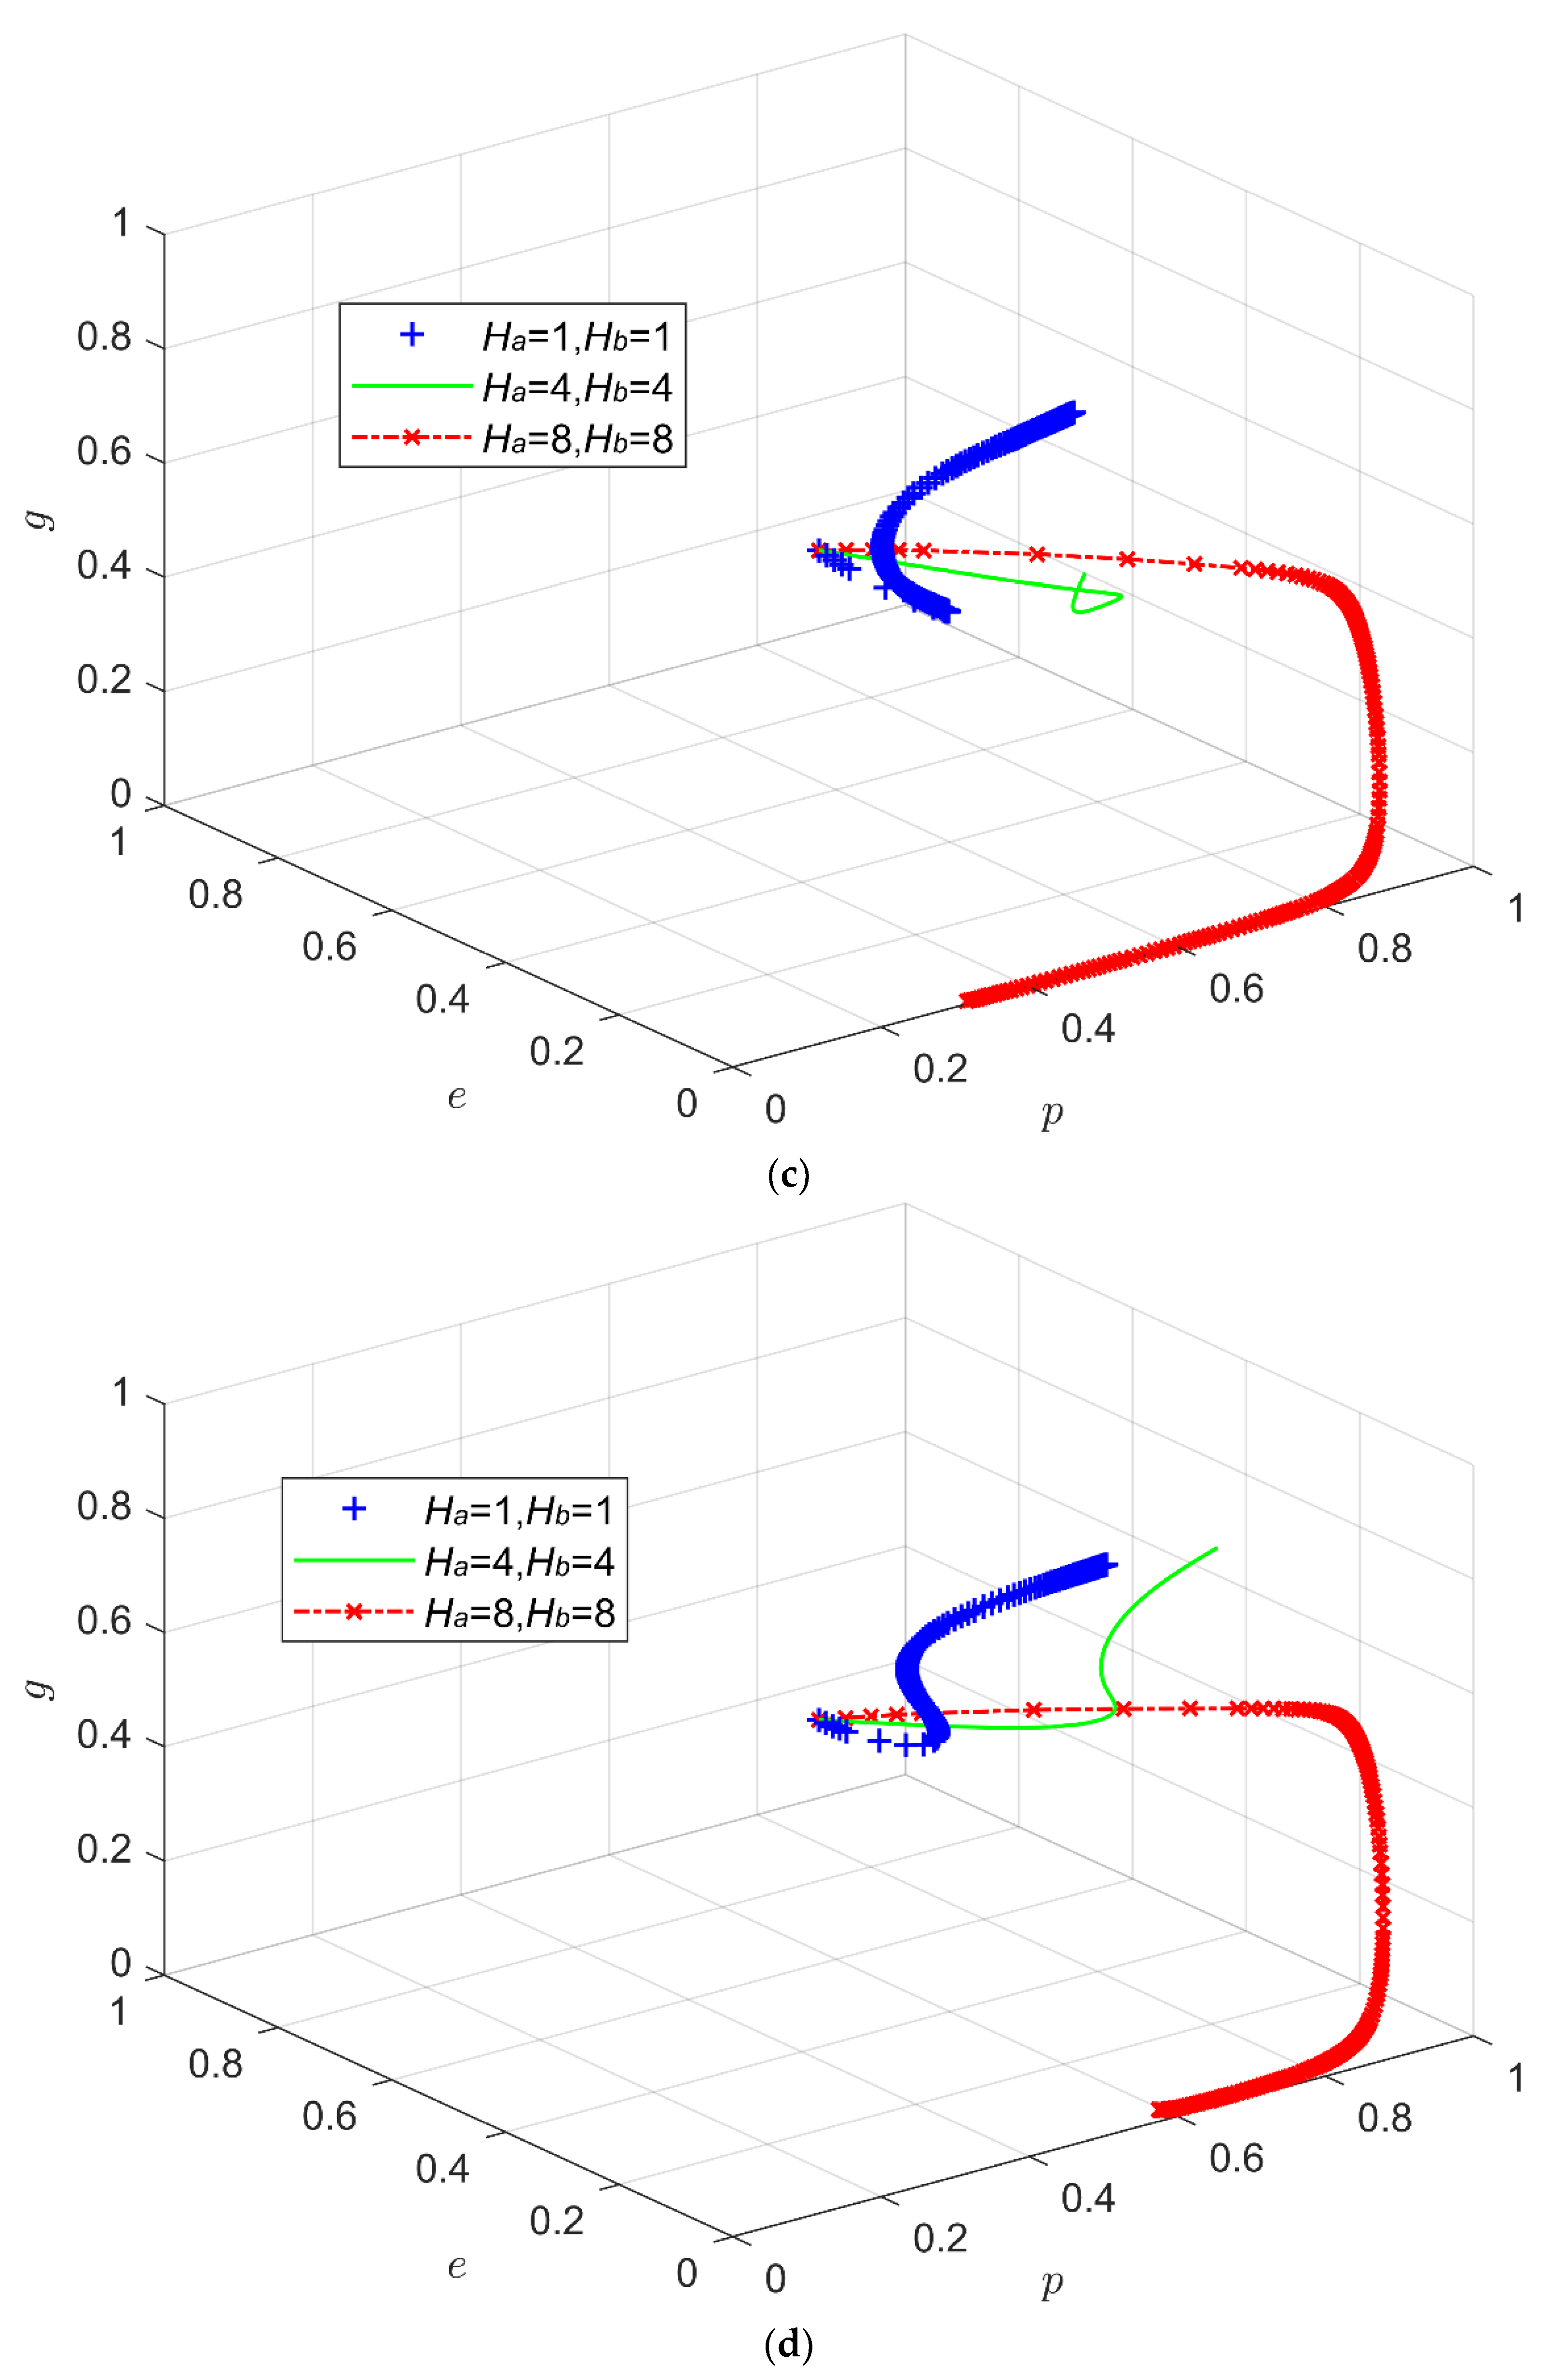
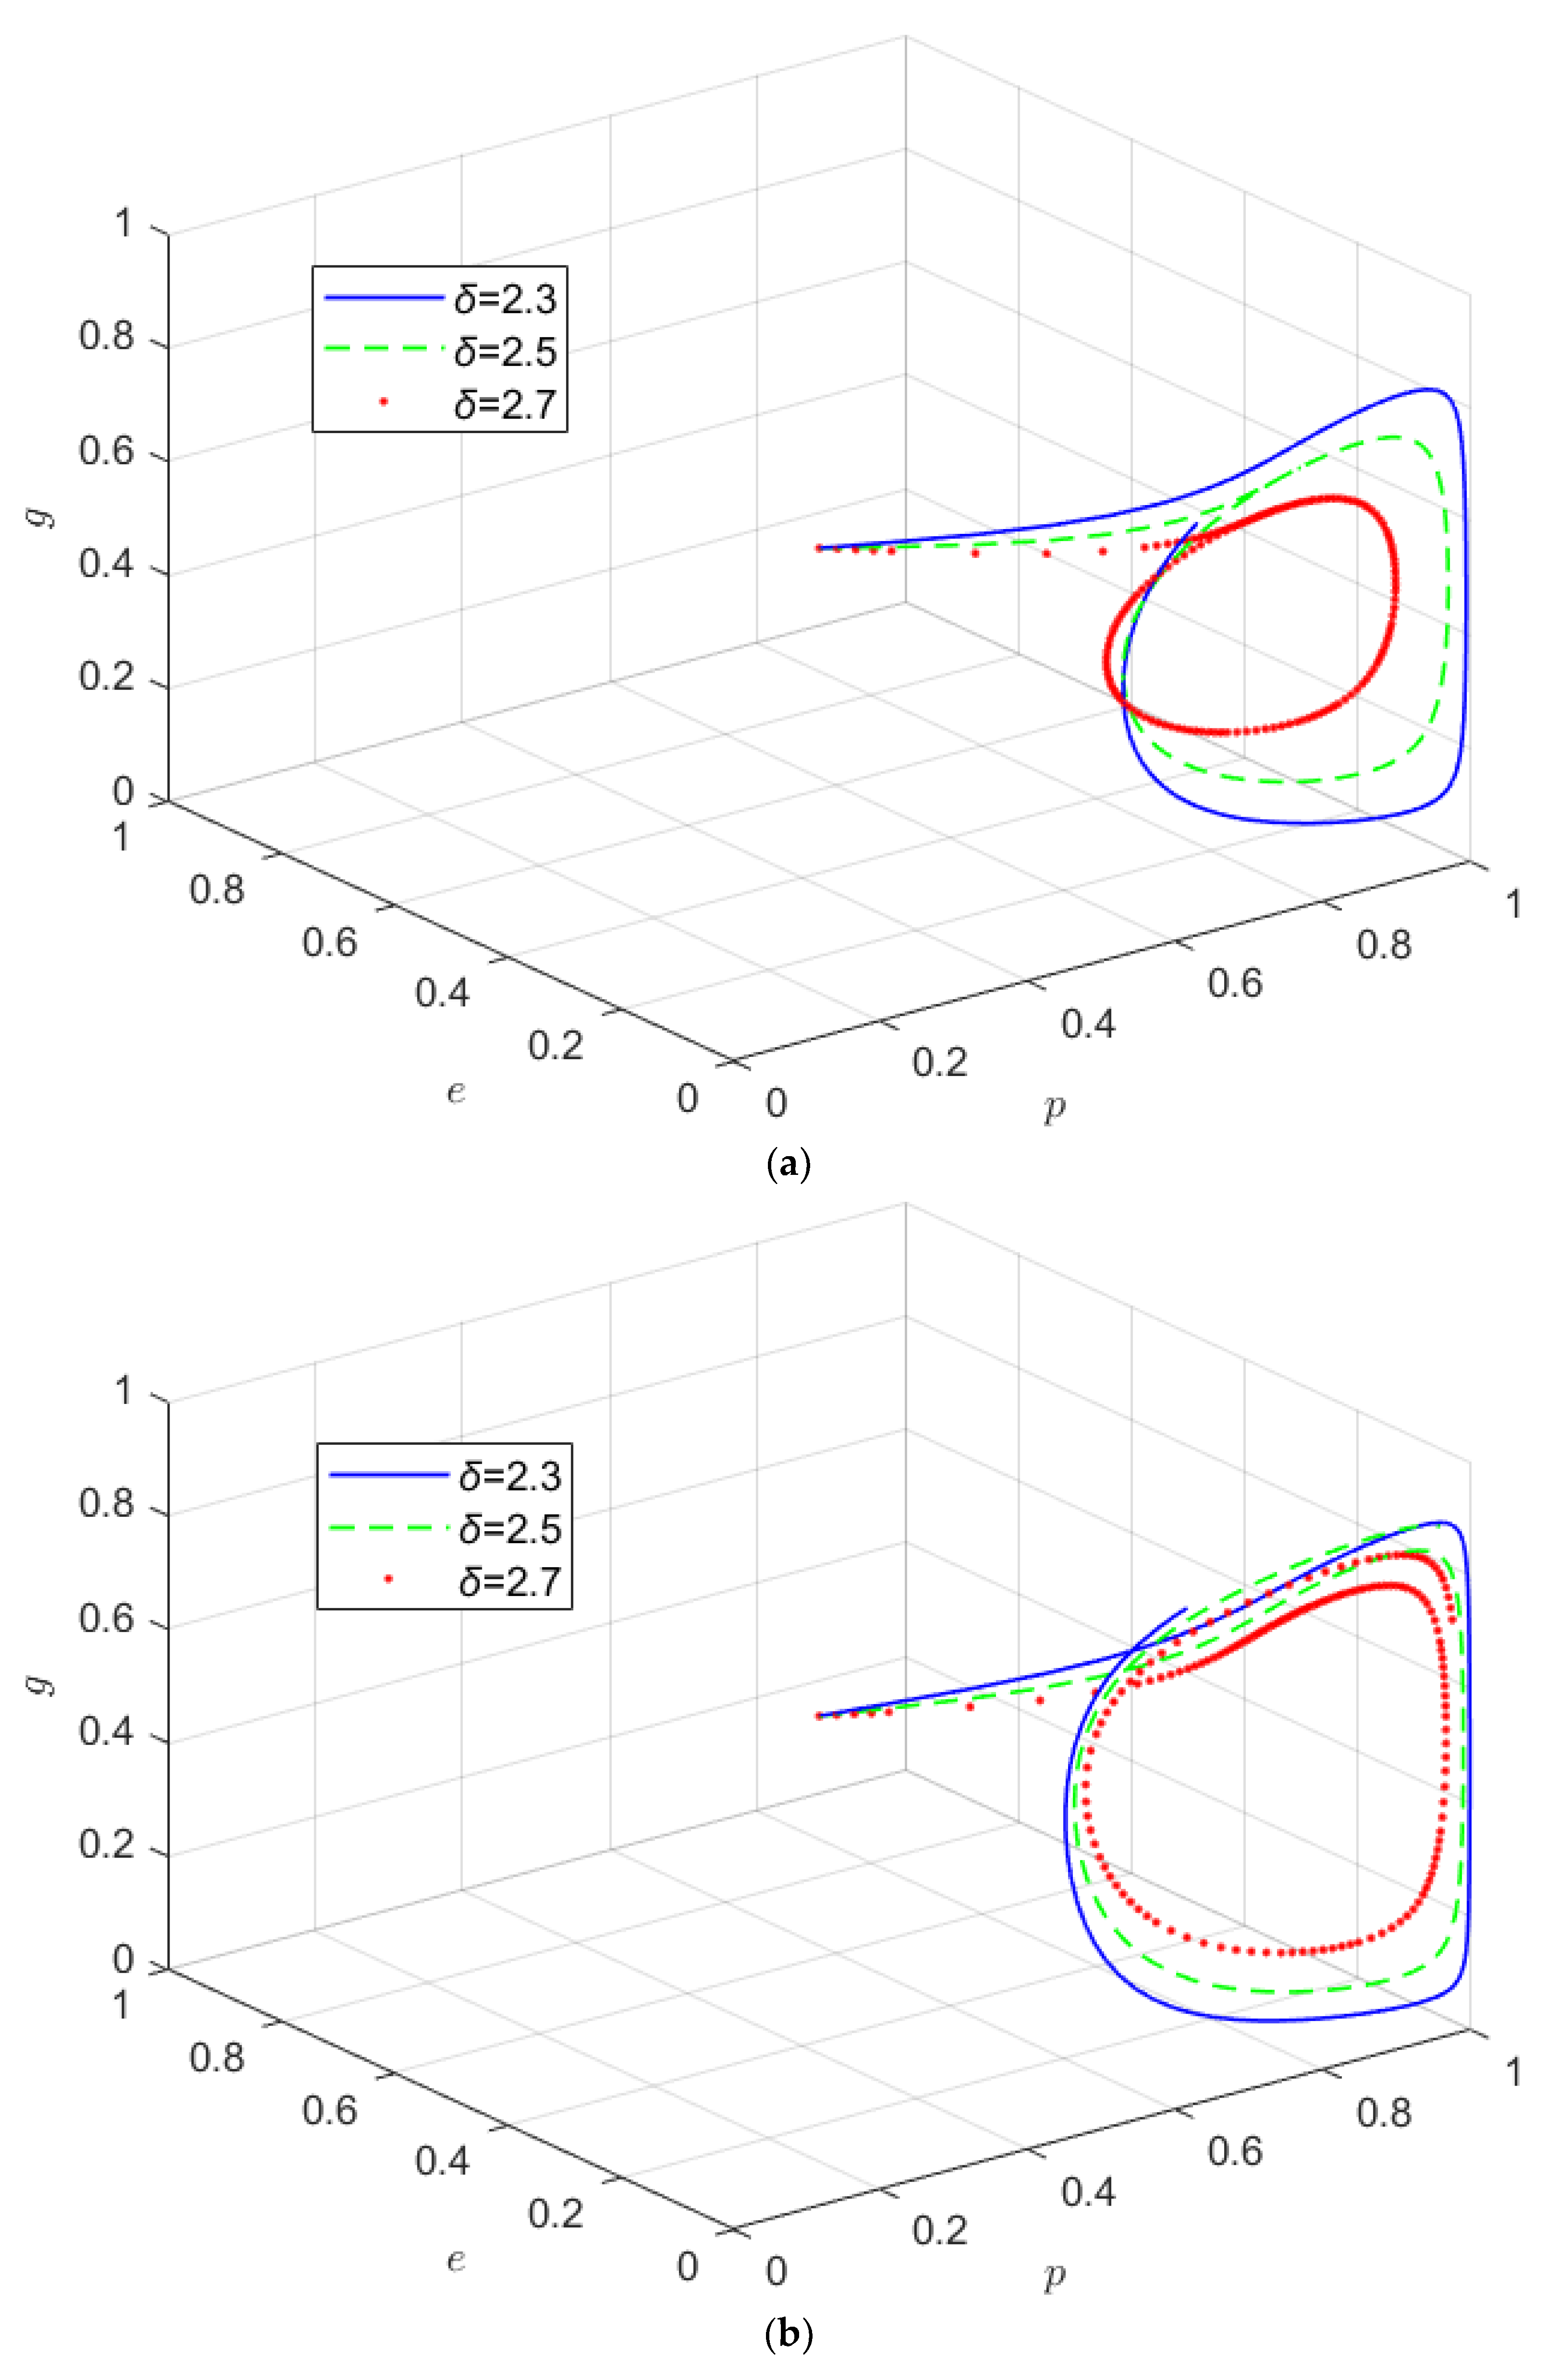
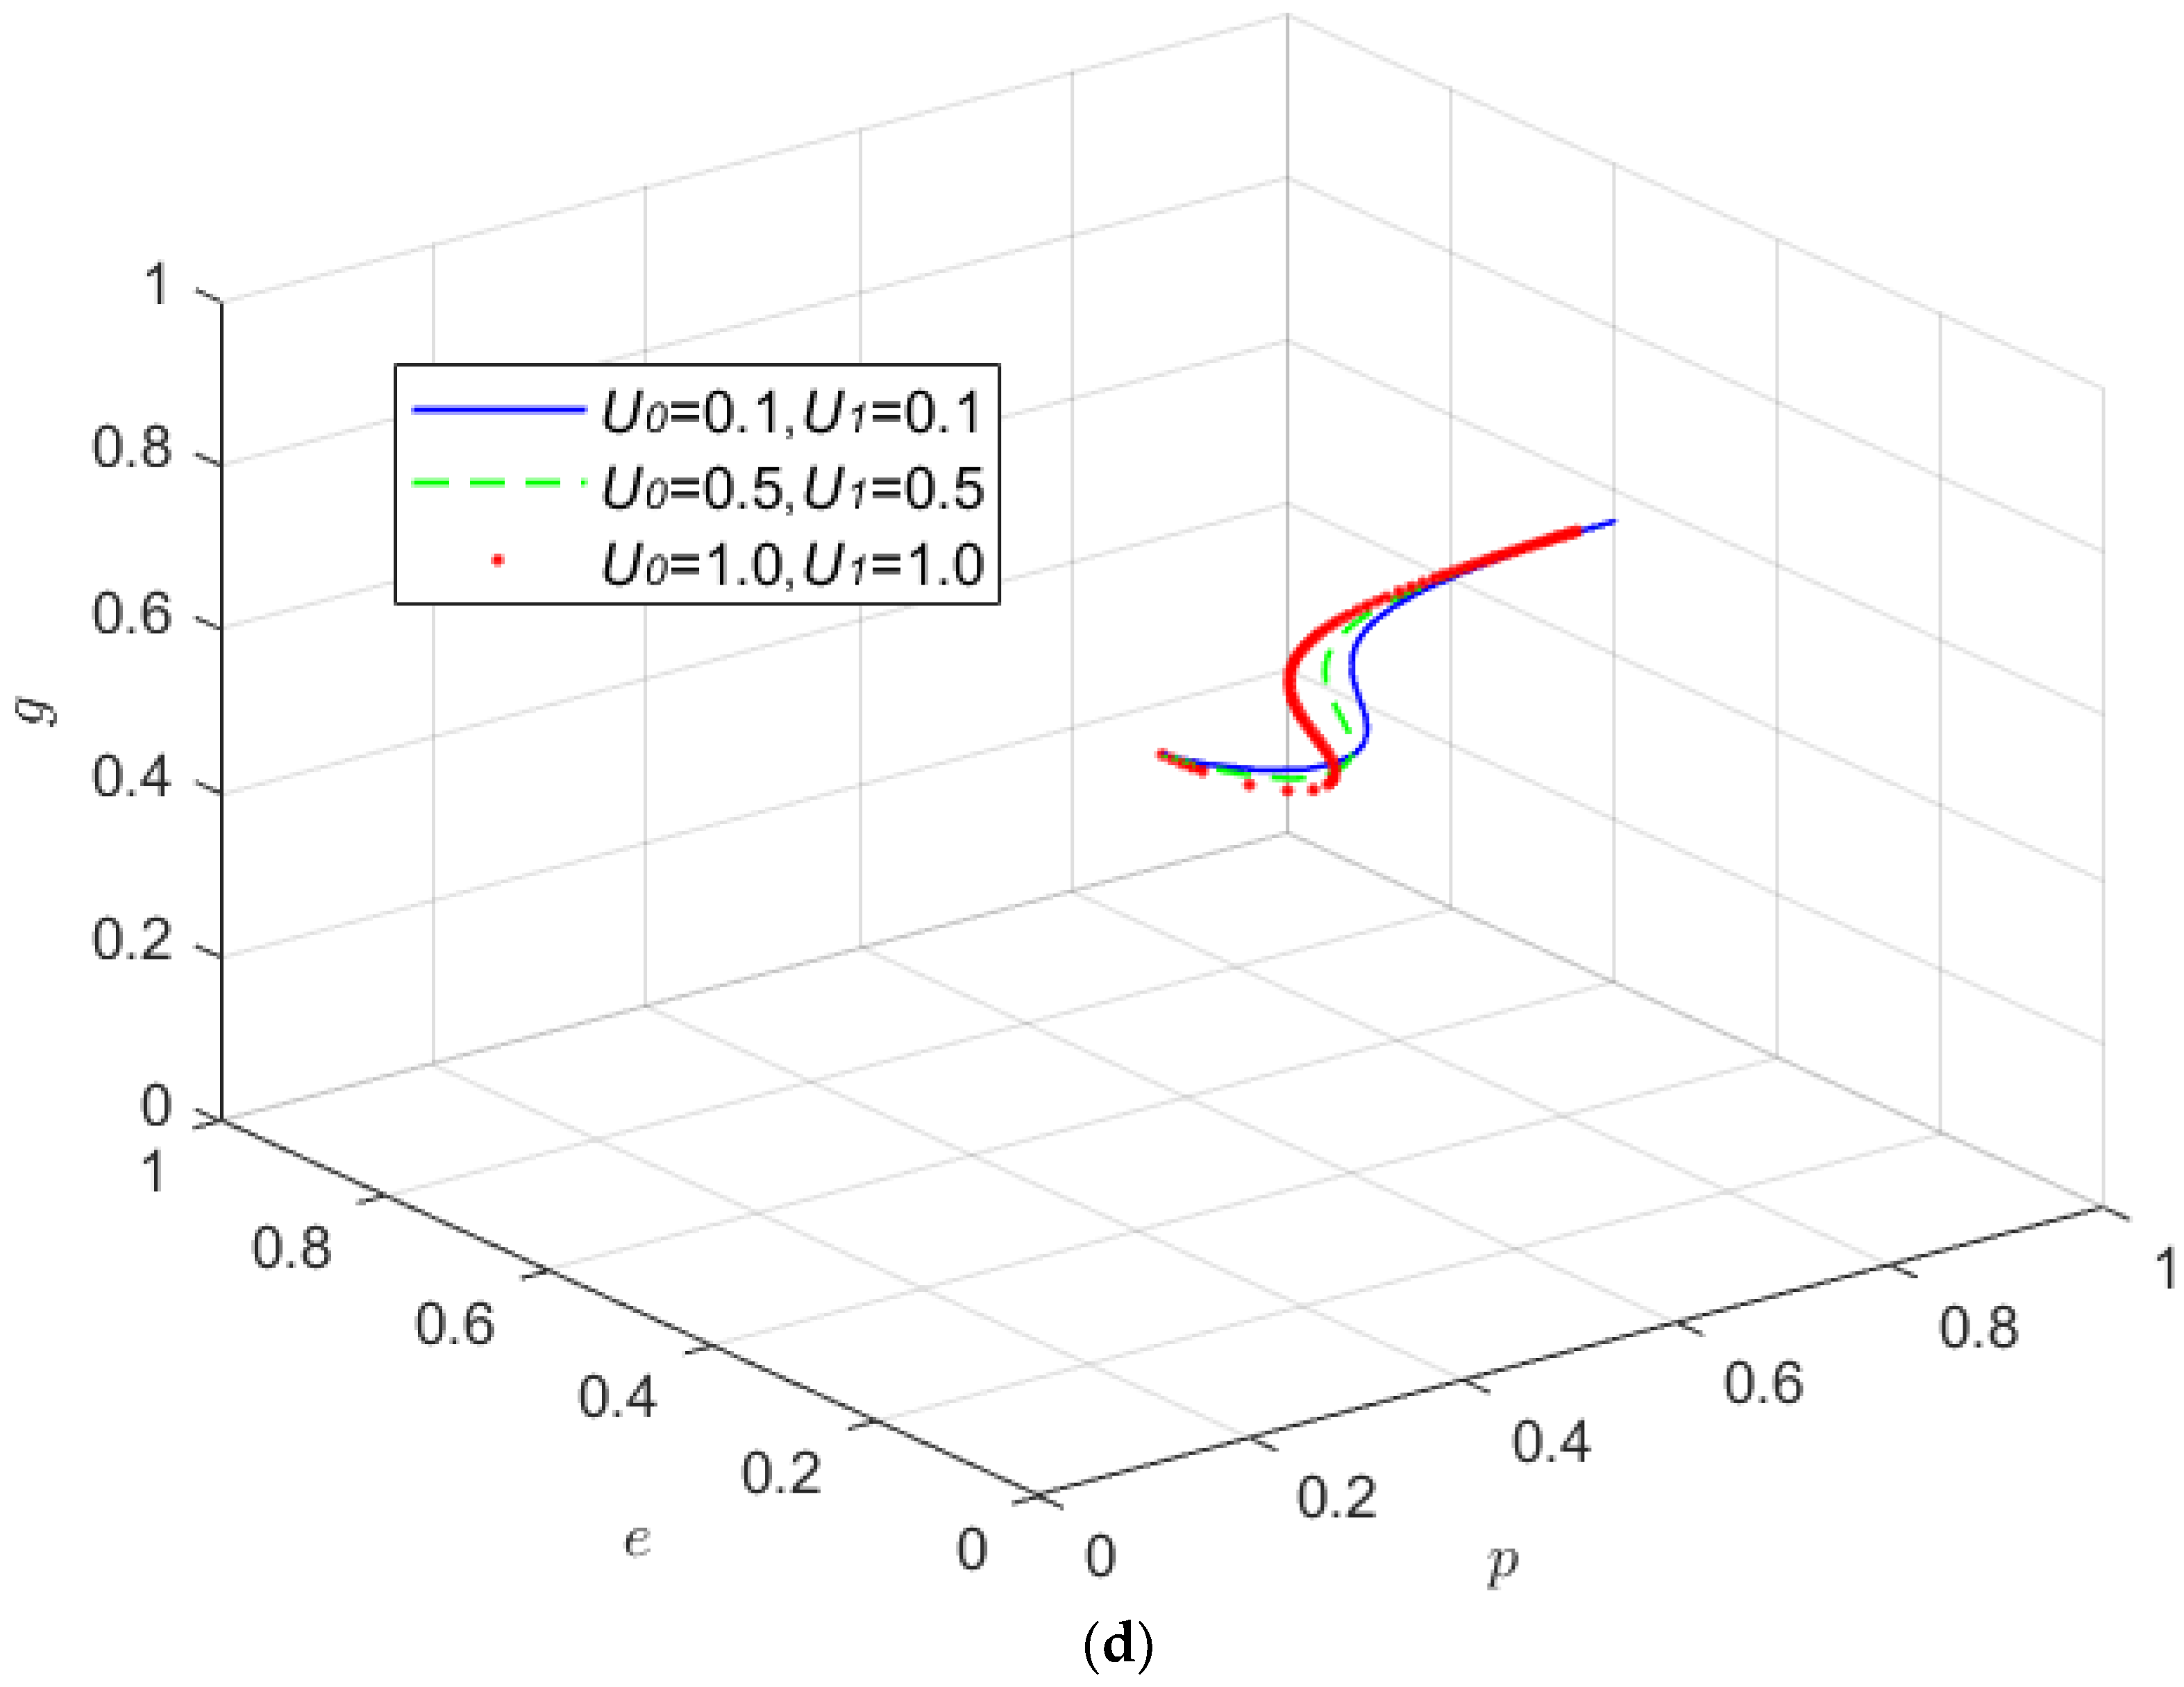
5.4. Influence of Reference Points

Take { U 0 = 0.1 , U 1 = 0.1 } , { U 0 = 0.5 , U 1 = 0.5 } , { U 0 = 1.0 , U 1 = 1.0 } , the strategy evolution process and results are shown in Figure 4.
Figure 4a–d show that, under the static reward and static punishment mechanism, and the dynamic reward and dynamic punishment mechanism, when the reference point is decreased, the oscillation amplitude of the system development progressively decreases, and the system’s stability gradually decreases. There is some improvement; under the static reward and dynamic punishment mechanism, as the reference point drops, the speed of system development and convergence accelerates, and the likelihood of supply side quality improvement increases.
This corresponds to the conclusion of the 3.3 outcome analysis. The subjective perceptions of decision makers regarding objective objects, rather than the real items themselves, influence their behavior and decision-making. That is, when the influencing factors such as income and cost remain constant, the change in the decision-own maker’s reference point will cause the decision-maker to have a different perception of the external influencing factors, which will then affect the decision-behavioral maker’s decision-making.
To promote the quality coordination of shared manufacturing, we can not only start with external regulations such as increasing the cost allocation ratio and establishing reward and punishment mechanisms, but we can also change the perceptions of costs and benefits of supply sides and other participating subjects by strengthening the overall quality view and establishing a long-term development concept.

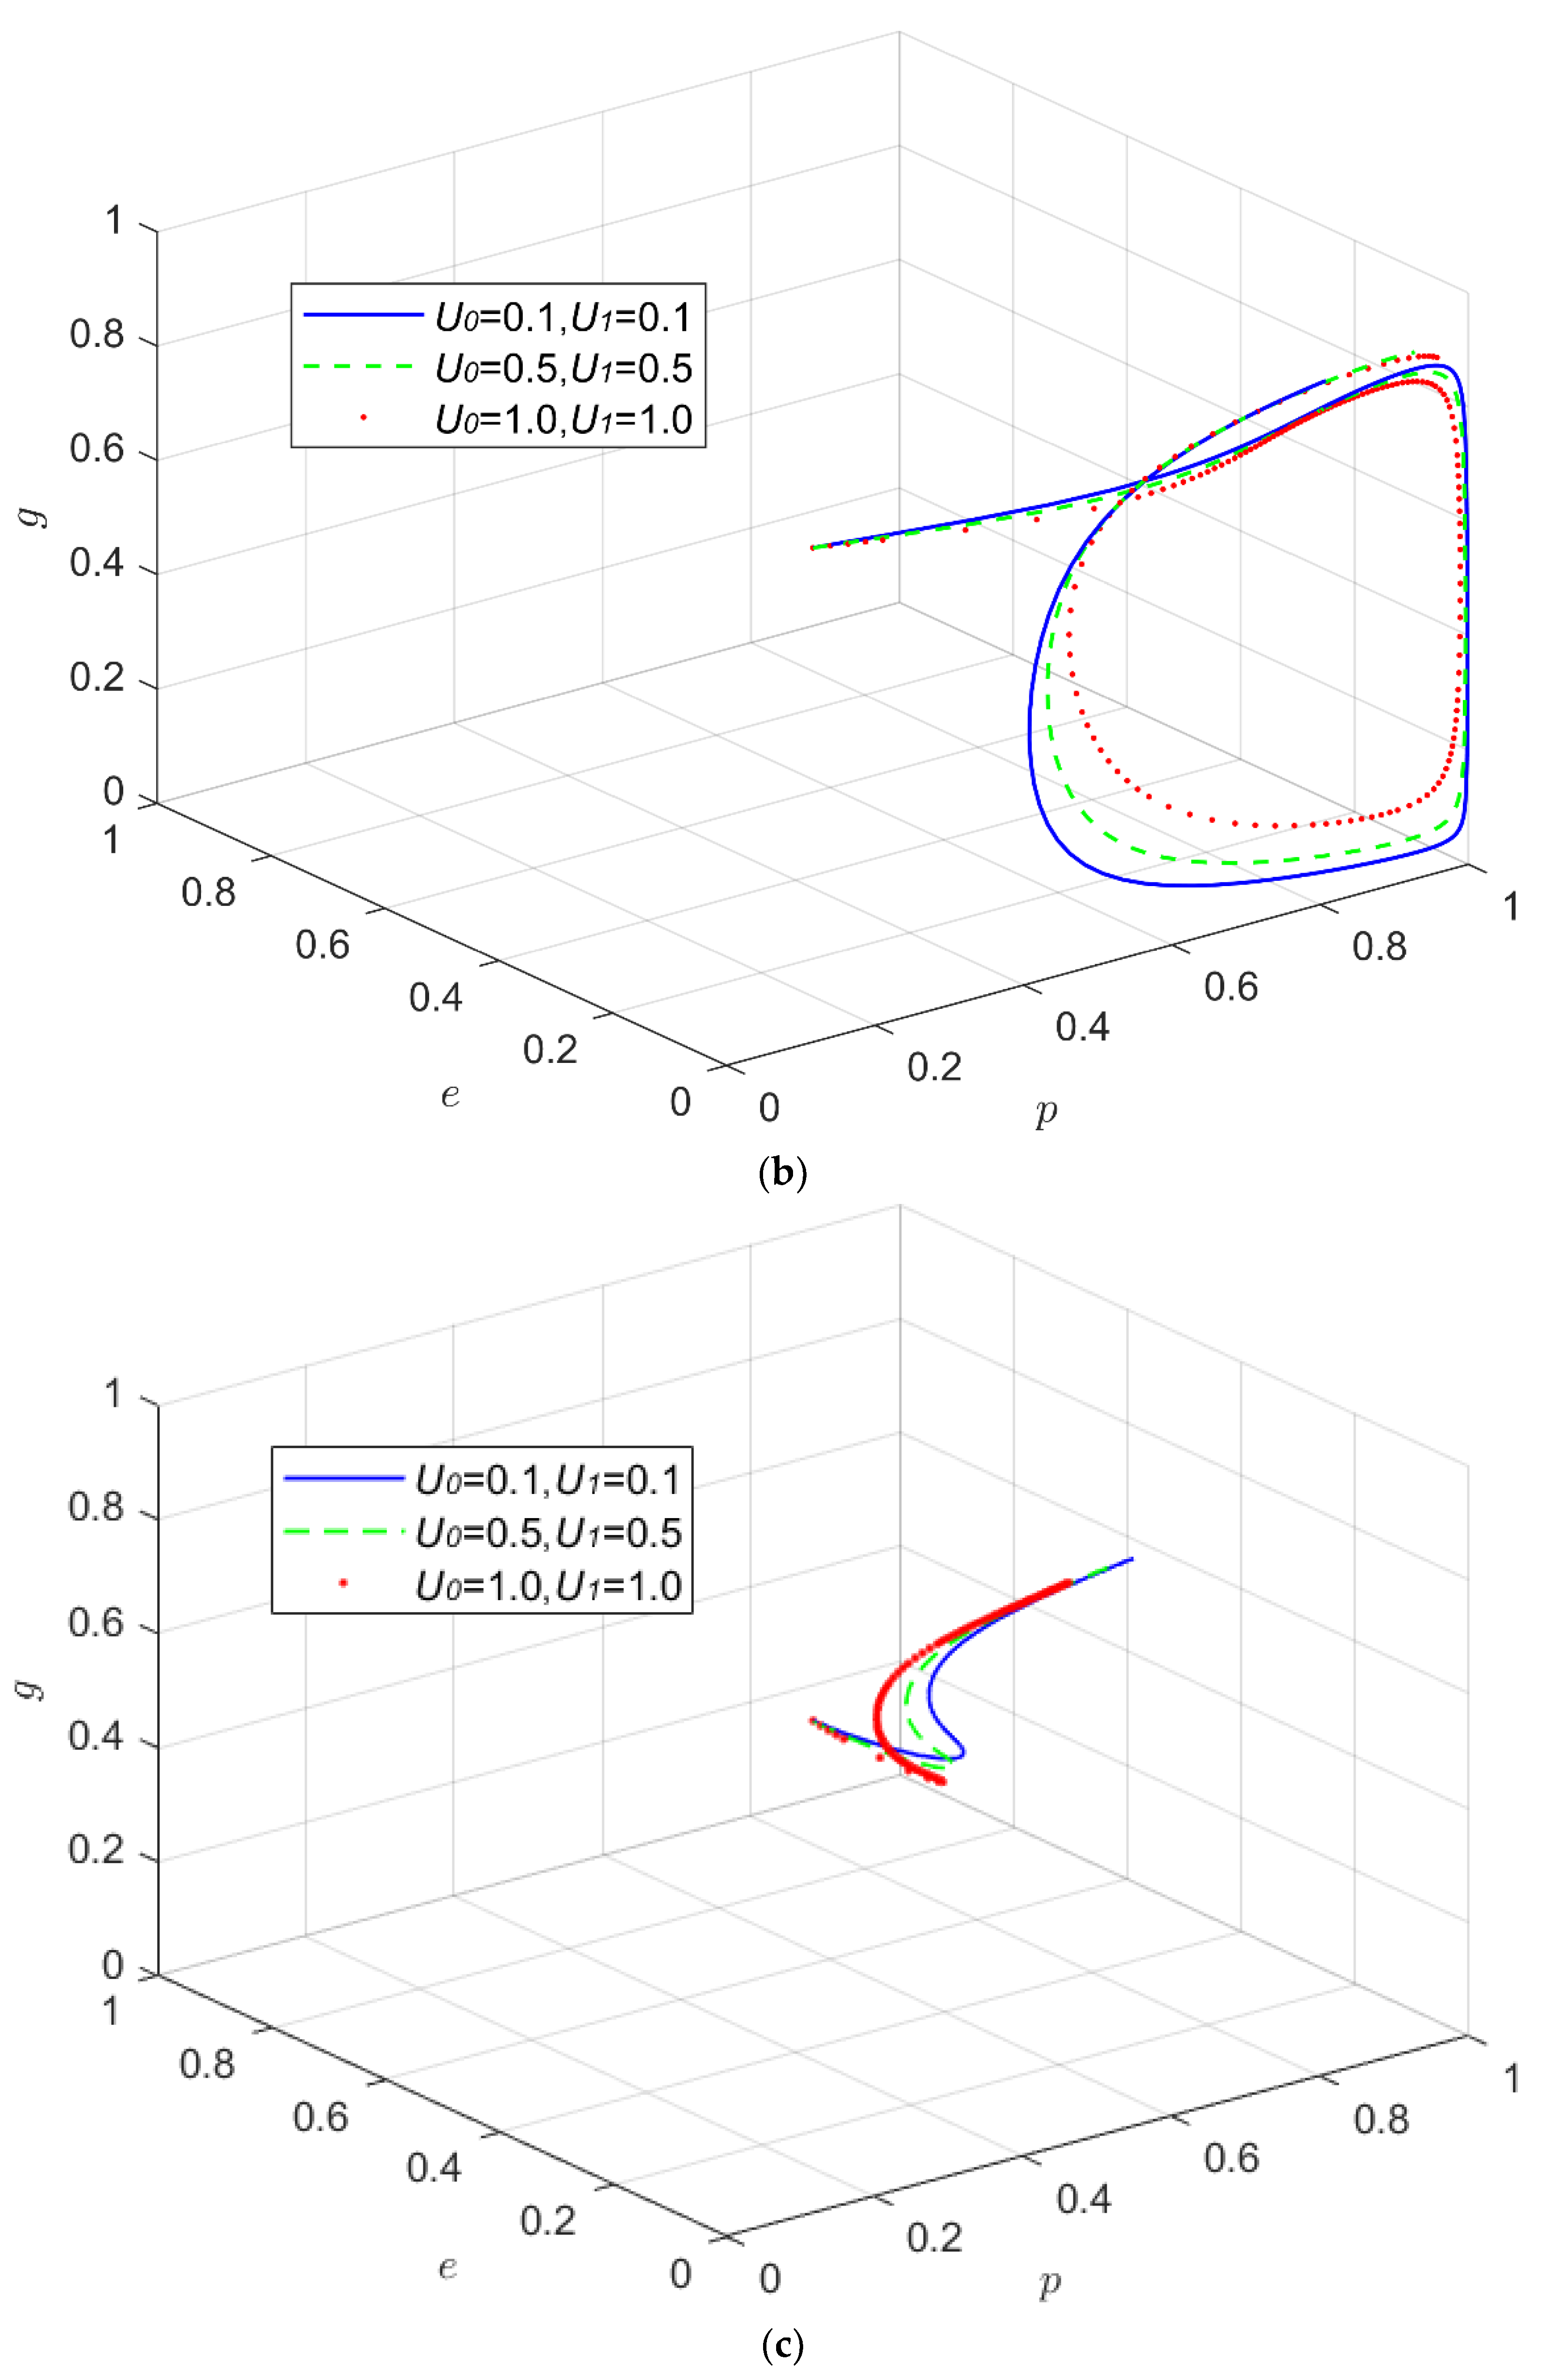
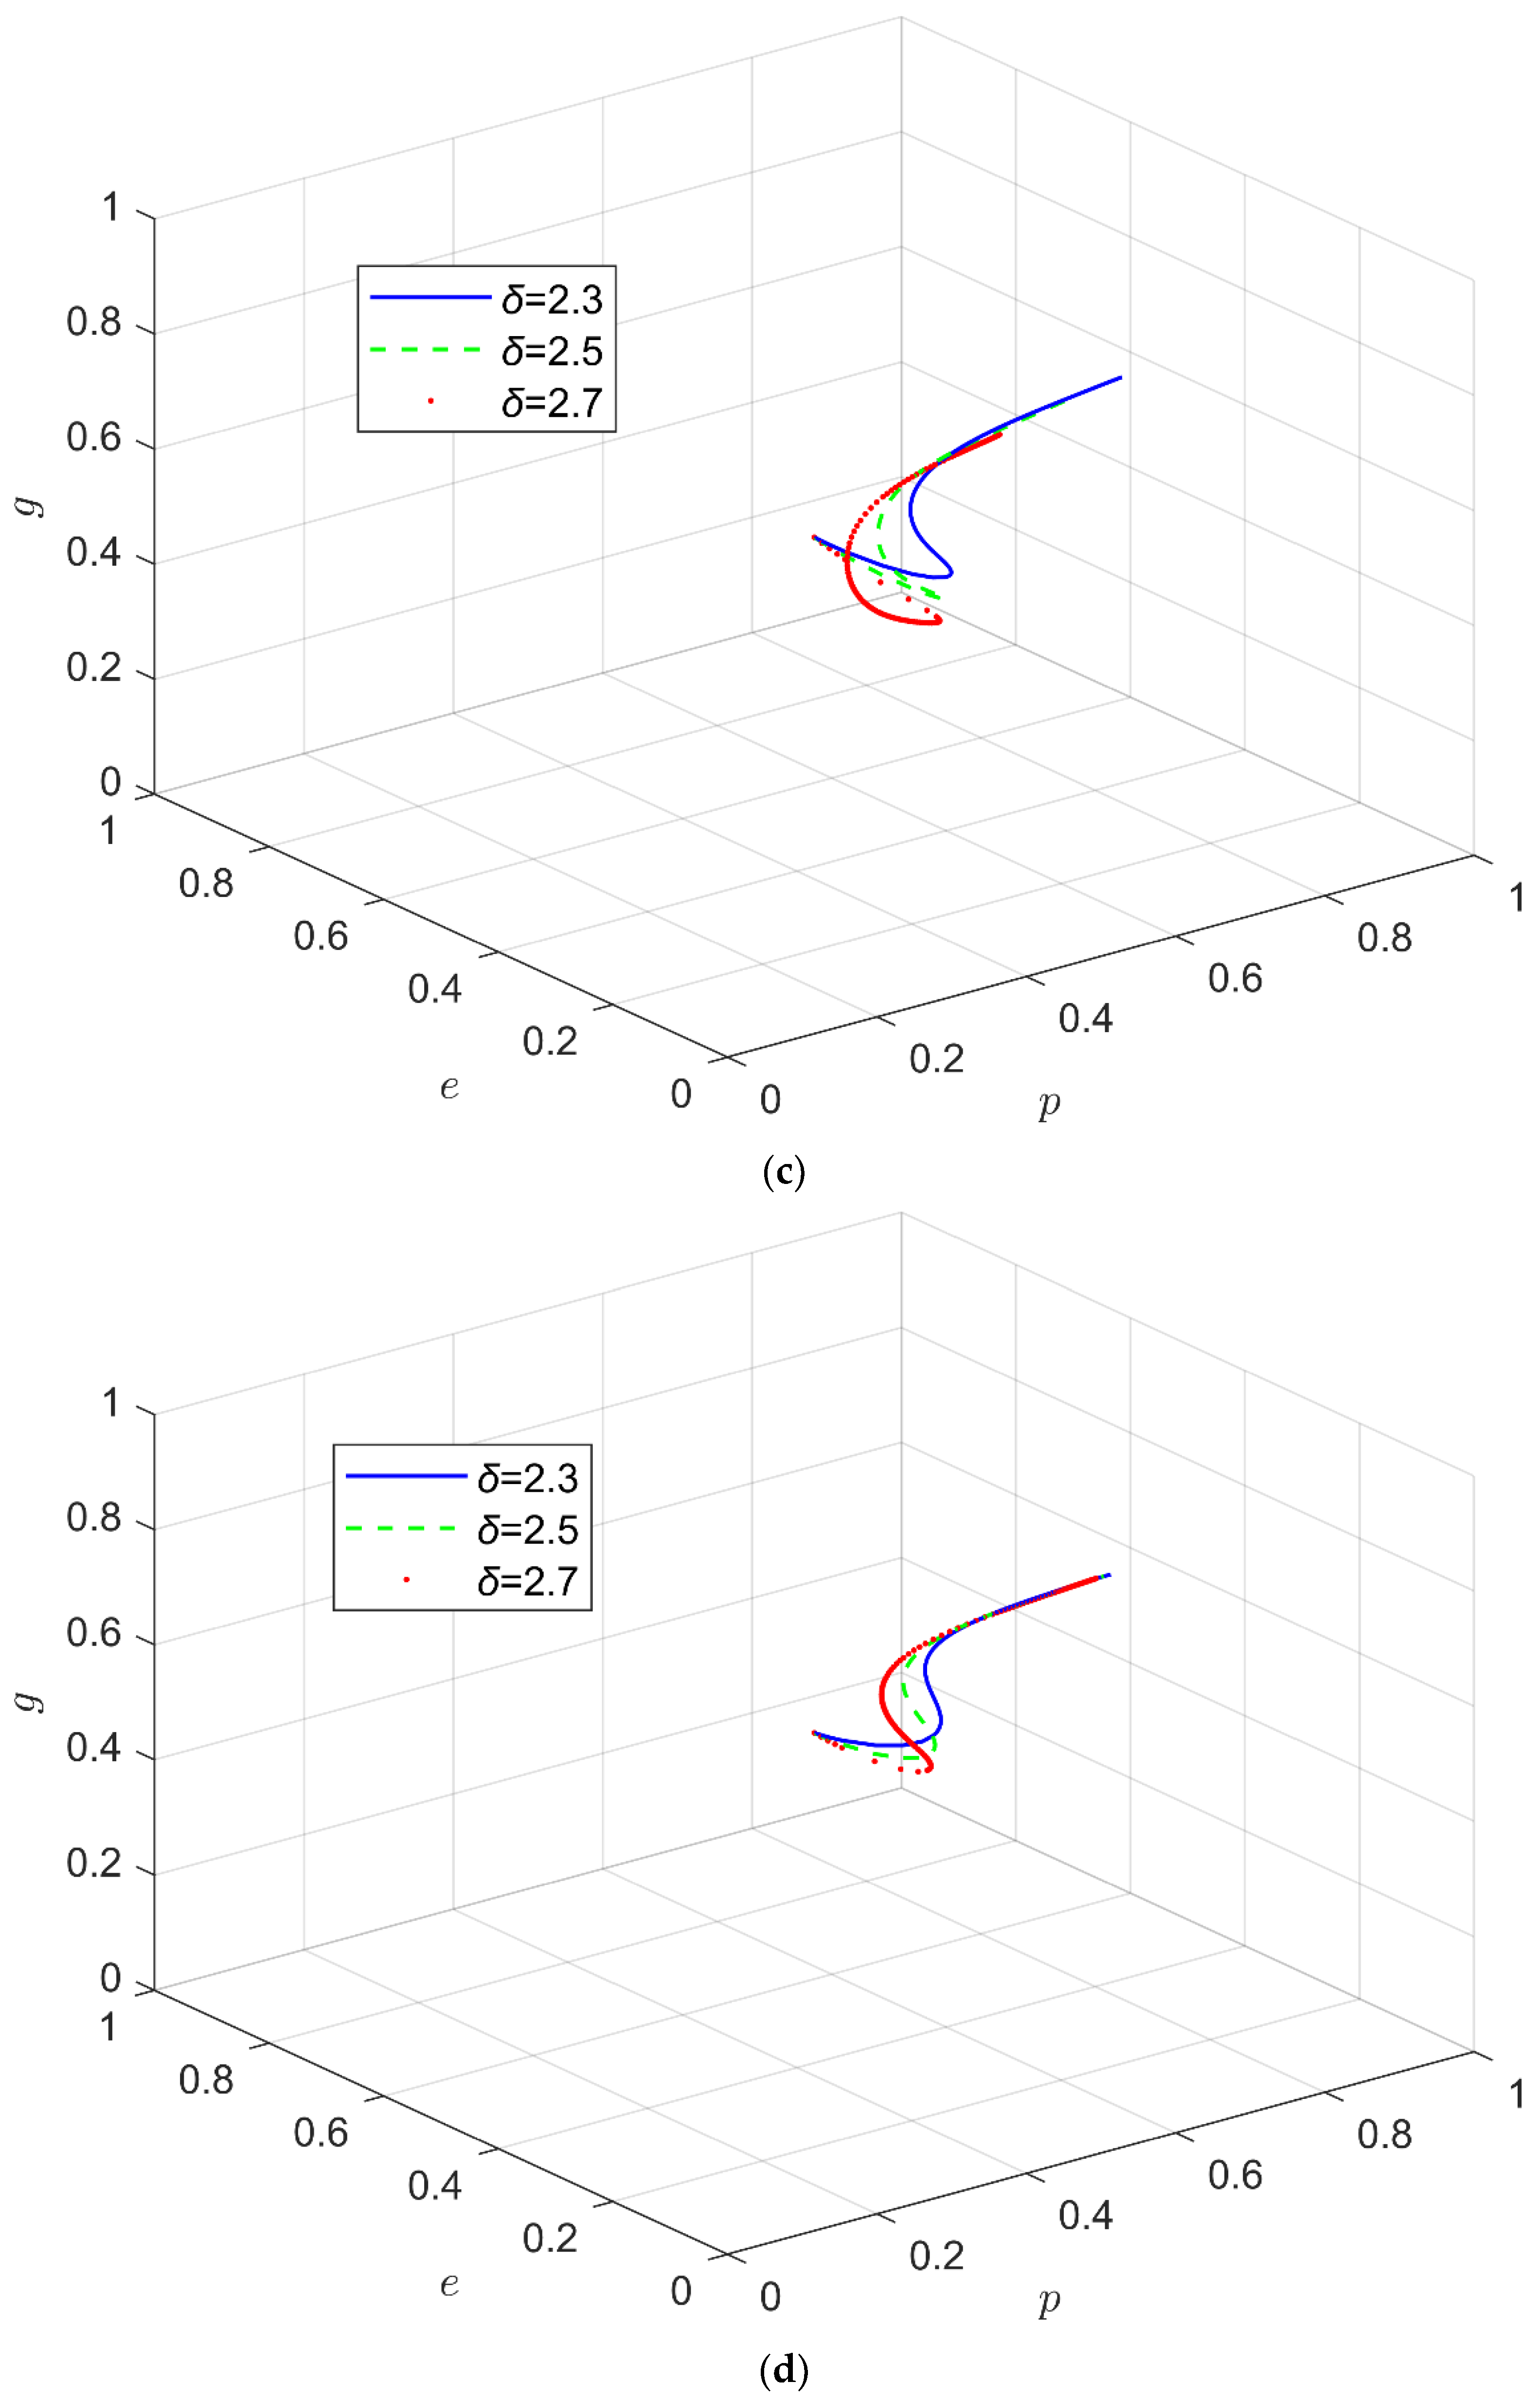
5.5. Influence of Loss Aversion Coefficient

Take { δ = 2.3 , δ = 2.5 , δ = 2.7 } , the strategy evolution process and results are shown in Figure 5.
As shown in Figure 5a–d, the oscillation amplitude of the system development steadily decreases as the loss avoidance coefficient increases under the static reward and static punishment mechanism, dynamic reward and dynamic punishment mechanism, and the system is stable. With the lowering of the loss avoidance coefficient in the static reward and dynamic punishment mechanism and the dynamic reward and dynamic punishment mechanism, the pace of system evolution and convergence grows faster, and the chance of supply side quality improvement improves.
In practice, the information access of decision makers is always limited, and the rationality of decision makers is also limited. As a result, when decision makers encounter a complicated decision-making environment, they will always display multiple levels of risk preference, and loss aversion is one of them. Various decision makers have different loss aversion attitudes, which will alter decision makers’ value perception and decision choices when external influencing factors stay constant.
As a result, assisting decision makers in developing the proper notion of profit and loss will help to improve the synergy impact of shared manufacturing quality.

6. The Impact of the Subsidy Mechanism on the Evolution of the System

According to the simulation analysis, the mechanism combination of dynamic reward and dynamic punishment can effectively improve the stability of system evolution and is better than other mechanism combinations in promoting the quality improvement of the supply side, however, the probability of cost allocation on the demand side is minimal, and the decision-making system has attained a stable state but not the theoretical optimum state. The synergistic impact of shared manufacturing quality is now weak, which is not favorable for the long-term steady growth of the shared manufacturing mode. As a result, this work develops a subsidy mechanism based on dynamic cost allocation and dynamic revenue sharing, builds a shared manufacturing decision-making model using the subsidy mechanism, and investigates the optimal boundary for the growth of shared manufacturing strategies.

6.1. The Impact of Subsidy Mechanism on System Evolution

In order to further improve the decision-making model, this paper introduces a subsidy mechanism. The shared platform provides certain subsidies to the subjects who actively participate in quality synergy to achieve the effect of incentives. The subsidy variable is represented by H e .
Based on this, a shared manufacturing decision model under the reputation mechanism is constructed. The value perception function of each game subject and the replica dynamic equation of strategy selection are as follows:
The value perception of “quality improvement” and “no quality improvement” in the supply side are T 1 p and T 2 p , respectively.
T 1 p = T ( Δ π ) w ( ε ) = w ( e ) [ w ( g ) ( P ( H a + H b + R ) C ( ( 1 K ) C p h ) ) + w ( 1 g ) ( P ( H a + H b ) C ( ( 1 K ) C p h H e ) ) ] + w ( 1 e ) [ w ( g ) ( P ( H a + H b + R ) C ( C p h H e + ϕ ψ L w ( q ) ) ) + w ( 1 g ) ( P ( H a + H b ) C ( C p h H e + ϕ ψ L w ( q ) ) ) ]
T 2 p = T ( Δ π ) w ( ε ) = w ( e ) [ w ( g ) ( P ( K C p h ) C ( F + ψ L w ( q ) ) ) + w ( 1 g ) ( P ( K C p h ) C ( ψ L w ( q ) ) ) ] + w ( 1 e ) [ w ( g ) ( C ( F + L w ( q ) ) ) + w ( 1 g ) ( C ( L w ( q ) ) ) ]
The average value perception of supply side is T p ¯ .
T p ¯ = p T 1 p + ( 1 p ) T 2 p
The dynamic equation of supply side replication is F ( p ) .
F ( p ) = d p / d t = p ( T 1 p T p ¯ ) = p ( 1 p ) ( T 1 p T 2 p ) = p ( 1 p ) { w ( e ) [ w ( g ) ( P ( H a + H b + R ) C ( ( 1 K ) C p h H e ) ) + w ( 1 g ) ( P ( H a + H b ) C ( ( 1 K ) C p h H e ) ) ] w ( e ) [ w ( g ) ( P ( K C p h ) C ( F + ψ L w ( q ) ) ) + w ( 1 g ) ( P ( K C p h ) C ( ψ L w ( q ) ) ) ] + w ( 1 e ) [ w ( g ) ( P ( H a + H b + R ) C ( C p h H e + ϕ ψ L w ( q ) ) ) + w ( 1 g ) ( P ( H a + H b ) C ( C p h H e + ϕ ψ L w ( q ) ) ) ] w ( 1 e ) [ w ( g ) ( C ( F + L w ( q ) ) ) + w ( 1 g ) ( C ( L w ( q ) ) ) ] }
The value perception of “cost sharing” and “no cost sharing” in the demand side are T 1 e and T 2 e , respectively.
T 1 e = T ( Δ π ) w ( ε ) = w ( p ) [ P ( H d ( Q b Q a ) ) C ( K C p h ) ] + w ( 1 p ) [ C ( k C p h + H d ( Q a Q c ) + ϕ ψ L w ( q ) ) ]
T 2 e = T ( Δ π ) w ( ε ) = w ( p ) [ P ( H d ( Q b Q a ) ) C ( ψ L w ( q ) ) ] + w ( 1 p ) [ C ( H d ( Q a Q c ) + L w ( q ) ) ]
The average value perception of demand side is T e ¯ .
T e ¯ = e T 1 e + ( 1 e ) T 2 e
The dynamic equation of demand side replication is F ( e ) .
F ( e ) = d e / d t = e ( T 1 e T e ¯ ) = e ( 1 e ) ( T 1 e T 2 e ) = e ( 1 e ) { w ( p ) [ P ( H d ( Q b Q a ) ) C ( K C p h ) ] w ( p ) [ P ( H d ( Q b Q a ) ) C ( ψ L w ( q ) ) ] + w ( 1 p ) [ C ( k C p h + H d ( Q a Q c ) + ϕ ψ L w ( q ) ) ] w ( 1 p ) [ C ( H d ( Q a Q c ) + L w ( q ) ) ] }
The value perception of “positive regulation” and “negative regulation” in the shared platform are T 1 g and T 2 g , respectively.
T 1 g = = T ( Δ π ) w ( ε ) = w ( p ) [ w ( e ) ( P ( H c ) C ( C g h + R ) ) + w ( 1 e ) ( P ( H c ) C ( C g h + α L + R ) ) ] + w ( 1 p ) [ w ( e ) ( P ( H c + F ) C ( C g h + α L ) ) + w ( 1 e ) ( P ( H c + F ) C ( C g h + L ) ) ]
T 2 g = T ( Δ π ) w ( ε ) = w ( p ) [ w ( 1 e ) ( C ( α L ) ) ] + w ( 1 p ) [ w ( e ) ( C ( α L ) ) + w ( 1 e ) ( C ( L ) ) ]
The average value perception of shared platform is T g ¯ .
T g ¯ = g T 1 g + ( 1 g ) T 2 g
The dynamic equation of shared platform replication is F ( g ) .
F ( g ) = d g / d t = g ( T 1 g T g ¯ ) = g ( 1 g ) ( T 1 g T 2 g ) = g ( 1 g ) { w ( p ) [ w ( e ) ( P ( H c ) C ( C g h + R ) ) + w ( 1 e ) ( P ( H c ) C ( C g h + α L + R ) ) ] w ( p ) [ w ( 1 e ) ( C ( α L ) ) ] + w ( 1 p ) [ w ( e ) ( P ( H c + F ) C ( C g h + α L ) ) + w ( 1 e ) ( P ( H c + F ) C ( C g h + L ) ) ] w ( 1 p ) [ w ( e ) ( C ( α L ) ) + w ( 1 e ) ( C ( L ) ) ] }

6.2. Model Analysis

In order to more intuitively show the impact of the subsidy mechanism on the behavior evolution of the supply side, the demand side and the shared platform, the following uses MATLAB R2020b to simulate the evolution trajectory of each game party.
Take { H e = 0 , H e = 2 , H e = 4 , } , the strategy evolution process and results are shown in Figure 6.
Figure 6 shows that the subsidy mechanism has a considerable impact on the evolution of the shared manufacturing system, and that the subsidy mechanism may effectively shift the location of the system’s equilibrium point. By observing the position of the equilibrium point in the three-dimensional coordinate map under various subsidy methods, it is discovered that with a continuous rise in subsidy intensity, the system evolution’s equilibrium point steadily develops and stabilizes close to (1, 1, 1). It can be seen that the implementation of the subsidy mechanism not only ensures that the shared platform maintains high supervision enthusiasm, but also significantly improves the probability of quality improvement on the supply side and the probability of cost allocation on the demand side, and effectively promotes the shared decision-making system’s stability strategy to “Pareto optimality.” “The direction evolves and finally stabilizes at quality improvement, cost sharing, active supervision, at which time the shared decision-making system reaches both a stable and optimum state.”
Many factors impact shared manufacturing quality coordination. The literature [12,13,14] conducted a number of studies on quality improvement, but they were all based on traditional expected utility theory. Traditional game analysis, due to its inherent limitations, makes it impossible to ensure the robustness and scientificity of the conclusions. Based on the theory of unexpected utility, reference [9] conducted an evolutionary game analysis on the quality improvement of shared manufacturing, but the evolutionary game model built, only involves two game subjects. This research incorporates prospect theory and mental account theory into tripartite evolutionary game analysis, allowing constrained rationality to pervade the entire process while evaluating the law of development of each game subject’s behavior under the combination of numerous reward and punishment mechanisms.

7. Conclusions

7.1. Key Summary

(1)
The synergistic improvement of shared manufacturing quality is the consequence of the combined action of numerous interrelated and interacting factors, rather than the linear effect of a single element. Objective elements impacting quality coordination include incentives and penalties, cost allocation ratio, quality spillover risk, and quality accident risk; subjective aspects include reference point, value perception, loss avoidance, etc. Subjective perceptions of participants can nevertheless influence each participant’s strategic choice in shared production if the objective conditions stay constant.
(2)
Although the combination of multiple incentive and punishment methods can significantly alter the effect of shared manufacturing quality synergy, there are certain effectiveness gaps. In terms of the combined effect of different reward and punishment mechanisms, static reward and dynamic punishment mechanism, dynamic reward and dynamic punishment mechanism, dynamic reward and dynamic punishment mechanism, dynamic reward and dynamic punishment mechanism can effectively change the stability of system evolution, while the intervention effect of dynamic reward and dynamic punishment mechanism is the best. Even with the optimal combination intervention mechanism, however, there are still problems such as low demand for cost allocation on the demand side. Although the system has reached a stable state, it is still far from ideal.
(3)
The subsidy mechanism can effectively compensate for the effectiveness gap of the reward and punishment mechanism, and it can also strengthen the internal driving force of shared manufacturing quality coordination. The implementation of a subsidy mechanism can considerably raise the eagerness of both the supply and demand sides of shared manufacturing to engage in quality coordination, shifting the driving force of shared manufacturing quality coordination from external control to subject consciousness. As a result, the development of the shared manufacturing quality synergistic system enters a stable state, tends to the evolution of the “Pareto optimum” technique, and eventually stabilizes in the ideal state.

7.2. Management Insights

The following are the practical ramifications and managerial implications of the above model analysis’s results for quality improvement in shared manufacturing.
(1)
Consider strong external regulation to be the framework constraint, and positive internal control to be the detail specification. While adjusting the incentives and punishments, as well as the risk of quality spillovers, to create a good environment for the synergistic improvement of quality in the shared manufacturing model, strengthen the training and publicity of the shared manufacturing participants, and improve the quality awareness of the subjects with a quality concept that considers the overall situation and long-term goals. External regulation and internal control work together to assist shared manufacturing quality improve synergistically.
(2)
Create a reliable reward and punishment mechanism and dynamically alter the intensity of rewards and penalties. Take the reward and punishment mechanism as an important mechanism foundation, and dynamically adjust the rewards and punishments based on each participant’s actual strategy choice, to avoid the drawbacks of the “one-size-fits-all” reward and punishment mechanism, which cannot fully mobilize the participants’ enthusiasm. The circumstance must be documented and sorted out as an important foundation for determining rewards and punishments in the following reward and punishment cycle.
(3)
To close the effectiveness gap, strengthen the subsidy mechanism as an essential addition to the incentive and punishment mechanisms. The subsidy mechanism is used as an important supplement to form a complete incentive chain of “subsidy before behavior, reward and punishment after behavior,” and promote the active participation of all subjects in shared manufacturing quality synergistic improvement on the basis of implementing the dynamic reward and punishment mechanism. The “pay attention and everyone is involved” quality coordination environment ensures the long-term growth of shared manufacturing quality synergistic improvement.
This paper constructs a tripartite evolutionary game model involving the supply side, the demand side, and the shared platform. The countermeasures and suggestions proposed in this paper, such as establishing a reward and punishment mechanism, improving a subsidy mechanism, and establishing a correct cost-benefit concept provide a new path reference for improving the quality of shared manufacturing, which will aid in the healthy development of shared manufacturing and fully exploit its positive role in manufacturing industry transformation. At the same time, government regulators have a significant impact on the quality improvement of shared manufacturing. Therefore, considering the important role of government regulators, building a quadrilateral game model of shared manufacturing supply side, demand side, shared platform, and government regulators is the next research direction.

Author Contributions

All authors contributed to the study conception and design. Material preparation, review and editing were performed by X.W., C.S. and L.S. The first draft of the manuscript was written by Z.Z. and all authors commented on previous versions of the manuscript. All authors have read and agreed to the published version of the manuscript.

Funding

This work was supported by The National Social Science Fund of China (grant numbers 20BJY109).

Institutional Review Board Statement

Not applicable.

Informed Consent Statement

Not applicable.

Data Availability Statement

Data can be obtained from the corresponding author upon reasonable request.

Conflicts of Interest

The authors declare no conflict of interest.

References

  1. Rozman, N.; Diaci, J.; Corn, M. Scalable framework for blockchain-based shared manufacturing. Robot. Comput.-Integr. Manuf. 2021, 71, 102139. [Google Scholar] [CrossRef]
  2. Liu, P.; Zou, Y. Two-Sided Matching Model of Shared Manufacturing Resources considering Psychological Behavior of Agents. Discret. Dyn. Nat. Soc. 2021, 2021, 7491913. [Google Scholar] [CrossRef]
  3. Yu, C.; Xu, X.; Yu, S.; Sang, Z.; Yang, C.; Jiang, X. Shared manufacturing in the sharing economy: Concept, definition and service operations. Comput. Ind. Eng. 2020, 146, 106602. [Google Scholar] [CrossRef]
  4. Oberg, C. Disruptive and Paradoxical Roles in the Sharing Economies. Int. J. Innov. Manag. 2021, 25, 2150045. [Google Scholar] [CrossRef]
  5. Lan, J.; Ma, Y.; Zhu, D.; Mangalagiu, D.; Thornton, T.F. Enabling Value Co-Creation in the Sharing Economy: The Case of Mobike. Sustainability 2017, 9, 1504. [Google Scholar] [CrossRef] [Green Version]
  6. Ma, Y.; Rong, K.; Luo, Y.; Wang, Y.; Mangalagiu, D.; Thornton, T.F. Value Co-creation for sustainable consumption and production in the sharing economy in China. J. Clean. Prod. 2019, 208, 1148–1158. [Google Scholar] [CrossRef]
  7. Yan, J.; Meng, Y.; Lu, L.; Li, L. Industrial Big Data in an Industry 4.0 Environment: Challenges, Schemes, and Applications for Predictive Maintenance. IEEE Access 2017, 5, 23484–23491. [Google Scholar] [CrossRef]
  8. Tambare, P.; Meshram, C.; Lee, C.-C.; Ramteke, R.J.; Imoize, A.L. Performance Measurement System and Quality Management in Data-Driven Industry 4.0: A Review. Sensors 2022, 22, 224. [Google Scholar] [CrossRef]
  9. Zhang, Z.; Wang, X.; Su, C.; Sun, L. Evolutionary Game Analysis of Shared Manufacturing Quality Innovation Synergetic Behavior Considering a Subject’s Heterogeneous Emotions. Processes 2022, 10, 1233. [Google Scholar] [CrossRef]
  10. Wen, X.; Siqin, T. How do product quality uncertainties affect the sharing economy platforms with risk considerations? A mean-variance analysis. Int. J. Prod. Econ. 2020, 224, 107544. [Google Scholar] [CrossRef]
  11. Besik, D.; Nagurney, A. Quality in competitive fresh produce supply chains with application to farmers’ markets. Socio-Econ. Plan. Sci. 2017, 60, 62–76. [Google Scholar] [CrossRef]
  12. Xie, G.; Yue, W.; Wang, S. Quality Improvement Policies in a Supply Chain with Stackelberg Games. J. Appl. Math. 2014, 2014, 848593. [Google Scholar] [CrossRef]
  13. Yang, S.; Zhuang, J.; Wang, A.; Zhang, Y. Evolutionary Game Analysis of Chinese Food Quality considering Effort Levels. Complexity 2019, 2019, 6242745. [Google Scholar] [CrossRef] [Green Version]
  14. Zhang, C.; Xing, P.; Wang, J. Quality effort decision in service supply chain with quality preference based on quantum game. Int. J. Mod. Phys. C 2015, 26, 1550073. [Google Scholar] [CrossRef]
  15. He, J.; Zhang, J.; Gu, X. Research on sharing manufacturing in Chinese manufacturing industry. Int. J. Adv. Manuf. Technol. 2019, 104, 463–476. [Google Scholar] [CrossRef]
  16. Wang, X.; Zhang, C.; Deng, J.; Su, C.; Gao, Z. Analysis of Factors Influencing Miners’ Unsafe Behaviors in Intelligent Mines using a Novel Hybrid MCDM Model. Int. J. Environ. Res. Public Health 2022, 19, 7368. [Google Scholar] [CrossRef] [PubMed]
  17. Kuhn, H.W.; von Neumann, J.; Morgenstern, O.; Rubinstein, A. Theory of Games and Economic Behavior; Princeton University Press: Princeton, NJ, USA, 2007. [Google Scholar]
  18. Shen, H.; Peng, Y.; Guo, C. Analysis of the Evolution Game of Construction and Demolition Waste Recycling Behavior Based on Prospect Theory under Environmental Regulation. Int. J. Environ. Res. Public Health 2018, 15, 1518. [Google Scholar] [CrossRef] [Green Version]
  19. Fisher, S.A.; Mandel, D.R. Prospect Theory: An Analysis of Decision under Risk. Econometrica 1979, 47, 263–291. [Google Scholar] [CrossRef] [Green Version]
  20. Ma, C.; Chen, Y.; Nie, S. Four-Way Evolutionary Game Analysis of Government Project Bidding Collusion in a State of Limited Rationality Based on Prospect Theory. Comput. Intell. Neurosci. 2022, 2022, 6092802. [Google Scholar] [CrossRef]
  21. Wang, D.; Jia, Q.; Zhang, R. Evolutionary Game and Simulation of Subject Risk Management Behavior in Construction Stage of Engineering Project Based on Strong Reciprocity and Prospect Theory. IEEE Access 2021, 9, 74789–74801. [Google Scholar] [CrossRef]
  22. Yu, X.; Dong, G.; Liu, C. The Tripartite Regulation Game of Carbon Financial Products Based on the Prospect Theory. Front. Environ. Sci. 2020, 8, 610732. [Google Scholar] [CrossRef]
  23. Thaler, R.H. Mental accounting matters. J. Behav. Decis. Mak. 1999, 12, 183–206. [Google Scholar] [CrossRef]
  24. Wu, B.; Cheng, J.; Qi, Y. Tripartite evolutionary game analysis for “Deceive acquaintances” behavior of e-commerce platforms in cooperative supervision. Phys. A Stat. Mech. Its Appl. 2019, 550, 123892. [Google Scholar] [CrossRef]
  25. Tversky, A.; Kahneman, D. Advances in Prospect Theory: Cumulative Representation of Uncertainty. J. Risk Uncertain. 1992, 5, 297–323. [Google Scholar] [CrossRef]
  26. Gurevich, G.; Kliger, D.; Levy, O. Decision-making under uncertainty—A field study of cumulative prospect theory. J. Bank. Financ. 2009, 33, 1221–1229. [Google Scholar] [CrossRef]
Figure 1. (a) Evolution path diagram under static reward and static penalty mechanism, (b) Evolution path diagram under dynamic reward and static punishment mechanism, (c) Evolution path diagram under static reward and dynamic punishment mechanism, (d) Evolution path diagram under dynamic reward and dynamic punishment mechanism.
Applsci 12 06792 g001aApplsci 12 06792 g001bApplsci 12 06792 g001c
Figure 2. (a) Influence of cost sharing ratio on system evolution under static reward and static penalty system. (b) Influence of cost sharing ratio on system evolution under dynamic reward and static penalty system. (c) Influence of cost sharing ratio on system evolution under static reward and dynamic penalty system. (d) Influence of cost sharing ratio on system evolution under dynamic reward and dynamic penalty system.
Applsci 12 06792 g002aApplsci 12 06792 g002bApplsci 12 06792 g002c
Figure 3. (a) Influence of quality improvement returns on system evolution under static reward and static penalty systems. (b) Influence of quality improvement returns on system evolution under dynamic reward and static penalty systems. (c) Influence of quality improvement returns on system evolution under static reward and dynamic penalty system. (d) Influence of quality improvement returns on system evolution under dynamic reward and dynamic penalty systems.
Applsci 12 06792 g003aApplsci 12 06792 g003b
Figure 4. (a) Influence of reference points on system evolution under static reward and static penalty systems. (b) Influence of reference points on system evolution under dynamic reward and static penalty systems. (c) Influence of reference points on system evolution under static reward and dynamic penalty systems. (d) Influence of reference points on system evolution under dynamic reward and dynamic penalty systems.
Applsci 12 06792 g004aApplsci 12 06792 g004bApplsci 12 06792 g004c
Figure 5. (a) Influence of loss avoidance coefficient on system evolution under static reward and static penalty system. (b) Influence of loss avoidance coefficient on system evolution under dynamic reward and static penalty system. (c) Influence of loss avoidance coefficient on system evolution under static reward and dynamic penalty system. (d) Influence of loss avoidance coefficient on system evolution under dynamic reward and dynamic penalty system.
Applsci 12 06792 g005aApplsci 12 06792 g005b
Figure 6. The impact of the subsidy mechanism on the evolution of the system.
Applsci 12 06792 g006
Table 1. Benefit Perception Matrix.
Shared Platform
Active regulation gNegative regulation 1 − g
Supply side
quality improvement
p
demand side
cost sharing
e
P ( H a + H b + R ) C ( ( 1 K ) C p h ) P ( H a + H b ) C ( ( 1 K ) C p h )
P ( H d ( Q b Q a ) ) C ( K C p h ) P ( H d ( Q b Q a ) ) C ( K C p h )
P ( H c ) C ( C g h + R ) 0
demand side
not cost sharing
1 e
P ( H a + H b + R ) C ( C p h + ϕ ψ L w ( q ) ) P ( H a + H b ) C ( C p h + ϕ ψ L w ( q ) )
P ( H d ( Q b Q a ) ) C ( ψ L w ( q ) ) P ( H d ( Q b Q a ) ) C ( ψ L w ( q ) )
P ( H c ) C ( C g h + α L + R ) C ( α L )
Supply side
not quality improvement
1 − p
demand side
cost sharing
e
P ( K C p h ) C ( F + ψ L w ( q ) ) P ( K C p h ) C ( ψ L w ( q ) )
C ( k C p h + H d ( Q a Q c ) + ϕ ψ L w ( q ) ) C ( k C p h + H d ( Q a Q c ) + ϕ ψ L w ( q ) )
P ( H c + F ) C ( C g h + α L ) C ( α L )
demand side
not cost sharing
1 e
C ( F + L w ( q ) ) C ( L w ( q ) )
C ( H d ( Q a Q c ) + L w ( q ) ) C ( H d ( Q a Q c ) + L w ( q ) )
P ( H c + F ) C ( C g h + L ) C ( L )
Note: C p h , C g h , C e h , C p w , L a , L b , F , D represent cost perception and are listed in the cost account. H a , H b , H c , H d , R represent valence perception and are listed in the valence account.
Table 2. Parameter symbols and their meanings.
ParameterMeaning
pProbability of supply side quality improvement
eProbability of demand side cost sharing
gProbability of active regulation of shared platforms
CphLabor cost perception of supply side quality improvement
KDemand side cost allocation ratio
CghLabor cost perception of active supervision of shared platforms
HaPerceived loss reduction from supply side quality improvement
HbIncreased perceived benefit from supply-side quality improvements
HcBenefit perception of active regulation of sharing platforms
HdDemand side unit gain/loss
QaInitial product quality level
QbProduct quality level after supply side quality improvement
QcThe quality level of the product after the quality improvement of the supply side
FPerceived value of punishment by supply sides
RPerceived value of rewards by supply sides
qProbability of quality accidents
LQuality accident risk
ϕ Quality risk transfer coefficient
α Quality risk spillover coefficient
ψ quality risk factor
Table 3. Strategy portfolio stability analysis.
Equilibrium Point λ 1 ,   λ 2 ,   λ 3 SignStability
(0, 0, 0) B , F , N (×, ×, ×)saddle point
(1, 0, 0) B , E , M (×, ×, ×)saddle point
(0, 1, 0) A , F , N (×, ×, ×)saddle point
(0, 0, 1) B , F , N (×, ×, ×)saddle point
(1, 1, 0) A , E , M (×, ×, ×)saddle point
(1, 0, 1) B , E , M (×, ×, ×)saddle point
(0, 1, 1) A , F , N (×, ×, ×)saddle point
(1, 1, 1) A , E , M (×, ×, ×)saddle point
Table 4. Initial parameter settings.
parameter p e g C p h C p h K H a H b H c H d Q a Q b Q c F
initial value0.50.50.6820.511625218
parameter R ϕ α ψ L q U 0 U 1 β θ ν σ λ δ
initial value20.20.60.550.03110.880.880.980.982.52.5
Publisher’s Note: MDPI stays neutral with regard to jurisdictional claims in published maps and institutional affiliations.

