
Groundwater Detection Using the Pseudo-3D Resistivity Method: A History of Case Studies


Abstract
:1. Introduction
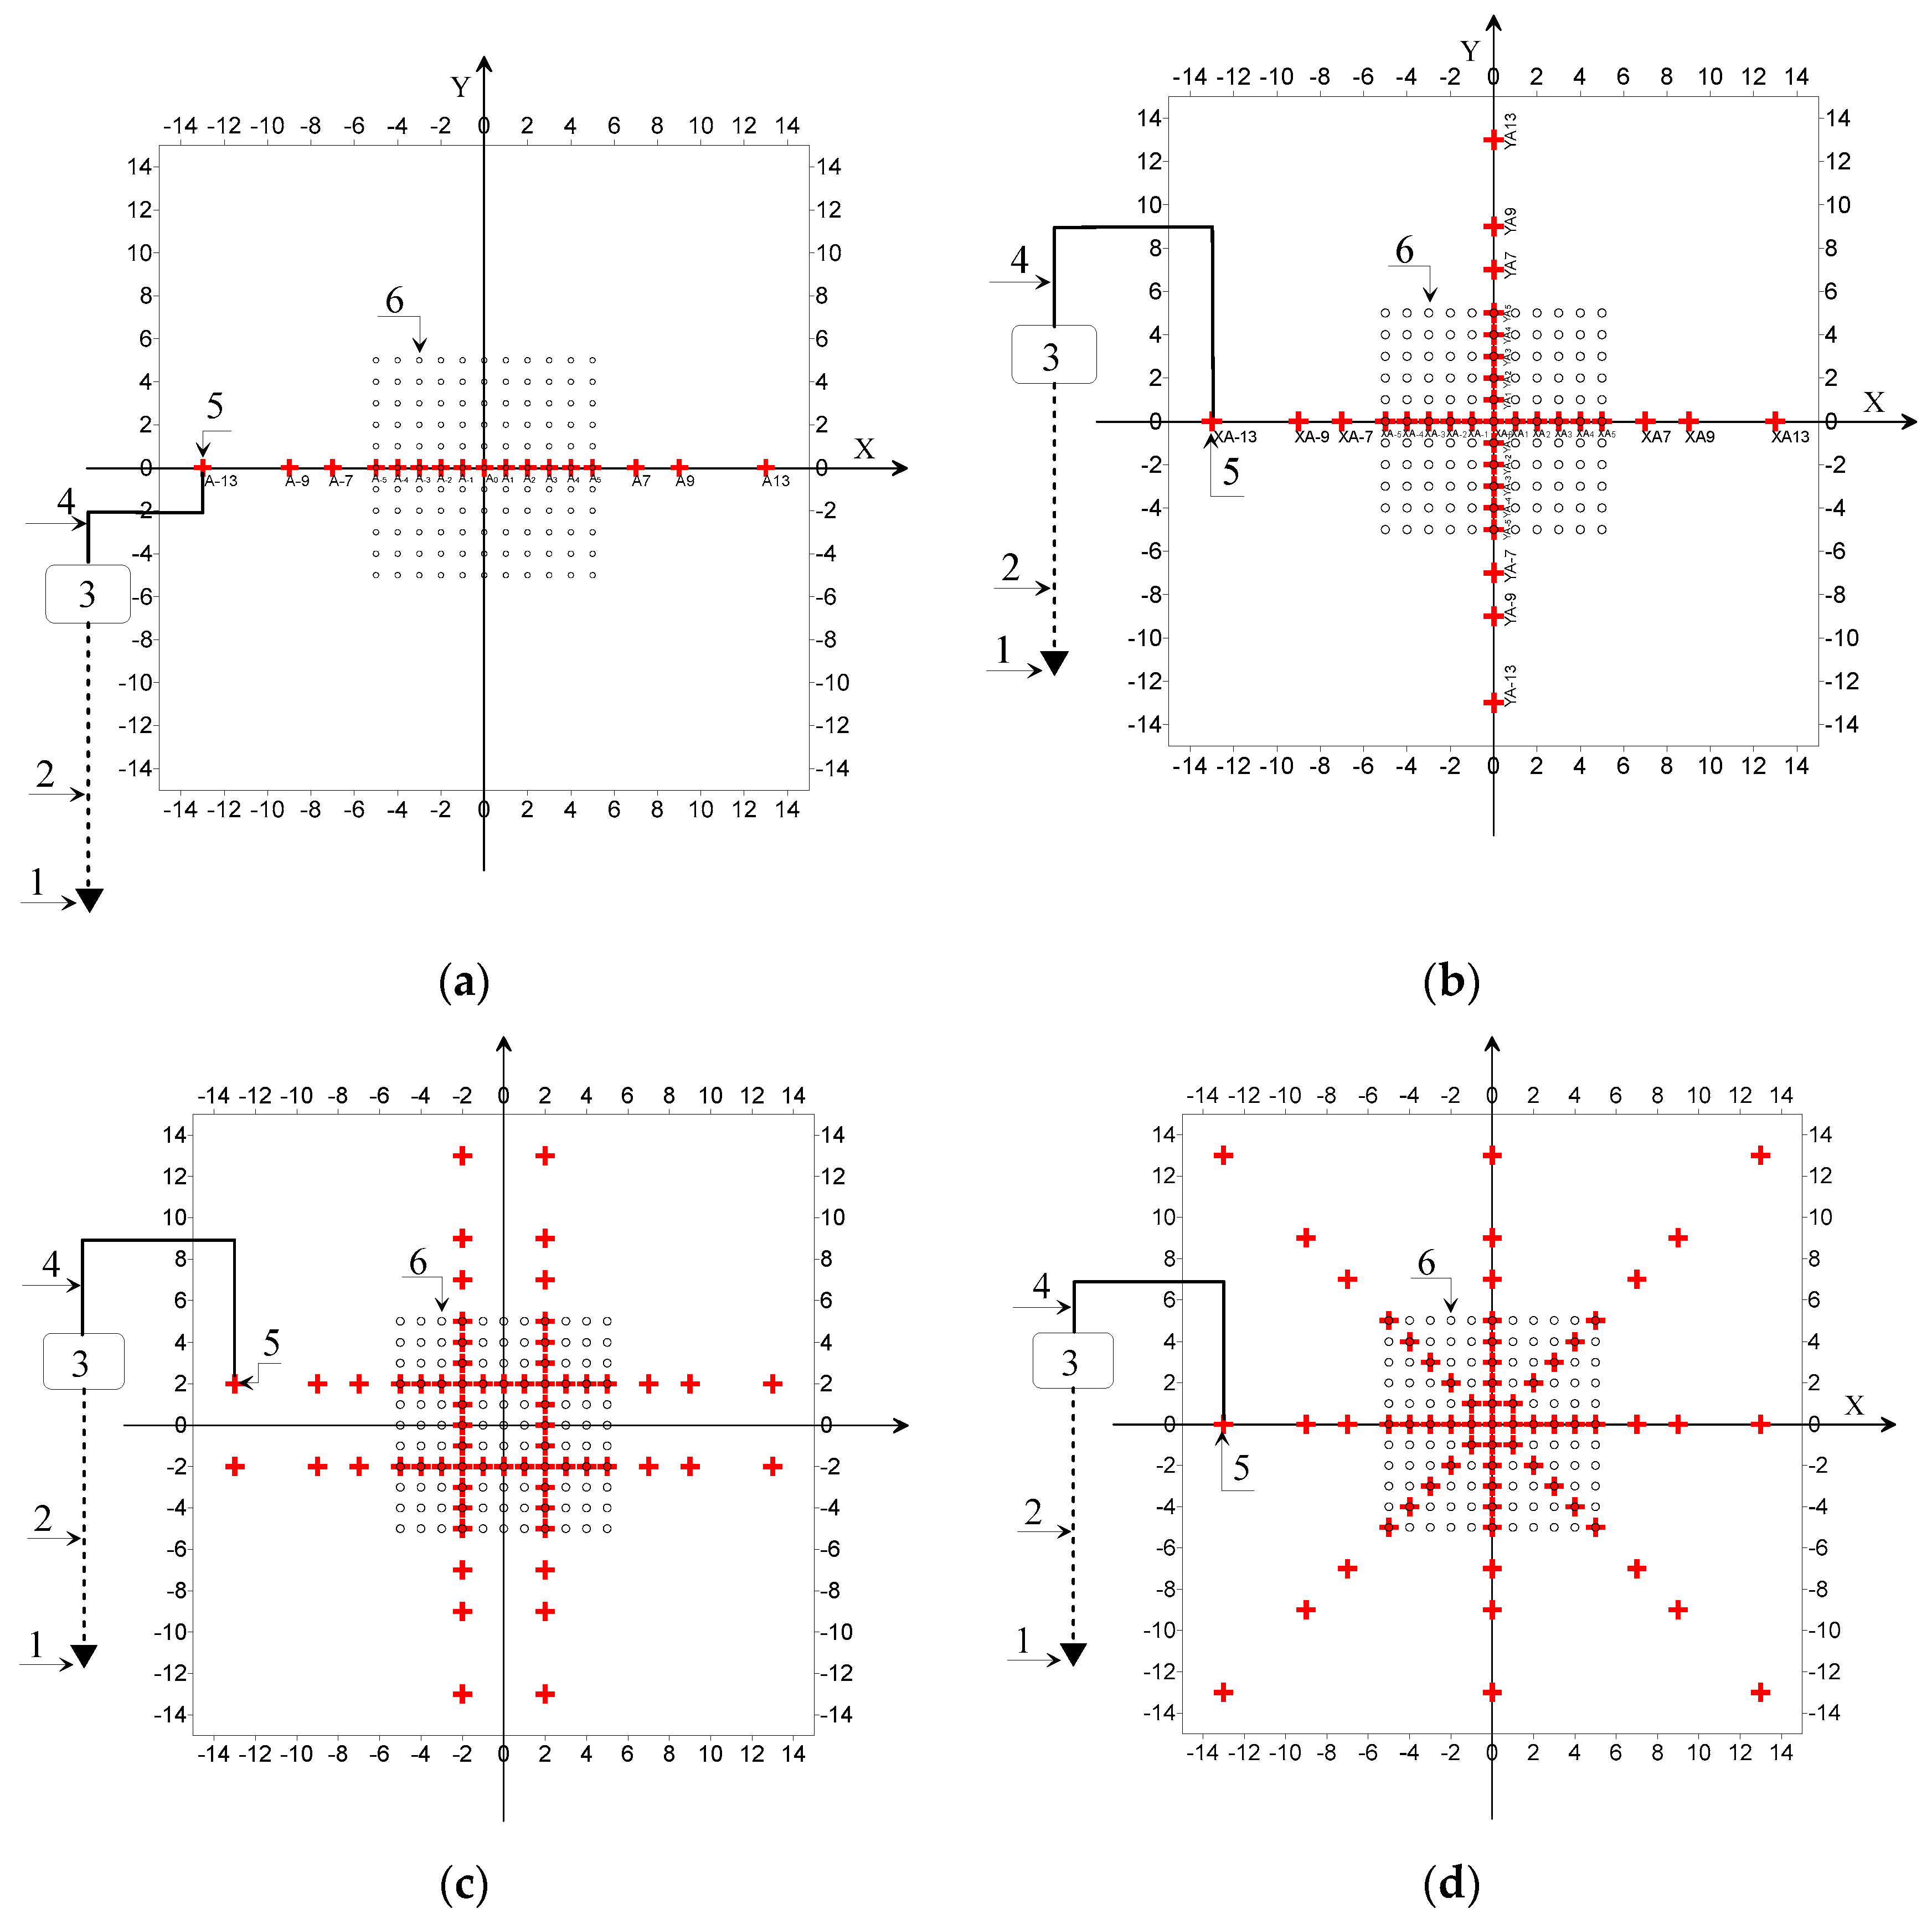
2. Methods
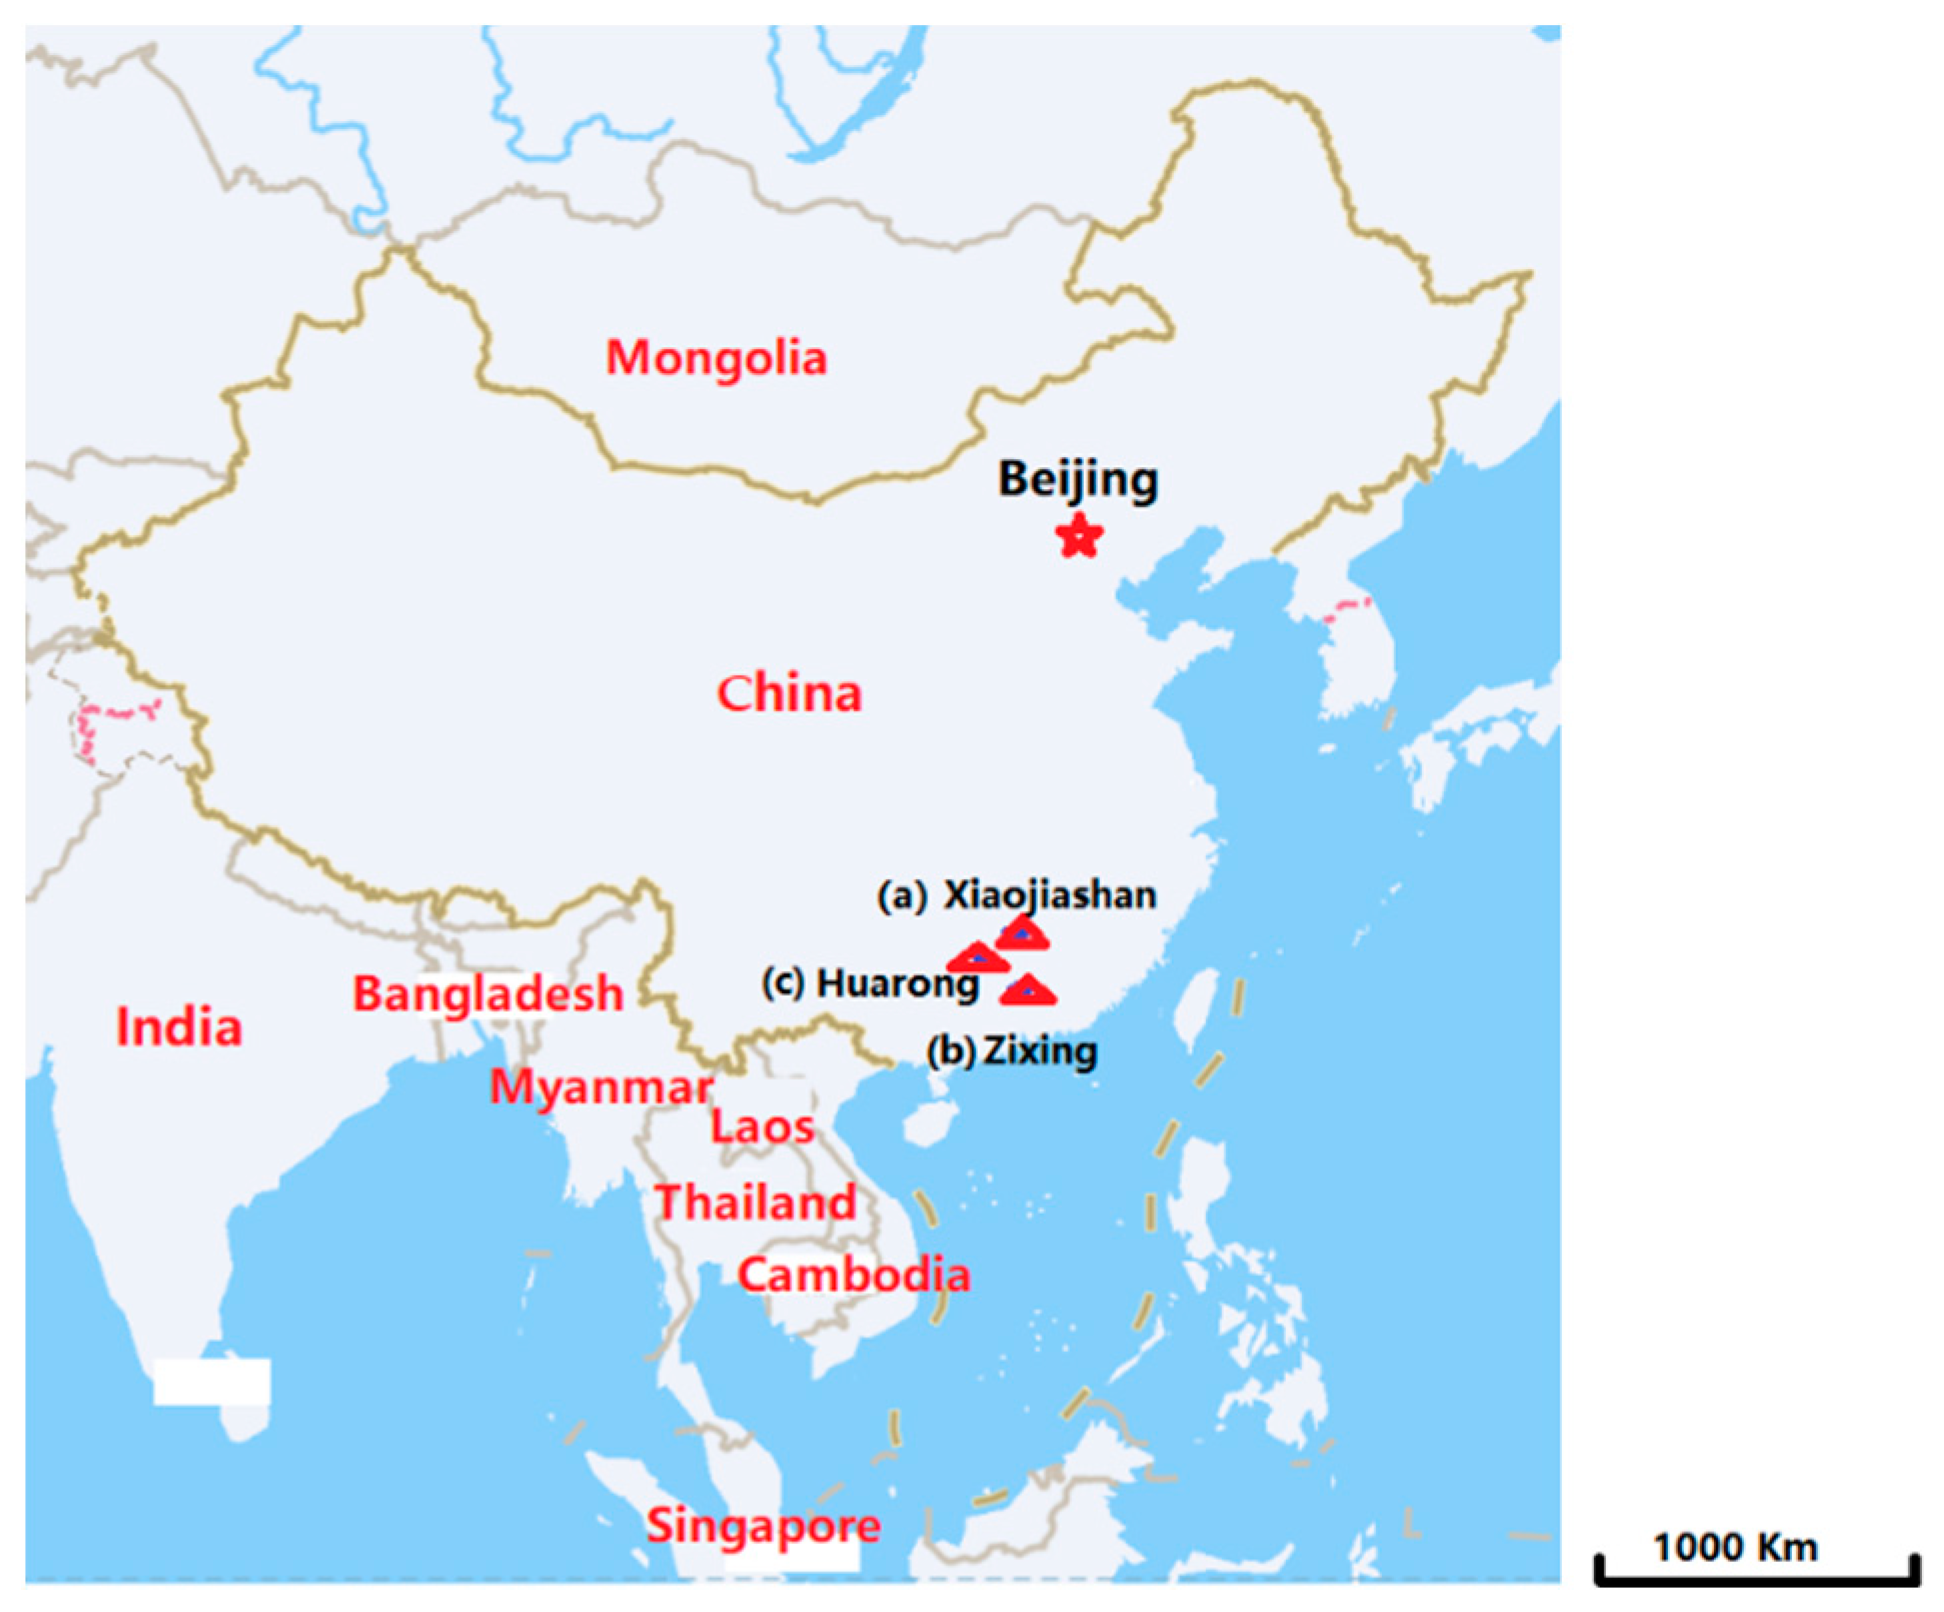
3. Case Studies
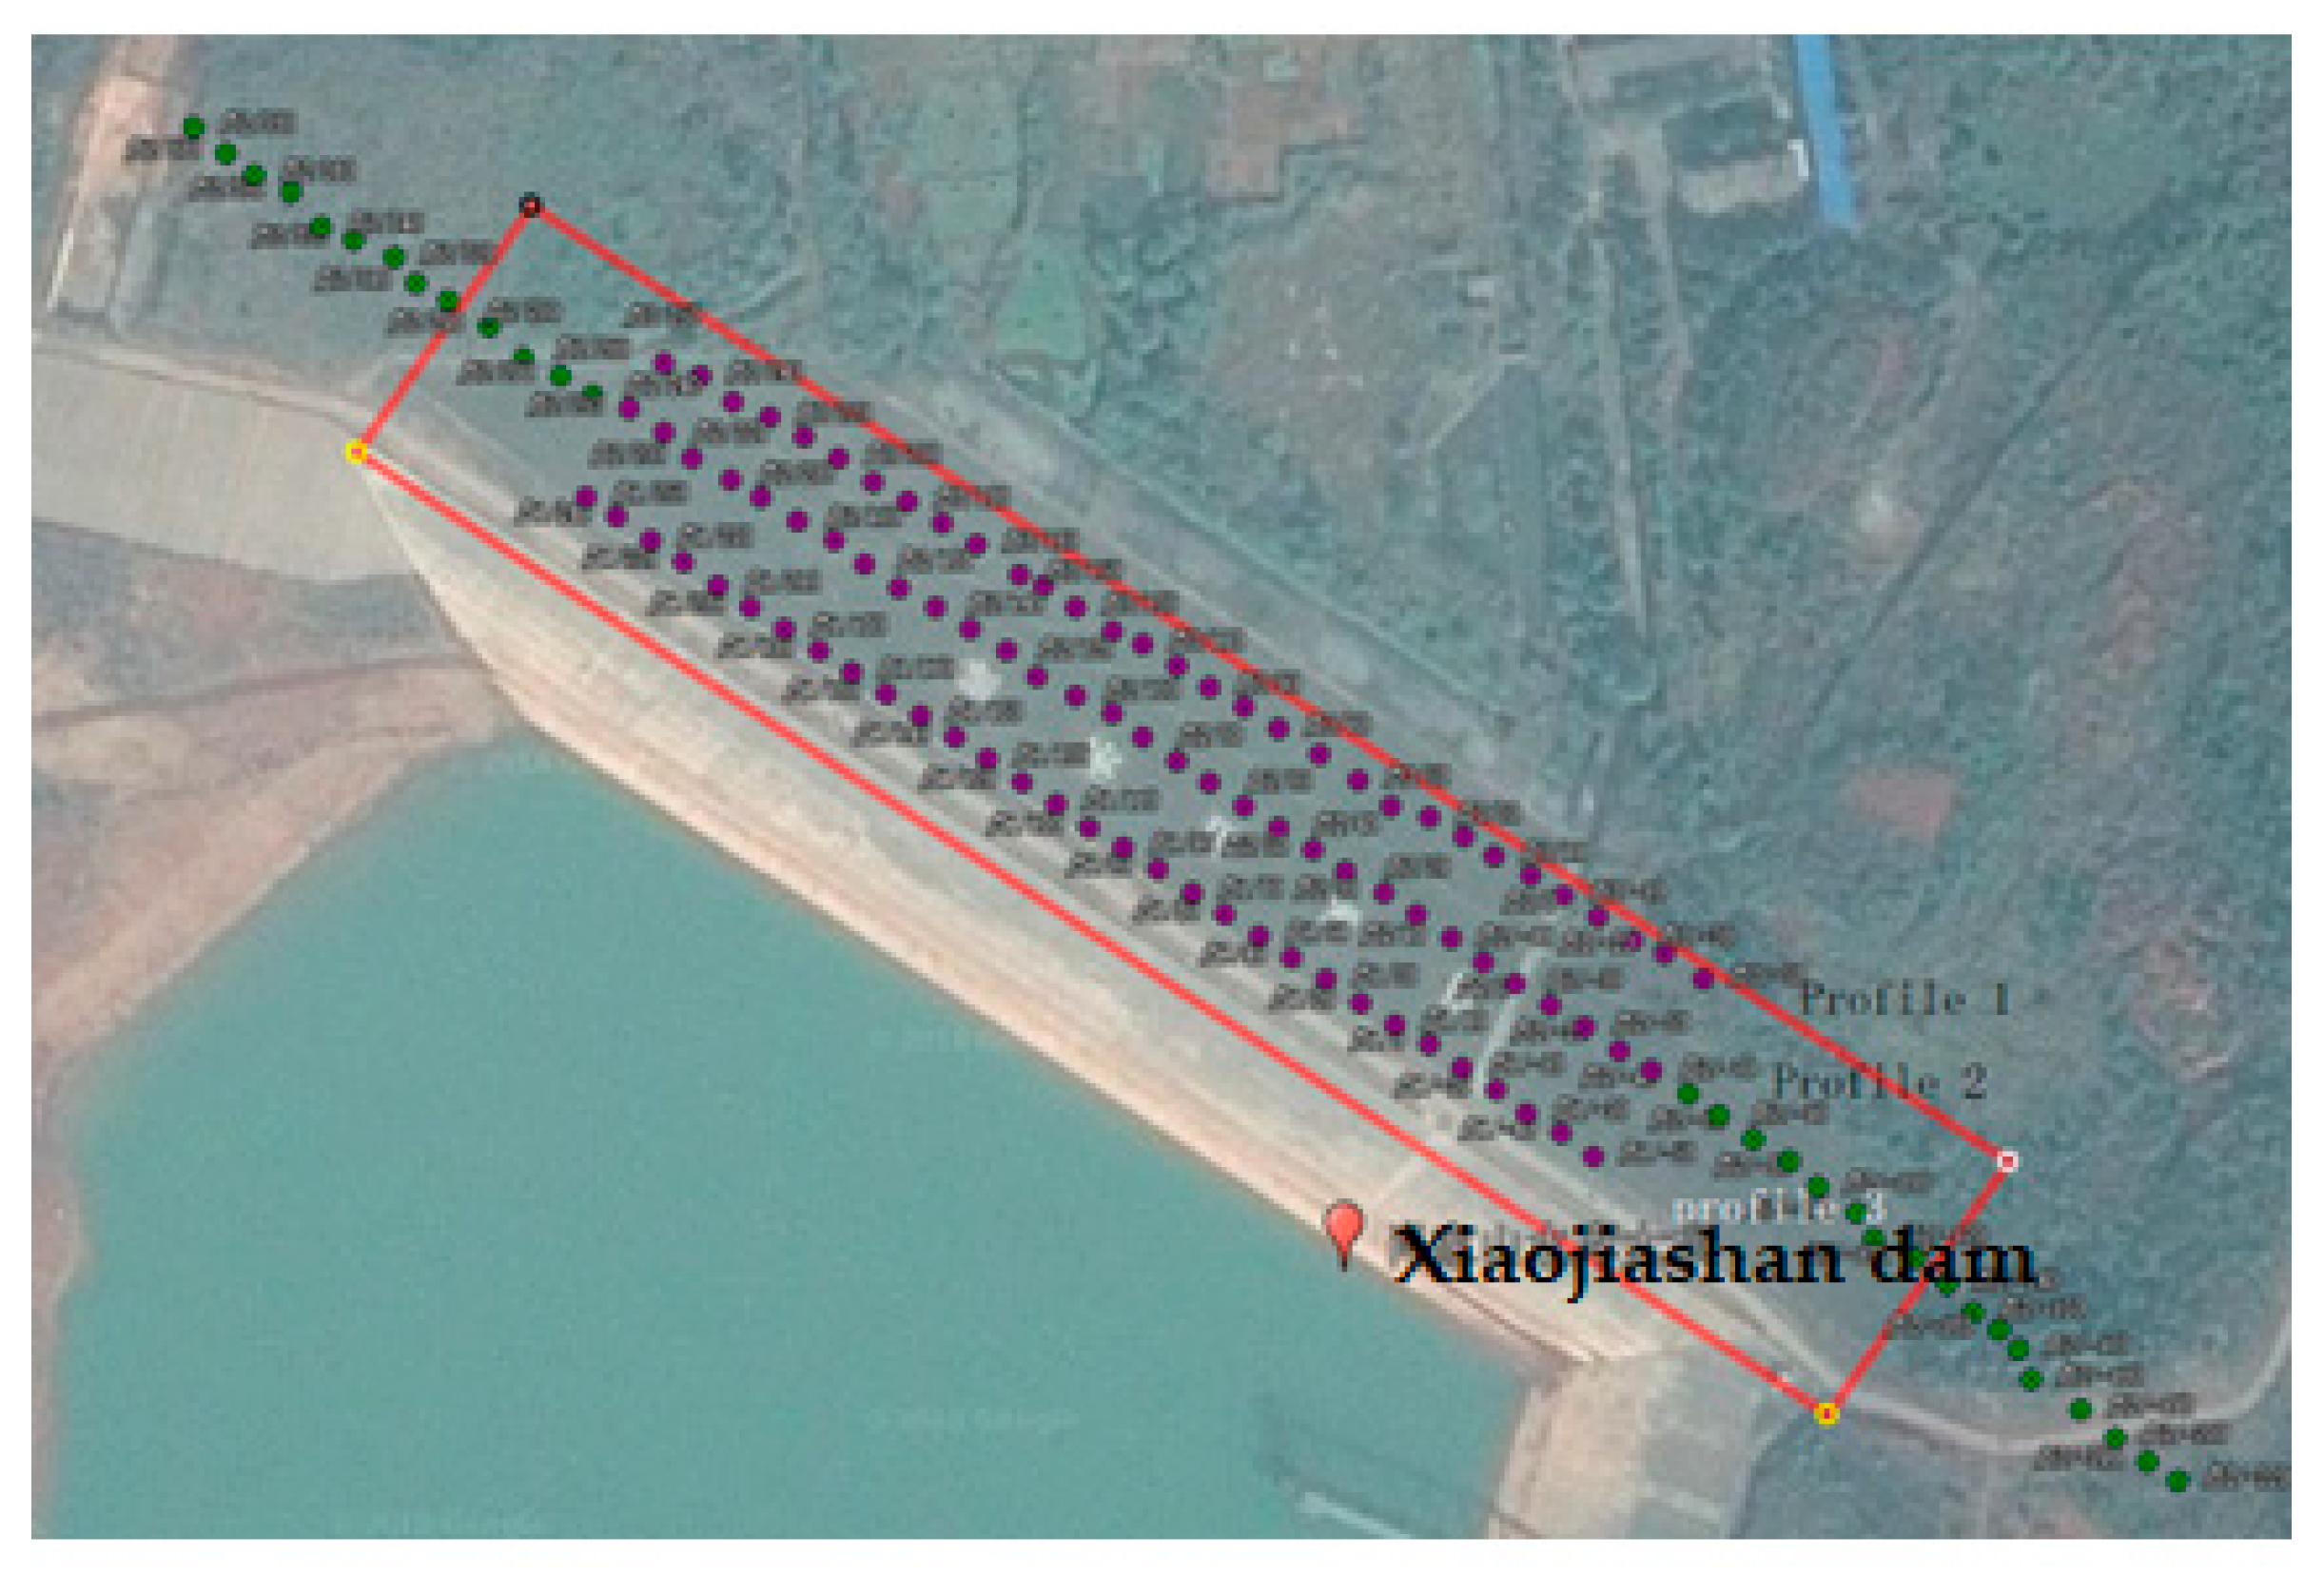
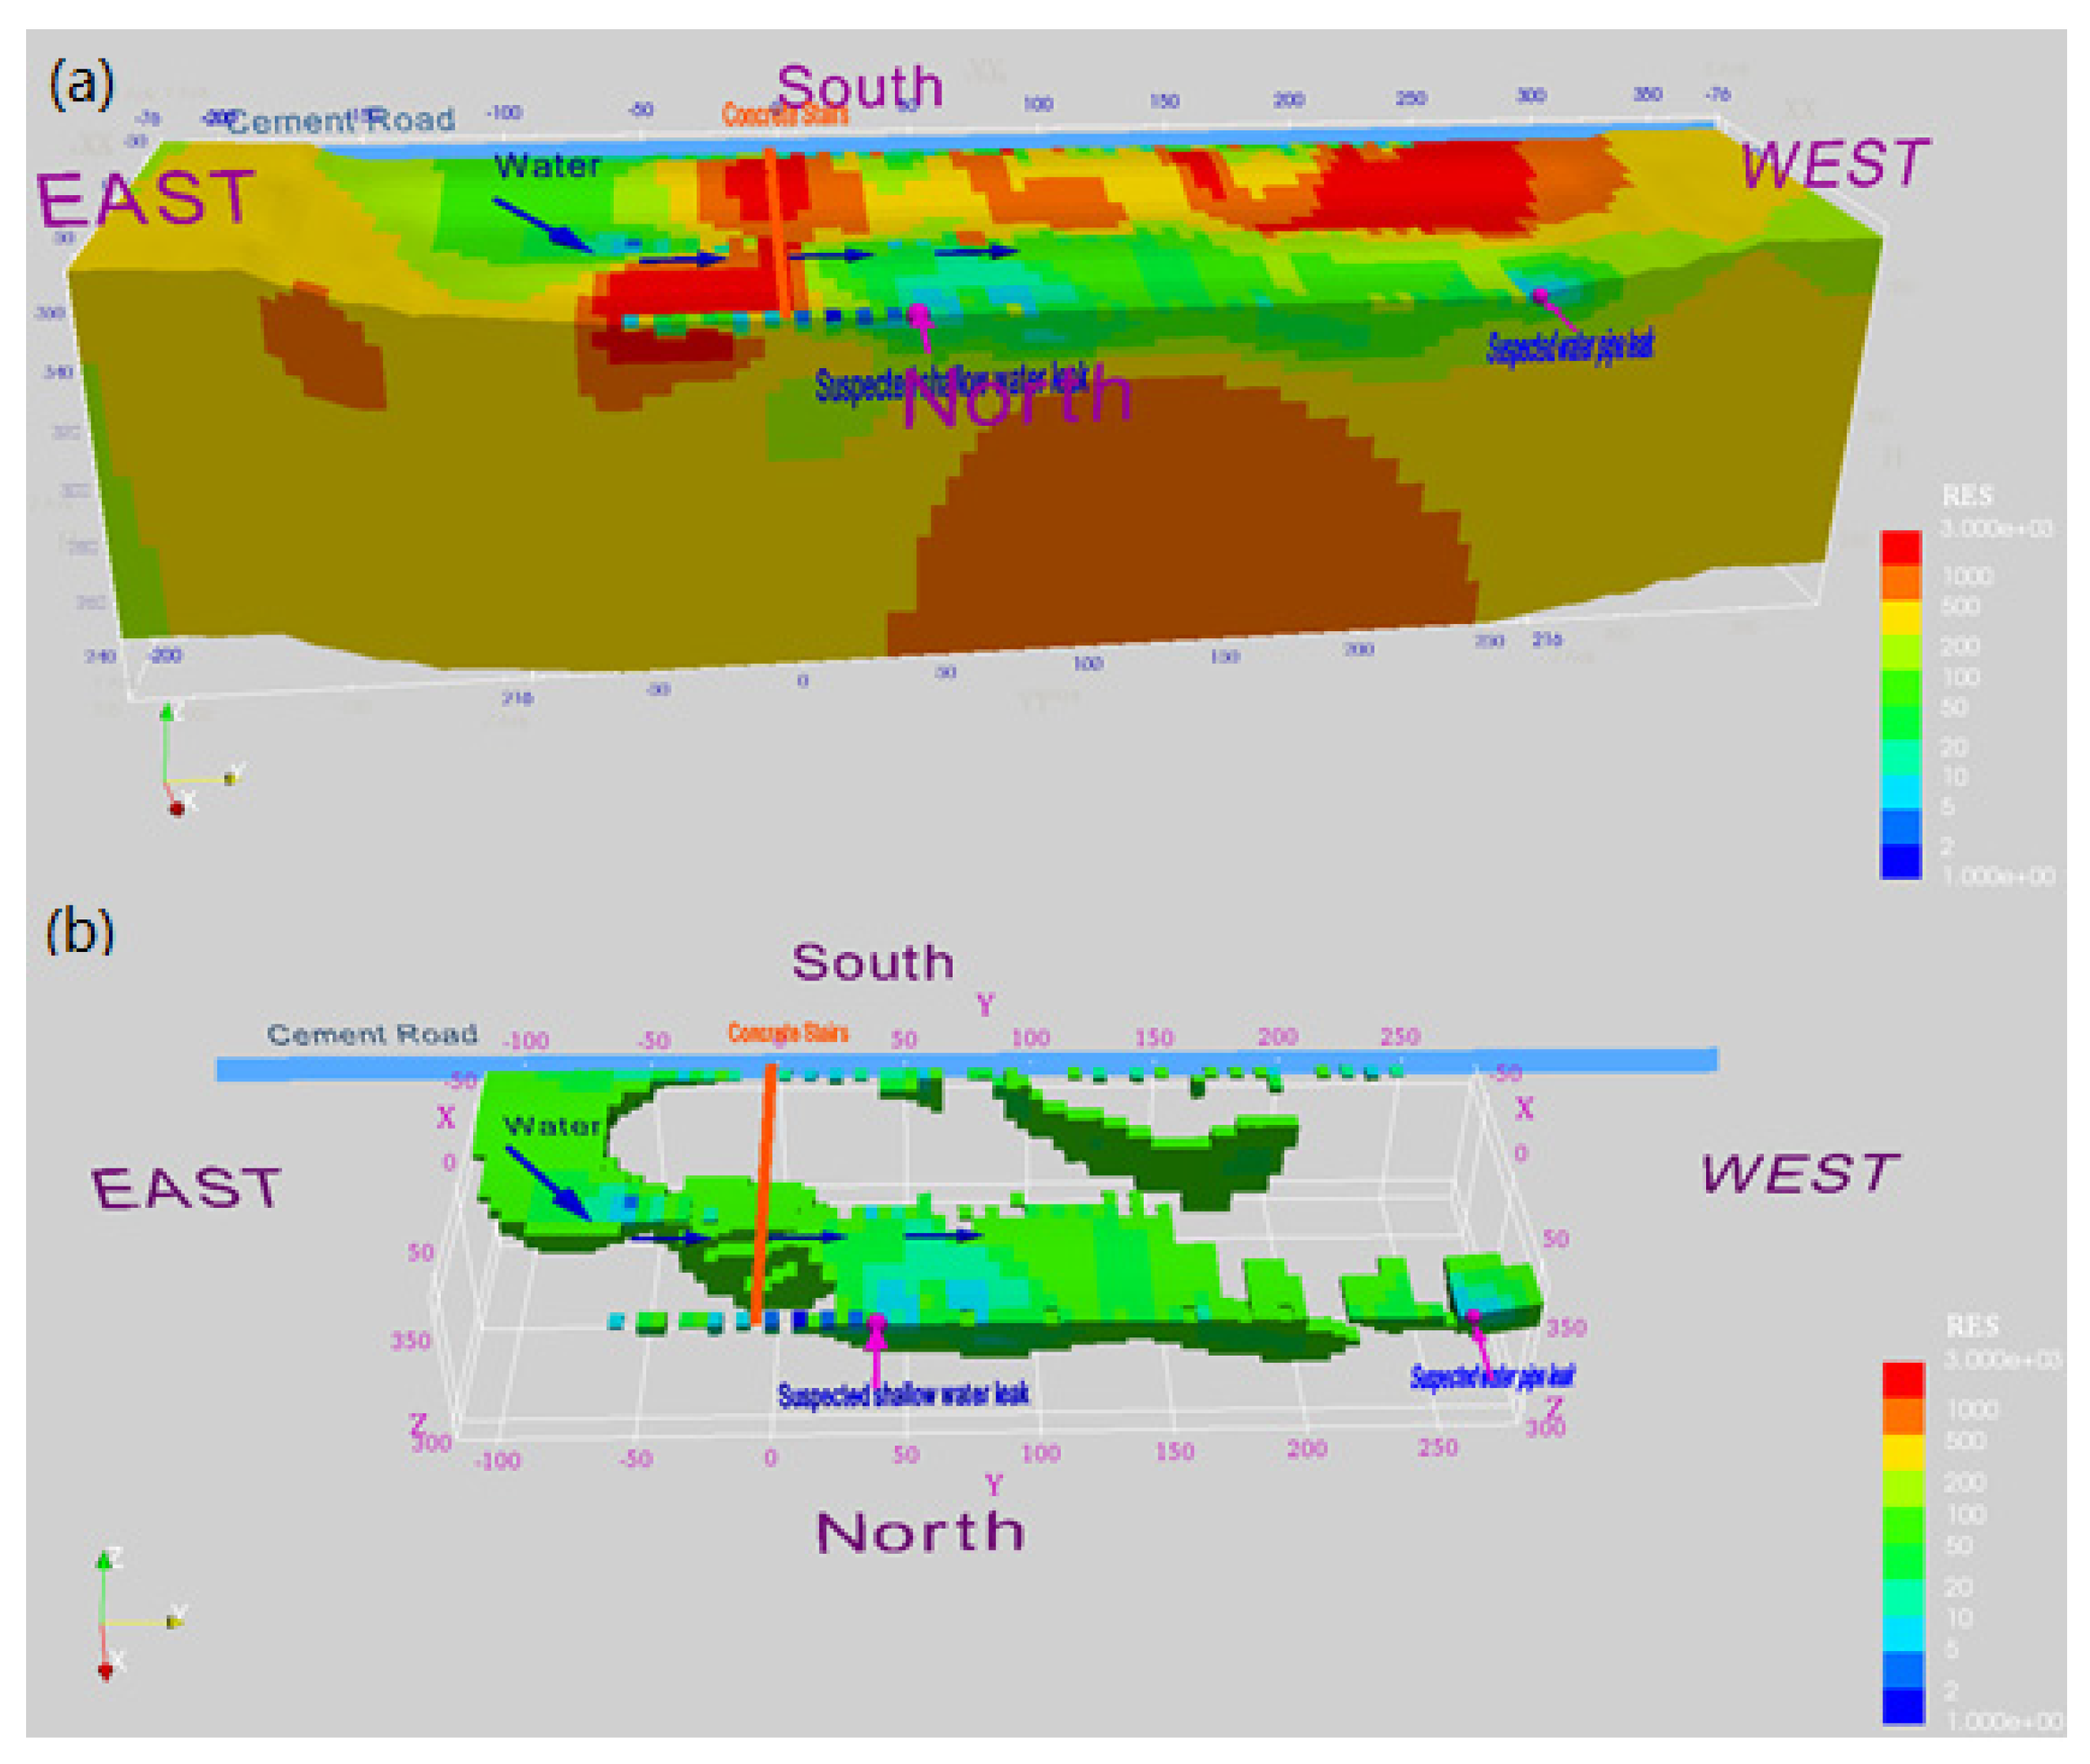
3.1. Dam Leakage Detection
3.2. Groundwater Exploration Cases
3.2.1. Groundwater Survey in Zixing City with Geophysical Methods
3.2.2. Groundwater Survey in Huarong County with Geophysical Methods
4. Discussion
5. Conclusions
Author Contributions
Funding
Conflicts of Interest
References
- VenkataRao, G.; Kalpana, P.; Rao, R.S. Groundwater investigation using geophysical methods—A case study of Pydibhimavaram Industrial area. Int. J. Res. Eng. Technol. 2014, 3, 13–17. [Google Scholar]
- Pereira, P.A.; Lima OA, L. Estrutura elétrica da contaminação hídrica provocada por fluidos provenientes dos depósitos de lixo urbano e de um curtume no município de Alagoinhas, Bahia. Rev. Bras. Geofís. 2007, 25, 5–19. [Google Scholar] [CrossRef]
- Goldman, M.; Neubauer, F.M. Groundwater exploration using integrated geophysical techniques. Surv. Geophys. 1994, 15, 331–361. [Google Scholar] [CrossRef]
- Amaruddin, H.I.; Hassan, R.; Mohd Amin, N.; Abd Malek, N.J. Finite Element Model of Mortise and Tenon Joint Fastened with Wood Dowel Using Kempas Species. In CIEC 2013; Springer: Singapore, 2014; pp. 3–14. [Google Scholar]
- Siemon, B.; Christiansen, A.V.; Auken, E. A review of helicopter-borne electromagnetic methods for groundwater exploration. Near Surf. Geophys. 2009, 7, 629–646. [Google Scholar] [CrossRef] [Green Version]
- Maheswari, K.; Senthil Kumar, P.; Mysaiah, D.; Ratnamala, K.; Sri Hari Rao, M.; Seshunarayana, T. Ground penetrating radar for groundwater exploration in granitic terrains: A case study from Hyderabad. J. Geol. Soc. India 2013, 81, 781–790. [Google Scholar] [CrossRef]
- Al-Fares, W. Contribution of the geophysical methods in characterizing the water leakage in Afamia B dam, Syria. J. Appl. Geophys. 2011, 75, 464–471. [Google Scholar] [CrossRef]
- Karastathis, V.K.; Karmis, P.N.; Drakatos, G.; Stavrakakis, G. Geophysical methods contributing to the testing of concrete dams, application at the Marathon Dam. J. Appl. Geophys. 2002, 50, 247–260. [Google Scholar] [CrossRef] [Green Version]
- Abu-Zeid, N. Investigation of channel seepage areas at the existing Kaffrein Dam Site (Jordan) using electrical resistivity measurements. J. Appl. Geophys. 1994, 32, 163–175. [Google Scholar] [CrossRef]
- Aina, A.; Olorunfemi, M.O.; Ojo, J.S. An integration of aeromagnetic and electrical resistivity methods in dam site investigation. Geophysics 1996, 61, 349–356. [Google Scholar] [CrossRef]
- Cho, I.K.; Yeom, J.Y. Crossline resistivity tomography for the delineation of anomalous seepage pathways in an embankment dam. Geophysics 2007, 72, G31–G38. [Google Scholar] [CrossRef]
- Fargier, Y.; Lopes, S.P.; Fauchard, C.; François, D.; Côte, P. DC-electrical resistivity imaging for embankment dike investigation: A 3D extended normalisation approach. J. Appl. Geophys. 2014, 103, 245–256. [Google Scholar] [CrossRef] [Green Version]
- Xu, X.X.; Zeng, Q.S.; Li, D.; Wu, J.; Wu, X.G.; Shen, J.Y. GPR detection of several common subsurface voids inside dikes and dams. Eng. Geol. 2010, 111, 31–42. [Google Scholar] [CrossRef]
- Karastathis, V.K.; Karmis, P.N.; Drakatos, G.; Stavrakakis, G. Assessment of the dynamic properties of highly saturated concrete using one-sided acoustic tomography. Application in the Marathon Dam. Constr. Build. Mater. 2002, 16, 261–269. [Google Scholar] [CrossRef]
- Samyn, K.; Mathieu, F.; Bitri, A.; Nachbaur, A.; Closset, L. Integrated geophysical approach in assessing karst presence and sinkhole susceptibility along flood-protection dykes of the Loire River, Orléans, France. Eng. Geol. 2014, 183, 170–184. [Google Scholar] [CrossRef] [Green Version]
- Berga, L.; Buil, J.M.; Bofill, E.; De Cea, J.C.; Perez, J.G.; Mañueco, G.; Yagüe, J. Dams and Reservoirs, Societies and Environment in the 21st Century, Two Volume Set. In Proceedings of the International Symposium on Dams in the Societies of the 21st Century, 22nd International Congress on Large Dams (ICOLD), Barcelona, Spain, 18–23 June 2006. [Google Scholar]
- Saad, R.; Nawawi MN, M.; Mohamad, E.T. Groundwater detection in alluvium using 2-D electrical resistivity tomography (ERT). Electron. J. Geotech. Eng. 2012, 17, 369–376. [Google Scholar]
- Michalis, P.; Sentenac, P.; Macbrayne, D. Geophysical assessment of dam infrastructure: The mugdock reservoir dam case study. In Proceedings of the 3rd Joint International Symposium on Deformation Monitoring (JISDM), Vienna, Austria, 30 March–1 April 2016. [Google Scholar]
- Keller, G.V. DC resistivity methods for determining resistivity in the earth’s crust. Phys. Earth Planet. Inter. 1975, 10, 201–208. [Google Scholar] [CrossRef]
- Sumner, J.S. Principles of Induced Polarization for Geophysical Exploration; Elsevier: Amsterdam, The Netherlands, 1976; p. 277. ISBN 0-444-41481-9. [Google Scholar]
- Palma-Lopes, S.; Fauchard, C.; Mériaux, P.; Auriau, L. Rapid and cost-effective dike condition assessment methods: Geophysics. Geography 2012, 32, 1–17. [Google Scholar]
- Jodry, C.; Lopes, S.P.; Fargier, Y.; Cote, P.; Sanchez, M. A cost-effective 3D electrical resistivity imaging approach applied to dike investigation. Near Surf. Geophys. 2017, 15, 27–41. [Google Scholar] [CrossRef]
- Nguyen, T.N.; Pham, K.N. Correcting the distortion of apparent resistivity pseudosection produced by 3D effect of the embankment geometry. Environ. Earth Sci. 2018, 77, 105. [Google Scholar] [CrossRef]
- Alshehri, F.; Abdelrahman, K. Groundwater resources exploration of Harrat Khaybar area, northwest Saudi Arabia, using electrical resistivity tomography. J. King Saud Univ.-Sci. 2021, 33, 101468. [Google Scholar] [CrossRef]
- Guo, Z.; Liu, C.M.; Liu, J.X.; Zhou, H.; Zhao, S.J.; Li, H.B. Pseudo-3D direct current resistivity for underground water surveying. In Proceedings of the 24th EM Induction Workshop, Helsingør, Denmark, 12–19 August 2018; Available online: https://emiw2018.emiw.org/fileadmin/emiw2018/abstracts/3.0_pseudo-3d_direct-current_guo.pdf (accessed on 12 August 2018).
- Riwayat, A.I.; Nazri MA, A.; Abidin MH, Z. Application of electrical resistivity method (ERM) in groundwater exploration. In Journal of Physics: Conference Series; IOP Publishing: Batu Pahat, Malaysia, 2018; Volume 995, p. 012094. [Google Scholar]
- Aizebeokhai, A.P. 2D and 3D geoelectrical resistivity imaging: Theory and field design. Sci. Res. Essays 2010, 5, 3592–3605. [Google Scholar]
- Rolia, E.; Sutjiningsih, D. Application of geoelectric method for groundwater exploration from surface (A literature study). In AIP Conference Proceedings; AIP Publishing LLC: Melville, NY, USA, 2018; Volume 1977, p. 020018. [Google Scholar]

Publisher’s Note: MDPI stays neutral with regard to jurisdictional claims in published maps and institutional affiliations. |
© 2022 by the authors. Licensee MDPI, Basel, Switzerland. This article is an open access article distributed under the terms and conditions of the Creative Commons Attribution (CC BY) license (https://creativecommons.org/licenses/by/4.0/).
Share and Cite
Chen, X.; Guo, Z.; Liu, C.; Liu, J.; Wu, Q. Groundwater Detection Using the Pseudo-3D Resistivity Method: A History of Case Studies. Appl. Sci. 2022, 12, 6788. https://doi.org/10.3390/app12136788
Chen X, Guo Z, Liu C, Liu J, Wu Q. Groundwater Detection Using the Pseudo-3D Resistivity Method: A History of Case Studies. Applied Sciences. 2022; 12(13):6788. https://doi.org/10.3390/app12136788
Chicago/Turabian StyleChen, Xinjie, Zhenwei Guo, Chunming Liu, Jianxin Liu, and Qihong Wu. 2022. "Groundwater Detection Using the Pseudo-3D Resistivity Method: A History of Case Studies" Applied Sciences 12, no. 13: 6788. https://doi.org/10.3390/app12136788
APA StyleChen, X., Guo, Z., Liu, C., Liu, J., & Wu, Q. (2022). Groundwater Detection Using the Pseudo-3D Resistivity Method: A History of Case Studies. Applied Sciences, 12(13), 6788. https://doi.org/10.3390/app12136788