
Deep Transfer Learning Enabled Intelligent Object Detection for Crowd Density Analysis on Video Surveillance Systems

 , ,
, ,
Abstract
:1. Introduction
2. Related Works
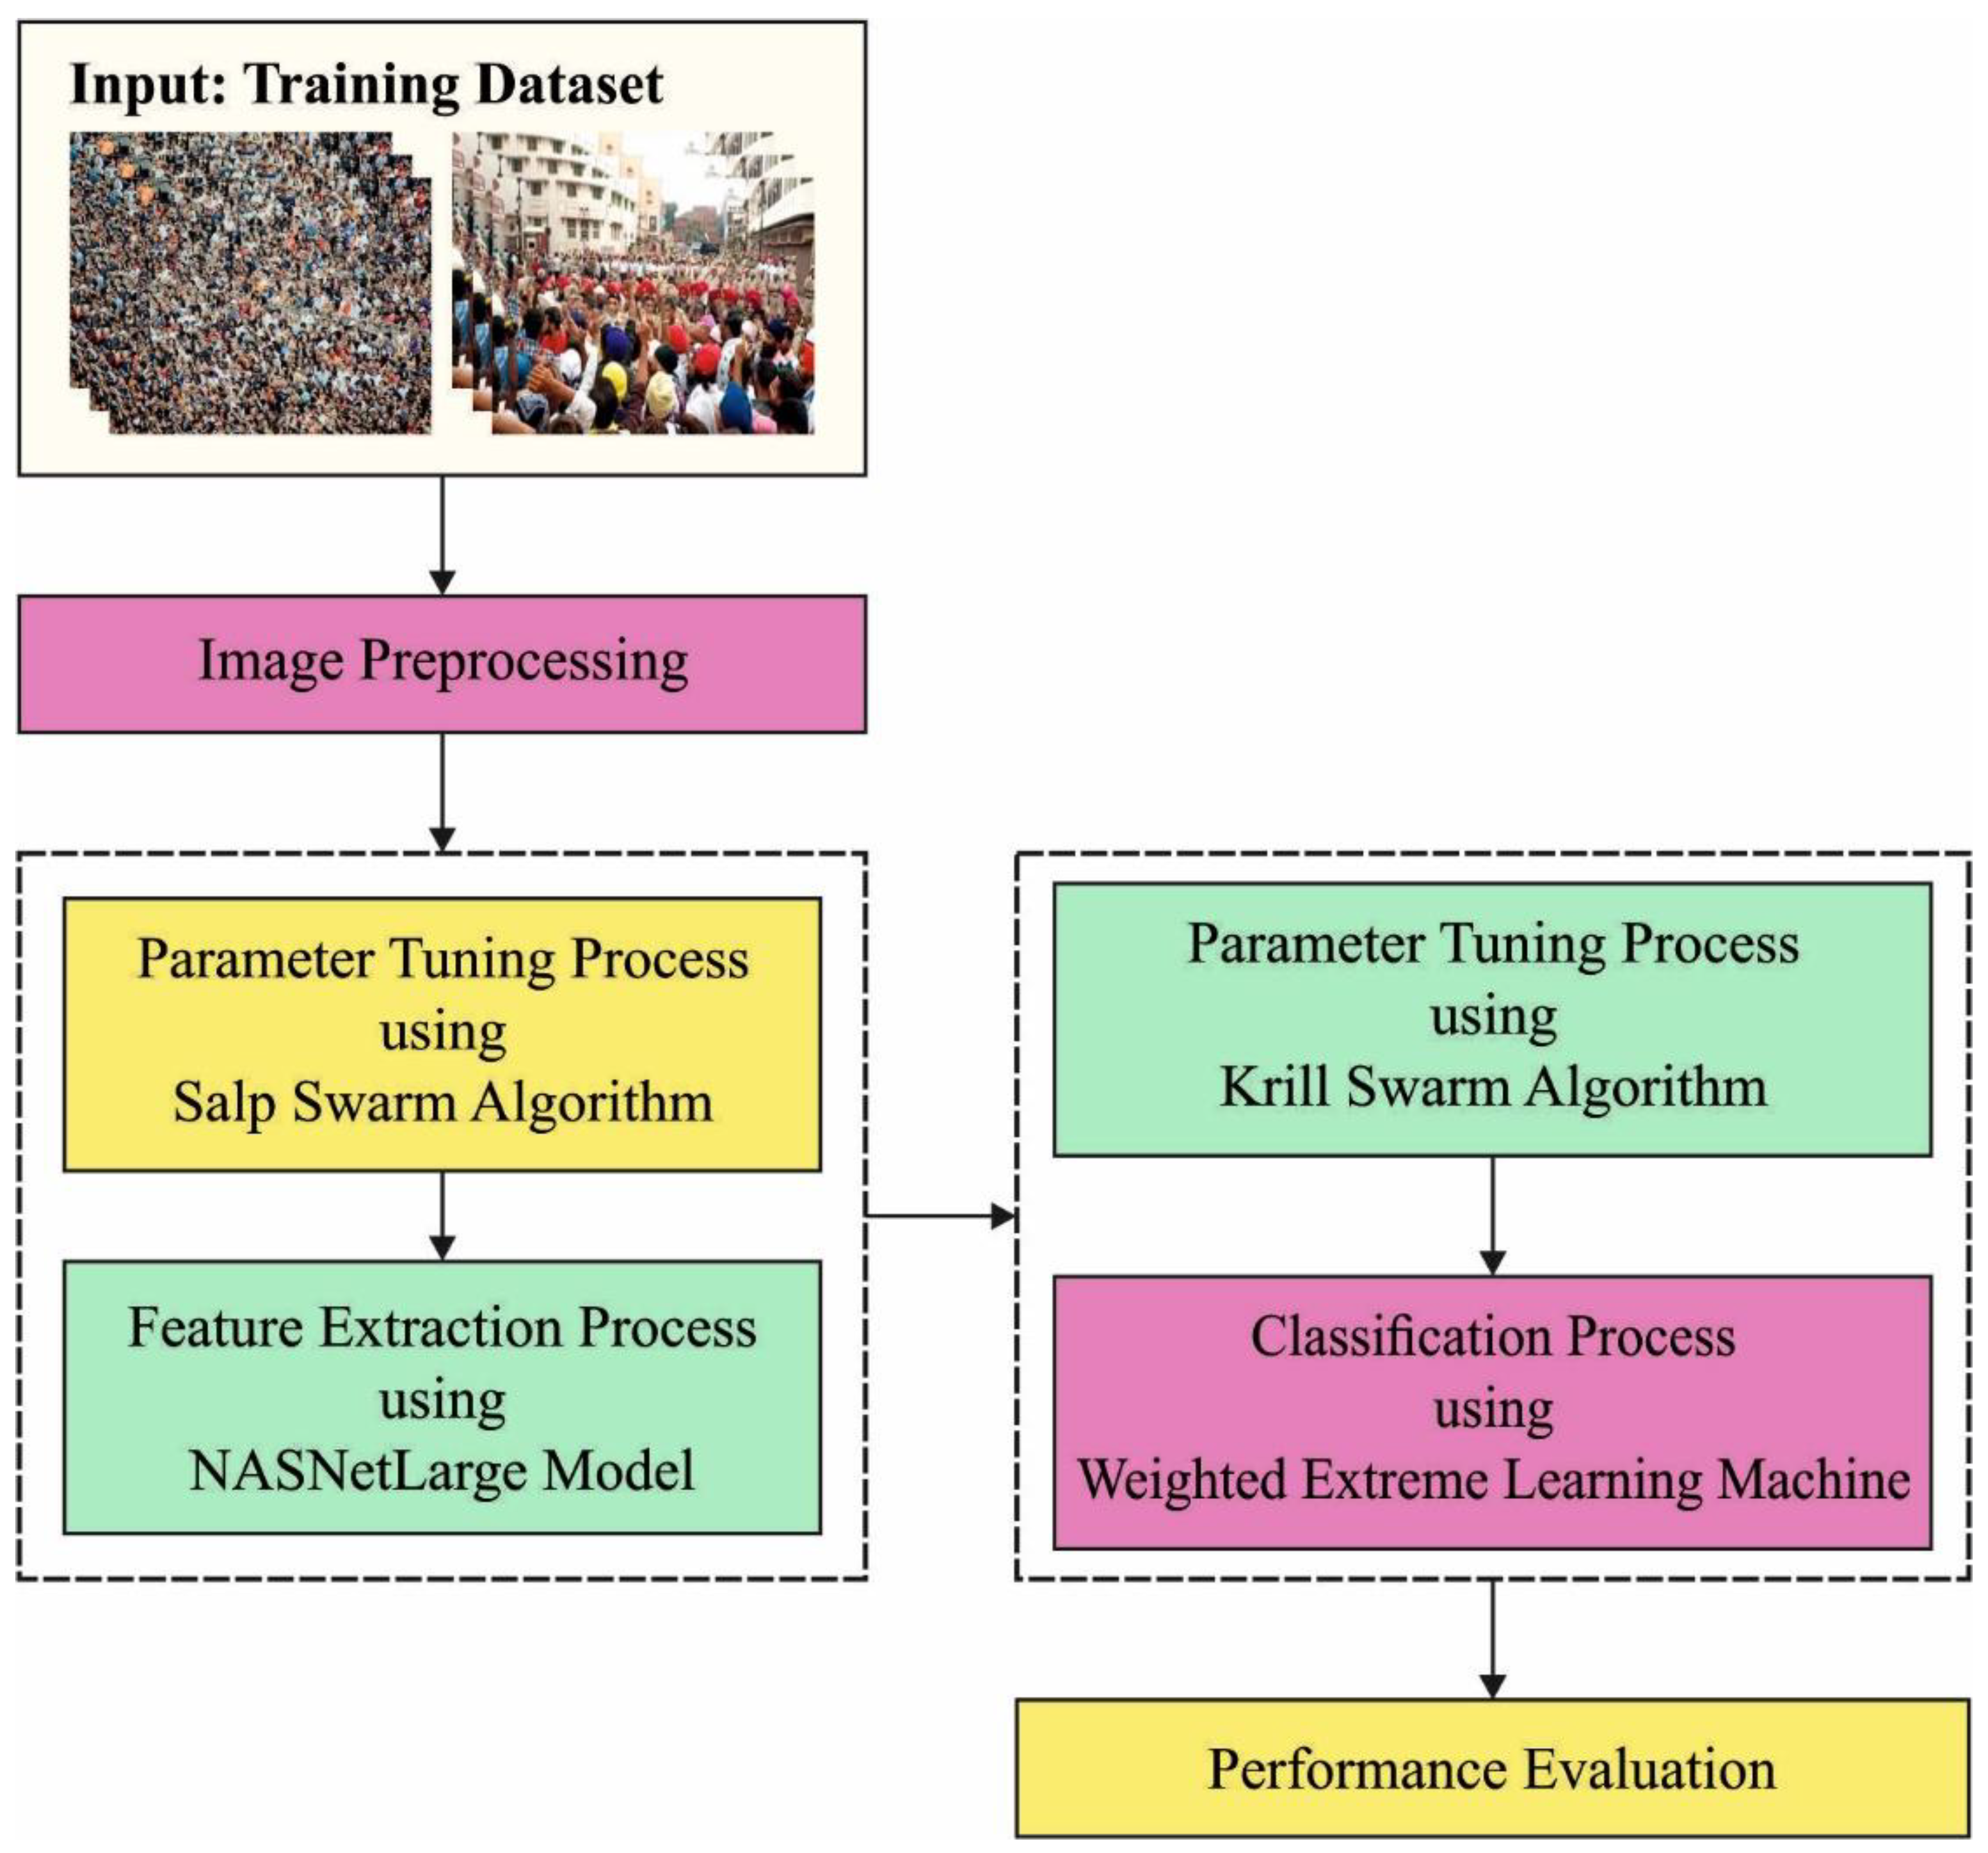
3. The Proposed Model
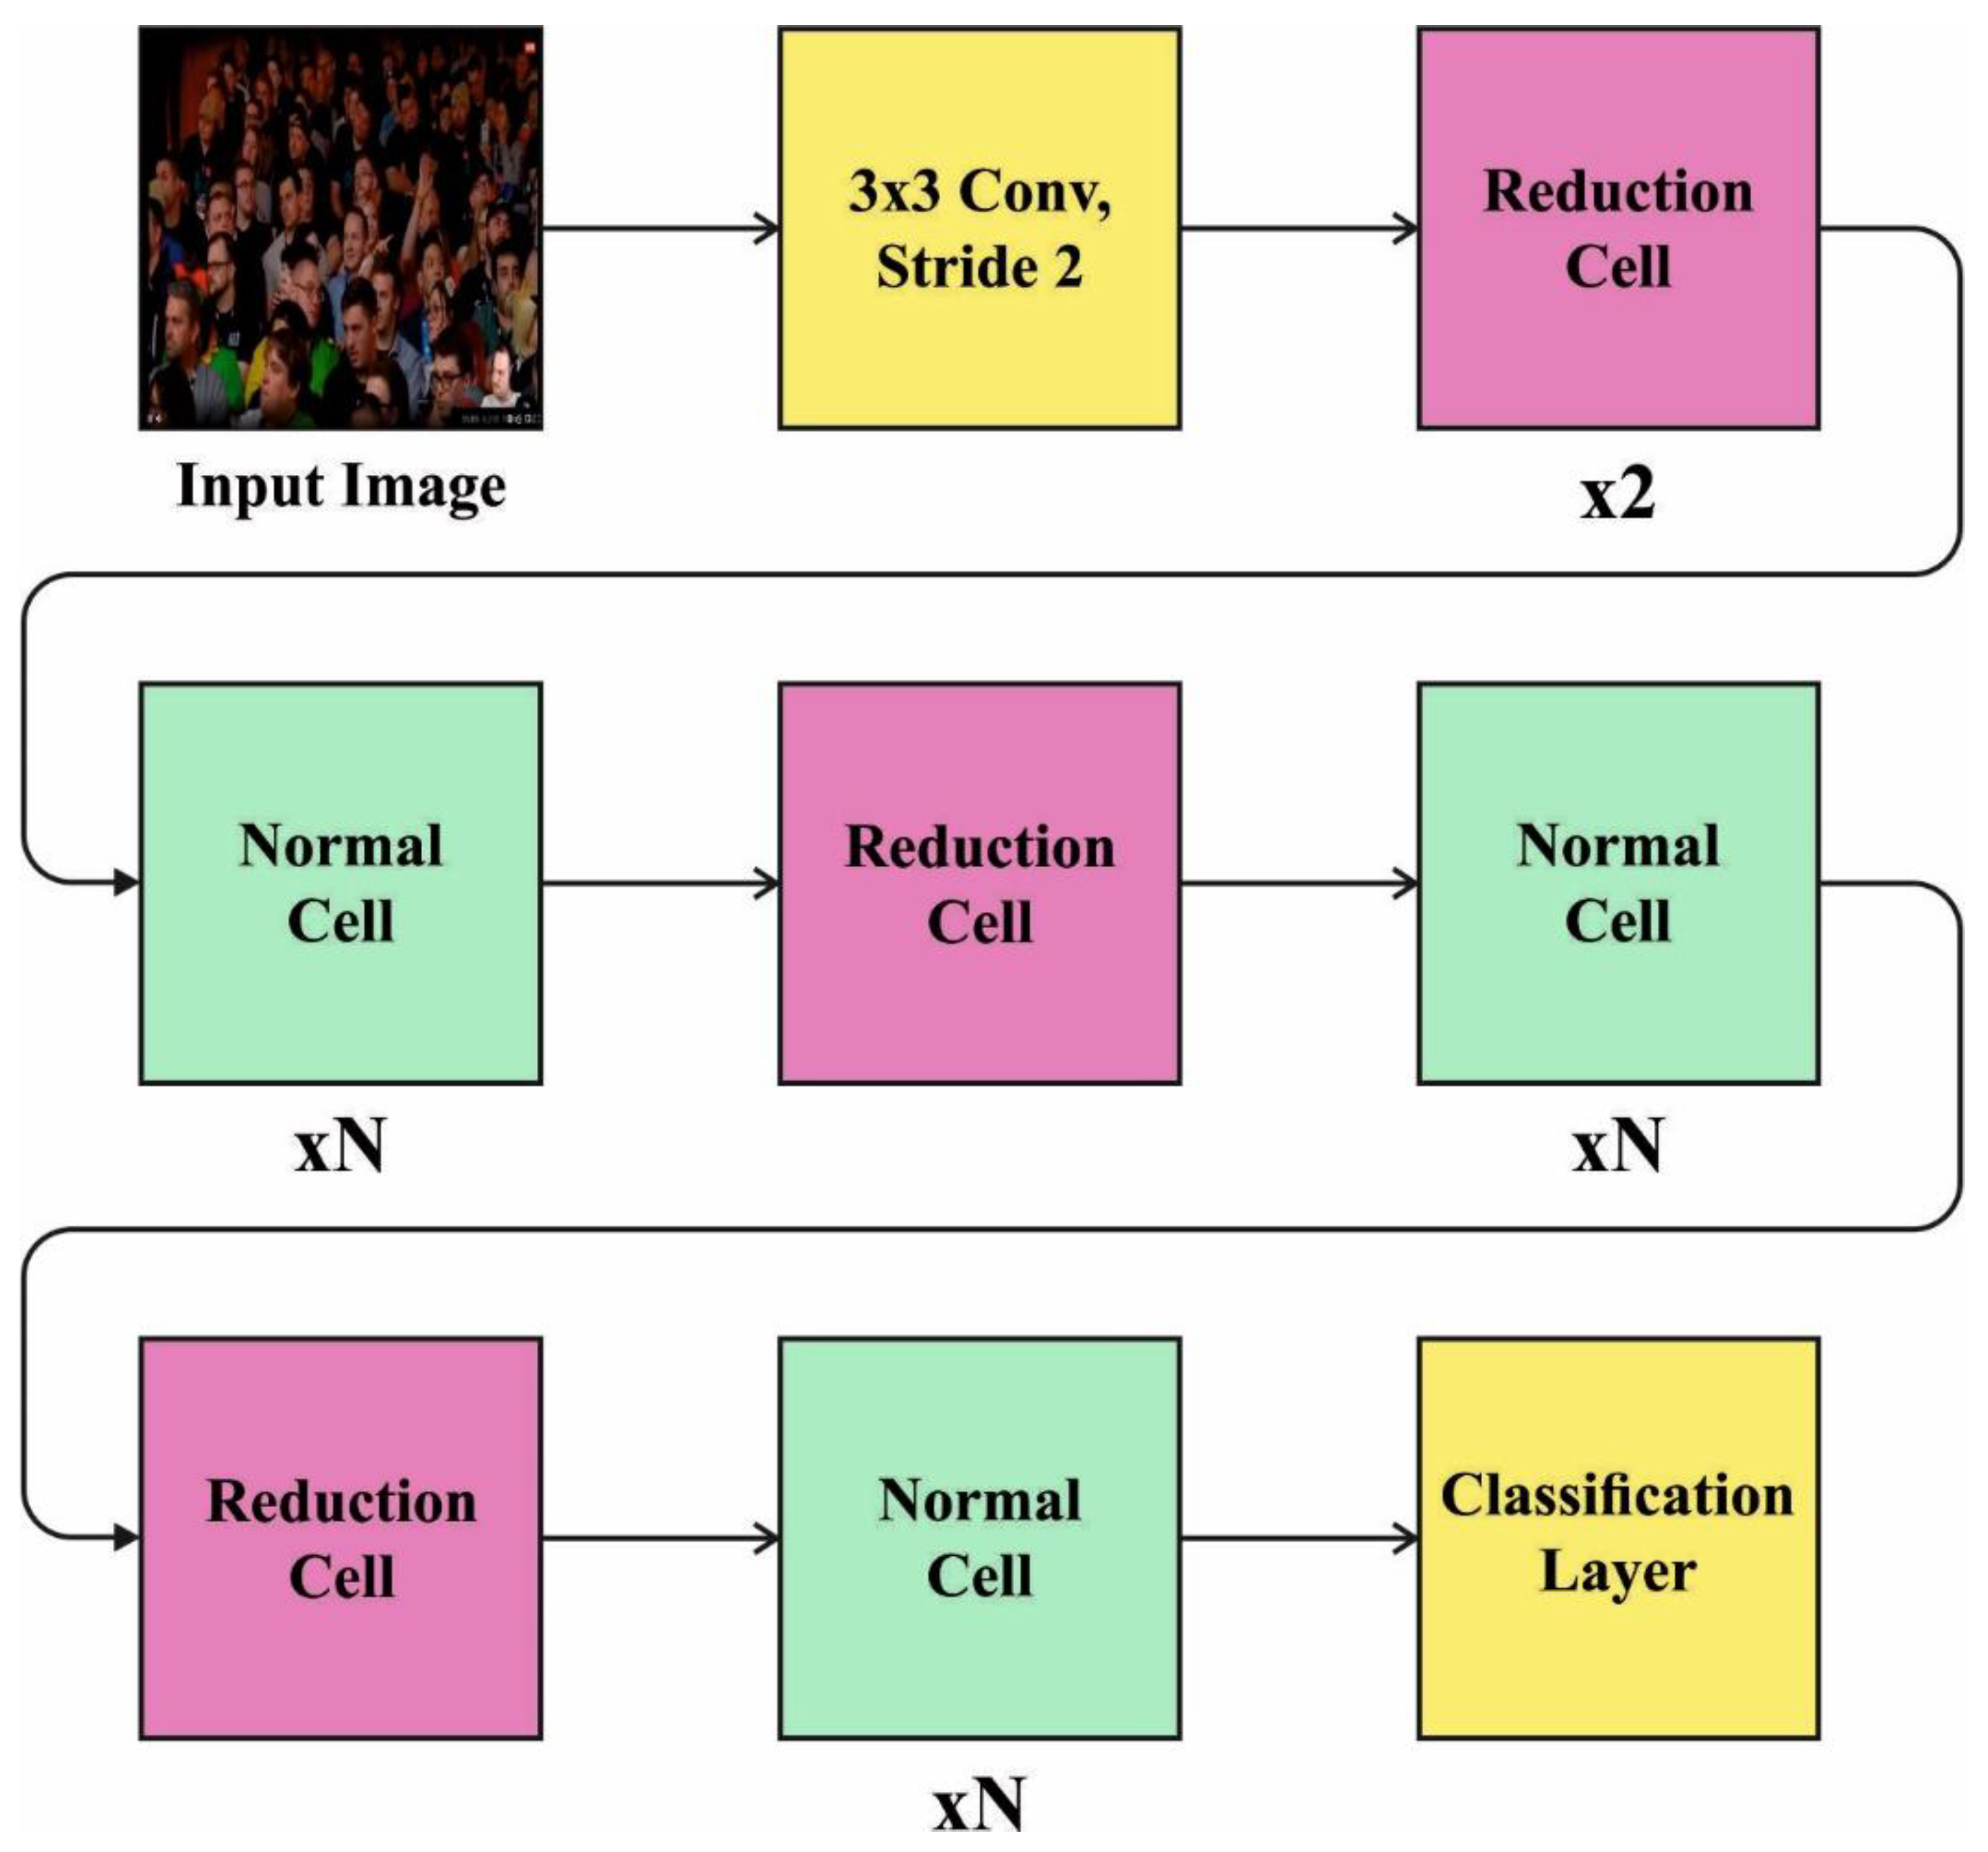
3.1. Feature Extraction Module
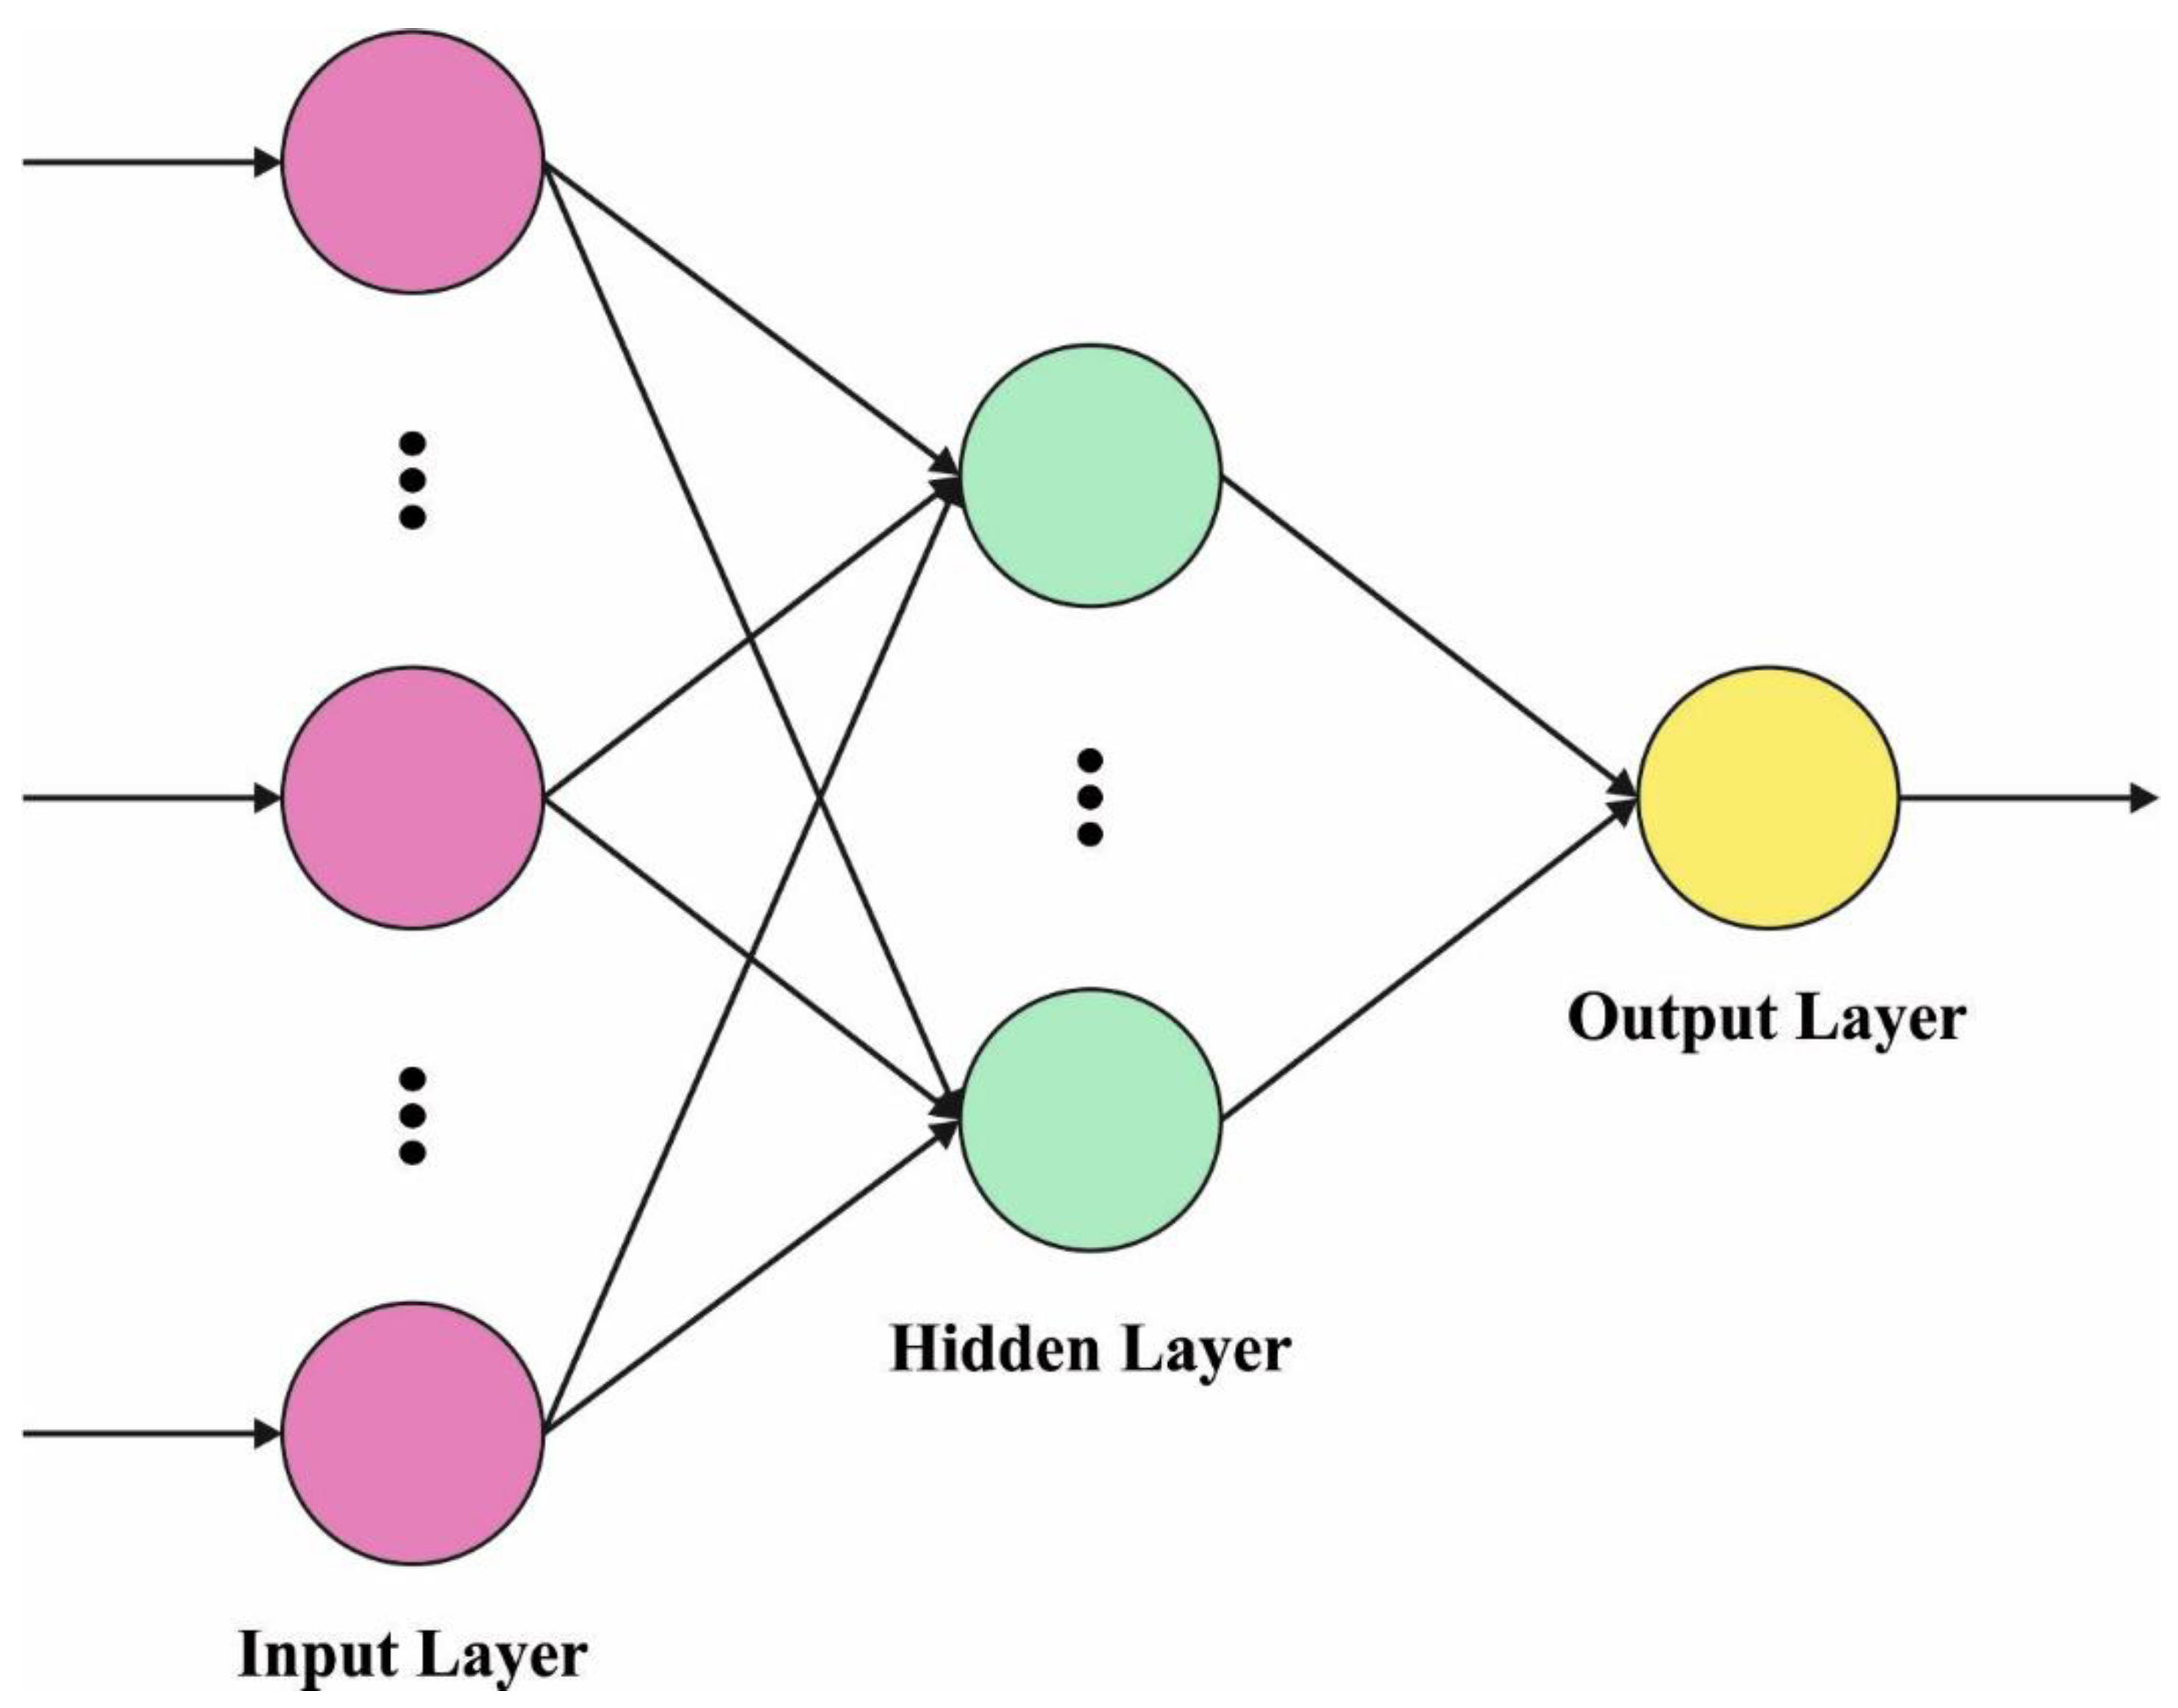
3.2. Crowd Density Classification Module
3.3. Parameter Tuning Process
- Individual swimming due to population migration:
- 2.
- Foraging behaviour:
- 3.
- Random diffusion of individual krill:
4. Results and Discussion
5. Conclusions
Author Contributions
Funding
Institutional Review Board Statement
Informed Consent Statement
Data Availability Statement
Conflicts of Interest
References
- Liu, W.; Lis, K.; Salzmann, M.; Fua, P. Geometric and physical constraints for drone-based head plane crowd density estimation. In Proceedings of the 2019 IEEE/RSJ International Conference on Intelligent Robots and Systems (IROS), Macau, China, 3–8 November 2019; IEEE: Piscataway, NJ, USA, 2019; pp. 244–249. [Google Scholar]
- Gao, G.; Gao, J.; Liu, Q.; Wang, Q.; Wang, Y. Cnn-based density estimation and crowd counting: A survey. arXiv 2020, arXiv:2003.12783. [Google Scholar]
- Fradi, H.; Dugelay, J.L. Towards crowd density-aware video surveillance applications. Inf. Fusion 2015, 24, 3–15. [Google Scholar] [CrossRef]
- Pai, A.K.; Karunakar, A.K.; Raghavendra, U. A novel crowd density estimation technique using local binary pattern and Gabor features. In Proceedings of the 2017 14th IEEE International Conference on Advanced Video and Signal Based Surveillance (AVSS), Lecce, Italy, 29 August–1 September 2017; IEEE: Piscataway, NJ, USA, 2017; pp. 1–6. [Google Scholar]
- Zhou, B.; Song, B.; Hassan, M.M.; Alamri, A. Multilinear rank support tensor machine for crowd density estimation. Eng. Appl. Artif. Intell. 2018, 72, 382–392. [Google Scholar] [CrossRef]
- Sindagi, V.A.; Patel, V.M. A survey of recent advances in cnn-based single image crowd counting and density estimation. Pattern Recognit. Lett. 2018, 107, 3–16. [Google Scholar] [CrossRef] [Green Version]
- Weng, W.T.; Lin, D.T. Crowd density estimation based on a modified multicolumn convolutional neural network. In Proceedings of the 2018 International Joint Conference on Neural Networks (IJCNN), Rio de Janeiro, Brazil, 8–13 July 2018; IEEE: Piscataway, NJ, USA, 2018; pp. 1–7. [Google Scholar]
- Anwer, M.H.; Hadeel, A.; Fahd, N.A.; Mohamed, K.N.; Abdelwahed, M.; Anil, K.; Ishfaq, Y.; Abu Sarwar, Z. Fuzzy cognitive maps with bird swarm intelligence optimization-based remote sensing image classification. Comput. Intell. Neurosci. 2022, 2022, 4063354. [Google Scholar]
- Sreenu, G.; Durai, M.S. Intelligent video surveillance: A review through deep learning techniques for crowd analysis. J. Big Data 2019, 6, 48. [Google Scholar] [CrossRef]
- Abunadi, I.; Althobaiti, M.M.; Al-Wesabi, F.N.; Hilal, A.M.; Medani, M.; Hamza, M.A.; Rizwanullah, M.; Zamani, A.S. Federated learning with blockchain assisted image classification for clustered UAV networks. Comput. Mater. Contin. 2022, 72, 1195–1212. [Google Scholar] [CrossRef]
- Sirohi, P.; Al-Wesabi, F.N.; Alshahrani, H.M.; Maheshwari, P.; Agarwal, A.; Dewangan, B.K.; Hilal, A.M.; Choudhury, T. Energy-efficient cloud service selection and recommendation based on QoS for sustainable smart cities. Appl. Sci. 2021, 11, 9394. [Google Scholar] [CrossRef]
- PK, S.; Rabichith, S.N.S.; Borra, S. Crowd density estimation using image processing: A survey. Int. J. Appl. Eng. Res. 2018, 13, 6855–6864. [Google Scholar]
- Lamba, S.; Nain, N. A texture based mani-fold approach for crowd density estimation using Gaussian Markov Random Field. Multimed. Tools Appl. 2019, 78, 5645–5664. [Google Scholar] [CrossRef]
- Ding, X.; He, F.; Lin, Z.; Wang, Y.; Guo, H.; Huang, Y. Crowd density estimation using fusion of multi-layer features. IEEE Trans. Intell. Transp. Syst. 2020, 22, 4776–4787. [Google Scholar] [CrossRef]
- Zhu, L.; Li, C.; Yang, Z.; Yuan, K.; Wang, S. Crowd density estimation based on classification activation map and patch density level. Neural Comput. Appl. 2020, 32, 5105–5116. [Google Scholar] [CrossRef]
- Tang, X.; Xiao, B.; Li, K. Indoor crowd density estimation through mobile smartphone wi-fi probes. IEEE Trans. Syst. Man Cybern. Syst. 2018, 50, 2638–2649. [Google Scholar] [CrossRef]
- Fan, Z.; Zhang, H.; Zhang, Z.; Lu, G.; Zhang, Y.; Wang, Y. A survey of crowd counting and density estimation based on convolutional neural network. Neurocomputing 2022, 472, 224–251. [Google Scholar] [CrossRef]
- Purwar, R.K. Crowd Density Estimation Using Hough Circle Transform for Video Surveillance. In Proceedings of the 2019 6th International Conference on Signal Processing and Integrated Networks (SPIN), Noida, India, 7–8 March 2019; IEEE: Piscataway, NJ, USA, 2019; pp. 442–447.
- Bouhlel, F.; Mliki, H.; Hammami, M. Abnormal crowd density estimation in aerial images based on the deep and handcrafted features fusion. Expert Syst. Appl. 2021, 173, 114656. [Google Scholar] [CrossRef]
- Li, M.; Chen, T.; Li, Z.; Liu, H. An Efficient Crowd Density Estimation Algorithm Through Network Compression. In Traffic and Granular Flow 2019; Springer: Cham, Switzerland, 2020; pp. 165–173. [Google Scholar]
- Xiang, J.; Liu, N. Crowd Density Estimation Method Using Deep Learning for Passenger Flow Detection System in Exhibition Center. Sci. Program. 2022, 2022, 1990951. [Google Scholar] [CrossRef]
- Bhuiyan, M.R.; Abdullah, J.; Hashim, N.; Al Farid, F.; Haque, M.A.; Uddin, J.; Isa, W.N.M.; Husen, M.N.; Abdullah, N. A deep crowd density classification model for Hajj pilgrimage using fully convolutional neural network. PeerJ Comput. Sci. 2022, 8, e895. [Google Scholar] [CrossRef]
- Li, Y.C.; Jia, R.S.; Hu, Y.X.; Han, D.N.; Sun, H.M. Crowd density estimation based on multi scale features fusion network with reverse attention mechanism. Appl. Intell. 2022, 1–17. [Google Scholar] [CrossRef]
- Wang, S.; Pu, Z.; Li, Q.; Wang, Y. Estimating Crowd Density with Edge Intelligence Based on Lightweight Convolutional Neural Networks. Expert Syst. Appl. 2022, 206, 117823. [Google Scholar] [CrossRef]
- Zaman, K.; Sun, Z.; Shah, S.M.; Shoaib, M.; Pei, L.; Hussain, A. Driver Emotions Recognition Based on Improved Faster R-CNN and Neural Architectural Search Network. Symmetry 2022, 14, 687. [Google Scholar] [CrossRef]
- Mirjalili, S.; Gandomi, A.H.; Mirjalili, S.Z.; Saremi, S.; Faris, H.; Mirjalili, S.M. Salp swarm algorithm: A bioinspired optimizer for engineering design problems. Adv. Eng. Softw. 2017, 114, 163–191. [Google Scholar] [CrossRef]
- Xia, J.; Zhang, H.; Li, R.; Wang, Z.; Cai, Z.; Gu, Z.; Chen, H.; Pan, Z. Adaptive Barebones Salp Swarm Algorithm with Quasi-oppositional Learning for Medical Diagnosis Systems: A Comprehensive Analysis. J. Bionic Eng. 2022, 19, 240–256. [Google Scholar] [CrossRef]
- Utomo, O.K.; Surantha, N.; Isa, S.M.; Soewito, B. Automatic sleep stage classification using weighted ELM and PSO on imbalanced data from single lead ECG. Procedia Comput. Sci. 2019, 157, 321–328. [Google Scholar] [CrossRef]
- Deng, Z.G.; Yang, J.H.; Dong, C.L.; Xiang, M.Q.; Qin, Y.; Sun, Y.S. Research on economic dispatch of integrated energy system based on improved krill swarm algorithm. Energy Rep. 2022, 8, 77–86. [Google Scholar] [CrossRef]
- Meynberg, O.; Cui, S.; Reinartz, P. Detection of high-density crowds in aerial images using texture classification. Remote Sens. 2016, 8, 470. [Google Scholar] [CrossRef] [Green Version]
- Pu, S.; Song, T.; Zhang, Y.; Xie, D. Estimation of crowd density in surveillance scenes based on deep convolutional neural network. Procedia Comput. Sci. 2017, 111, 154–159. [Google Scholar] [CrossRef]

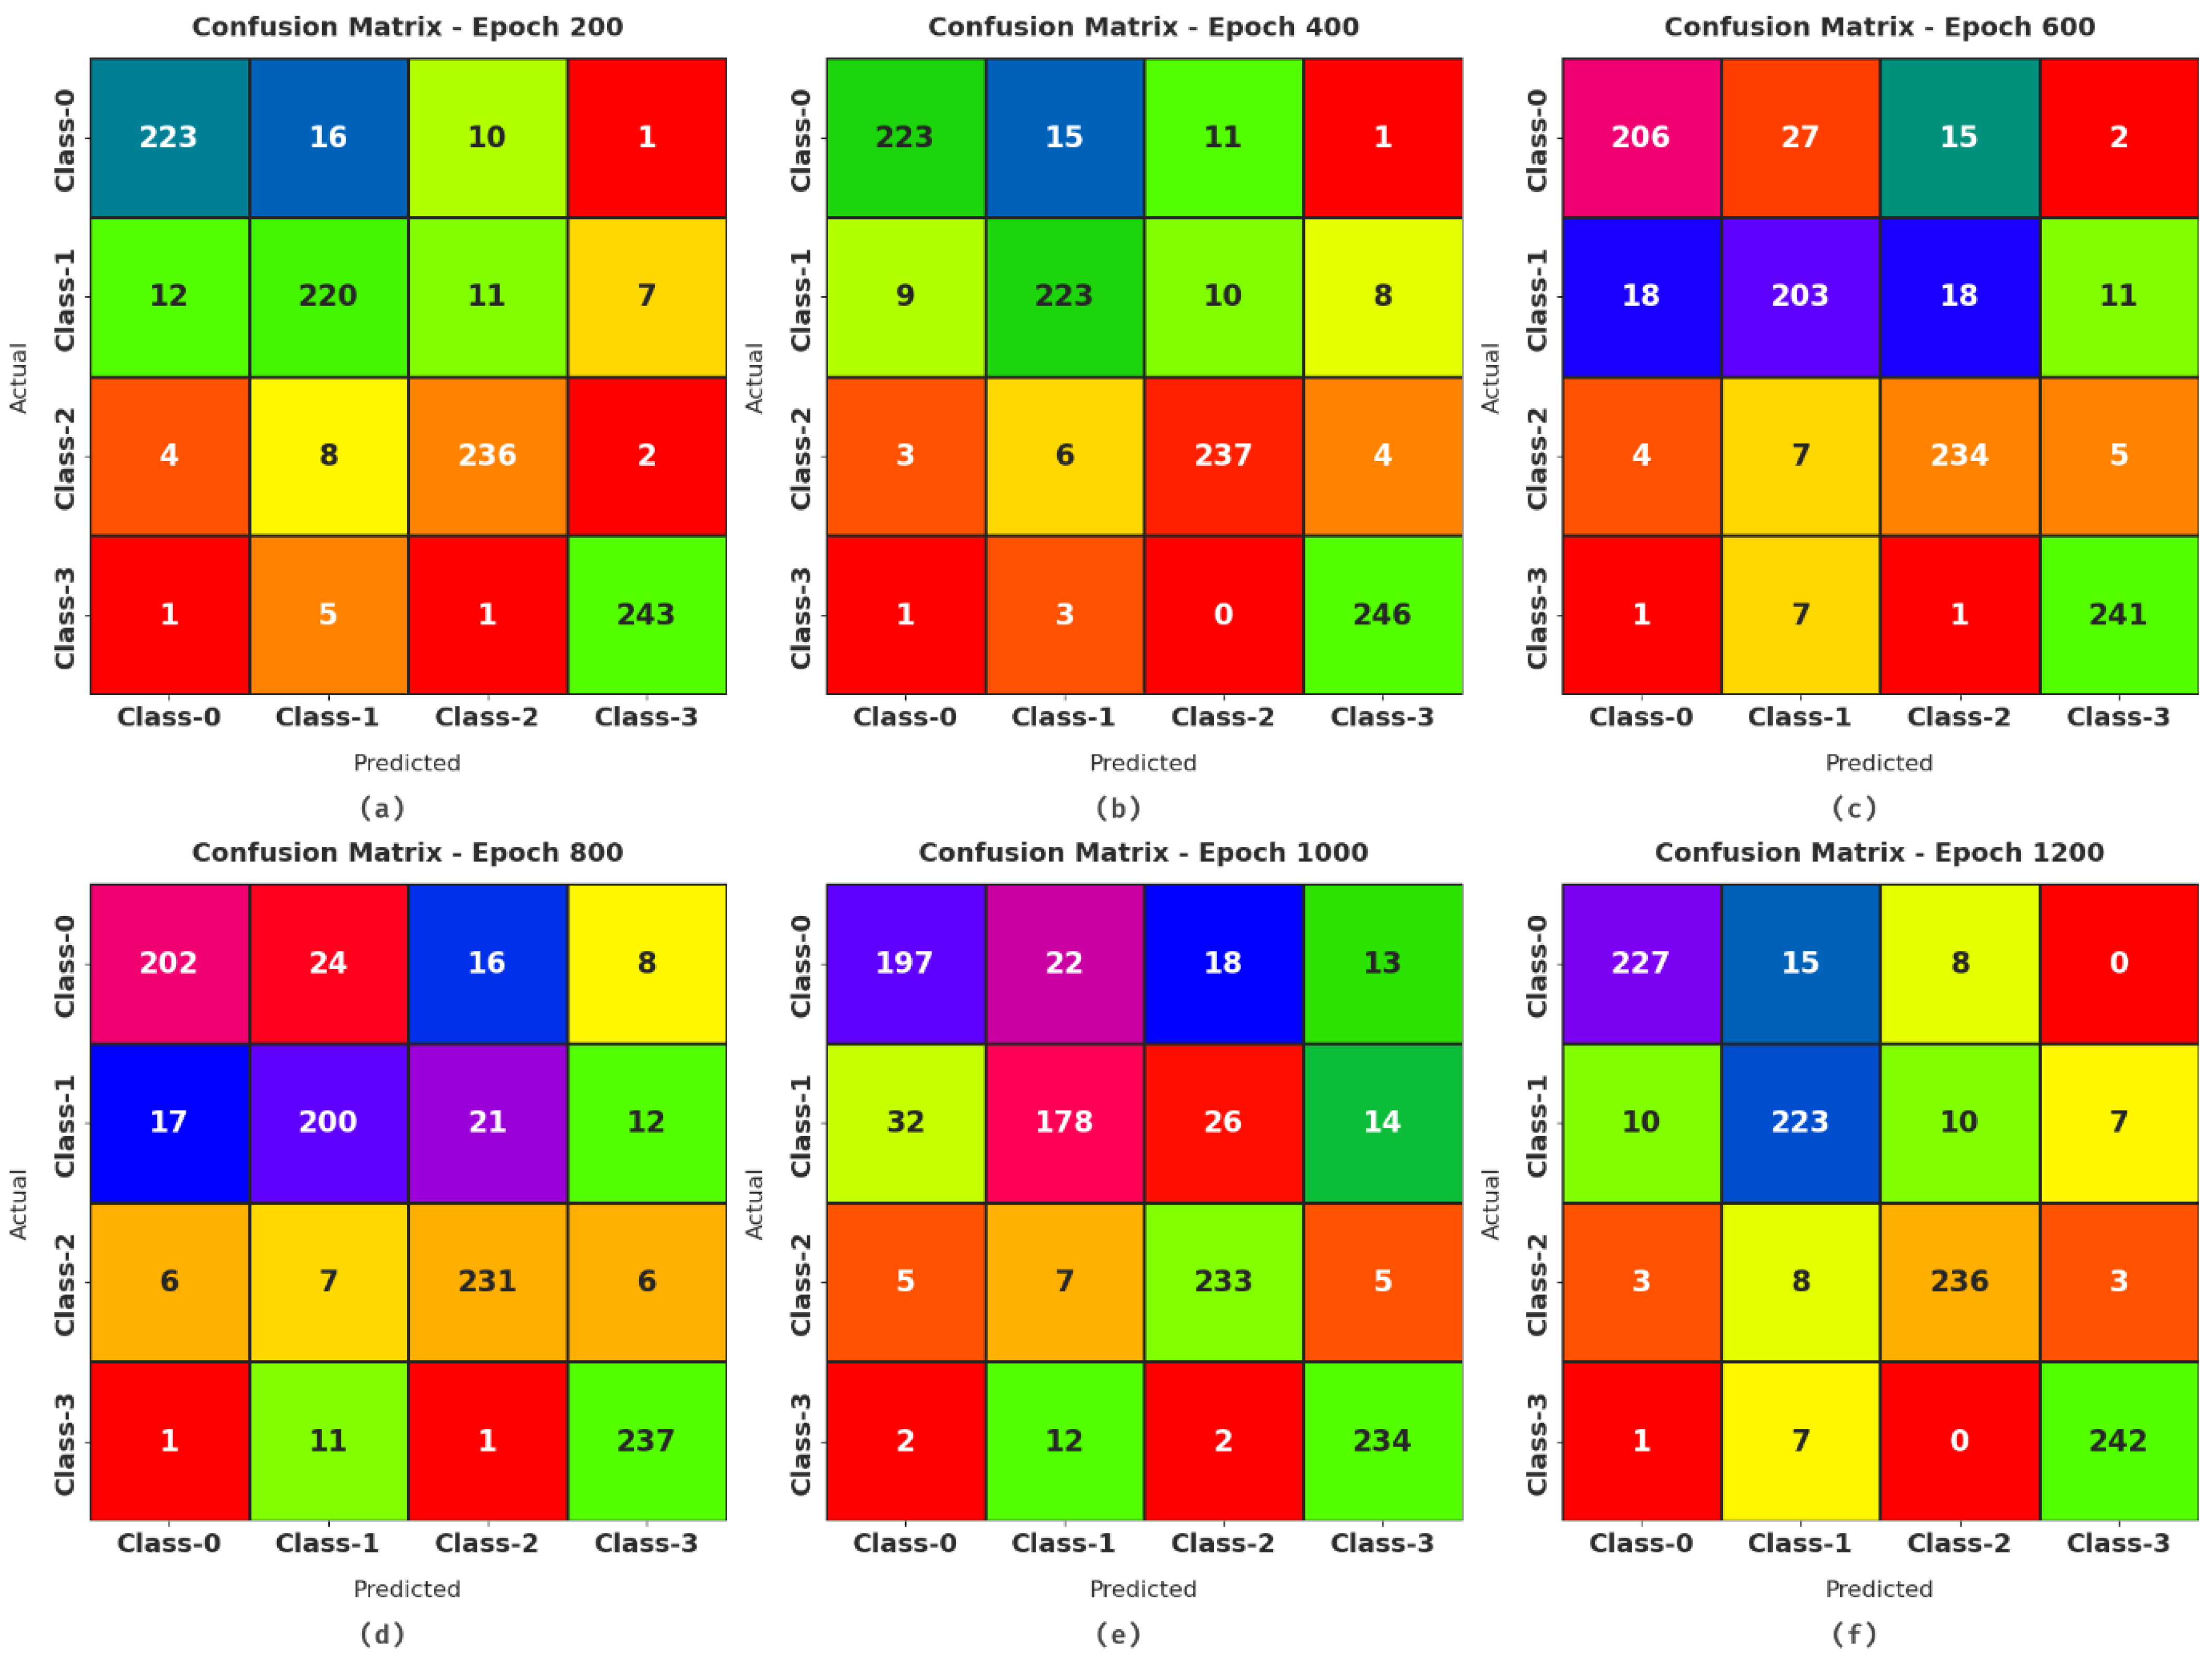
| Labels | Class Name | No. of Instances |
|---|---|---|
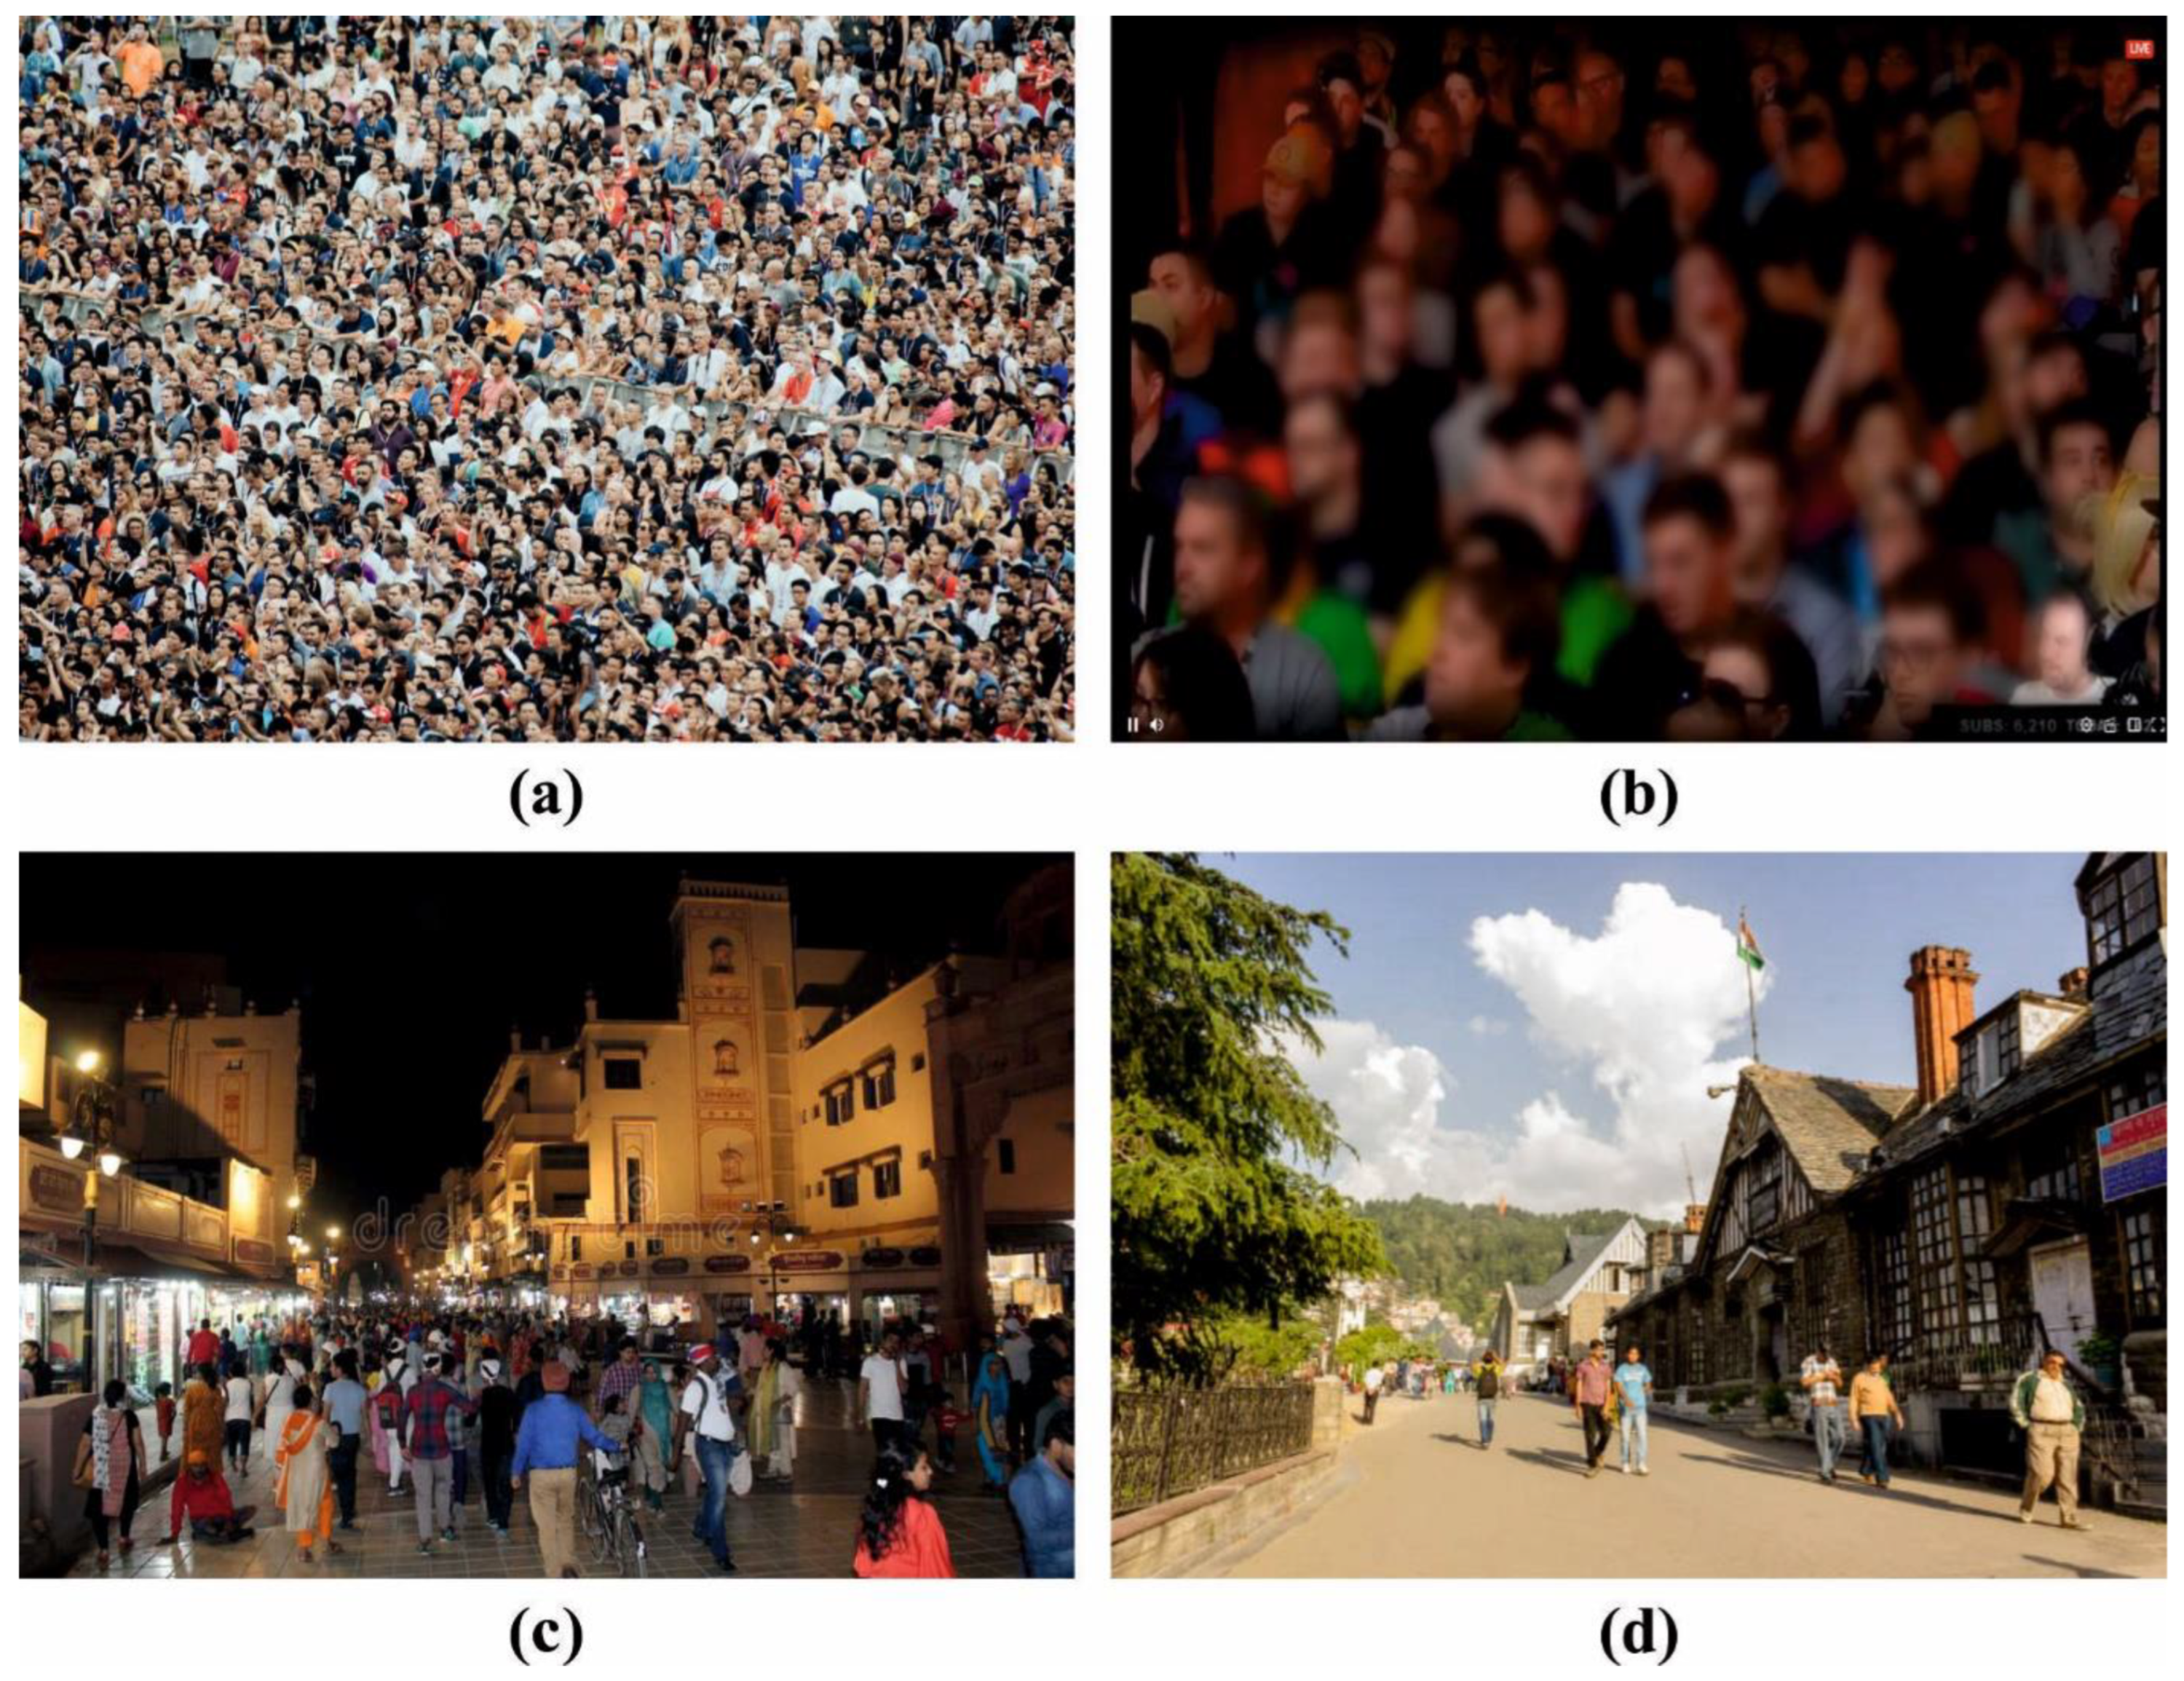
| Class-0 | Dense Crowd | 250 |
| Class-1 | Medium Dense Crowd | 250 |
| Class-2 | Sparse Crowd | 250 |
| Class-3 | No Crowd | 250 |
| Total No. of Instances | 1000 | |
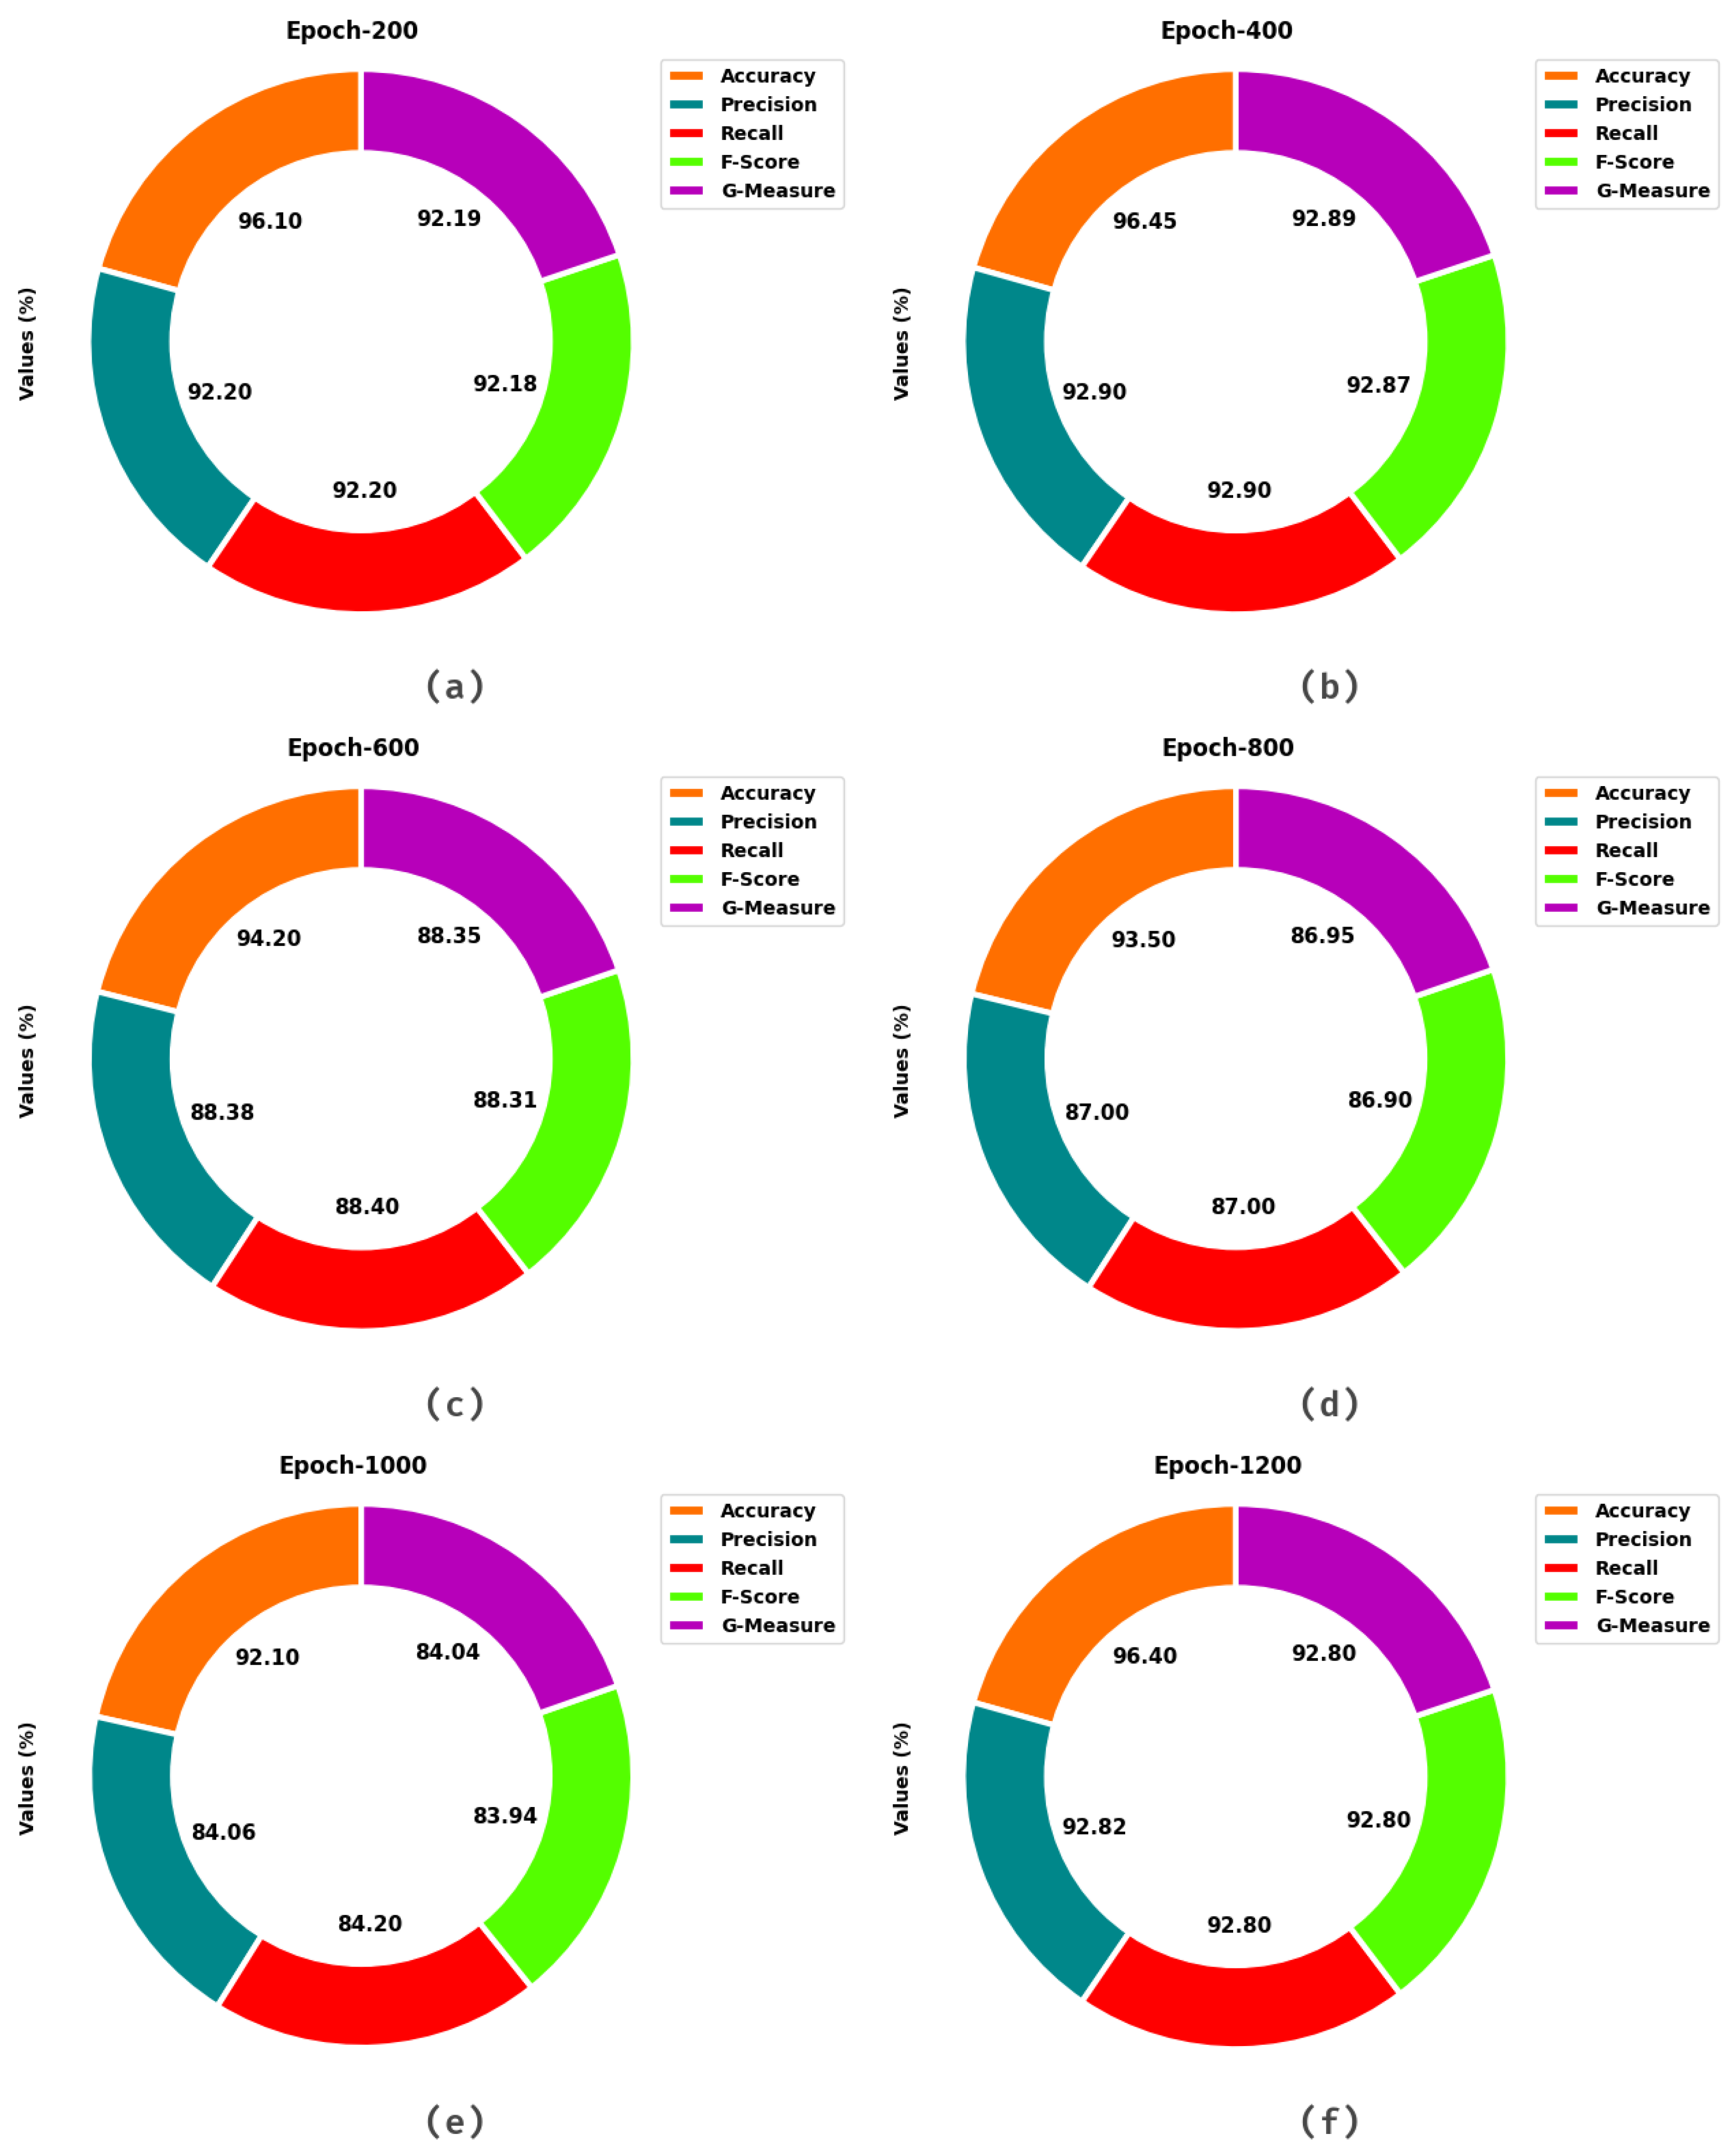
| Class Labels | Accuracy | Precision | Recall | F-Score | G-Measure |
|---|---|---|---|---|---|
| Epoch-200 | |||||
| Class-0 | 95.60 | 92.92 | 89.20 | 91.02 | 91.04 |
| Class-1 | 94.10 | 88.35 | 88.00 | 88.18 | 88.18 |
| Class-2 | 96.40 | 91.47 | 94.40 | 92.91 | 92.92 |
| Class-3 | 98.30 | 96.05 | 97.20 | 96.62 | 96.62 |
| Average | 96.10 | 92.20 | 92.20 | 92.18 | 92.19 |
| Epoch-400 | |||||
| Class-0 | 96.00 | 94.49 | 89.20 | 91.77 | 91.81 |
| Class-1 | 94.90 | 90.28 | 89.20 | 89.74 | 89.74 |
| Class-2 | 96.60 | 91.86 | 94.80 | 93.31 | 93.32 |
| Class-3 | 98.30 | 94.98 | 98.40 | 96.66 | 96.68 |
| Average | 96.45 | 92.90 | 92.90 | 92.87 | 92.89 |
| Epoch-600 | |||||
| Class-0 | 93.30 | 89.96 | 82.40 | 86.01 | 86.10 |
| Class-1 | 91.20 | 83.20 | 81.20 | 82.19 | 82.19 |
| Class-2 | 95.00 | 87.31 | 93.60 | 90.35 | 90.40 |
| Class-3 | 97.30 | 93.05 | 96.40 | 94.70 | 94.71 |
| Average | 94.20 | 88.38 | 88.40 | 88.31 | 88.35 |
| Epoch-800 | |||||
| Class-0 | 92.80 | 89.38 | 80.80 | 84.87 | 84.98 |
| Class-1 | 90.80 | 82.64 | 80.00 | 81.30 | 81.31 |
| Class-2 | 94.30 | 85.87 | 92.40 | 89.02 | 89.08 |
| Class-3 | 96.10 | 90.11 | 94.80 | 92.40 | 92.43 |
| Average | 93.50 | 87.00 | 87.00 | 86.90 | 86.95 |
| Epoch-1000 | |||||
| Class-0 | 90.80 | 83.47 | 78.80 | 81.07 | 81.10 |
| Class-1 | 88.70 | 81.28 | 71.20 | 75.91 | 76.07 |
| Class-2 | 93.70 | 83.51 | 93.20 | 88.09 | 88.22 |
| Class-3 | 95.20 | 87.97 | 93.60 | 90.70 | 90.74 |
| Average | 92.10 | 84.06 | 84.20 | 83.94 | 84.04 |
| Epoch-1200 | |||||
| Class-0 | 96.30 | 94.19 | 90.80 | 92.46 | 92.48 |
| Class-1 | 94.30 | 88.14 | 89.20 | 88.67 | 88.67 |
| Class-2 | 96.80 | 92.91 | 94.40 | 93.65 | 93.65 |
| Class-3 | 98.20 | 96.03 | 96.80 | 96.41 | 96.42 |
| Average | 96.40 | 92.82 | 92.80 | 92.80 | 92.80 |
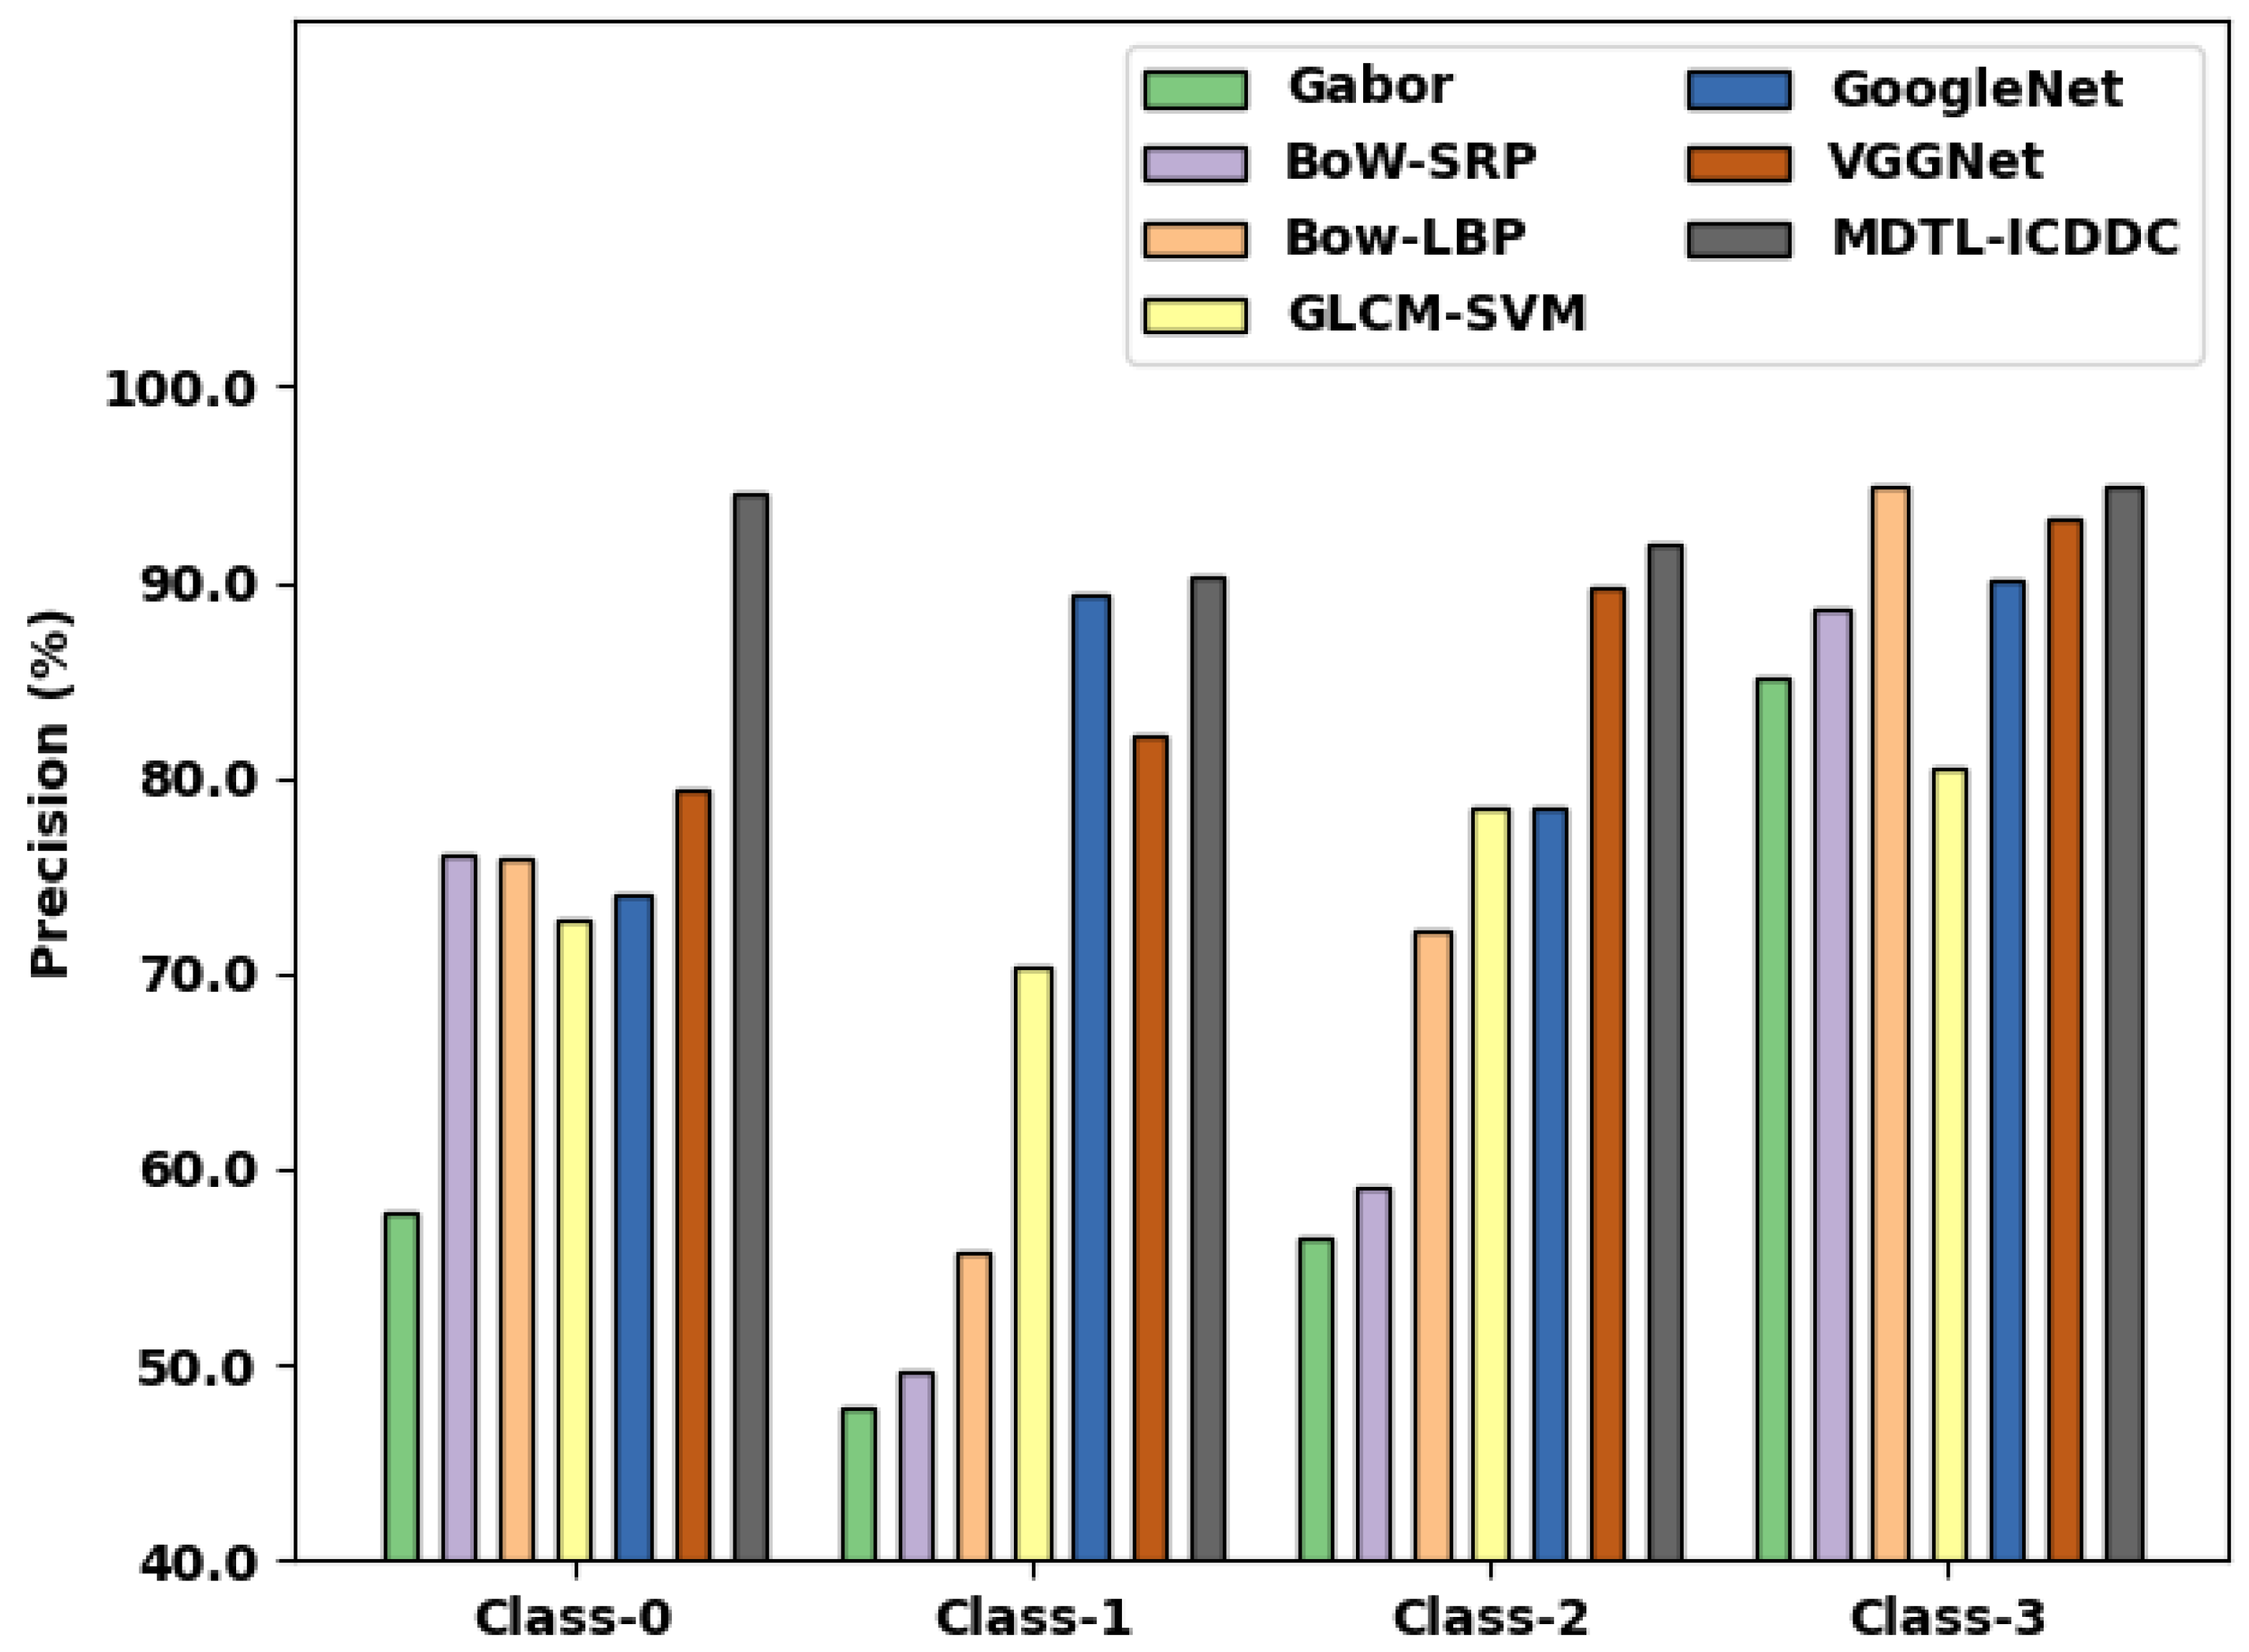
| Precision (%) | |||||
|---|---|---|---|---|---|
| Methods | Class-0 | Class-1 | Class-2 | Class-3 | Average |
| Gabor | 57.80 | 47.80 | 56.50 | 85.20 | 61.83 |
| BoW-SRP | 76.00 | 49.60 | 59.10 | 88.60 | 68.33 |
| Bow-LBP | 75.80 | 55.80 | 72.20 | 94.90 | 74.68 |
| GLCM-SVM | 72.70 | 70.33 | 78.42 | 80.41 | 75.47 |
| GoogleNet | 74.05 | 89.38 | 78.48 | 90.01 | 82.98 |
| VGGNet | 79.42 | 82.11 | 89.78 | 93.23 | 86.14 |
| MDTL-ICDDC | 94.49 | 90.28 | 91.86 | 94.98 | 92.90 |
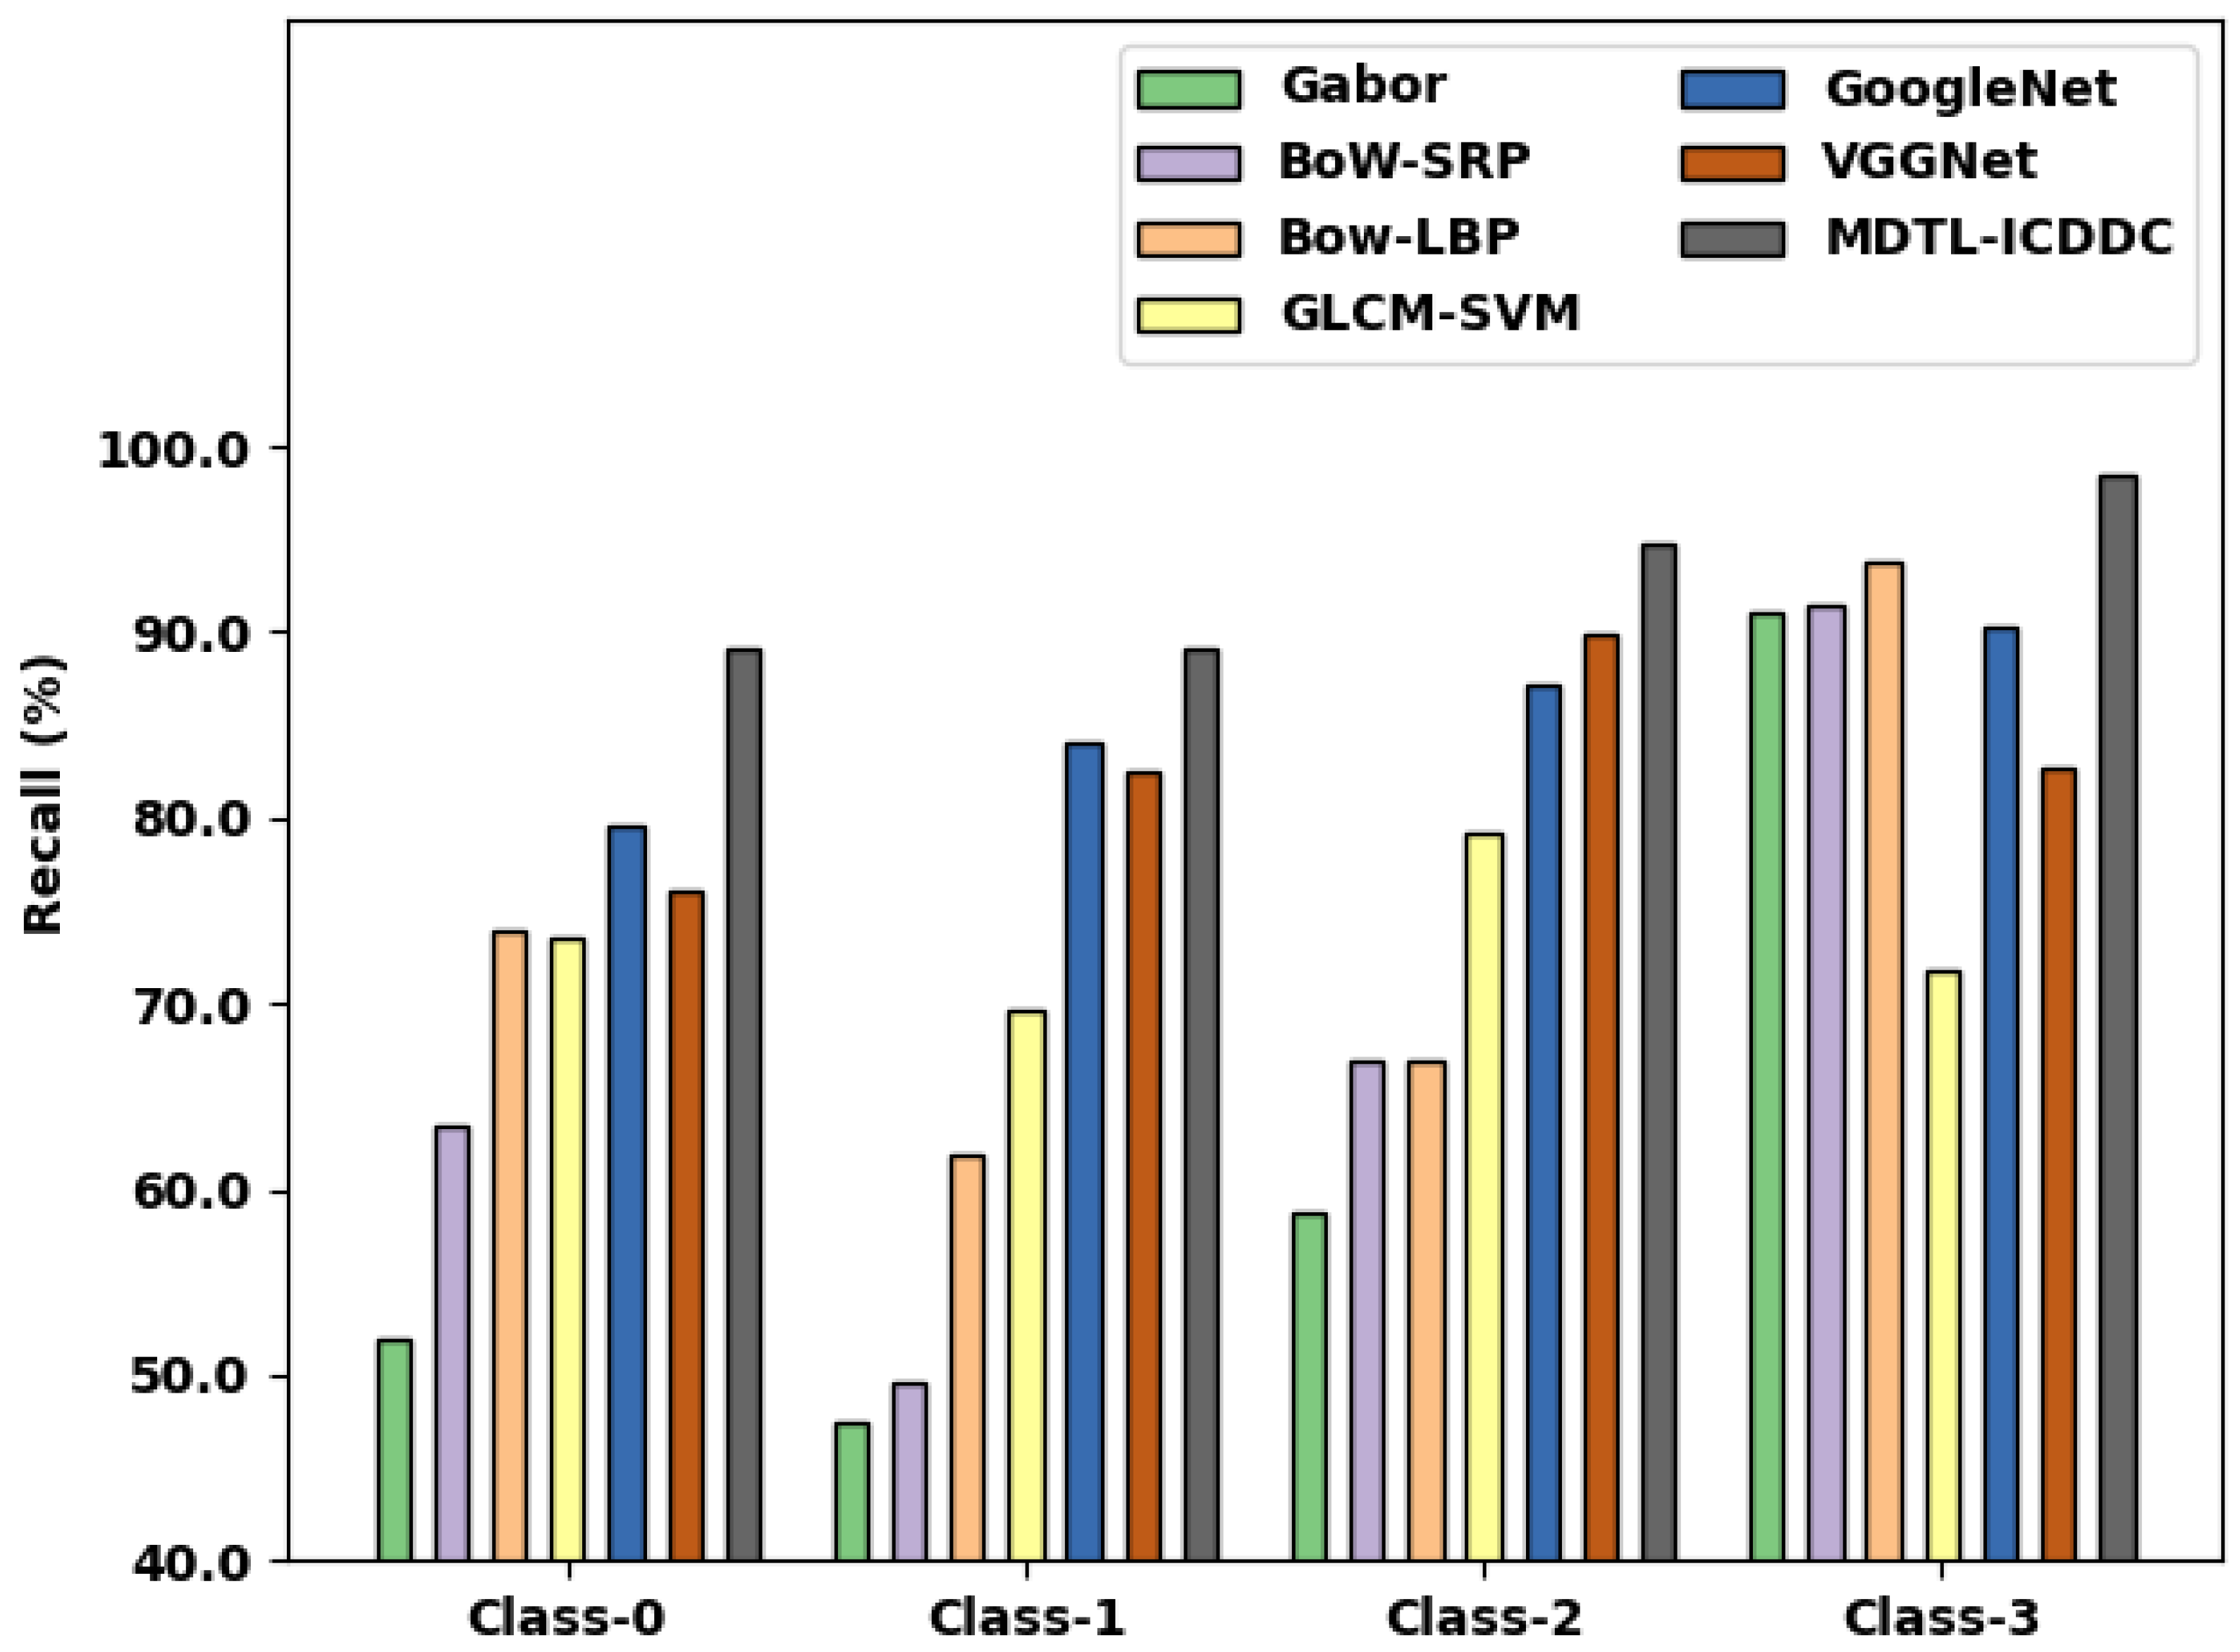
| Recall (%) | |||||
|---|---|---|---|---|---|
| Methods | Class-0 | Class-1 | Class-2 | Class-3 | Average |
| Gabor | 52.00 | 47.40 | 58.80 | 91.00 | 62.30 |
| BoW-SRP | 63.40 | 49.60 | 67.00 | 91.40 | 67.85 |
| Bow-LBP | 74.00 | 61.80 | 67.00 | 93.80 | 74.15 |
| GLCM-SVM | 73.59 | 69.57 | 79.17 | 71.74 | 73.52 |
| GoogleNet | 79.60 | 83.99 | 87.18 | 90.26 | 85.26 |
| VGGNet | 76.08 | 82.46 | 89.82 | 82.75 | 82.78 |
| MDTL-ICDDC | 89.20 | 89.20 | 94.80 | 98.40 | 92.90 |
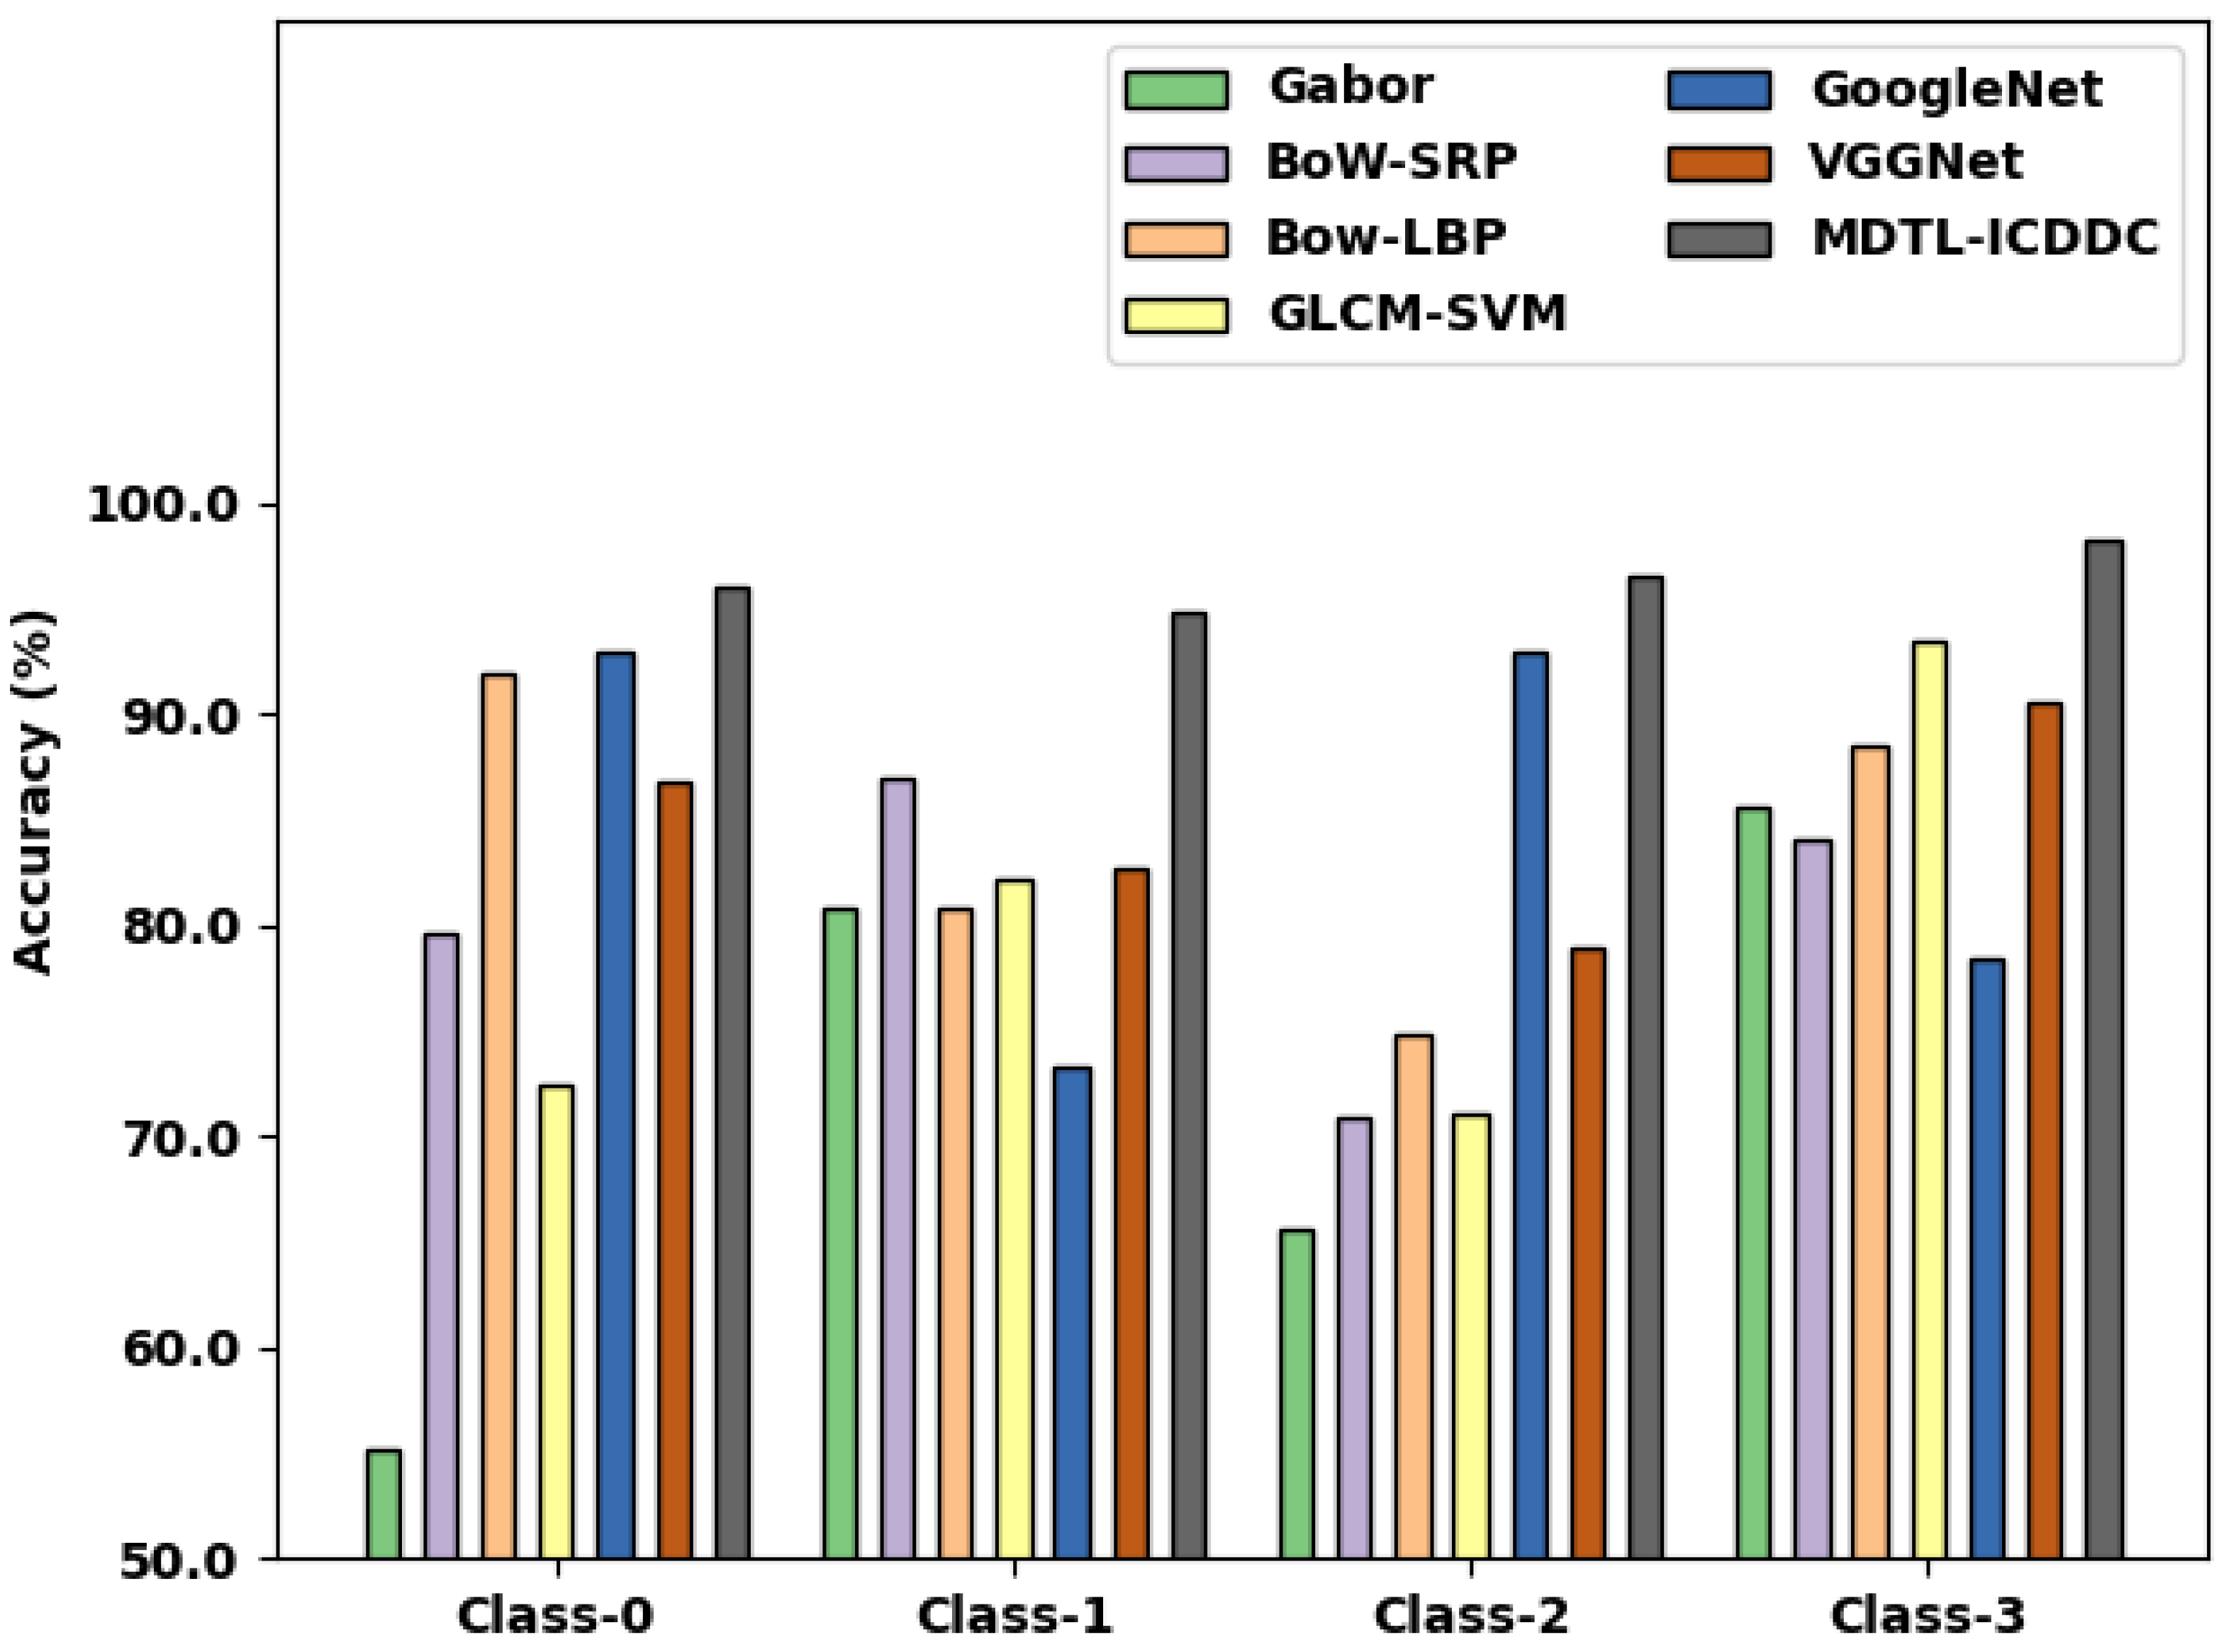
| Accuracy (%) | |||||
|---|---|---|---|---|---|
| Methods | Class-0 | Class-1 | Class-2 | Class-3 | Average |
| Gabor | 55.13 | 80.83 | 65.67 | 85.67 | 71.83 |
| BoW-SRP | 79.65 | 86.95 | 70.86 | 84.15 | 80.40 |
| Bow-LBP | 91.89 | 80.86 | 74.86 | 88.55 | 84.04 |
| GLCM-SVM | 72.43 | 82.21 | 70.99 | 93.48 | 79.78 |
| GoogleNet | 93.00 | 73.23 | 92.88 | 78.50 | 84.40 |
| VGGNet | 86.73 | 82.73 | 78.95 | 90.57 | 84.75 |
| MDTL-ICDDC | 96.00 | 94.90 | 96.60 | 98.30 | 96.45 |
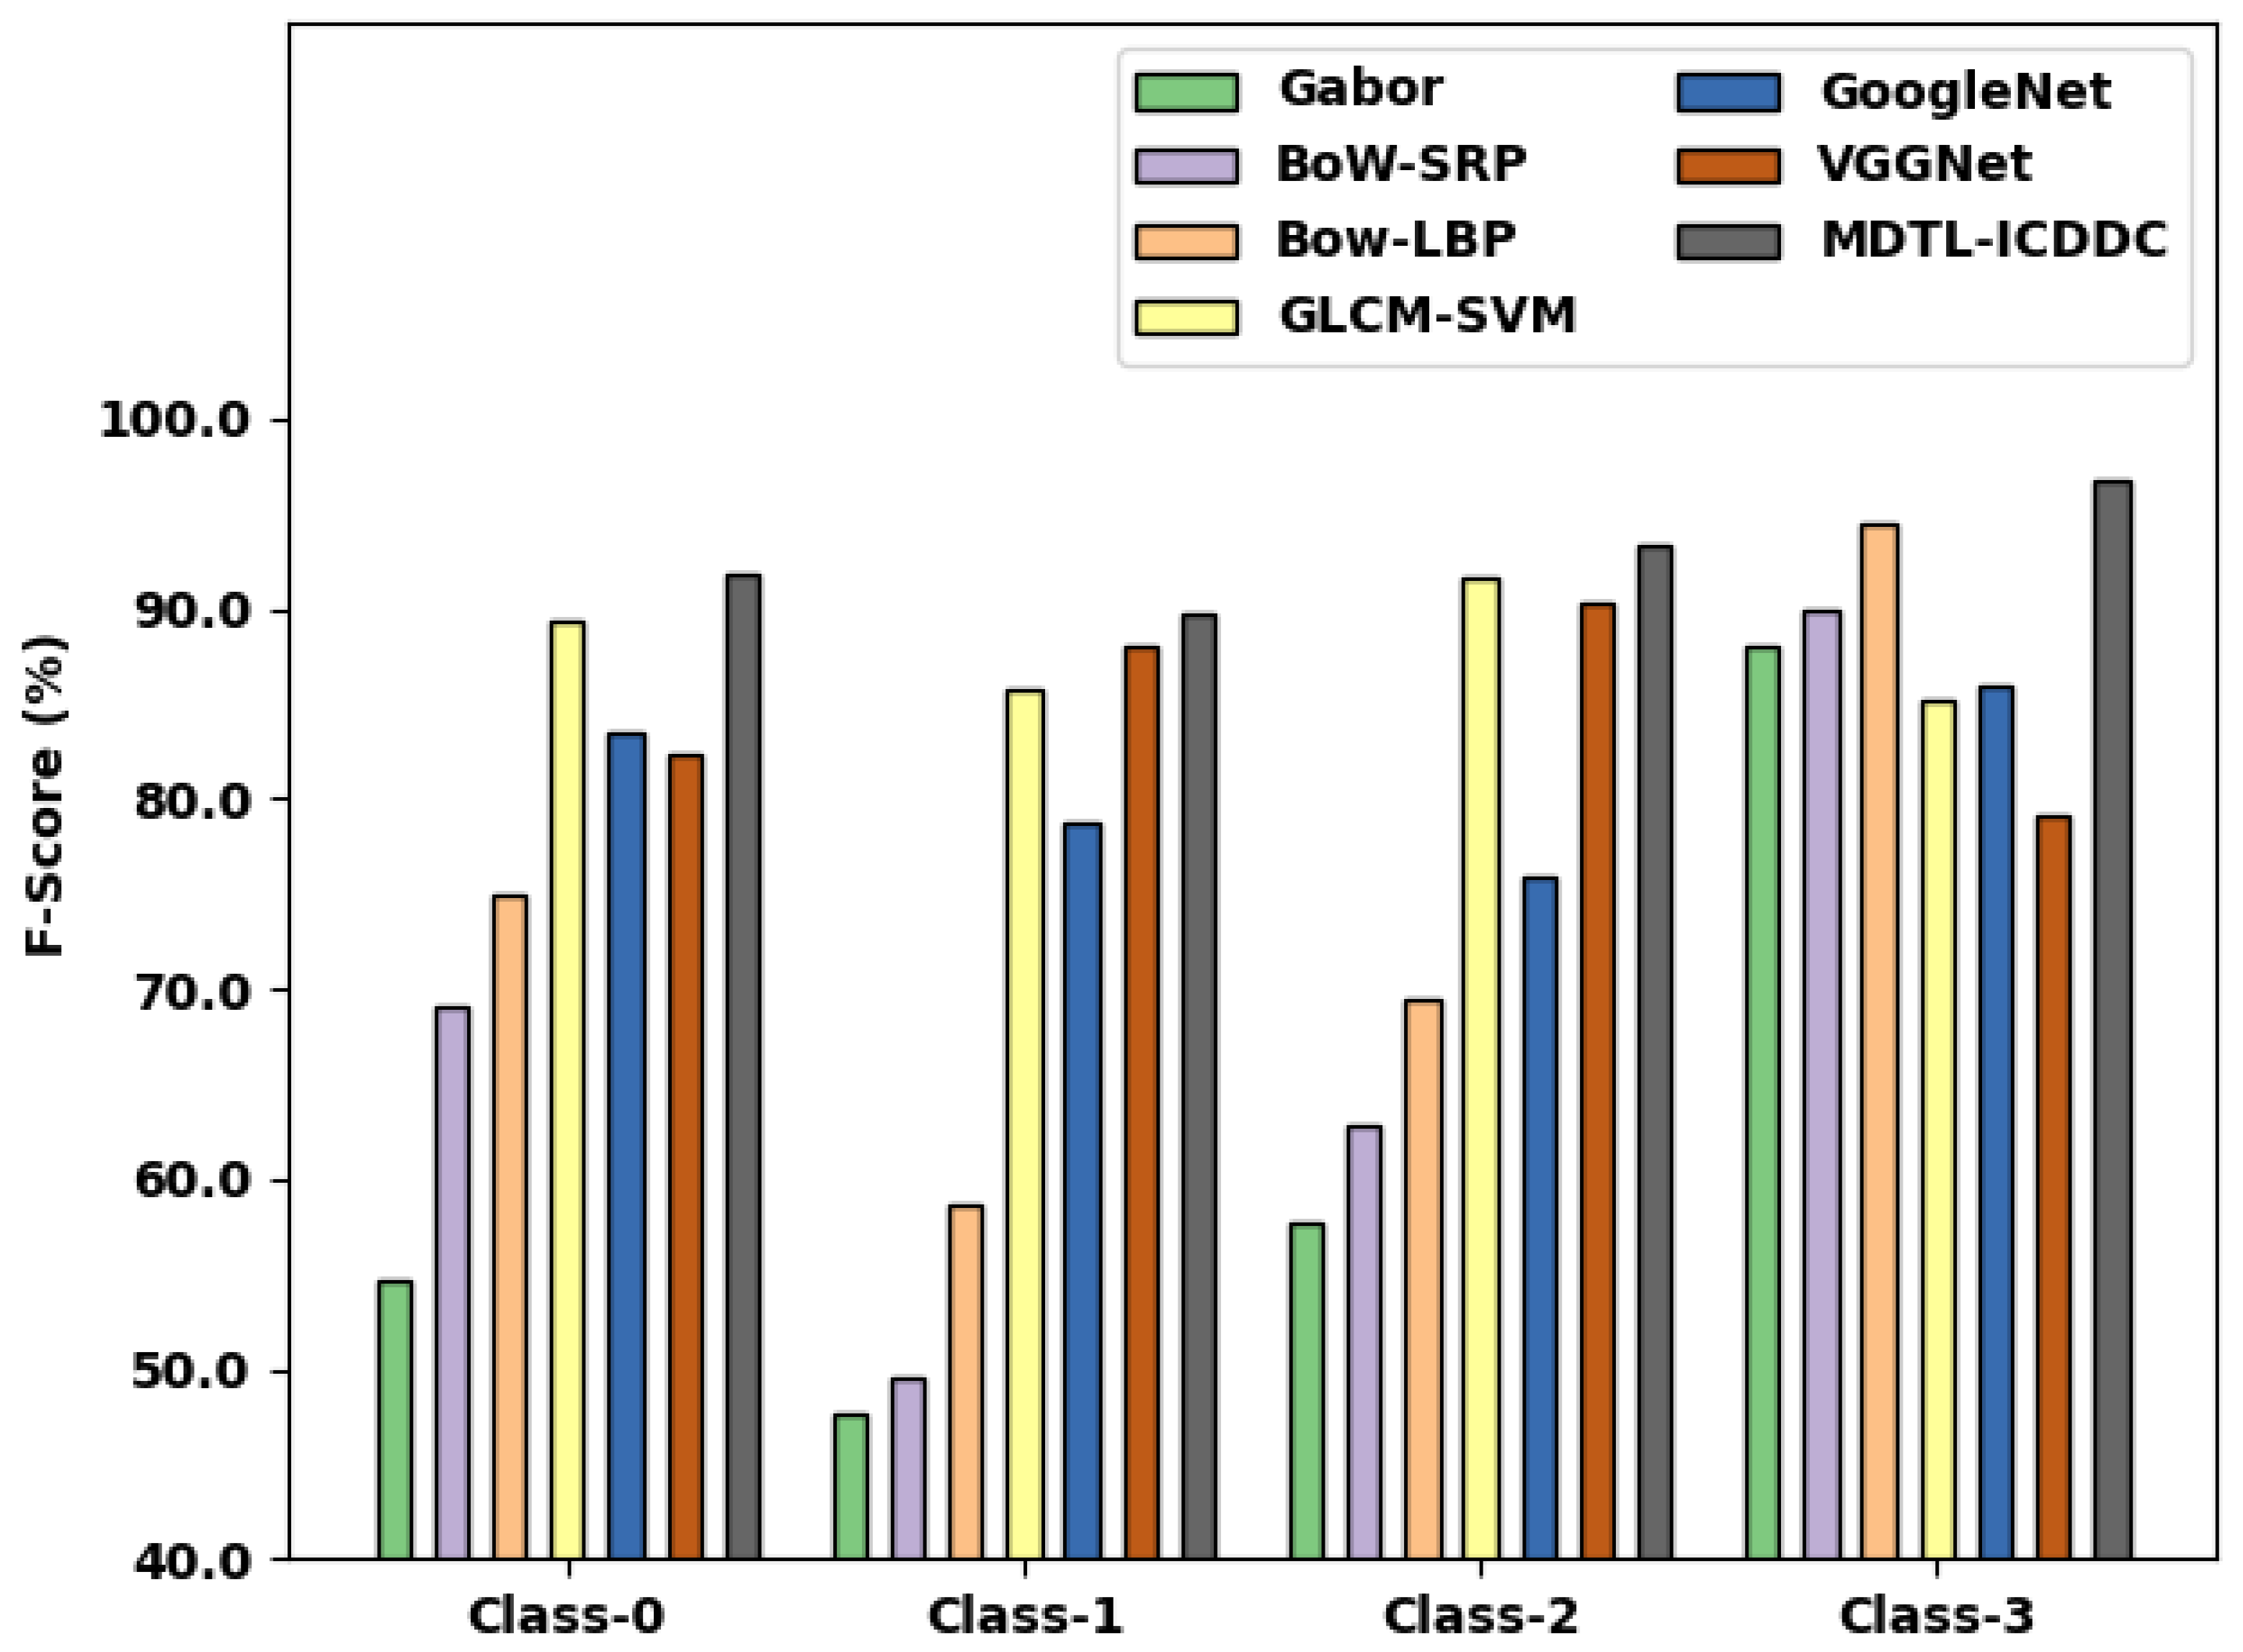
| F-Score (%) | |||||
|---|---|---|---|---|---|
| Methods | Class-0 | Class-1 | Class-2 | Class-3 | Average |
| Gabor | 54.70 | 47.60 | 57.60 | 88.00 | 61.98 |
| BoW-SRP | 69.10 | 49.60 | 62.80 | 90.00 | 67.88 |
| Bow-LBP | 74.90 | 58.60 | 69.50 | 94.40 | 74.35 |
| GLCM-SVM | 89.44 | 85.78 | 91.64 | 85.09 | 87.99 |
| GoogleNet | 83.54 | 78.67 | 75.90 | 85.89 | 81.00 |
| VGGNet | 82.37 | 87.98 | 90.28 | 79.17 | 84.95 |
| MDTL-ICDDC | 91.77 | 89.74 | 93.31 | 96.66 | 92.87 |
Publisher’s Note: MDPI stays neutral with regard to jurisdictional claims in published maps and institutional affiliations. |
© 2022 by the authors. Licensee MDPI, Basel, Switzerland. This article is an open access article distributed under the terms and conditions of the Creative Commons Attribution (CC BY) license (https://creativecommons.org/licenses/by/4.0/).
Share and Cite
Alrowais, F.; Alotaibi, S.S.; Al-Wesabi, F.N.; Negm, N.; Alabdan, R.; Marzouk, R.; Mehanna, A.S.; Al Duhayyim, M. Deep Transfer Learning Enabled Intelligent Object Detection for Crowd Density Analysis on Video Surveillance Systems. Appl. Sci. 2022, 12, 6665. https://doi.org/10.3390/app12136665
Alrowais F, Alotaibi SS, Al-Wesabi FN, Negm N, Alabdan R, Marzouk R, Mehanna AS, Al Duhayyim M. Deep Transfer Learning Enabled Intelligent Object Detection for Crowd Density Analysis on Video Surveillance Systems. Applied Sciences. 2022; 12(13):6665. https://doi.org/10.3390/app12136665
Chicago/Turabian StyleAlrowais, Fadwa, Saud S. Alotaibi, Fahd N. Al-Wesabi, Noha Negm, Rana Alabdan, Radwa Marzouk, Amal S. Mehanna, and Mesfer Al Duhayyim. 2022. "Deep Transfer Learning Enabled Intelligent Object Detection for Crowd Density Analysis on Video Surveillance Systems" Applied Sciences 12, no. 13: 6665. https://doi.org/10.3390/app12136665
APA StyleAlrowais, F., Alotaibi, S. S., Al-Wesabi, F. N., Negm, N., Alabdan, R., Marzouk, R., Mehanna, A. S., & Al Duhayyim, M. (2022). Deep Transfer Learning Enabled Intelligent Object Detection for Crowd Density Analysis on Video Surveillance Systems. Applied Sciences, 12(13), 6665. https://doi.org/10.3390/app12136665