Article

Surface Defect Detection Model for Aero-Engine Components Based on Improved YOLOv5

Fundamentals Department, Air Force Engineering University, Xi’an 710051, China
*
Author to whom correspondence should be addressed.
Appl. Sci. 2022, 12(14), 7235; https://doi.org/10.3390/app12147235
Submission received: 23 June 2022 / Revised: 13 July 2022 / Accepted: 15 July 2022 / Published: 18 July 2022
(This article belongs to the Special Issue Deep Learning in Object Detection and Tracking)

Abstract

:
Aiming at the problems of low efficiency and poor accuracy in conventional surface defect detection methods for aero-engine components, a surface defect detection model based on an improved YOLOv5 object detection algorithm is proposed in this paper. First, a k-means clustering algorithm was used to recalculate the parameters of the preset anchors to make them match the samples better. Then, an ECA-Net attention mechanism was added at the end of the backbone network to make the model pay more attention to feature extraction from defect areas. Finally, the PANet structure of the neck network was improved through its replacement with BiFPN modules to fully integrate the features of all scales. The results showed that the mAP of the YOLOv5s-KEB model was 98.3%, which was 1.0% higher than the original YOLOv5s model, and the average inference time for a single image was 2.6 ms, which was 10.3% lower than the original model. Moreover, compared with the Faster R-CNN, YOLOv3, YOLOv4 and YOLOv4-tiny object detection algorithms, the YOLOv5s-KEB model has the highest accuracy and the smallest size, which make it very efficient and convenient for practical applications.

1. Introduction

As the core of aircraft, aero engines work in harsh environments involving high temperature, high pressure and high load over long periods of time, their components are subjected to aerodynamic force from flowing gas and they are impacted by foreign objects. Cracks, gaps, burns, pits and other damage thus occur frequently [1]. The consequences of such defects can be fatal and the financial costs very high. Therefore, it is very important to detect defective aero-engine components in time and ensure the flight safety of aircraft. Defect detection is a necessary task for the extension of the service lives of these parts, as replacing them is far more expensive [2].
At present, the methods for surface defect detection of aero-engine components generally include the borescope inspection, magnetic powder, ray, penetration, eddy current and ultrasonic methods. These methods have achieved good performances for detection of aero-engine components, but many defects are too small to detect with these methods, and detection work mainly relies on experienced inspectors, who perform intensive work and can easily miss tiny defects [3]. There is thus an urgent need for computer vision detection methods that can replace manual methods.
In recent years, with the development of deep learning, computer vision technology has been applied in many fields, such as face recognition, object detection and automatic driving. Object detection algorithms based on computer vision are generally divided into two categories: two-stage and one-stage algorithms. Two-stage algorithms are based on the candidate regions and include R-CNN [4], Fast R-CNN [5] and Faster R-CNN [6]. One-stage algorithms can directly obtain the position and category probability of the object, and they include YOLO [7] and SSD [8]. Recent research has shown that the Vision Transformer model (ViT) can achieve comparable or even superior performance in image classification tasks, as it uses self-attention rather than convolution to aggregate information across locations [9]. Andriyanov et al. used random fields and likelihood ratios to analyze the development of convolutional neural networks intended for use in solving recognition problems, as well as metrics designed to assess the quality and reliability of object detection [10]. Anitha et al. provided a complete view of unsupervised anomaly detection for high dimensional data and proposed a hybrid framework to produce an unsupervised anomaly detection algorithm [11]. Alexey et al. showed that reliance on CNNs is unnecessary and proved that a pure transformer directly applied to sequences of image patches can perform very well in image classification tasks, attaining excellent results compared to the most advanced CNNs, while the ViT model required substantially fewer computational resources to train [12].
Many scholars have been working to combine object detection algorithms with practical application scenarios and have achieved significant results. Kou et al. designed an anchor-free feature selection mechanism and a dense convolution structure and introduced them into the YOLOv3 network to improve the detection speed and accuracy of the algorithm in detecting steel strip surface defects [13]. Andriyanov et al. proposed an intelligent system for the estimation of the spatial positions of apples based on YOLOv3 and a D415 RealSense Depth Camera, which obtained the position estimates of the apples with high accuracy in a symmetric coordinate system [14]. Tulbure et al. undertook a comprehensive analysis of modern object detection models that can be used for defect detection applications in industry and analyzed the applicable detection models under different leading constraints, providing an important reference for industrial defect detection [15]. Aiming at the problems of complex architecture and low detection accuracy in traditional aero-engine sensor fault detection algorithms, Du et al. proposed an Inception-CNN model and used it for aero-engine sensor fault detection, achieving 95.41% detection accuracy with the sensor failure dataset [16].
However, applications of object detection algorithms for surface defect detection of aero-engine components are limited, and the recognition efficiency and accuracy need to be improved. In order to improve the accuracy and speed of surface defect detection of aero-engine components, a defect detection model based on an improved YOLOv5 algorithm is proposed in this paper. First, a k-means algorithm was used to cluster the real labeling boxes of the experimental dataset, optimize the size of the preset anchors and increase the matching degree between the anchors and the real samples. Next, an ECA-Net mechanism was added at the end of the backbone network to enhance the feature expression ability. Then, the PANet structure of the neck network was replaced with BiFPN modules to improve the feature fusion ability of the model. The experimental results showed that the model had a high detection accuracy and small size, making it easy to deploy in mobile terminals, and could better complete surface defect detection tasks for aero-engine components.

2. Methods and Principles

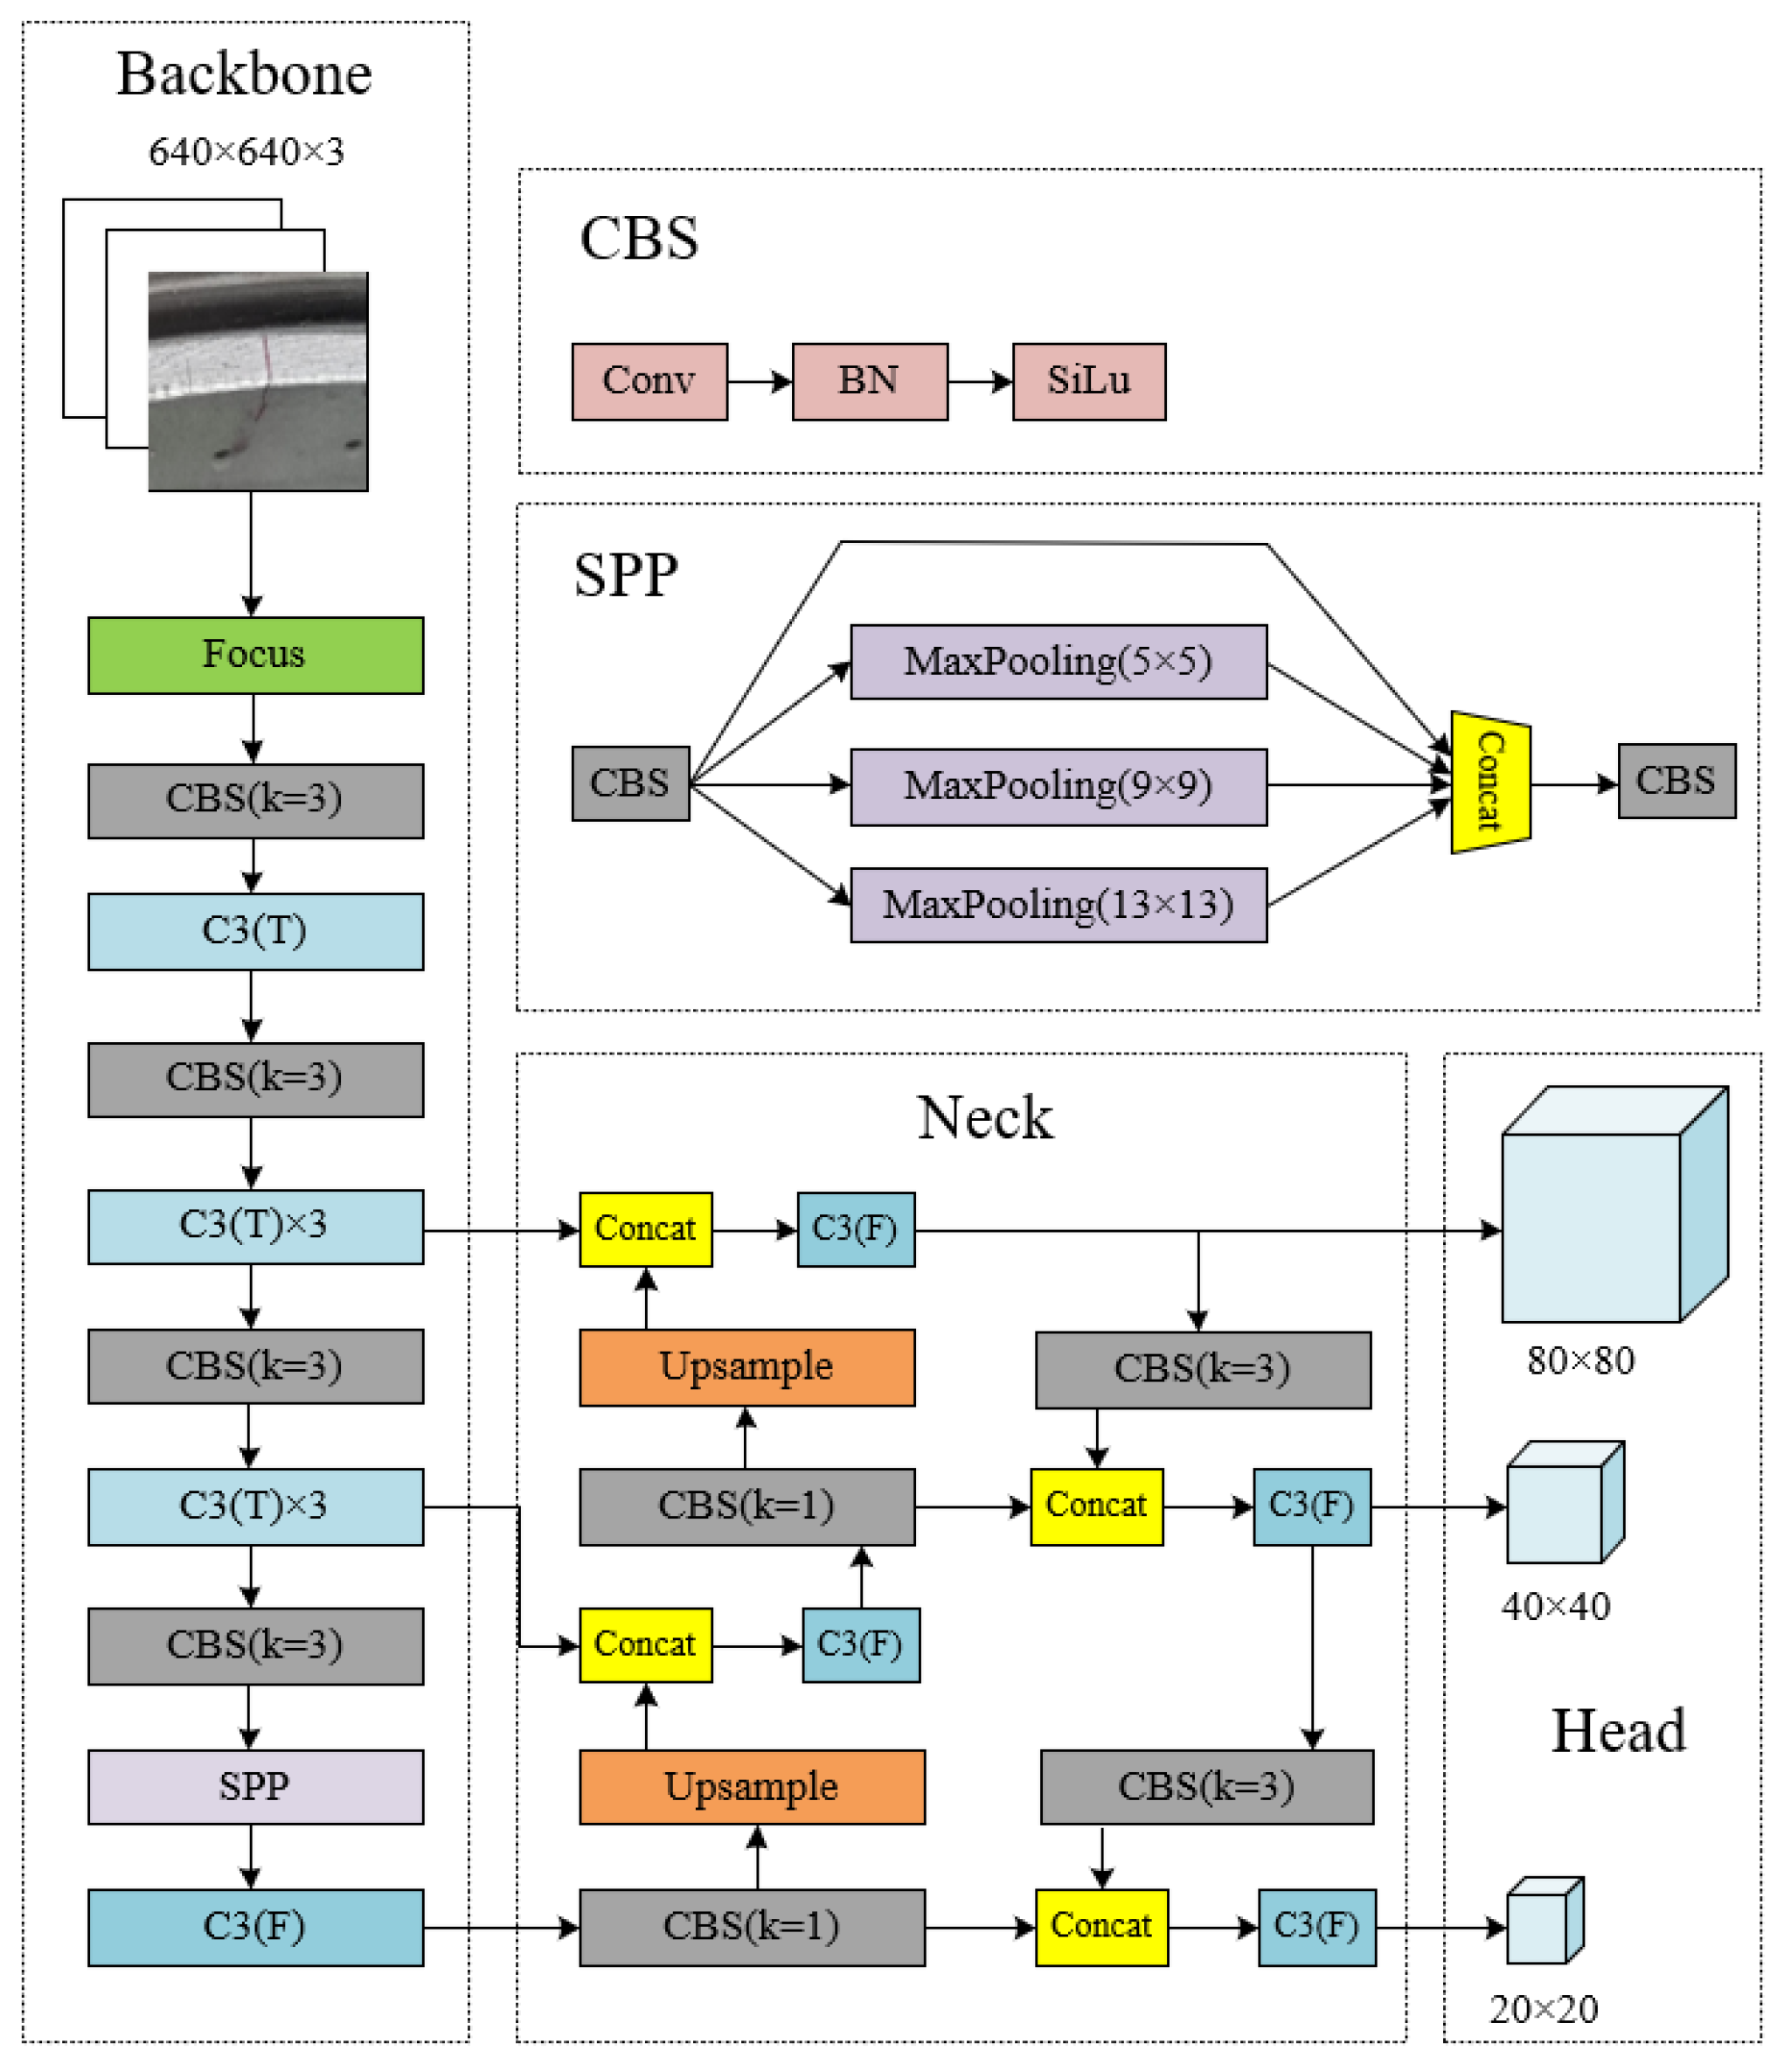
2.1. YOLOv5 Algorithm

The YOLO algorithm is a one-stage object detection algorithm characterized by the direct regression of the location and category of an object after feature extraction. It has the advantages of fast inference speed and high detection accuracy. The author of the YOLO algorithm then proposed the YOLOv2 [17] and YOLOv3 [18] models successively, and their performance showed continuous improvements. In 2020, Alexey Bochkovskiy proposed the YOLOv4 algorithm [19], which modified the backbone network to CSPDarknet53, replaced the activation function with Mish and added a PANet [20] structure based on the FPN [21] from YOLOv3. The YOLOv5 model [22] has been improved on the basis of YOLOv4, with the detection speed being significantly improved and the model size greatly reduced, and it is more suitable for engineering applications.
The YOLOv5 algorithm has four models: YOLOv5s, YOLOv5m, YOLOv5l and YOLOv5x. The depth and width of these models increase in turn, and the feature extraction ability also gradually improves. Considering that our algorithm was intended to be deployed and applied in mobile terminals in the future, we selected the lightest YOLOv5s network as the research object, improved it on the basis of our needs and established a model for detection of surface defects in aero-engine components.
YOLOv5 is mainly composed of three parts: the backbone, neck and head. The backbone consists of a series of convolutional neural networks used to extract image features, mainly focus, C3 and SPP modules. The focus module slices the images and splices them into the channel dimension to integrate the width and height information into the channel dimension, which can effectively improve the speed of feature extraction. The C3 module is improved from the structure of the cross-stage partial (CSP) connections [23], having one less convolution layer and changing the activation function, and its main function is to extract features from images and reduce the repetition of gradient information. The spatial pyramid pooling (SPP) module respectively uses three pooling kernels of sizes 5, 9 and 13 to perform max-pooling operations on the images. This module can increase the receptive field of the network and obtain features of different scales. The neck is the feature fusion network of the model, where feature pyramid networks (FPNs) and path aggregation network (PANet) are adopted. The structure of the FPNs transmits semantic information from the top down, while the PANet additionally transmits location information from the bottom up on the basis of the FPNs. The head is the prediction network of the model and, through convolution operations, three groups of feature vectors containing the categories prediction boxes, confidence and coordinate position are output, which predict at scales of 80 × 80, 40 × 40 and 20 × 20, respectively.
The architecture of YOLOv5s is shown in Figure 1, where k represents the convolution kernel size, C3(T) represents the C3 module containing a residual structure, C3(F) does not contain a residual structure, Upsample is the upsampling operation and CBS is the standard convolution process consisting of Conv (the convolution layer), BN (batch normalization) and SiLu (activation function).
A loss function is used to measure the extent to which the predicted value of the model is different from the true value and largely determines the performance of the model. The loss functions of YOLOv5 include positioning loss (box_loss), confidence loss (obj_loss) and classification loss (cls_loss). Box_loss calculates the error between the prediction box and the real labeling box using the GIoU_loss function. Its principle is shown in Equation (1): for two arbitrary convex shapes A and B, find the smallest convex shape C enclosing both A and B, then:
G I o U _ l o s s = 1 I o U + C ( A B ) C .
Obj_loss and cls_loss reflect the confidence and classification error of the prediction box, respectively, and both use the cross-entropy loss function, as shown in Equation (2), where x is the sample, y is the label value, y ^ is the predicting value of the model and n is the total number of samples:
l ( y , y ^ ) = 1 n x [ y ln y ^ + ( 1 y ) ln ( 1 y ^ ) ] .

2.2. YOLOv5 Improvement

2.2.1. K-Means Clustering Algorithm

A certain number of anchors are set in the YOLOv5 algorithm so that the model does not need to directly predict the scale and coordinates of the object but only needs to predict the offset between anchors and the label boxes, and then adjust anchors according to the offset, reducing the difficulty of prediction. The parameters of these preset anchors are obtained based on the public dataset COCO, which contains a total of 80 categories of objects that are quite different from the sizes of the defects in our dataset. If the preset anchors are directly used for training, the convergence speed of the model will be affected and the detection accuracy will reduce. Therefore, a k-means clustering algorithm is used in this paper to recalculate the parameters of anchors.
The idea behind the k-means clustering algorithm is to randomly select k clustering centers at the beginning of the process, distribute the samples to be classified to each cluster center according to the principle of the nearest neighbor and then recalculate the mean value of each group of objects to obtain a new cluster center. The above process is iterated until the optimal cluster center is found. The algorithm was used to perform cluster analysis for the real annotation frames in the dataset in this study, and three groups of parameters for new anchors were obtained, as shown in Table 1 in comparison with the preset anchors. There are three groups of preset anchors in YOLOv5, and each group contains three anchors of different dimensions and shapes. As shown in Figure 1, Anchor1 is used to detect small targets in an 80 × 80 feature map, Anchor2 is used to detect medium-sized targets in a 40 × 40 feature map and Anchor3 is used to detect large targets in a 20 × 20 feature map; for example, (10, 13) in Anchor1 means that the width and height of one anchor are 10 and 13, respectively.

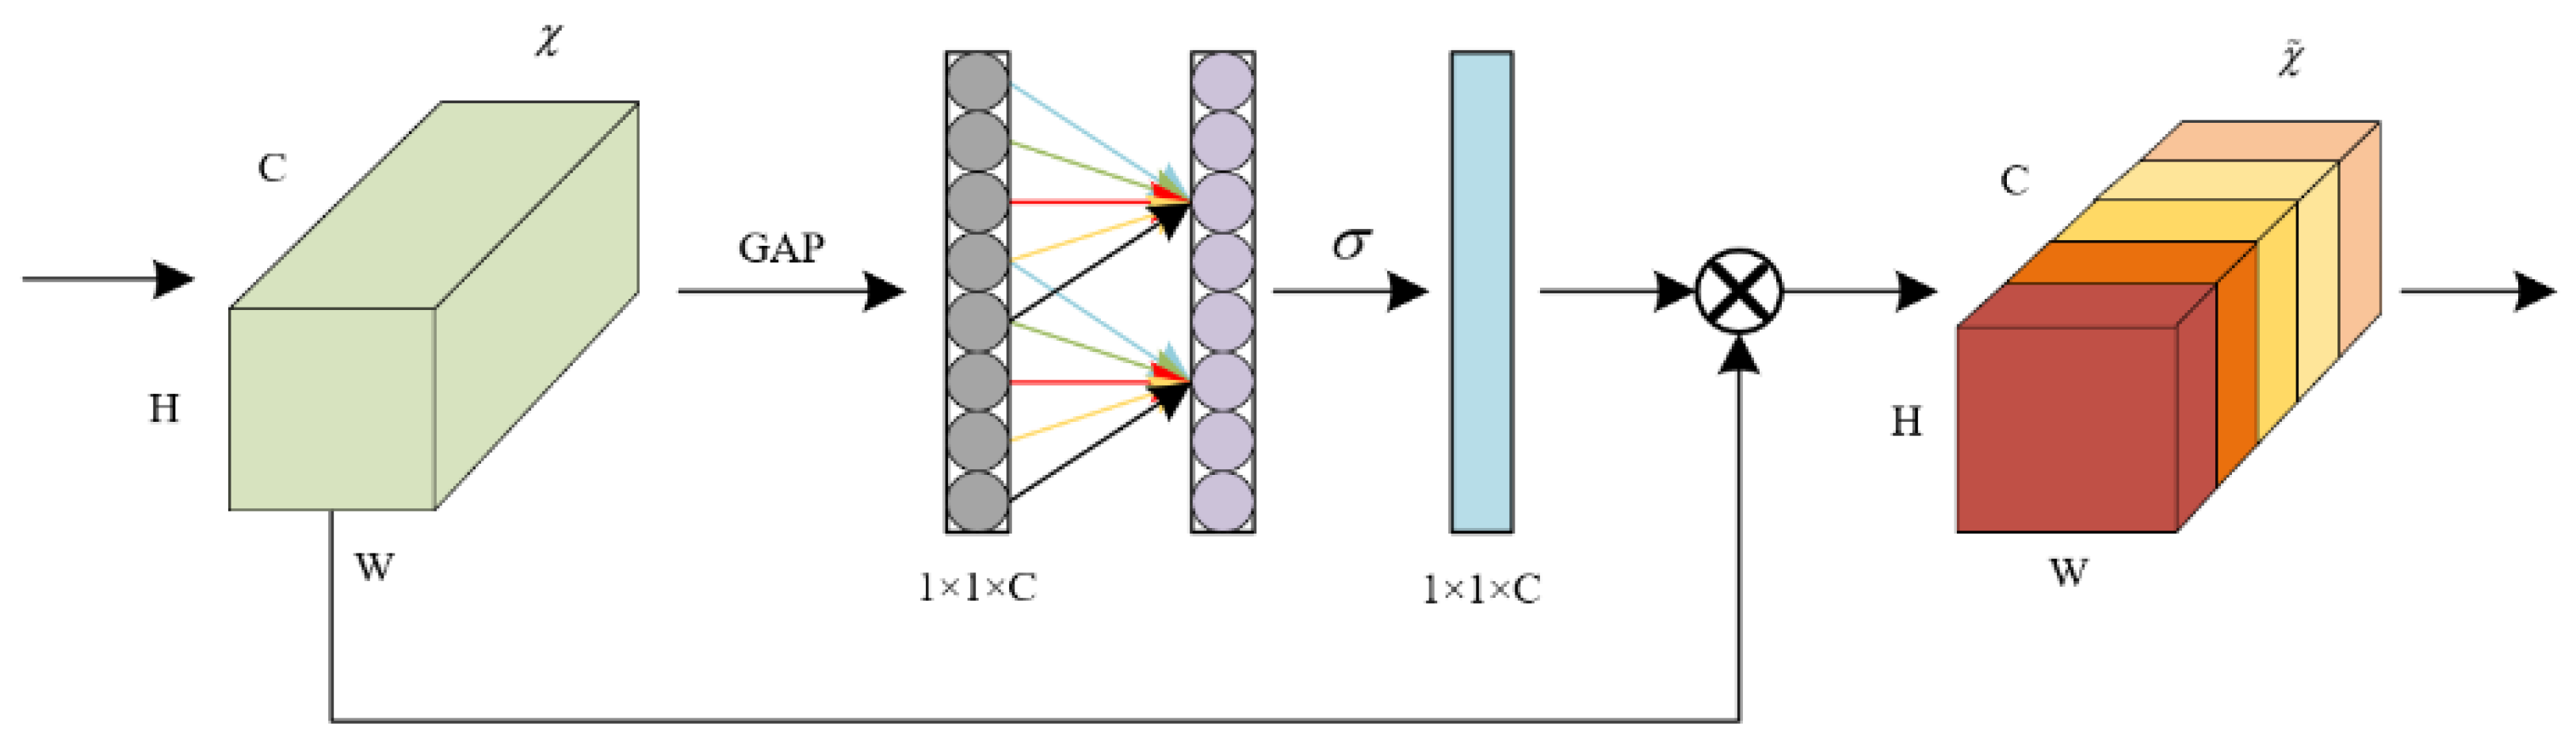
2.2.2. ECA-Net Mechanism
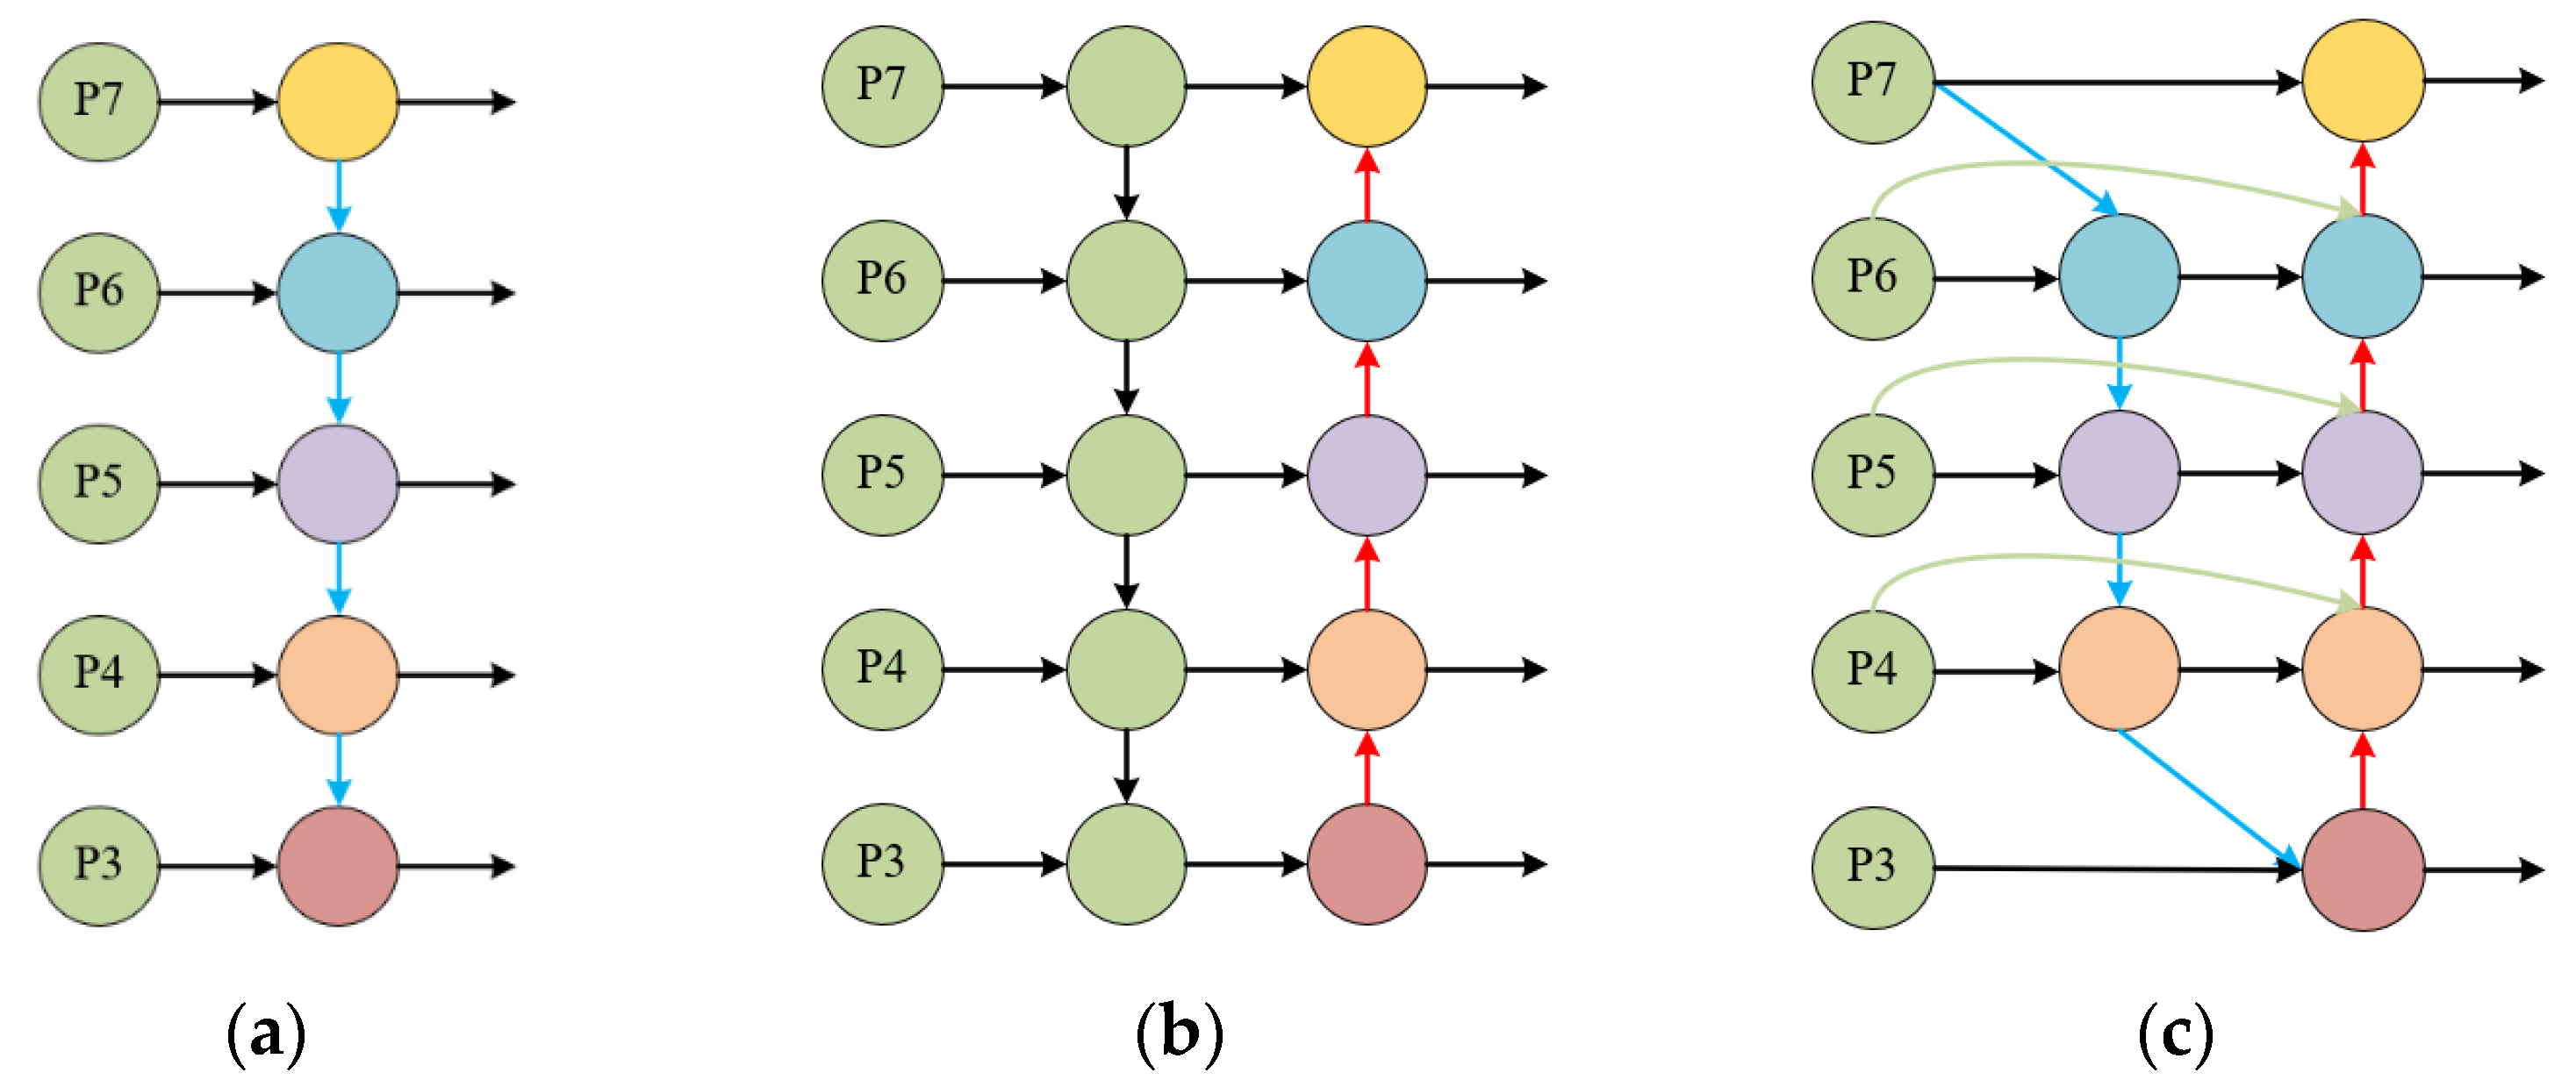
In order to improve the defect detection accuracy of the YOLOv5 algorithm in complex scenes, make the model focus on the object areas during training and suppress the expression of unimportant information, we introduced an ECA-Net mechanism [24] into the YOLOv5 model. ECA-Net is a type of lightweight attention module that has been improved on the basis of SENet [25]. It avoids dimensionality reduction and captures cross-channel interaction in an efficient way. The principle of the ECA-Net module is shown in Figure 2.
We have the input feature map χ R W × H × C and output feature map χ ˜ R W × H × C from the ECA module, as shown in Equation (3):
χ ˜ = σ ( g ( χ ) f ) χ ,
where g ( χ ) is a global average pooling operation; f is a 1D convolution operation with 3 × 3 kernel size, which is then activated by the sigmoid function σ (); and represents element by element multiplication with the original input features.
When the feature maps are input into the ECA-Net module, the global average pooling of the feature maps is carried out channel by channel without dimensionality reduction, local cross-channel interaction is captured by paying attention to each channel and its k neighbors and then the weight of each channel is generated with the sigmoid function. This method has been proven to guarantee both efficiency and effectiveness. Finally, the original input features are combined with channel weights to obtain features with channel attention. The ECA-Net mechanism has fewer parameters, which can learn effective channel attention with low model complexity, and does not influence the detection speed of the algorithm to a large extent [26].

2.2.3. BiFPN Module

The BiFPN module is derived from the Google team’s 2019 EfficientDet network [27]. It strengthens higher-level feature fusion in the processing path, processing each bidirectional path (top-down and bottom-up) as a feature network layer, through the fusion of weighted features. The importance of different input features is learned, and differentiated fusion is carried out for different features [28]. Figure 3a,b show the FPN and PANet feature fusion structures used in the original YOLOv5 network. FPN carries out multi-scale feature fusion in a top-down manner, and PANet adds a bottom-up path on the basis of FPN. Figure 3c shows the BiFPN module, which is the feature fusion part of the EfficientDet network. It receives five effective feature layers P3–P7 from the backbone feature extraction network, carries out upsampling and downsampling feature fusion for these feature layers successively and sets weights for each node to balance features of different scales. In the figure, the blue route conveys high-level semantic information from the top down, while the red route conveys low-level location information from the bottom up.
FPN typically uses the same weight when fusing features of different scales, but these features contribute differently to the final output, so BiFPN adds additional weight to each input feature and lets the network know how important each feature is. The fast normalized fusion weighted fusion method is adopted, as shown in Equation (4):
O = i w i ϵ + j w j I i ,
The Relu activation function is used for each weight to ensure that w i 0 , and ϵ = 0.0001 is a small quantity used to keep the value stable. The process of cross-scale connection and weighted feature fusion in BiFPN is shown in Equations (5) and (6):
P 6 t d = C o n v ( w 1 P 6 i n + w 2 R e s i z e ( P 7 i n ) w 1 + w 2 + ϵ ) ,
P 6 o u t = C o n v ( w 1 P 6 i n + w 2 P 6 t d + w 3 R e s i z e ( P 5 o u t ) w 1 + w 2 + w 3 + ϵ ) ,
where P t d is the middle layer of the top-down feature fusion process; P i n and P o u t are the bottom-up input and output features, respectively; and Conv represents the convolution process.

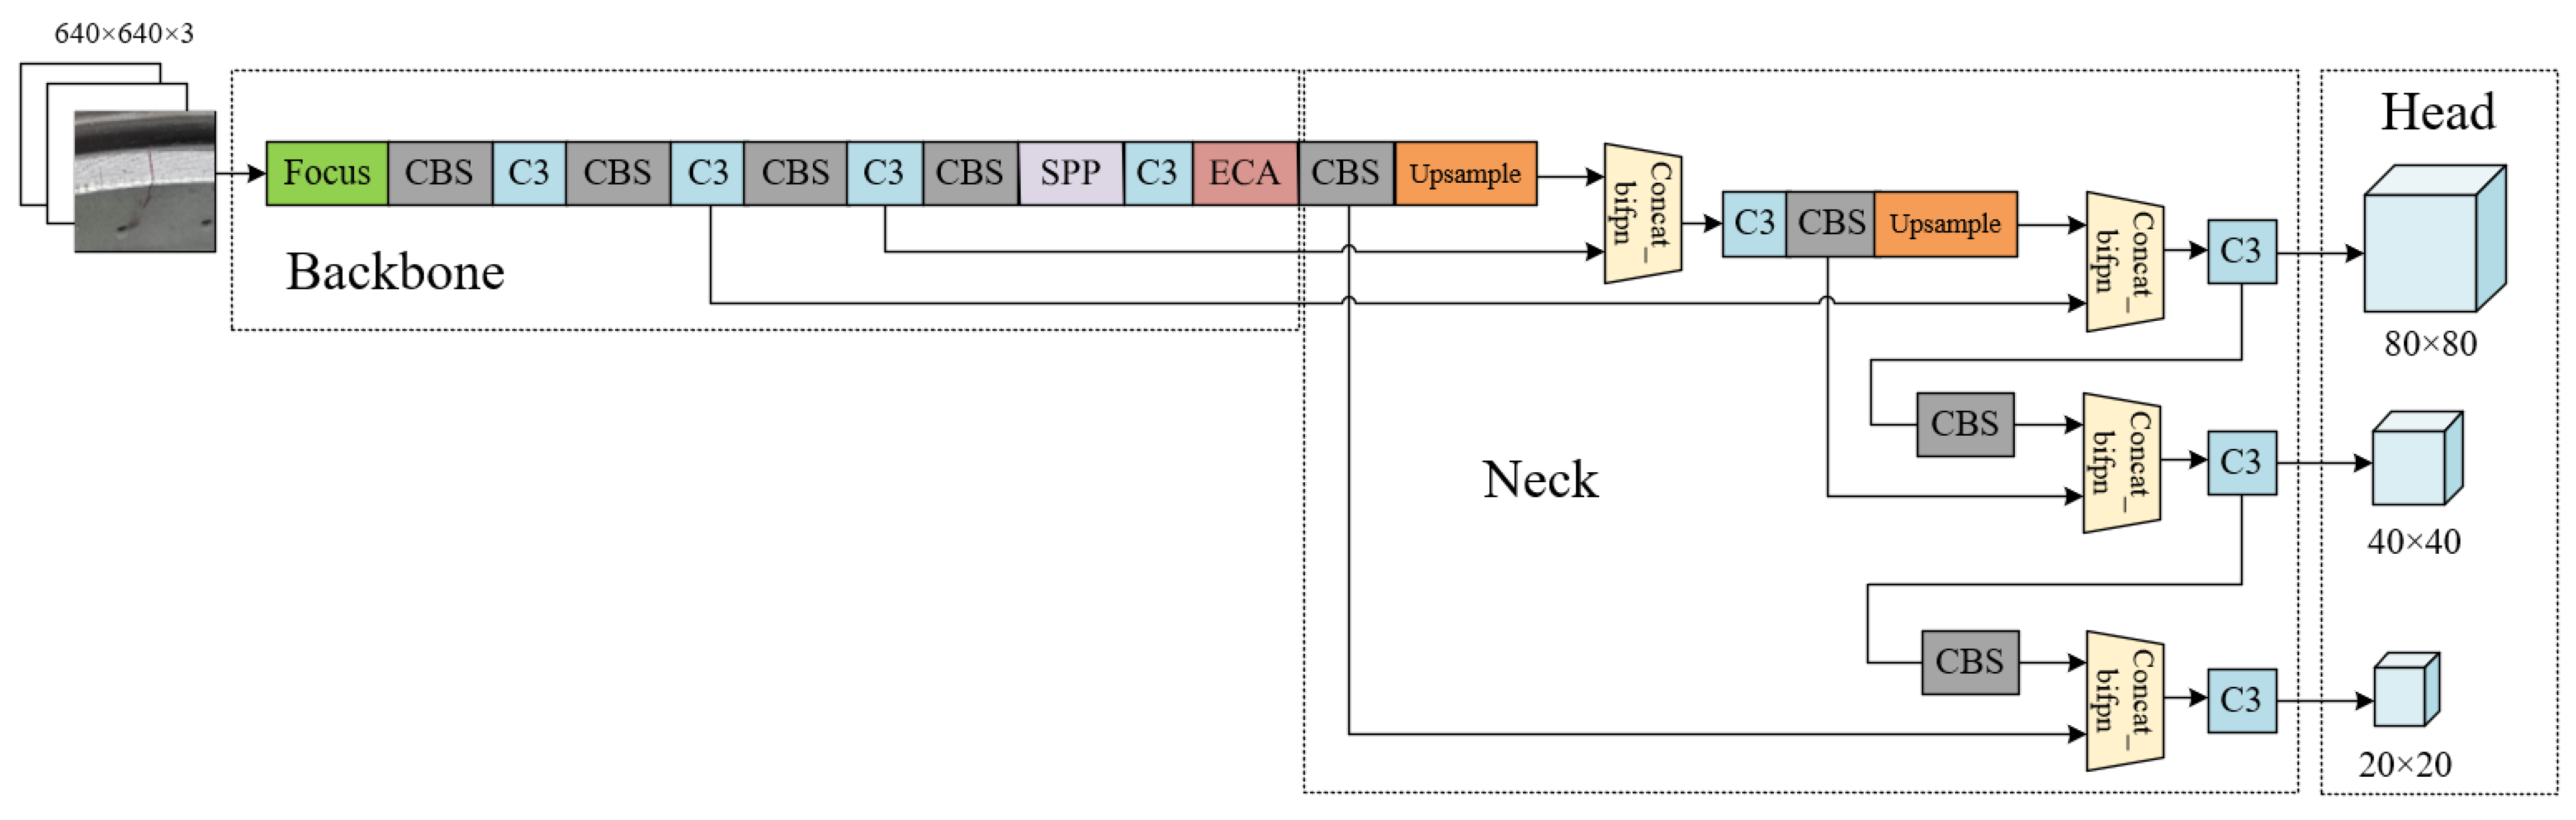
2.3. Improved YOLOv5

In this study, three groups of new anchors obtained with the k-means clustering algorithm were used to replace the preset anchors of the YOLOv5 model so as to increase the matching degree between the anchors and the real object frames. The ECA-Net mechanism was added at the end of backbone network to make the network interact efficiently across channels and pay more attention to feature extraction from defect areas. The PANet structure of the neck fusion network was improved by replacing it with a BiFPN module to fully integrate the features of various scales and improve the detection accuracy. The network structure of the improved YOLOv5s-KEB model is shown in Figure 4, where Concat_bifpn represents the BiFPN model.

3. Experiment and Results

3.1. Experimental Environment
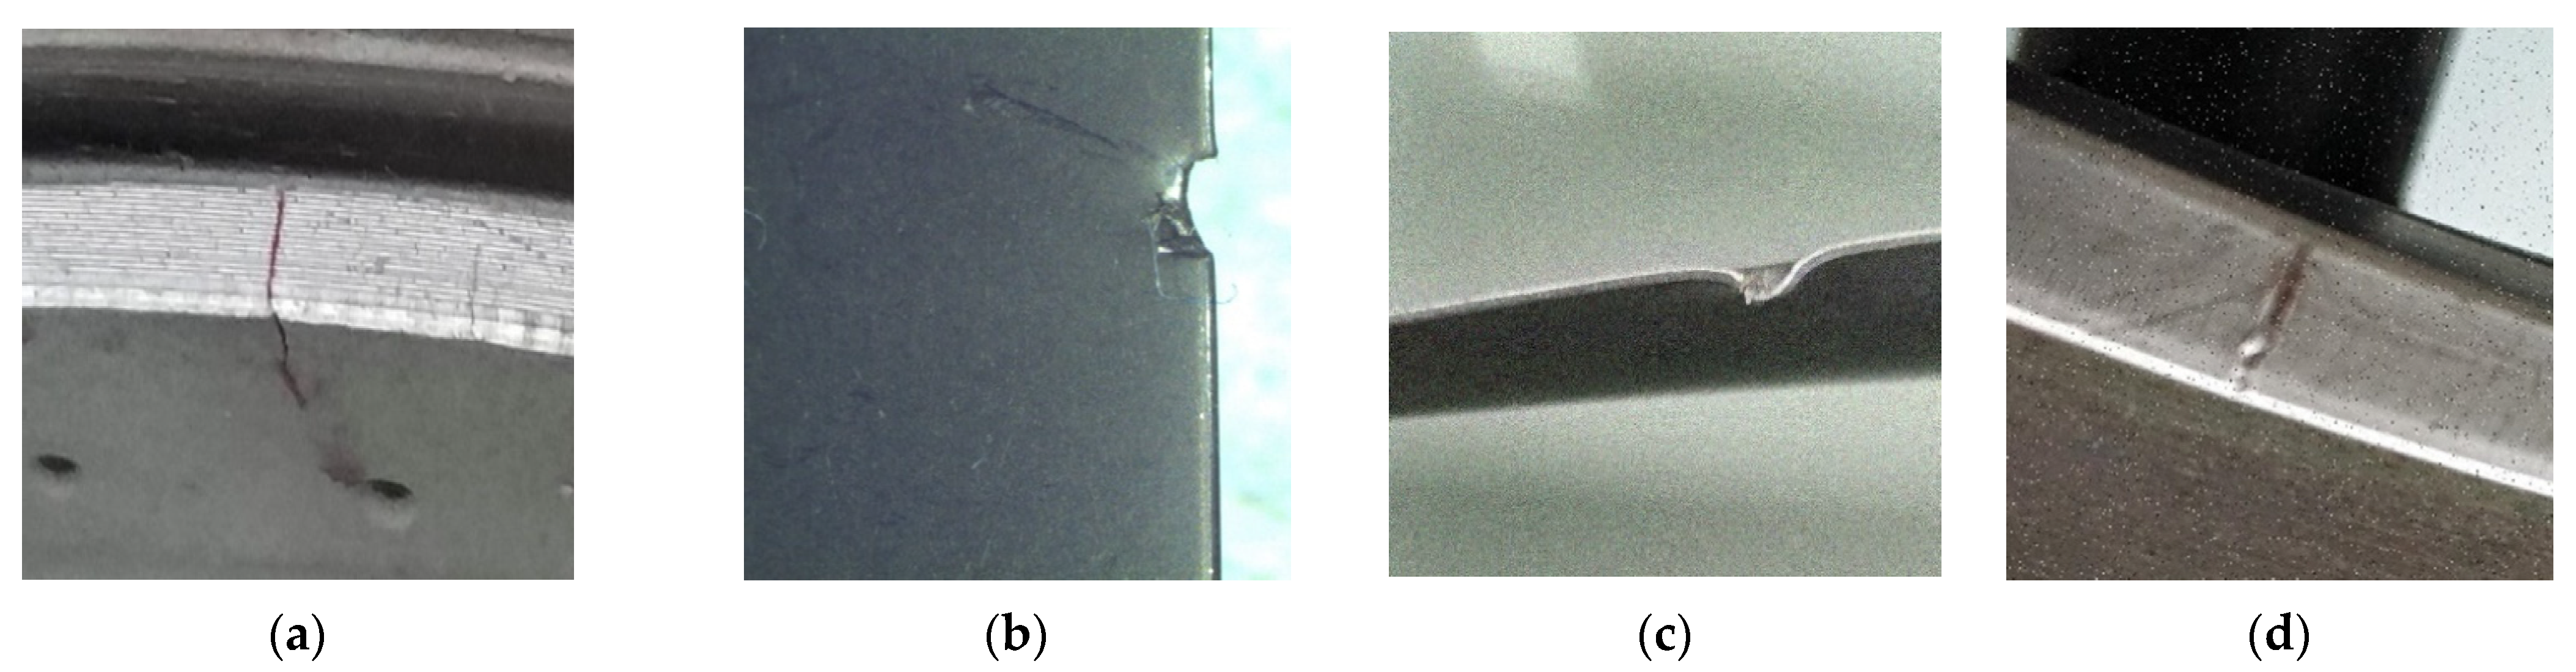
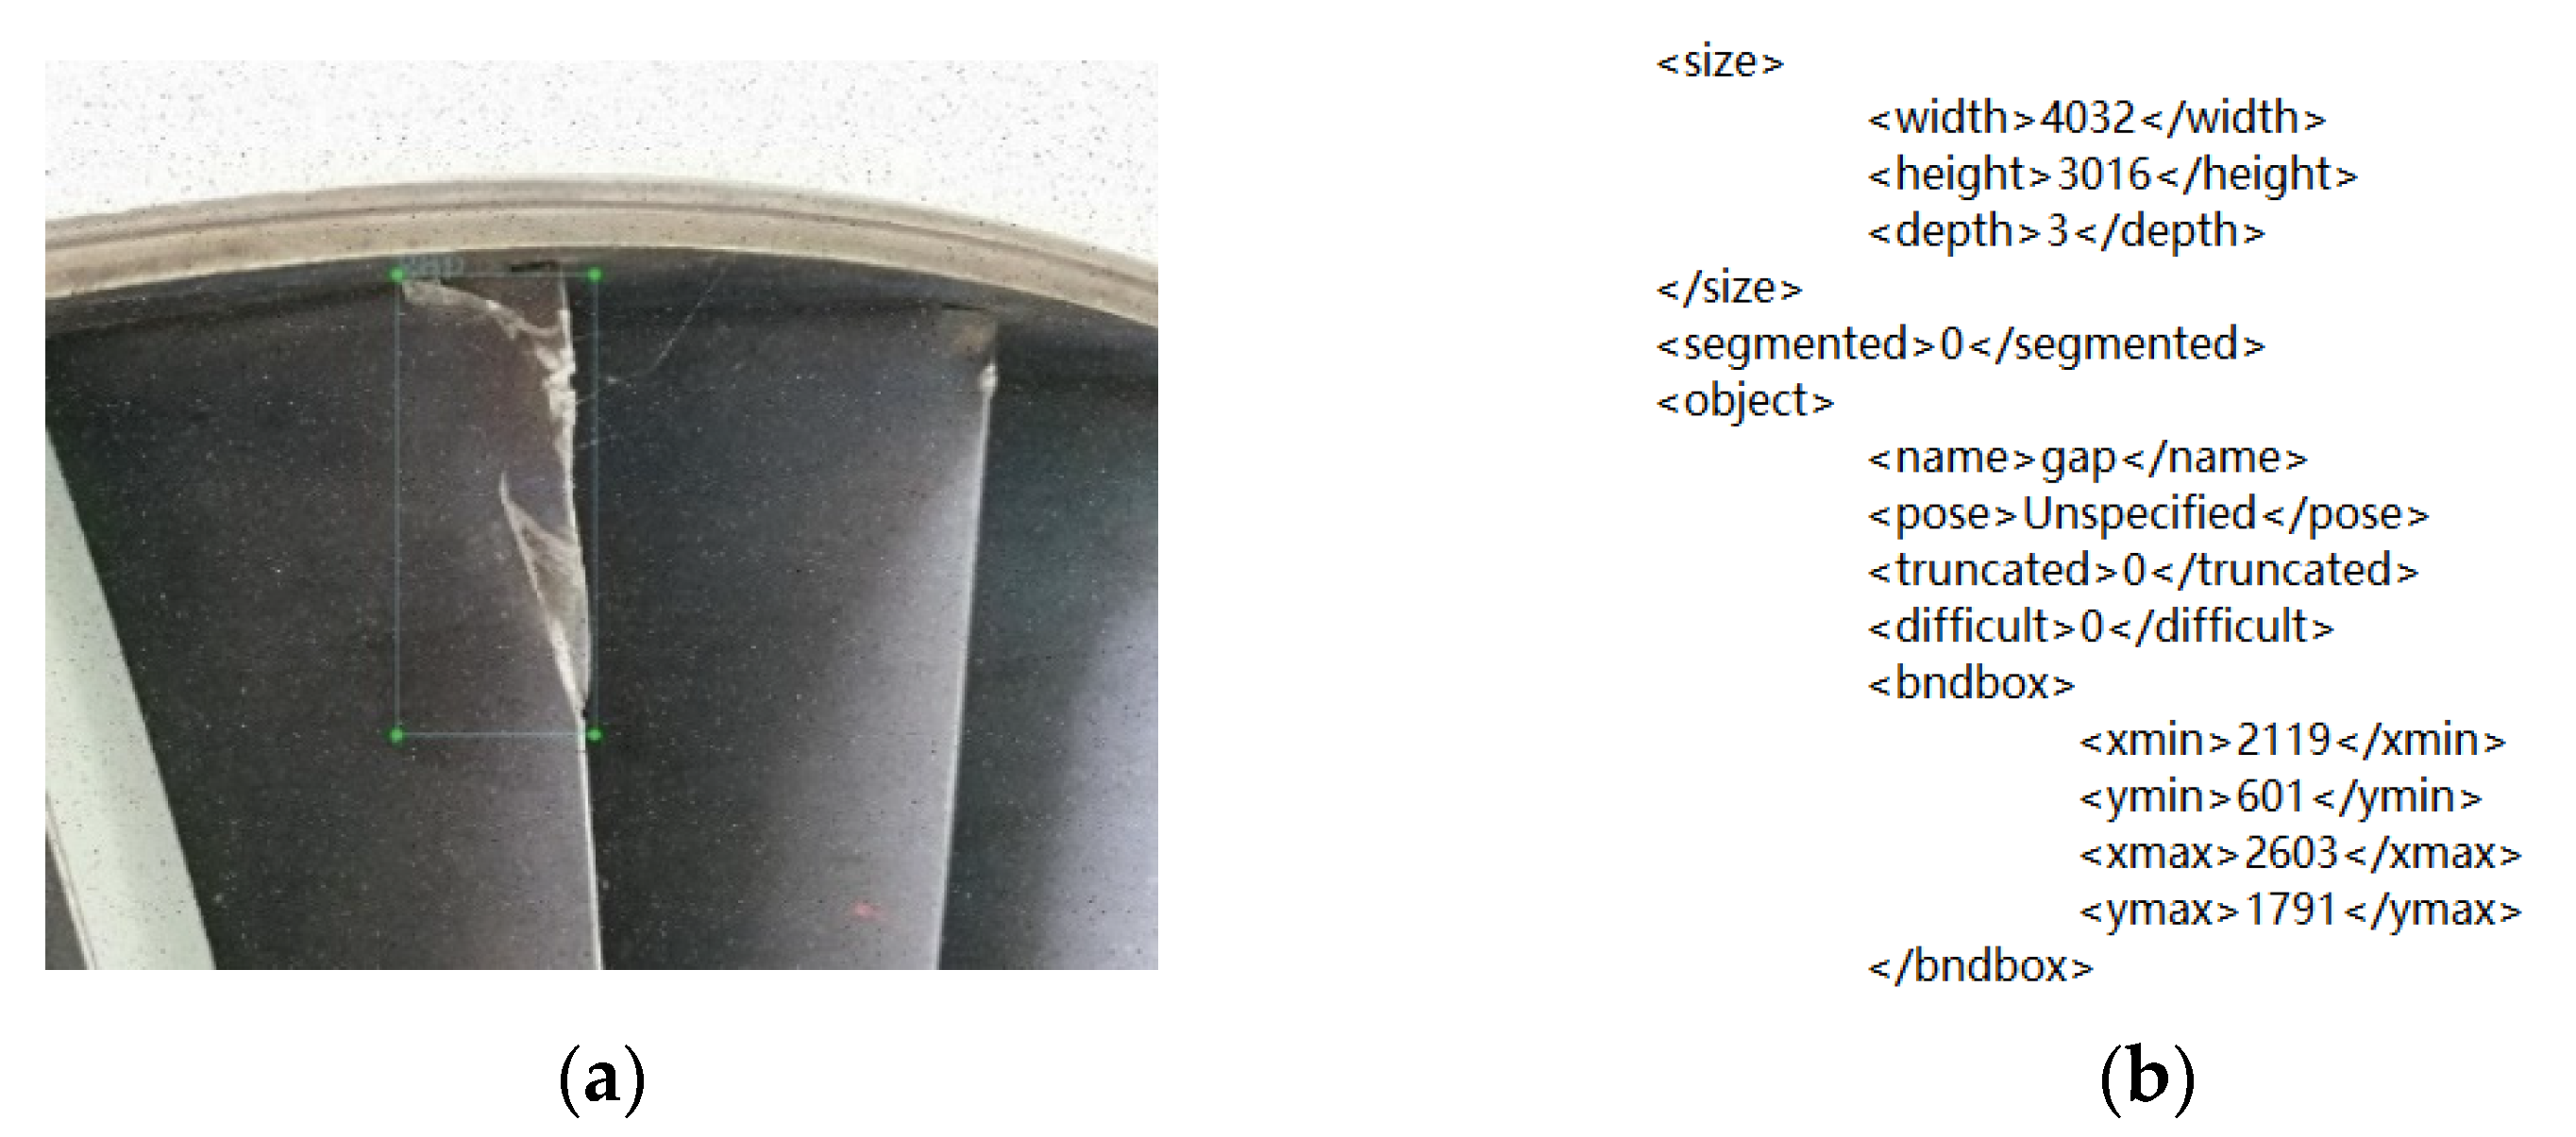
The experimental environment for this study was based on a Windows 10 operating system with 128 GB RAM, PyTorch (version 1.9.1, Soumith Chintala, New York, NY, USA) as the deep learning framework, Python (version 3.7, Guido van Rossum, Delaware, OH, USA), CUDA 10.0 and cuDNN 7.4.1. The hardware configuration was as follows: Intel(R) Xeon(R) Gold 5218 [email protected] GHz, NVIDIA GeForce RTX 2080Ti, 11 GB video memory.

3.2. Dataset

The data used in this paper were the defects on the surfaces of aero-engine components collected with an industrial camera in repair factories and garages, and these images were screened and sorted in the post-processing process. As shown in Figure 5, the data contained four defect types: crack, gap, pit and scratch. There were 1080 original images. In order to prevent over-fitting in the training process, we used data enhancement methods to expand the samples. First, independent target cropping was used to extract several small target defects in the images to strengthen feature recognition. Then, the images were horizontally flipped to enrich the defect features, and the exposure of the images was adjusted to expand the images under different exposure levels. Gaussian noise was also added to the images to enhance the robustness of the model. We obtained a total of 3500 original and enhanced images. The expanded samples were divided into a training set, validation set and test set according to the ratio 6:2:2. Finally, 2100 images for the training set, 700 for the validation set and 700 for the test set were obtained. The images in the dataset had different sizes during training in order to adapt to the structure of the network; YOLOv5 can resize input images to 640 × 640. Since the YOLOv5 algorithm uses adaptive image scaling, there were no image distortion problems. After the training, the images were automatically resized to the original size for display.
LabelImg labeling software was used to generate xml files containing the image path, labeling area and label type for the real frame of the defect labeling in the image, as shown in Figure 6. The “size” item recorded the width, height, size and number of channels of the original image, and the “object” item recorded the category of the annotation defects and the horizontal and vertical coordinates of the upper left and lower right corners of the annotation box. Finally, the xml annotation files were converted into txt files, as required by the YOLOv5 model, before training with the dataset.

3.3. Training Parameter Setting

The settings for the training hyperparameters are shown in Table 2. In the training process, mosaic data enhancement was enabled, and four images were randomly combined together through cropping, scaling and rotating, thus increasing the number of objects in a single image, which is conducive to improving the generalization ability of models. The SGD optimizer was used to update the parameters of the network iteratively. Batch size was set to 16, and 300 epochs were trained in total. lr0 is the initial learning rate, and lrf is the cyclic learning rate.

3.4. Evaluation Indicators

The generally used evaluation indicators for object detection include precision, recall, average precision (AP), mean average precision (mAP) and frames per second (FPS). FPS represents the number of images processed per second by the model; it reflects the detection speed. Precision refers to the probability that all positive samples detected by the model are actually positive samples, and recall refers to the probability that the model detects positive samples in actual positive samples. The precision and recall are respectively expressed by Equations (7) and (8):
P r e c i s i o n = T P T P + F P ,
R e c a l l = T P T P + F N ,
where TP (true positives) represents the number of positive samples correctly predicted by the model, FP (false positives) represents the number of positive samples incorrectly predicted by the model, and FN (false negatives) represents the number of negative samples incorrectly predicted by the model. By calculating the IoU of each detection box and real box, TP, FP and FN can be obtained according to the IoU threshold value. For example, if the IoU threshold is 0.5, the value of TP is the number of detected frames with IoU > 0.5, while the value of FP is the number of detected frames with IoU ≤ 0.5. Therefore, TP, FP and FN are directly related to the selection of the IoU threshold.
According to the above analysis, precision and recall are influenced by the IoU threshold; if the threshold rises from 0 to 1, there will be a series of precision and recall events. AP refers to the area enclosed by coordinate axes and the curve drawn with precision as the vertical axis and recall as the horizontal axis, and mAP can be obtained by means of the AP of all categories. AP and mAP are defined by Equations (9) and (10), where N represents the number of all categories, P is precision and R is recall.
A P = 0 1 P ( R ) d R ,
m A P = i = 1 N A P i N ,

3.5. Ablation Studies

We designed ablation studies to verify the optimization effect of each improved module: model A used the k-means clustering algorithm to recalculate the parameters of new anchors to match our dataset, and then replaced the initial anchor with them. We also disabled the autoanchor function of the YOLOv5 algorithm. In model B an ECA layer was added at the end of the backbone network. In model C the PANet structure of the neck network was improved by replacing it with BiFPN modules. YOLOv5s-KEB is the model proposed in this paper, which uses the improved methods from models A, B and C simultaneously. Comparisons of the parameters of each model and the results of the ablation studies are shown in Table 3 and Table 4, respectively, where the inference time refers to the average time required for the model to infer a single image, and FPS (detection speed) is calculated based on the total time taken by the model to recognize an image, consisting of the sum of the pre-process time, inference time and non-maximal suppression (NMS) time. Weight represents the volume of the model.
The results showed that, compared to the original YOLOv5s model, the inference time of model A was reduced by 20.7%, mAP was increased by 0.8% and FPS was improved by 4.5%, which indicates that the anchors regenerated by the k-means algorithm reduced the inference time and also improved the detection accuracy and speed of the model. For model B, the mAP increased by 0.3% compared to the original YOLOv5s model, thus verifying the effectiveness of introducing the attention mechanism, and hardly affected the model size and inference time. This indicates that the ECA mechanism improved the generalization ability and detection accuracy for some types of defects with only a few parameters added. The BiFPN module was used in model C, which increased in volume by 14.6% and resulted in a 3.4% reduction in detection speed. However, the mAP increased by 0.4%, indicating that the BiFPN module integrated the defect features of different scales more fully.
From the comparison of the YOLOv5s-KEB model proposed in this paper and the original YOLOv5s model, it can be seen that the volume increased by 14.6% and the detection speed was reduced by 3.1%, but the inference time was reduced by 10.3% and the mAP was improved by 1.0%. In particular, the detection accuracies for crack and scratch defects were respectively improved by 2.0% and 1.1%, which was a significant enhancement.

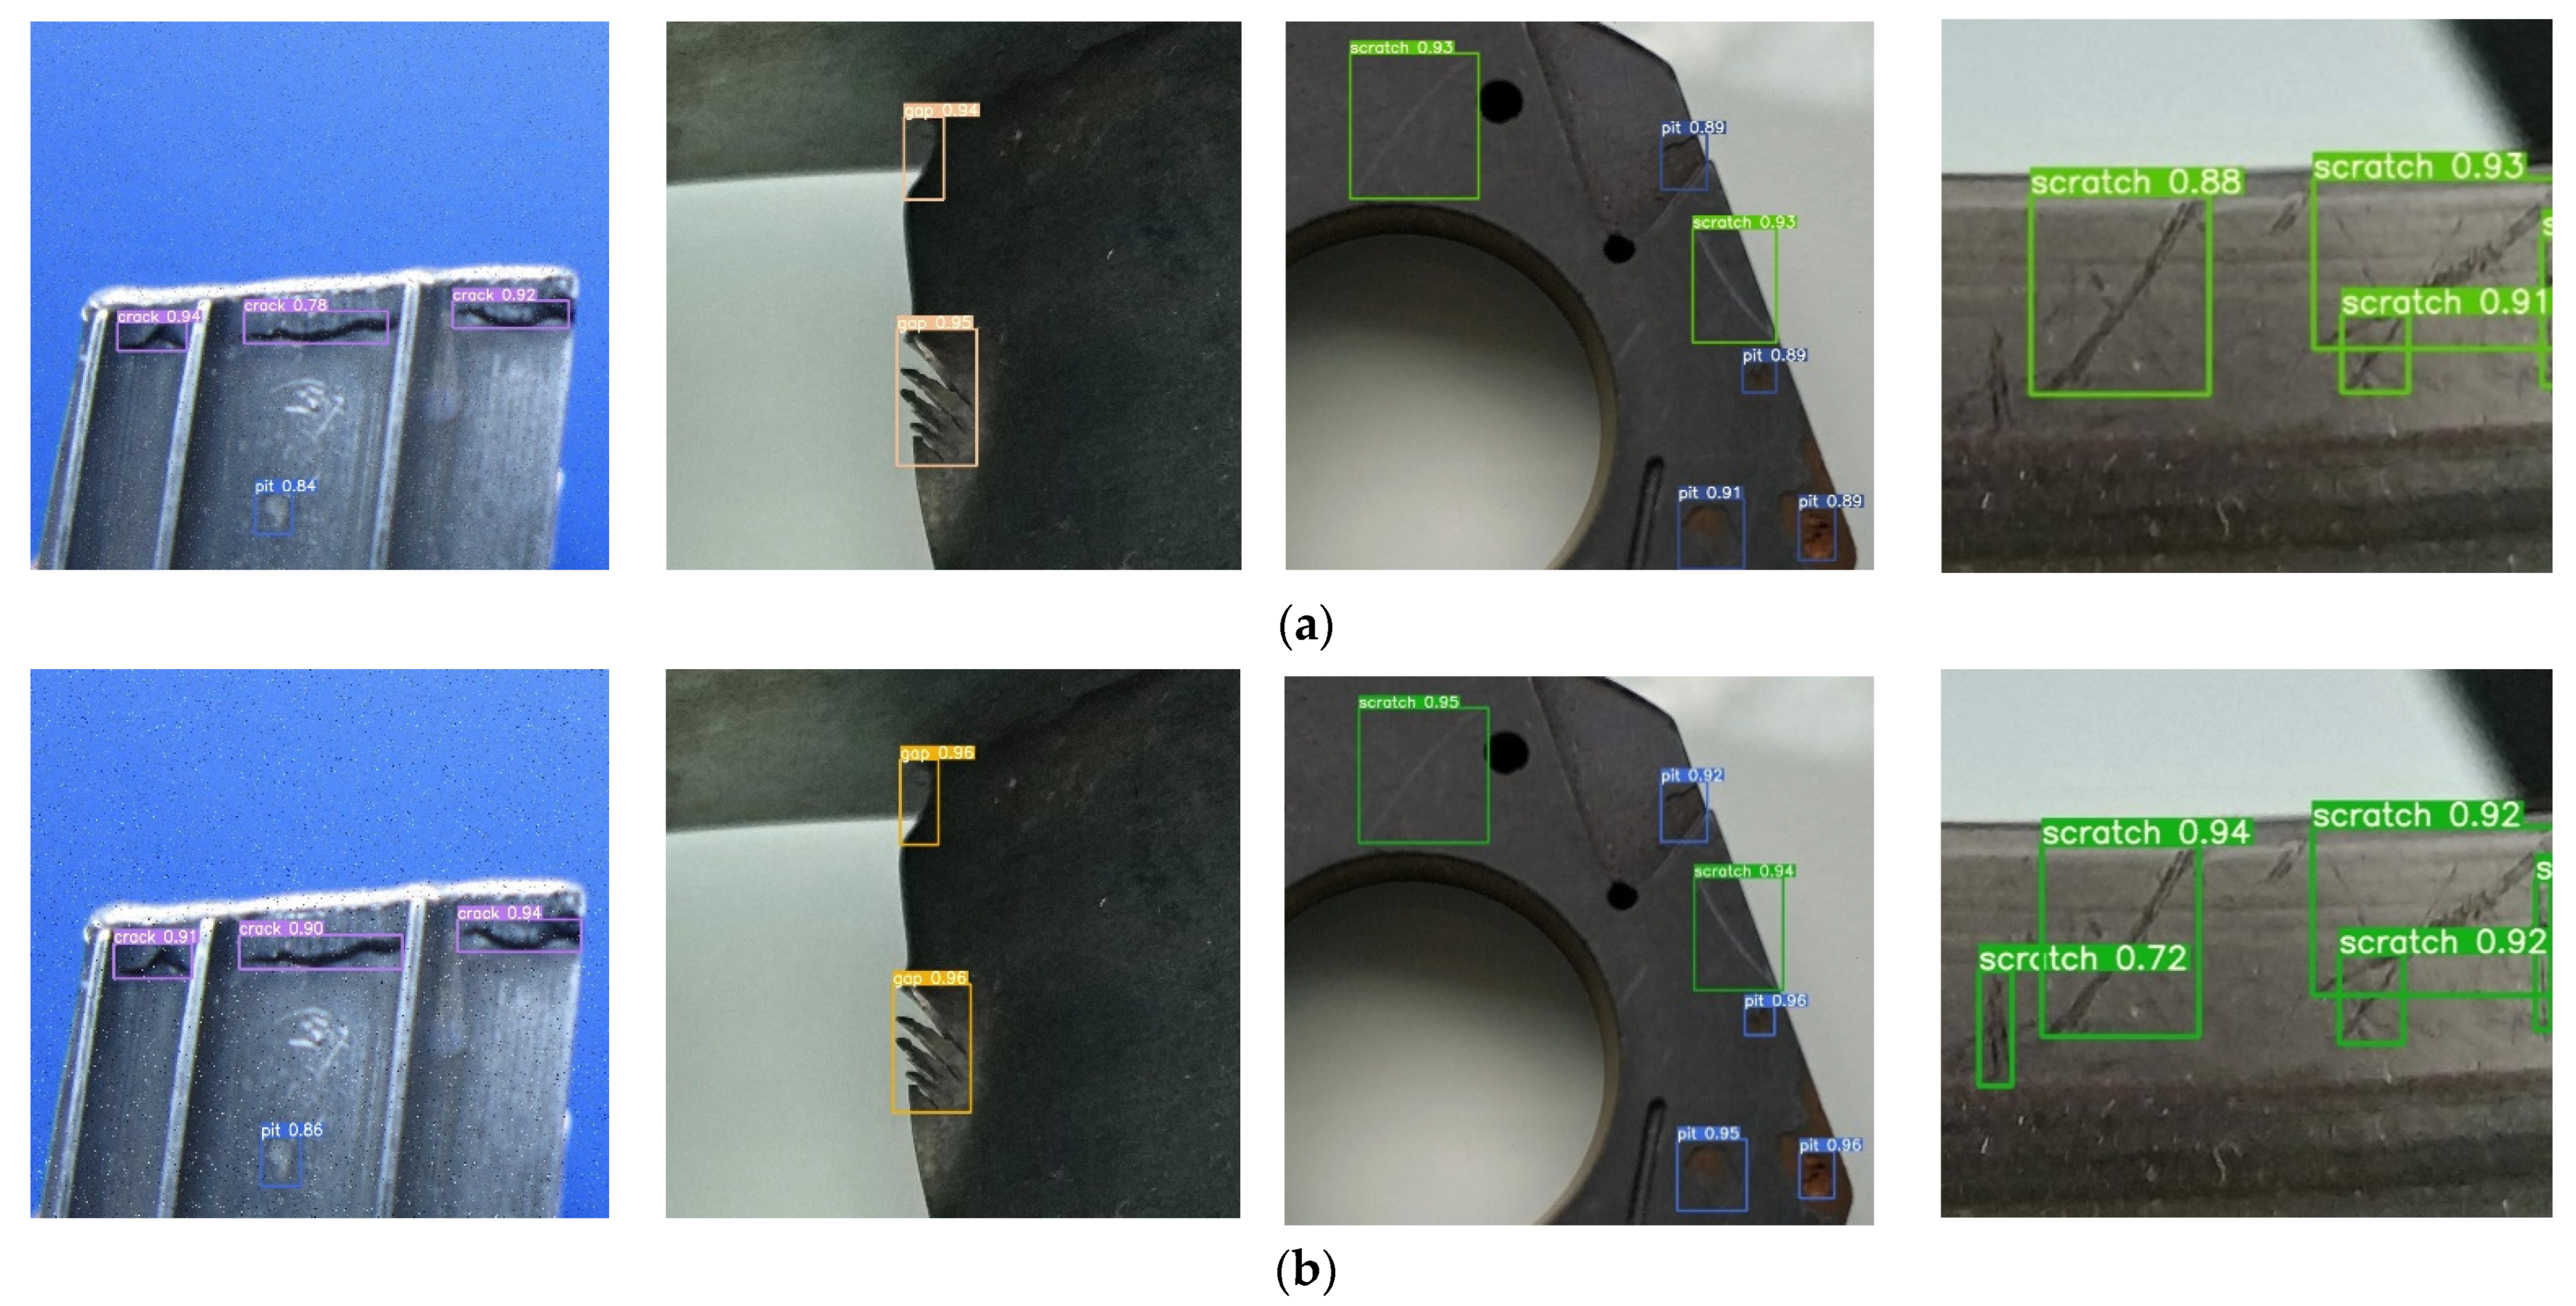
3.6. Comparison of Actual Detection Effects

In order to verify the actual detection effects of the YOLOv5s-KEB model, the original YOLOv5s model and the YOLOv5s-KEB model were respectively used to test real defect images. Some of the detection results are shown in Figure 7.
It can be seen from the comparison of the detection effects that the original YOLOv5s model had low confidence in crack and pit defect detection, and some scratch defects were missed or misdetected. Since the YOLOv5s-KEB model introduced an ECA attention mechanism, it focused on defect areas in the feature extraction process and enhanced the expression of defect features, so it improved the detection of scratch defects that were missing or misdetected by the former model. At the same time, the BiFPN module was used to improve the feature fusion aspect and fully integrate the features of different scales, thus improving the detection accuracy for crack and pit defects.

3.7. Comparison of Different Object Detection Algorithms

In order to comprehensively evaluate the performance of the YOLOv5s-KEB model, we selected the Faster R-CNN, YOLOv3, YOLOv4 and YOLOv4-tiny object detection algorithms for experiments. We used the same dataset to train and validate each algorithm and then determined the detection performance for different algorithms. The results are shown in Table 5.
As shown in Table 5, since Faster R-CNN is a two-stage object detection algorithm with poor real-time performance, its detection speed was the lowest. The detection speed of YOLOv4-tiny was the highest, up to 85.08 FPS, but the detection effect for small defects was poor, and the mAP was only 50.1%, which was far lower than other algorithms. The detection accuracies of YOLOv3 and YOLOv4 were high, but the detection speeds were low and the model sizes were quite large. Compared with other object detection algorithms, the YOLOv5s-KEB model had the highest defect detection accuracy and the smallest size. The mAP was 98.3% and the weight was 16.5 MB, both of which were far superior to other algorithms. Furthermore, it has a lightweight structure, which saves training time and makes it easy to deploy in mobile terminals.

4. Conclusions

Aiming at the problems of low efficiency and poor accuracy in surface defect detection in aero-engine components, we proposed the YOLOv5s-KEB model based on the YOLOv5 algorithm for surface defect detection in aero-engine components. First, the model uses a k-means clustering algorithm to optimize the size of the preset anchors and increase the matching degree between anchors and real samples. After that, the ECA-Net attention mechanism is added to the end of the backbone network to enhance the ability of feature expression. Finally, BiFPN modules are used instead of the PANet structure in the neck network to improve the feature fusion ability of the model. The experimental results show that, with our self-made dataset, the mAP for the YOLOv5s-KEB model reached 98.3% and the inference time was 2.8 ms. Compared to the original YOLOv5s model, the mAP was increased by 1.0% and the inference time reduced by 10.3%, but the detection speed slightly dropped. Compared with the Faster R-CNN, YOLOv3, YOLOv4 and YOLOv4-tiny algorithms, our model has obvious advantages in terms of detection accuracy and model size. In further work, the dataset will be expanded to add micro-defect samples and develop the ability to identify micro-defects. We will also consider how to improve the detection speed of the model and apply it to mobile devices.

Author Contributions

Conceptualization, C.W.; methodology, H.J.; software, X.L.; validation, X.L. and Z.L.; formal analysis, X.L.; investigation, H.J. and Z.L.; resources, H.J.; data curation, X.L.; writing—original draft preparation, X.L.; writing—review and editing, C.W.; visualization, X.L. and Z.L.; supervision, C.W.; project administration, C.W. and H.J.; funding acquisition, C.W. All authors have read and agreed to the published version of the manuscript.

Funding

This research was funded by National Natural Science Foundation of China, grant number 92060202.

Institutional Review Board Statement

Not applicable.

Informed Consent Statement

Informed consent was obtained from all subjects involved in the study.

Data Availability Statement

Not applicable.

Conflicts of Interest

The authors declare no conflict of interest.

References

  1. Shang, H.; Sun, C.; Liu, J.; Chen, X.; Yan, R. Deep learning-based borescope image processing for aero-engine blade in-situ damage detection. Aerosp. Sci. Technol. 2022, 123, 107473. [Google Scholar] [CrossRef]
  2. Yilmaz, O.; Gindy, N.; Gao, J. A repair and overhaul methodology for aeroengine components. Rob. Comput. Integr. Manuf. 2010, 26, 190–201. [Google Scholar] [CrossRef]
  3. Li, D.; Li, Y.; Xie, Q.; Wu, Y.; Yu, Z.; Wang, J. Tiny defect detection in high-resolution aero-engine blade images via a coarse-to-fine framework. IEEE Trans. Instrum. Meas. 2021, 70, 1–12. [Google Scholar] [CrossRef]
  4. Girshick, R.; Donahue, J.; Darrell, T.; Malik, J. Rich Feature Hierarchies for Accurate Object Detection and Semantic Segmentation. In Proceedings of the IEEE Conference on Computer Vision and Pattern Recognition, Columbus, OH, USA, 23–28 June 2014; pp. 580–587. [Google Scholar]
  5. Girshick, R. Fast R-CNN. In Proceedings of the IEEE International Conference on Computer Vision, Santiago, Chile, 7–13 December 2015; pp. 1440–1448. [Google Scholar]
  6. Ren, S.; He, K.; Girshick, R.; Sun, J. FasterR-CNN: Towards Real-time Object Detection with Region Proposal Networks. Adv. Neural Inf. Process. Syst. 2015, 28, 91–99. [Google Scholar]
  7. Redmon, J.; Divvala, S.; Girshick, R. You Only Look Once: Unified, Real-Time Object Detection. In Proceedings of the IEEE Conference on Computer Vision and Pattern Recognition, Las Vegas, NV, USA, 12 December 2016; pp. 779–788. [Google Scholar]
  8. Liu, W.; Anguelov, D.; Erhan, D.; Szegedy, C.; Reed, S.; Fu, C.Y.; Berg, A.C. SSD: Single Shot Multibox Detector. In Proceedings of the European Conference on Computer Vision, Amsterdam, The Netherlands, 11–14 October 2016; Springer: Amsterdam, The Netherlands, 2016; pp. 21–37. [Google Scholar]
  9. Raghu, M.; Unterthiner, T.; Kornblith, S.; Zhang, C.; Dosovitskiy, A. Do vision transformers see like convolutional neural networks? Adv. Neural Inf. Process. Syst. 2021, 34, 12116–12128. [Google Scholar]
  10. Andriyanov, N.A.; Dementiev, V.E.; Tashlinskii, A.G. Detection of objects in the images: From likelihood relationships towards scalable and efficient neural networks. Comput. Opt. 2022, 46, 139–159. [Google Scholar] [CrossRef]
  11. Ramchandran, A.; Sangaiah, A.K. Unsupervised anomaly detection for high dimensional data—An exploratory analysis. In Computational Intelligence for Multimedia Big Data on the Cloud with Engineering Applications; Academic Press: Salt Lake City, UT, USA, 2018; pp. 233–251. [Google Scholar]
  12. Dosovitskiy, A.; Beyer, L.; Kolesnikov, A.; Weissenborn, D.; Zhai, X.; Unterthiner, T.; Dehghani, M.; Minderer, M.; Heigold, G.; Gelly, S.; et al. An image is worth 16 × 16 words: Transformers for image recognition at scale. arXiv 2020, arXiv:2010.11929. [Google Scholar]
  13. Kou, X.; Liu, S.; Cheng, K.; Qian, Y. Development of a YOLO-V3-based model for detecting defects on steel strip surface. Measurement 2021, 182, 109454. [Google Scholar] [CrossRef]
  14. Andriyanov, N.; Khasanshin, I.; Utkin, D.; Gataullin, T.; Ignar, S.; Shumaev, V.; Soloviev, V. Intelligent system for estimation of the spatial position of apples based on YOLOv3 and real sense depth camera D415. Symmetry 2022, 14, 148. [Google Scholar] [CrossRef]
  15. Tulbure, A.A.; Tulbure, A.A.; Dulf, E.H. A review on modern defect detection models using DCNNs–Deep convolutional neural networks. J. Adv. Res. 2022, 35, 33–48. [Google Scholar] [CrossRef] [PubMed]
  16. Du, X.; Chen, J.; Zhang, H.; Wang, J. Fault detection of aero-engine sensor based on inception-CNN. Aerospace 2022, 9, 236. [Google Scholar] [CrossRef]
  17. Redmon, J.; Farhadi, A. YOLO9000: Better, Faster, Stronger. In Proceedings of the IEEE Conference on Computer Vision and Pattern Recognition, Honolulu, HI, USA, 21–26 July 2017; pp. 6517–6525. [Google Scholar]
  18. Redmon, J.; Farhadi, A. Yolov3: An incremental improvement. arXiv 2018, arXiv:1804.02767. [Google Scholar]
  19. Bochkovskiy, A.; Wang, C.Y.; Liao, H.Y.M. Yolov4: Optimal speed and accuracy of object detection. arXiv 2020, arXiv:2004.10934. [Google Scholar]
  20. Liu, S.; Qi, L.; Qin, H.; Shi, J.; Jia, J. Path Aggregation Network for Instance Segmentation. In Proceedings of the IEEE Conference on Computer Vision and Pattern Recognition, Salt Lake City, UT, USA, 18–23 June 2018; pp. 8759–8768. [Google Scholar]
  21. Lin, T.; Dollar, P.; Girshick, R.; He, K.; Hariharan, B.; Belongie, S. Feature Pyramid Networks for Object Detection. In Proceedings of the IEEE Conference on Computer Vision and Pattern Recognition, Honolulu, HI, USA, 21–26 July 2017; pp. 2117–2125. [Google Scholar]
  22. GitHub. YOLOv5-Master. Available online: https://github.com/ultralytics/yolov5.git/ (accessed on 1 March 2021).
  23. Wang, C.-Y.; Mark Liao, H.-Y.; Wu, Y.-H.; Chen, P.-Y.; Hsieh, J.-W.; Yeh, I.-H. CSPNet: A New Backbone that can Enhance Learning Capability of CNN. In Proceedings of the Conference on Computer Vision and Pattern Recognition, Seattle, WA, USA, 13–19 June 2020; pp. 1571–1580. [Google Scholar]
  24. Wang, Q.; Wu, B.; Zhu, P.; Li, P.; Zuo, W.; Hu, Q. ECA-Net: Efficient Channel Attention for Deep Convolutional Neural Networks. In Proceedings of the Conference on Computer Vision and Pattern Recognition, Seattle, WA, USA, 13–19 June 2020; pp. 11531–11539. [Google Scholar]
  25. Hu, J.; Shen, L.; Albanie, S.; Sun, G.; Wu, E. Squeeze-and-Excitation networks. IEEE Trans. Pattern Anal. Mach. Intell. 2019, 42, 2011–2023. [Google Scholar] [CrossRef] [PubMed] [Green Version]
  26. Li, K.; Qin, L.; Li, Q.; Zhao, F.; Xu, Z.; Liu, K. Improved edge lightweight YOLOv4 and its application in on-site power system work. Glob. Energy Interconnect. 2022, 5, 168–180. [Google Scholar] [CrossRef]
  27. Tan, M.; Pang, R.; Le, Q.V. EfficientDet: Scalable and Efficient Object Detection. In Proceedings of the IEEE Conference on Computer Vision and Pattern Recognition, Seattle, WA, USA, 13–19 June 2020; pp. 10778–10787. [Google Scholar]
  28. Du, F.J.; Jiao, S.J. Improvement of lightweight convolutional neural network model based on YOLO algorithm and its research in pavement defect detection. Sensors 2022, 22, 3537. [Google Scholar] [CrossRef] [PubMed]
Figure 1. The architecture of YOLOv5s.
Applsci 12 07235 g001
Figure 2. Diagram of ECA-Net module. For the aggregated features, ECA-Net generates channel weights by performing a fast 1D convolution of kernel size k, where k is proportional to the channel dimension.
Applsci 12 07235 g002
Figure 3. Comparison of three feature fusion networks. (a) FPN introduces a top-down pathway to fuse multi-scale features from P3 to P7; (b) PANet adds an additional bottom-up pathway on top of FPN; (c) BiFPN with better accuracy and efficiency trade-offs.
Applsci 12 07235 g003
Figure 4. The architecture of the YOLOv5s-KEB model.
Applsci 12 07235 g004
Figure 5. Types of defect. (a) Crack; (b) gap; (c) pit; (d) scratch.
Applsci 12 07235 g005
Figure 6. Defect labeling example. (a) Labeling box; (b) Xml file.
Applsci 12 07235 g006
Figure 7. Comparison of detection effects of two models. (a) Original YOLOv5s model; (b) YOLOv5s-KEB model.
Applsci 12 07235 g007
Table 1. Comparison of anchor parameters.
DatasetAnchor1Anchor2Anchor3
COCO(10, 13)(30, 61)(116, 90)
(16, 30)(62, 45)(156, 198)
(33, 23)(59, 119)(373, 326)
Ours(7, 12)
(14, 59)
(16, 18)
(34, 74)
(47, 30)
(62, 161)
(130, 54)
(167, 257)
(380, 153)
Table 2. The settings for the training hyperparameters.
HyperparametersValue
lr00.001
lrf0.2
momentum0.937
weight_decay0.0005
Table 3. Comparison of parameters of each model.
ModelK-MeansECABiFPNWeightInference Time 1
YOLOv5s× 2××14.4 MB2.9 ms
A××14.4 MB2.3 ms
B××14.4 MB2.9 ms
C××16.5 MB2.8 ms
YOLOv5s-KEB16.5 MB2.6 ms
1 The average time required for the model to infer a single image. 2 The symbol × means that the improvement will not be used, while √ means to use.
Table 4. Comparison of evaluation indicators for each model.
ModelAPmAPFPS
CrackGapPitScratch
YOLOv5s94.9%99.5%98.4%96.5%97.3%47.98
A95.7%99.6%99.2%97.9%98.1%50.12
B95.6%99.5%98.9%96.5%97.6%49.33
C95.0%99.5%98.9%97.2%97.7%46.37
YOLOv5s-KEB96.9%99.5%99.2%97.6%98.3%46.50
Table 5. Comparison of detection performance for different algorithms.
ModelAPmAP%FPSWeight
CrackGapPitScratch
Faster R-CNN75.4%78.1%58.7%83.1%73.8%14.29109 MB
YOLOv382.1%89.8%85.1%76.1%83.3%22.63235 MB
YOLOv490.0%93.2%86.6%79.0%87.2%18.55244 MB
YOLOv4-tiny64.3%48.8%45.5%41.7%50.1%85.0822.4 MB
YOLOv5s-KEB96.9%99.5%99.2%97.6%98.3%46.5016.5 MB
Publisher’s Note: MDPI stays neutral with regard to jurisdictional claims in published maps and institutional affiliations.

