Article

Investigating the Bioconversion Potential of Volatile Fatty Acids: Use of Oleaginous Yeasts Rhodosporidium toruloides and Cryptococcus curvatus towards the Sustainable Production of Biodiesel and Odd-Chain Fatty Acids

Biochemical Process Engineering, Division of Chemical Engineering, Department of Civil, Environmental, and Natural Resources Engineering, Luleå University of Technology, SE-971 87 Luleå, Sweden
*
Author to whom correspondence should be addressed.
Appl. Sci. 2022, 12(13), 6541; https://doi.org/10.3390/app12136541
Submission received: 18 May 2022 / Revised: 23 June 2022 / Accepted: 24 June 2022 / Published: 28 June 2022
(This article belongs to the Special Issue Yeast Fermentation and Biotechnology)

Abstract

:
Oleaginous yeasts have attracted increasing scientific interest as single cell oil (SCO) producers. SCO can be used as a fossil-free fuel substitute, but also as a source of rarely found odd-chain fatty acids (OCFAs), such as C15, C17, and C25 fatty acids which have a wide range of nutritional and biological applications. Volatile fatty acids (VFAs) have gained interest as sustainable carbon source for yeasts. This study aims to improve current knowledge on yeast species that yield high amounts of SCO using VFAs as a carbon source. Specifically, the growth of the promising yeasts Cryptococcus curvatus and Rhodotorula toruloides was evaluated on individual VFAs, such as acetic, propionic, and butyric acid. C. curvatus proved to be more tolerant in higher concentrations of VFAs (up to 60 g/L), while butyric acid favored biomass and lipid conversion (0.65 and 0.23 g/gsubstrate, respectively). For R. toruloides, butyric acid favored biomass conversion (0.48 g/gsubstrate), but lipid conversion was favored using acetic acid, instead (0.14 g/gsubstrate). Propionic acid induced the formation of OCFAs, which yielded higher amounts for C. curvatus (up to 2.17 g/L). VFAs derived from the anaerobic digestion of brewer’s spent grain were tested as a cost-competitive carbon source and illustrated the significance of the combination of different VFAs in the quality of the produced SCO, by improving the biodiesel properties and OCFAs production.

1. Introduction

Oleaginous microorganisms, including several yeast species, have been known to synthesize high amounts of lipids (20–70% w/w of their cell dry weight) in their cellular compartments [1,2]. These intracellular lipids are also referred to as single cell oil (SCO), which can have different FA composition depending on the type of microorganism and the cultivation conditions that are used. The potential of certain yeast species as prominent producers of SCO has received a lot of attention for many years. The reason for that is the promising applications of SCOs in the biofuel and biochemical industries [3]. Currently, there is a global need to reduce the world’s dependence on fossil fuels, and to meet the production goals for this high demand, we need to find alternative sources of oil to replace the use of vegetable oils and animal fats as the main resources for biodiesel [4]. To this end, the use of oleaginous yeasts as SCO producers has many advantages, as it does not compete with the feed and food industry, is not susceptible to climate conditions, and does not require arable land [5,6]. Additionally, the cultivation conditions can be modified, or the yeasts can be genetically engineered to optimize the SCO composition for the targeted applications [7,8].
The reason for the diversity of the SCO applications lies in their varied fatty acid composition [9]. For instance, when aiming for biodiesel, it has been observed that SCOs have many similarities with vegetable oils [10]. Depending on the fatty acid composition of SCOs, the produced biodiesel can have significantly different properties [8,11,12]. As an example, high amounts of saturated fatty acids (SFAs) favor a high cetane number (CN) value, which is related to the ignition quality of the biodiesel and better oxidation stability (OS) which results in longer shelf-life and lower NOx emissions. Furthermore, when short-chain SFAs are abundant, the long-chain saturated fatty acids (LCSF) are lower and so are the kinematic viscosity (KN) and the cold filter plugging point (CFPP) [11,13,14]. On the other hand, high levels of unsaturated fatty acids are related to low OS, but they improve the low-temperature performance [13,15,16]. Thus, a good balance between the different types of fatty acids is required to obtain good physicochemical properties of biodiesel [17]. Monounsaturated fatty acids (MUFAs) have been reported to successfully maintain that balance, therefore FAMEs with high MUFA content are beneficial for good OS and low-temperature properties [10]. However, the obtained SCO does not always contain the ideal combination of fatty acids and it remains challenging to produce biodiesel with the optimal properties. Therefore, more studies are needed to elucidate the effect of the fatty acid composition of SCO on the production of biodiesel, especially since there is a knowledge gap regarding the exploration of candidate oleaginous yeast species grown under different cultivation conditions.
The goal of most studies has been the optimization of the cultivation aimed at an economically viable and environmentally friendly SCO production [8]. Therefore, the need to find cost-competitive carbon sources that can be used as sustainable substrates is of high importance [18]. The use of renewable sugar-based substrates, like glucose-containing hydrolysates that are derived from lignocellulosic materials such as residual agricultural and forest biomass or municipal solid wastes, has been investigated [10]. However, to obtain a pure sugar stream from lignocellulosic substrates, a pretreatment followed by saccharification is usually needed, due to the rigid structure of lignocellulose [19]. These extra steps account for an additional cost in the process. Another approach is to employ anaerobic digestion (AD), which is a more cost-effective method compared to enzymatic hydrolysis, to convert organic waste to bioenergy [20]. Here, brewer’s spent grain (BSG) as a by-product of the brewing industry was used as the feedstock to improve the overall renewability of the process. BSG is found mainly in livestock feed applications, however, it has significant biotechnological potential in the production of value-added products due to its lignocellulosic composition and chemical characteristics [21]. BSG has an estimated annual production of ~3.4 million tons in the EU [22], therefore developing processes that take advantage of these large amounts are needed [23]. Apart from bioenergy, volatile fatty acids (VFAs) are produced as intermediates during the acidogenesis stage of AD [24]. VFAs are short-chain fatty acids (C2–C5), with the most common ones being acetic acid (C2), propionic acid (C3), and butyric acid (C4), and have been proven viable substrates for yeast cultivation [25]. Depending on the substrate, the microbial population, and the digestion conditions, a mixture of different types of VFAs in different ratios can be produced [26]. This VFA mixture can be further valorized for the production of SCO by different oleaginous microorganisms [3,19,27].
Apart from biodiesel production, SCO produced by oleaginous yeasts can contain important amounts of odd-chain fatty acids (OCFAs) when yeasts are grown in propionic acid. Although OCFAs, such as C15, C17, or less commonly C25 fatty acids, are found in small proportions in natural sources, their importance is very significant. The most common ones, C15:0 and C17:0, are found in low levels in whole fat milk (up to 1% of the total fatty acids) [28]. Certain types of fish are also sources of OCFAs, as well as some plants and bacteria, while it has also been reported to be present in ruminant fat [29,30]. OCFAs are also present in human plasma, red blood cells, and liver [31,32]. Additionally, C25:0 has been detected in glycosphingolipids located in the brain tissue [33]. Lately, OCFAs have attracted significant interest due to their association with several health benefits such as reducing the risk of metabolic disorders [34]. Additionally, C17:1 has been noted to exhibit good anti-inflammatory effects and can also regulate allergies, psoriasis, and autoimmune diseases [35]. OCFAs can also be used as biomarkers for the detection of potential coronary heart disease or diabetes type II mellitus since they are known to be inversely correlated to these medical conditions [33,36]. However, the direct association of OCFAs in health-related problems needs to be studied extensively with more in vitro studies. Aside from their nutritional and biological applications, they can be used for the production of certain industrial chemicals, such as pesticides, flavor and fragrance compounds, hydraulic fluids plasticizers, and coatings [37].
Several microorganisms have been reported to produce OCFAs including thraustochytrids [38,39,40], yeasts, and bacteria [41] by using propionic acid, or 1-propanol as carbon sources [42]. These substrates can be converted to propionyl-CoA, the main biosynthetic precursor of OCFAs, by the action of propionyl-CoA synthetase [42]. However, microbial production of OCFAs results in very low yields, since the cell growth on the aforementioned substrates can be inhibited above a certain concentration. To solve this problem, genetic engineering has been applied to improve OCFAs production [37,41]. There is still, however, a need to investigate new promising strains with the ability to tolerate increased concentrations of propionic acid while producing OCFAs. Similarly, the cultivation of those microorganisms needs to be further optimized in relation to the OCFAs yield.
In this study, we investigated the potential of two oleaginous yeast strains, Rhodotorula toruloides NCYC 1576 and Cryptococcus curvatus DSM 101032, as natural producers of OCFAs and SCOs suitable for biodiesel. Initially, their tolerance and preference towards certain VFAs was assessed on synthetic VFAs. To promote a sustainable and industrially relevant process, an effluent from AD effluent of BSG was studied as a low-cost renewable substrate towards the production of high added-value nutraceuticals and biodiesel.

2. Materials and Methods

2.1. Chemicals

All chemicals used in the present study were of analytical grade and were purchased from Sigma Aldrich (St. Louis, MO, USA). BODIPY493–503 nm for the visualization of intracellular lipid droplets was acquired from Invitrogen (C2102, ThermoFisher Scientific, Waltham, MA, USA).

2.2. Microorganisms and Growth Conditions

The yeast strain Cryptococcus curvatus DSM 101032 (CC) was purchased from the Leibniz Institute DSMZ-German Collection of Microorganisms and Cell Cultures (Braunschweig, Germany), and the yeast strain Rhodotorula toruloides NCYC 1576 (RT) from the National Collection of Yeast Culture (Norwich, UK). Yeasts were maintained in YPD agar plates (glucose, 20 g/L; peptone, 20 g/L; and yeast extract, 10 g/L) which were sub-cultured twice a month to maintain the cells fresh. A loop of cells was inoculated in 50 mL YPD medium in 250 mL shake flasks which were incubated at 30 °C and 200 rpm for 30–40 h. Then, 5% v/v of cells were further inoculated in a 50 mL fresh YPD medium that served as preculture. The preculture was grown at 30 °C, 200 rpm for 30 h. Before inoculation of the main culture, a volume corresponding to 10% v/v of the main culture volume was collected, centrifuged (8000 rpm for 10 min at 4 °C), and the cells were resuspended in the main culture medium. This was done to eliminate any effect of the remaining nutrients in the growth medium.

2.3. Batch Cultivation in Synthetic Media

The synthetic culture medium contained the following composition: 1.5 g/L MgSO4·7H2O, 0.4 g/L KH2PO4, and 1% v/v trace elements solution. The trace elements solution contained the following ingredients (g/L): 4 CaCl2·2H2O, 0.55 FeSO4·7H2O, 0.52 citric acid·H2O, 0.1 ZnSO4·7H2O, 0.076 MnSO4·H2O, and 100 μL H2SO4 18 M. A mixture of yeast extract and (NH4)2SO4 at a 7.5:1 w/w ratio was used to regulate the nitrogen concentration. The initial pH was adjusted at 7.0 using NaOH or HCl as needed. Commercial VFAs (Acetic acid (C2), Propionic acid (C3), Butyric acid (C4)) in different concentrations ranging from 10 to 80 g/L were tested as carbon sources, and glucose was used as a positive control. The C/N ratio was initially set at 50 and later increased to 100. The medium was sterilized by autoclaving at 120 °C for 20 min. Cultivations were carried out in 250 mL Erlenmeyer flasks containing 50 mL medium, at 30 °C and 200 rpm.

2.4. Batch Cultivations on AD Effluent

Brewers’ spent grain (BSG) was provided by Skellefteå Bryggeri (Skellefteå, Sweden) and was used as a feedstock for acidogenic fermentation to produce VFAs as mentioned by Sarkar et al. [23]. The composition of the VFAs in the effluent was determined with high-performance liquid chromatography (HPLC, Perkin Elmer Series 200, Waltham, MA, USA). When VFAs from acidogenic fermentation of BSG (10 g/L Acetic acid, 0.8 g/L Propionic acid, 1.2 g/L Butyric acid) were used as a carbon source, the C/N ratio was set at 50 and the pH was adjusted again at 7.0. The medium was filter-sterilized (0.2 μm pore size filter) to avoid precipitation of the media components during autoclaving. Cultivations were carried out in 250 mL Erlenmeyer flasks containing 50 mL medium, at 30 °C and 200 rpm. The cells were harvested when they reached the stationary growth phase, as determined by optical density (OD) at 600 nm.

2.5. Analytical Methods

2.5.1. Estimation of Substrate Consumption during Cultivation

During fermentation, 2 mL samples were withdrawn daily to estimate growth and substrate consumption. Growth was determined by optical density (OD) at 600 nm using Spectra max M2 Microplate Reader (Molecular Devices, San Jose, CA, USA). For determining the remaining carbon source (VFAs and glucose), the supernatants from the collected samples were filtrated (0.2 μm pore size filter) and analyzed by high-performance liquid chromatography (HPLC, Perkin Elmer Series 200) using an Aminex HPX-87H column (Bio-Rad Laboratories, Hercules, CA, USA) equipped with a micro-guard column at 65 °C, using 5 mM H2SO4 as the mobile solvent at a flow rate of 0.6 mL/min for 30 min. A refractive index (RI) detector was used.

2.5.2. Cell Dry Weight and Lipids Extraction

When the cultivation reached the stationary phase, the cells were harvested via centrifugation (8000 rpm, 10 min, 4 °C), washed with deionized water, and freeze-dried. The biomass weight was analyzed gravimetrically and calculated as dry cell weight (DCW; g/L). In order to extract the intracellular lipids, dry cell biomass of known weight was pulverized using a mortar and pestle and mixed with 5 mL chloroform: methanol (2:1, v/v). The resulting slurry was incubated overnight under shaking. Then, the mixture was centrifuged (8000 rpm, 10 min, 4 °C) and the supernatant was filtered using a PTFE filter (0.2 μm pore size) to a pre-weighed glass vial. The vial was left in a hot air oven at 50 °C and the total lipids were calculated gravimetrically after evaporation of the solvent. The total lipid concentration was expressed in g/L and the lipid content (% w/w) was calculated accordingly based on the DCW.

2.5.3. GC-MS Analysis of Intracellular Lipids

The extracted lipids were transesterified using the protocol mentioned by Wychen et al. [43] with some modifications. Lipids up to 50 mg were used and 1 mL chloroform: methanol (2:1, v/v) was added, and the lipids were transferred in ace pressure glass tubes. Then, 2 mL of 0.6 M HCl: methanol was added, followed by mixing and incubation in a water bath for 1 h at 90 °C. After incubation, the mixture was cooled down to room temperature and transferred in falcon tubes where 1 mL n-hexane was added for extraction of the fatty acid methyl esters (FAMEs), together with 1 mL water for phase separation. Finally, the samples were centrifuged (8000 rpm, 10 min) and the upper n-hexane layer containing the FAMEs was transferred to HPLC glass tubes. The fatty acid profile was determined by gas chromatography-mass spectrometry (GC–MS) on a Clarus 690 MS coupled to a Clarus SQ8 GC instrument (PerkinElmer, Waltham, MA, USA) equipped with a capillary column (Elite -FFAP; 30 m, 0.25 mm ID, 0.25 μm df, Cat. # N9316352; PerkinElmer). GC–MS was run according to the method mentioned by Patel et al. [19]. FAMEs were identified based on their mass spectra. The biodiesel properties were predicted as mentioned by Biodiesel analyzer (Version 2.2) software (“https://www.brteam.ir/biodieselanalyzer” accessed on 2 May 2020), by using empirical formulas [44].

2.5.4. Fluorescence Microscopy

Intracellular lipids were visualized using a fluorescence microscope (Invitrogen™ EVOS™ FL Digital Inverted Fluorescence Microscope, ThermoFisher Scientific, Waltham, MA, USA) equipped with a Fluorescence LED light cube (GFP; 470/525 nm). The cells were stained with BODIPY493/503 (Invitrogen C2102, ThermoFisher Scientific, Waltham, MA, USA) prepared in DMSO (0.1 mg/mL) using the following procedure: 1 mL culture samples were collected at the stationary phase, centrifuged, and resuspended in 200 μL deionized water and finally mixed with 2 μL BODIPY493/503 dye. The samples were incubated for 10 min in the dark and 5 µL of the solution was placed on a microscope slide (Glass Slides, 90° ground edges, VWR International AB, Gothenburg, Sweden) and covered with a glass cover.

2.6. Statistical Analysis

Multivariate analysis was performed using JMP® Version 16, (SAS Institute Inc., Cary, NC, USA, 1989–2021) statistical software. Principal Components Analysis (PCA) was carried out for the fatty acid profiles of the SCO for all the substrates tested. The PCA results were used to compare multiple independent groups and to better visualize the variability within the dataset.

3. Results and Discussion

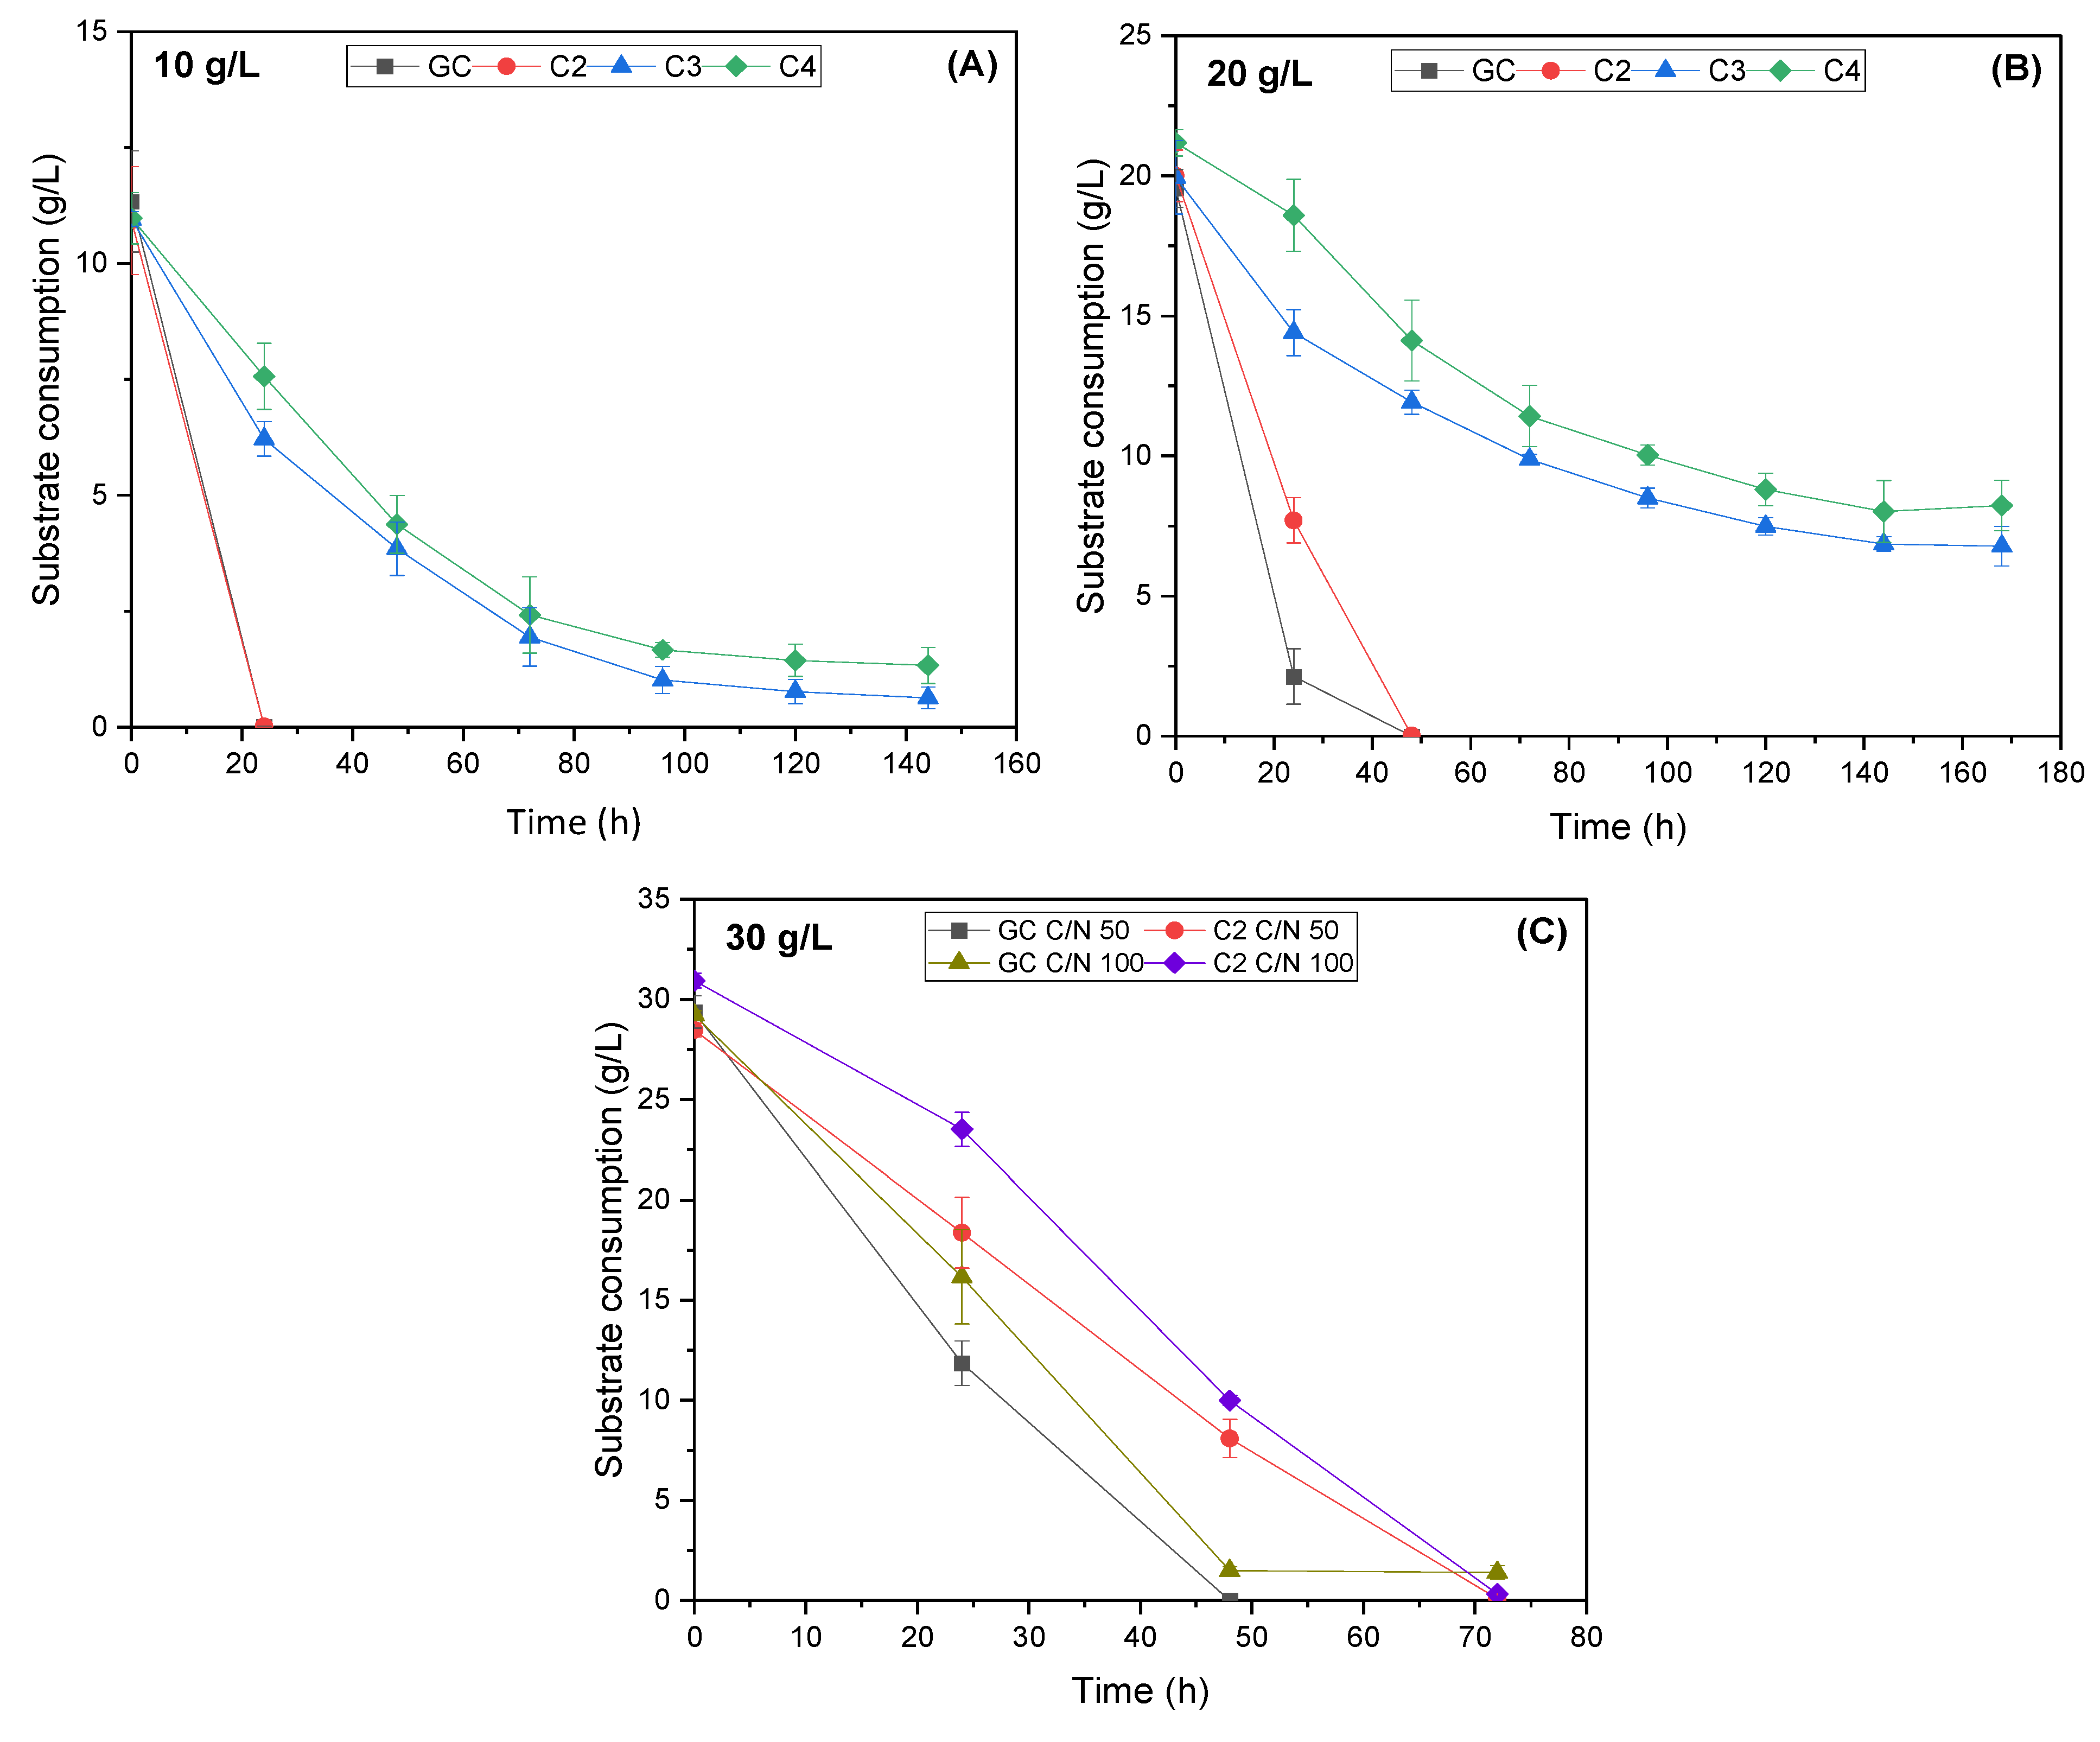
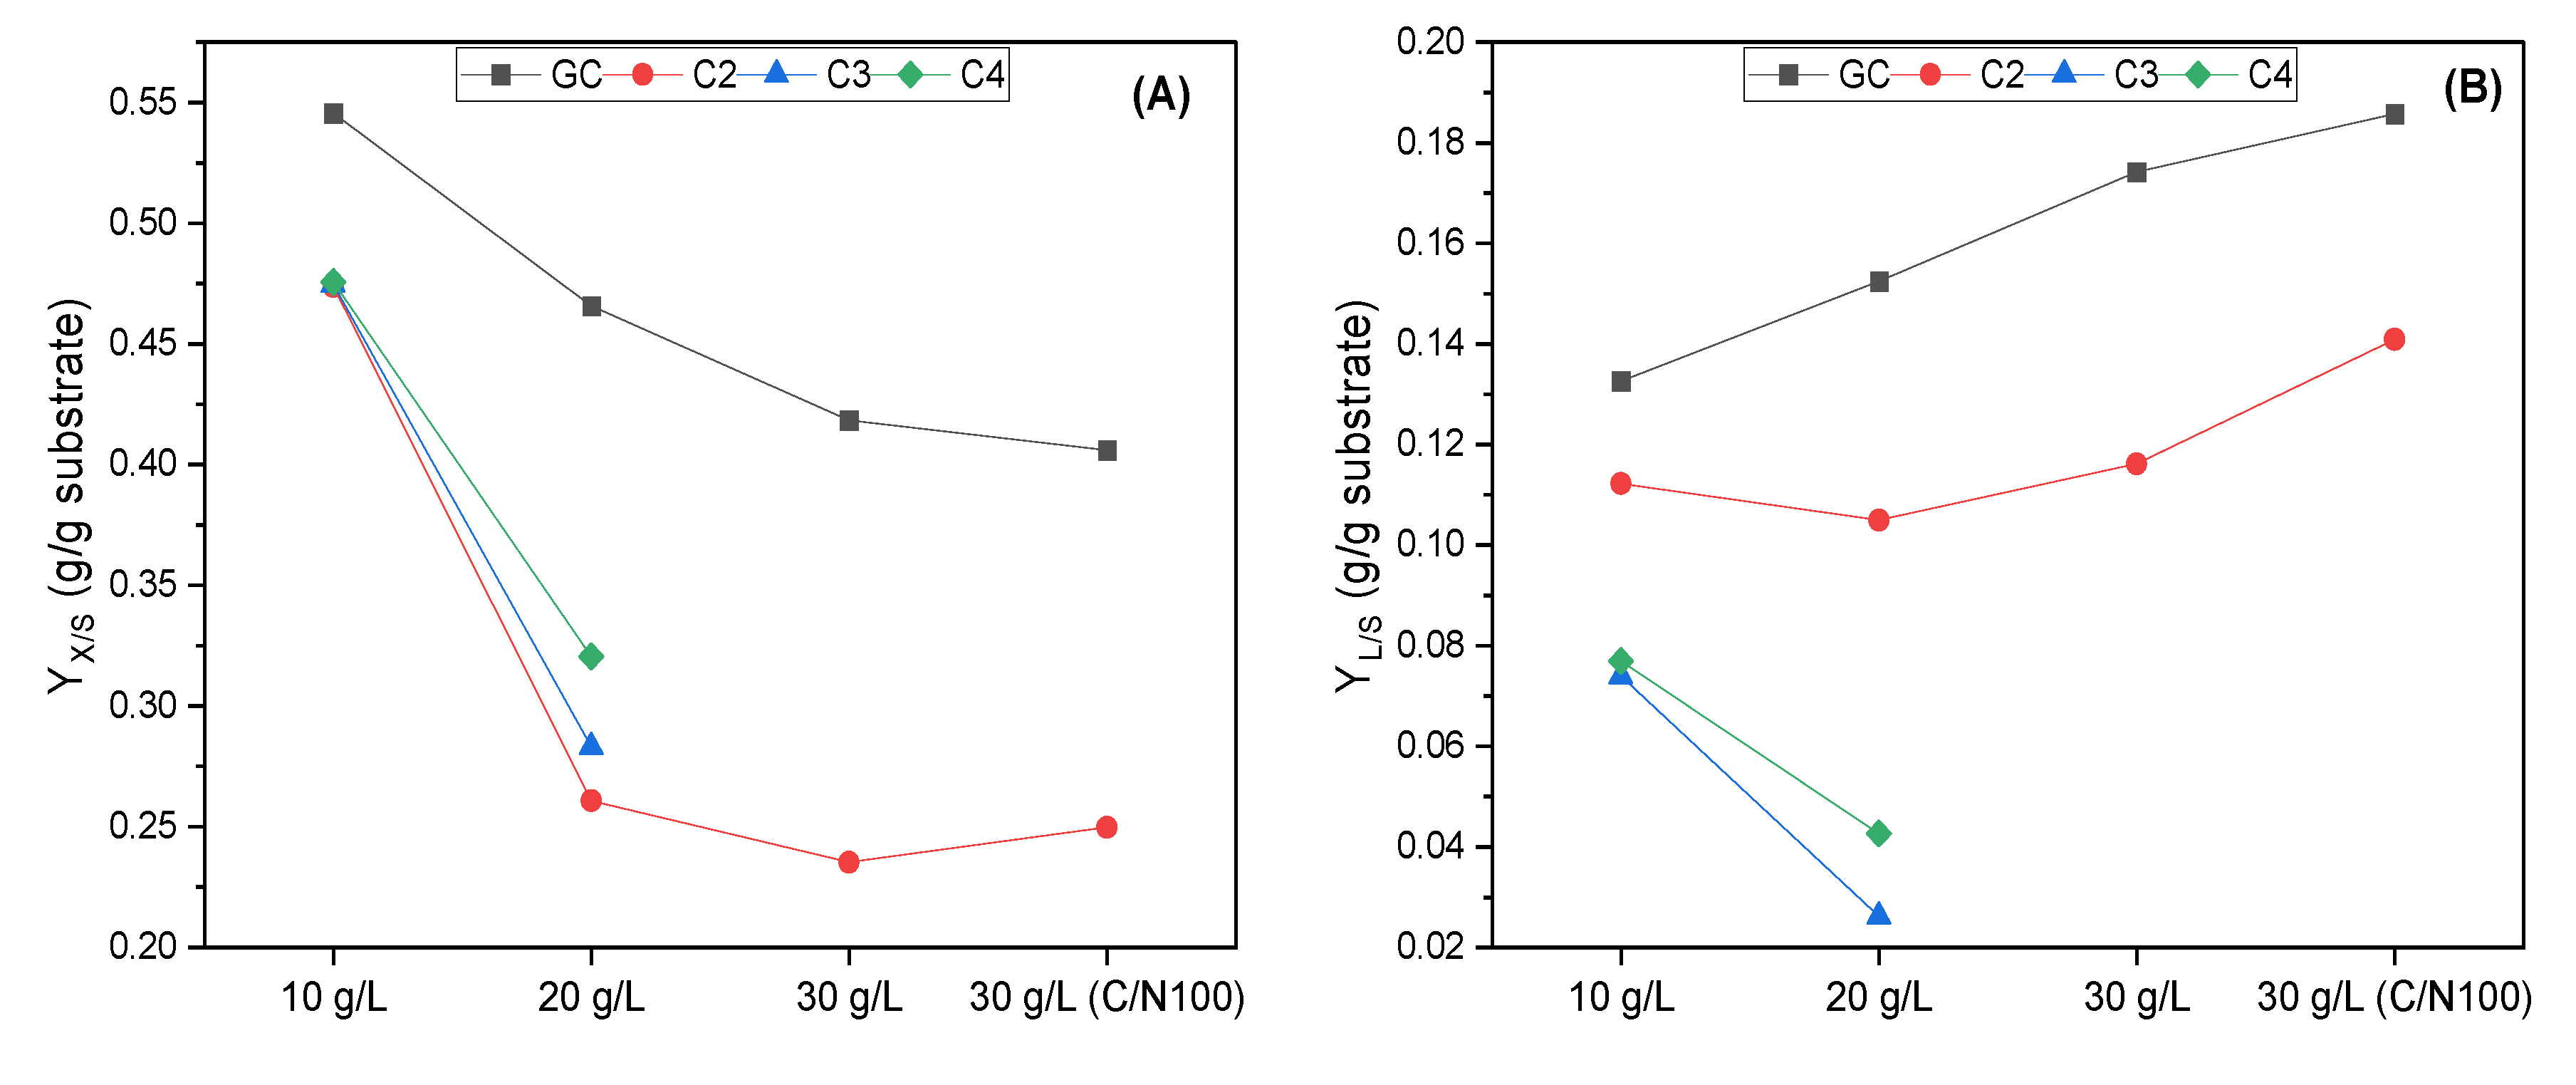
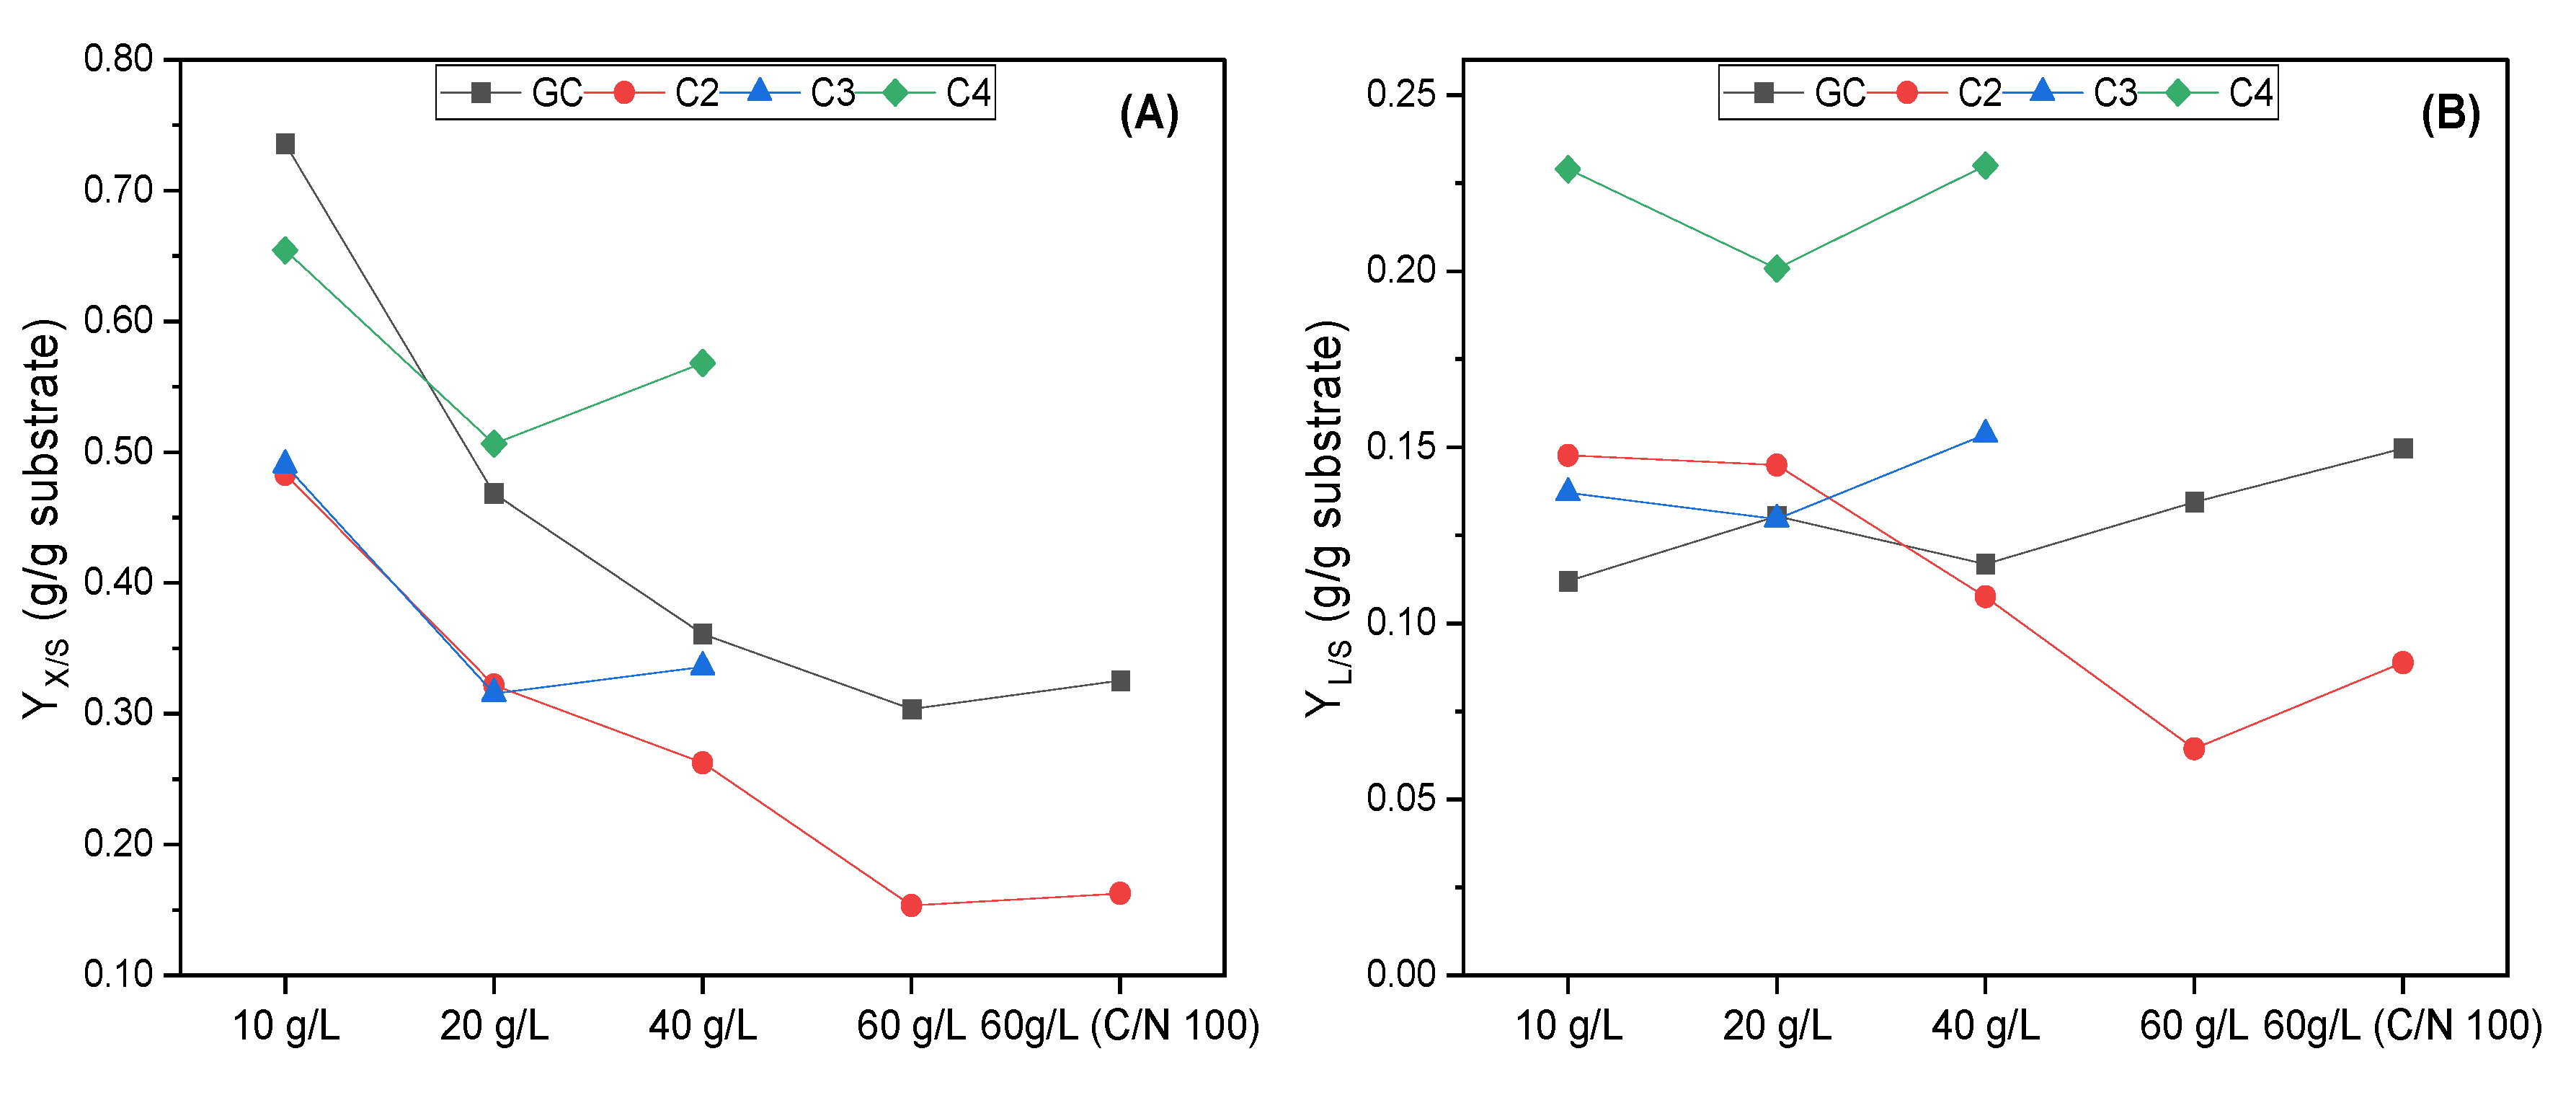
3.1. Evaluation of R. toruloides Growth on Different Concentrations of VFAs

Batch cultivations were carried out to study the tolerance, growth, and lipid accumulation of the yeast on different VFAs (Acetic acid; Propionic acid; Butyric acid), while glucose (GC) was used as a positive control. Figure 1 shows the consumption of VFAs at different starting concentrations (10, 20, and 30 g/L), while biomass and lipid accumulation are depicted in Figure 2.
Acetic acid appeared to be the most favorable VFA as a carbon source, with substrate consumption similar to glucose. Acetic acid consumption decreased with an increasing concentration, with 30 g/L being the upper limit that the yeast could fully utilize. Gong et al. [45] also reported growth of R. toruloides (strains ATCC 10788 and Y4) at a concentration of up to 30 g/L acetic acid. In our study, when 40 g/L acetic was used, the growth of R. toruloides started to get inhibited, with the consumption of acetic acid dropping to 76.1% (data not shown). Similar findings were reported in the study of Huang et al. [46], where acetic acid at 40 g/L inhibited the growth of the yeast. In the same study, it was found that the maximum concentration of acetic acid that the yeast could completely consume was 10 g/L, while Afonso et al. [47] found that the inhibiting effect on yeast growth appears in concentrations higher than 20 g/L. However, to the best of our knowledge, no studies have been carried out to study the growth limit of R. toruloides on other VFAs, like propionic and butyric acid. In our study, it was found that propionic and butyric acid inhibited the growth of R. toruloides at much lower concentrations. At 10 g/L initial concentration, the yeast could consume 94.3% of propionic acid and 87.9% of butyric acid, which dropped to 65.6% and 62.1%, respectively, for 20 g/L, while at 40 g/L, the consumption of propionic acid was only 30.8% (data not shown) and no growth was observed with butyric acid.
As shown in Figure 2, when glucose was used, the biomass and the lipid concentration were the highest, however, the highest lipid content was attained with acetic acid. Specifically, at an initial concentration of 10 g/L (Figure 2A), the biomass accumulation was similar for all VFAs (4.7, 4.7, 4.8 g/L for C2, C3, C4, respectively) while for glucose it was 5.5 g/L. The lipid concentration was 1.3 g/L on glucose (24.2% w/w lipid content), followed by acetic acid with 1.1 g/L (27.9% w/w lipid content). For propionic and butyric acid, lipid accumulation had very similar values (0.7 g/L for C3 and 0.8 g/L for C4) and the same was observed for the lipid content (9.3% w/w for C3 and 8.8% w/w for C4). When the concentration increased to 20 g/L (Figure 2B), the observed trend for biomass and lipid accumulation was the same for glucose and acetic acid. The DCW and lipid concentration was higher for glucose with 9.3 g/L and 3.0 g/L, respectively, followed by acetic acid with 5.2 g/L and 2.1 g/L. On the contrary, the lipid content was lower for glucose (32.8% w/w) than for acetic acid (40.3% w/w). The same trend was found by Huang et al., [46] where biomass accumulation is favored with glucose, while the lipid content is higher with acetic acid. In the case of propionic and butyric acid, a slightly different trend was observed at 20 g/L. Specifically, the DCW was higher for butyric acid (6.4 g/L) than for propionic acid (5.7 g/L), as well as the lipid accumulation (0.9 g/L for C4 and 0.5 g/L for C3) and the lipid content (13.3% w/w for C4 and 9.2% w/w for C3). At 30 g/L (Figure 2C) and C/N 50, the DCW for glucose increased to 12.6 g/L and for acetic acid to 7.1 g/L. The lipid accumulation reached 5.2 g/L for glucose and 3.5 g/L for acetic acid, but the lipid content was still higher with acetic acid (49.3% w/w for C2 and 41.6% w/w for GC).
The role of the C/N ratio in cell growth and microbial lipids production has already been observed. An enhancement in the production of the lipids has been associated with an increase in the C/N ratio (nitrogen limiting conditions). In order to increase lipid accumulation, R. toruloides was cultivated using a C/N ratio of 100 at 30 g/L (Figure 2C). In that case, despite substrate consumption proceeded at a slower rate for both glucose and acetic acid, as compared with C/N 50, it reached 95.2% for glucose, while all acetic acid was consumed. The DCW for glucose did not change significantly (12.2 g/L) and for acetic acid, it increased slightly to 7.5 g/L. On the other hand, the lipid accumulation and content showed an important increase for acetic acid (4.2 g/L and 56.4%) with C/N 100 compared to C/N 50. For glucose, there was also a slight increase in the lipids accumulation and content (5.6 g/L and 45.8% w/w). This is also in line with the results reported by Huang et al. [46], where an increase in the C/N ratio for the cultivation of R. toruloides with 20 g/L acetic acid did not lead to a further increase in the biomass formation, in contrast to the lipid content.
The biomass yields decreased when increasing the substrate concentration (Figure 3A). On the contrary, the lipid yield (Figure 3B) of glucose and acetic acid shows an increase, with the highest lipid yield to be reached at 30 g/L and C/N 100 for glucose (0.19 g/gsubstrate) and for acetic acid (0.14 g/gsubstrate). However, with propionic and butyric acid, the lipid yield decreases with an increase in the initial concentration. The maximum lipid yield for propionic acid and butyric acid is observed at 10 g/L with a value of 0.08 g/gsubstrate for both VFAs. Among all substrates tested, the highest biomass and lipid yields are reached with glucose. However, among the VFAs, the highest biomass yield is reached with butyric acid, but this is not the case for the lipid yields which are significantly higher with acetic acid. This indicates R. toruloides preference of acetic acid toward lipids, while butyric acid is favoring cell biomass formation.

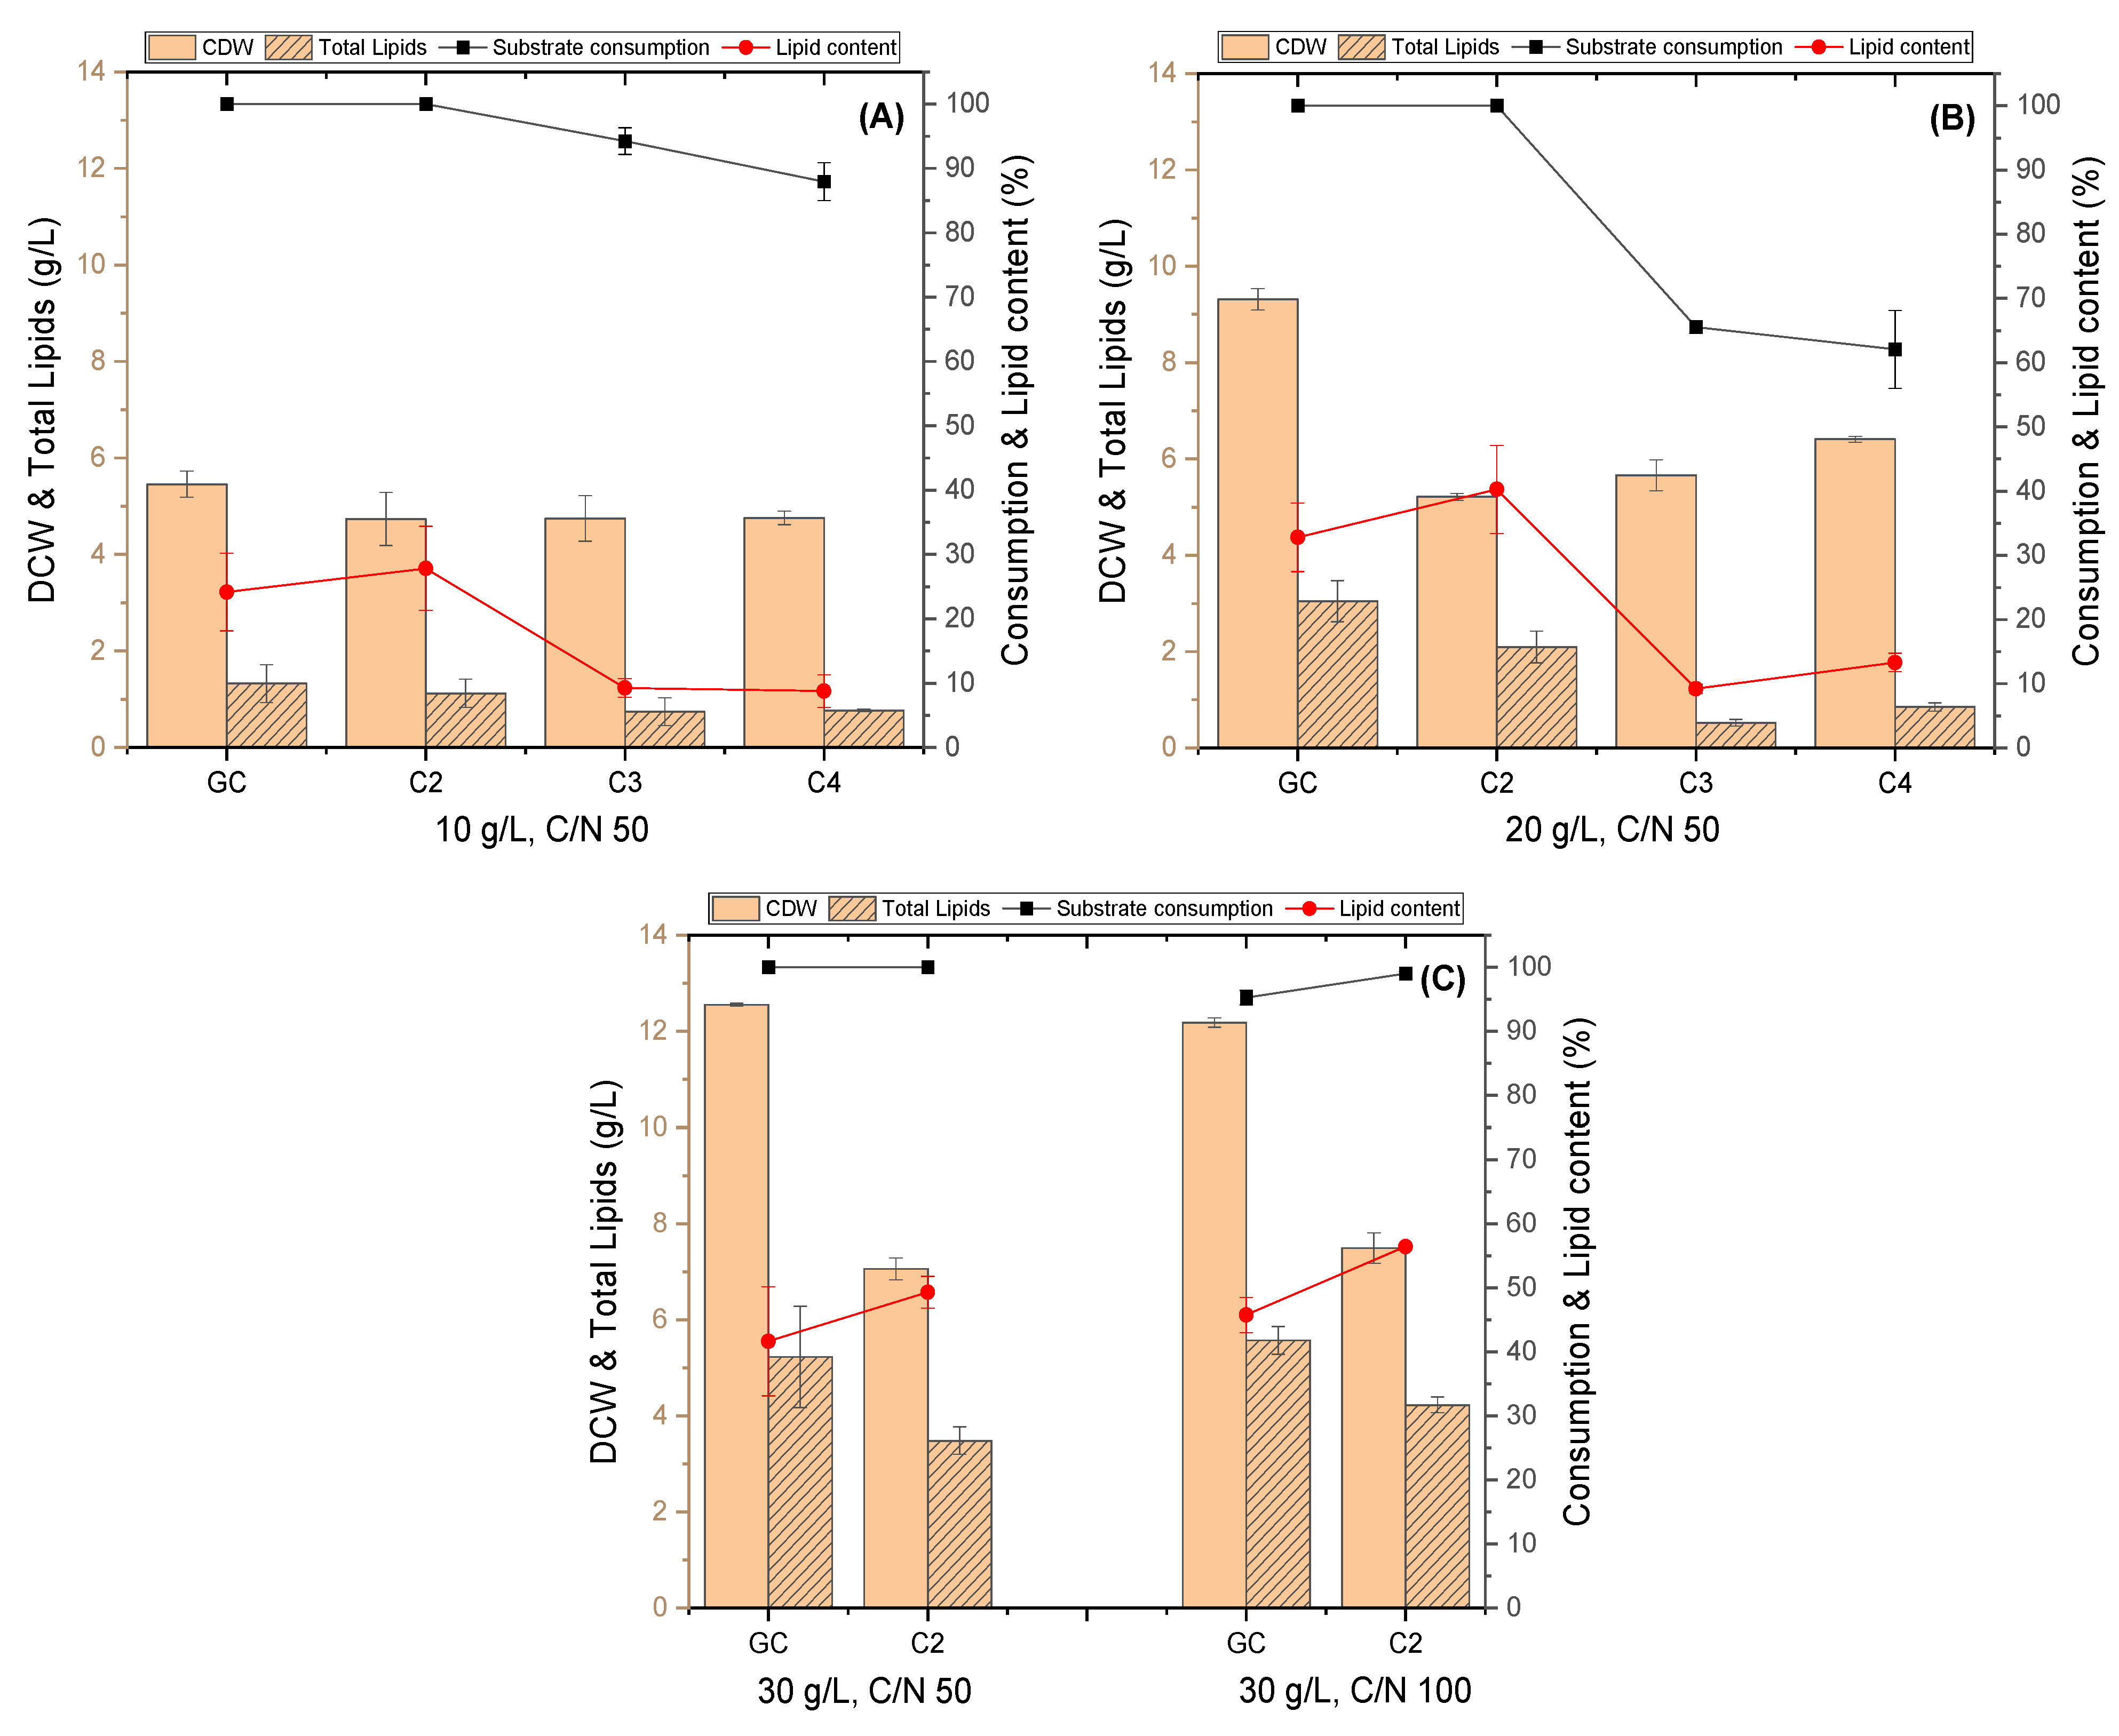
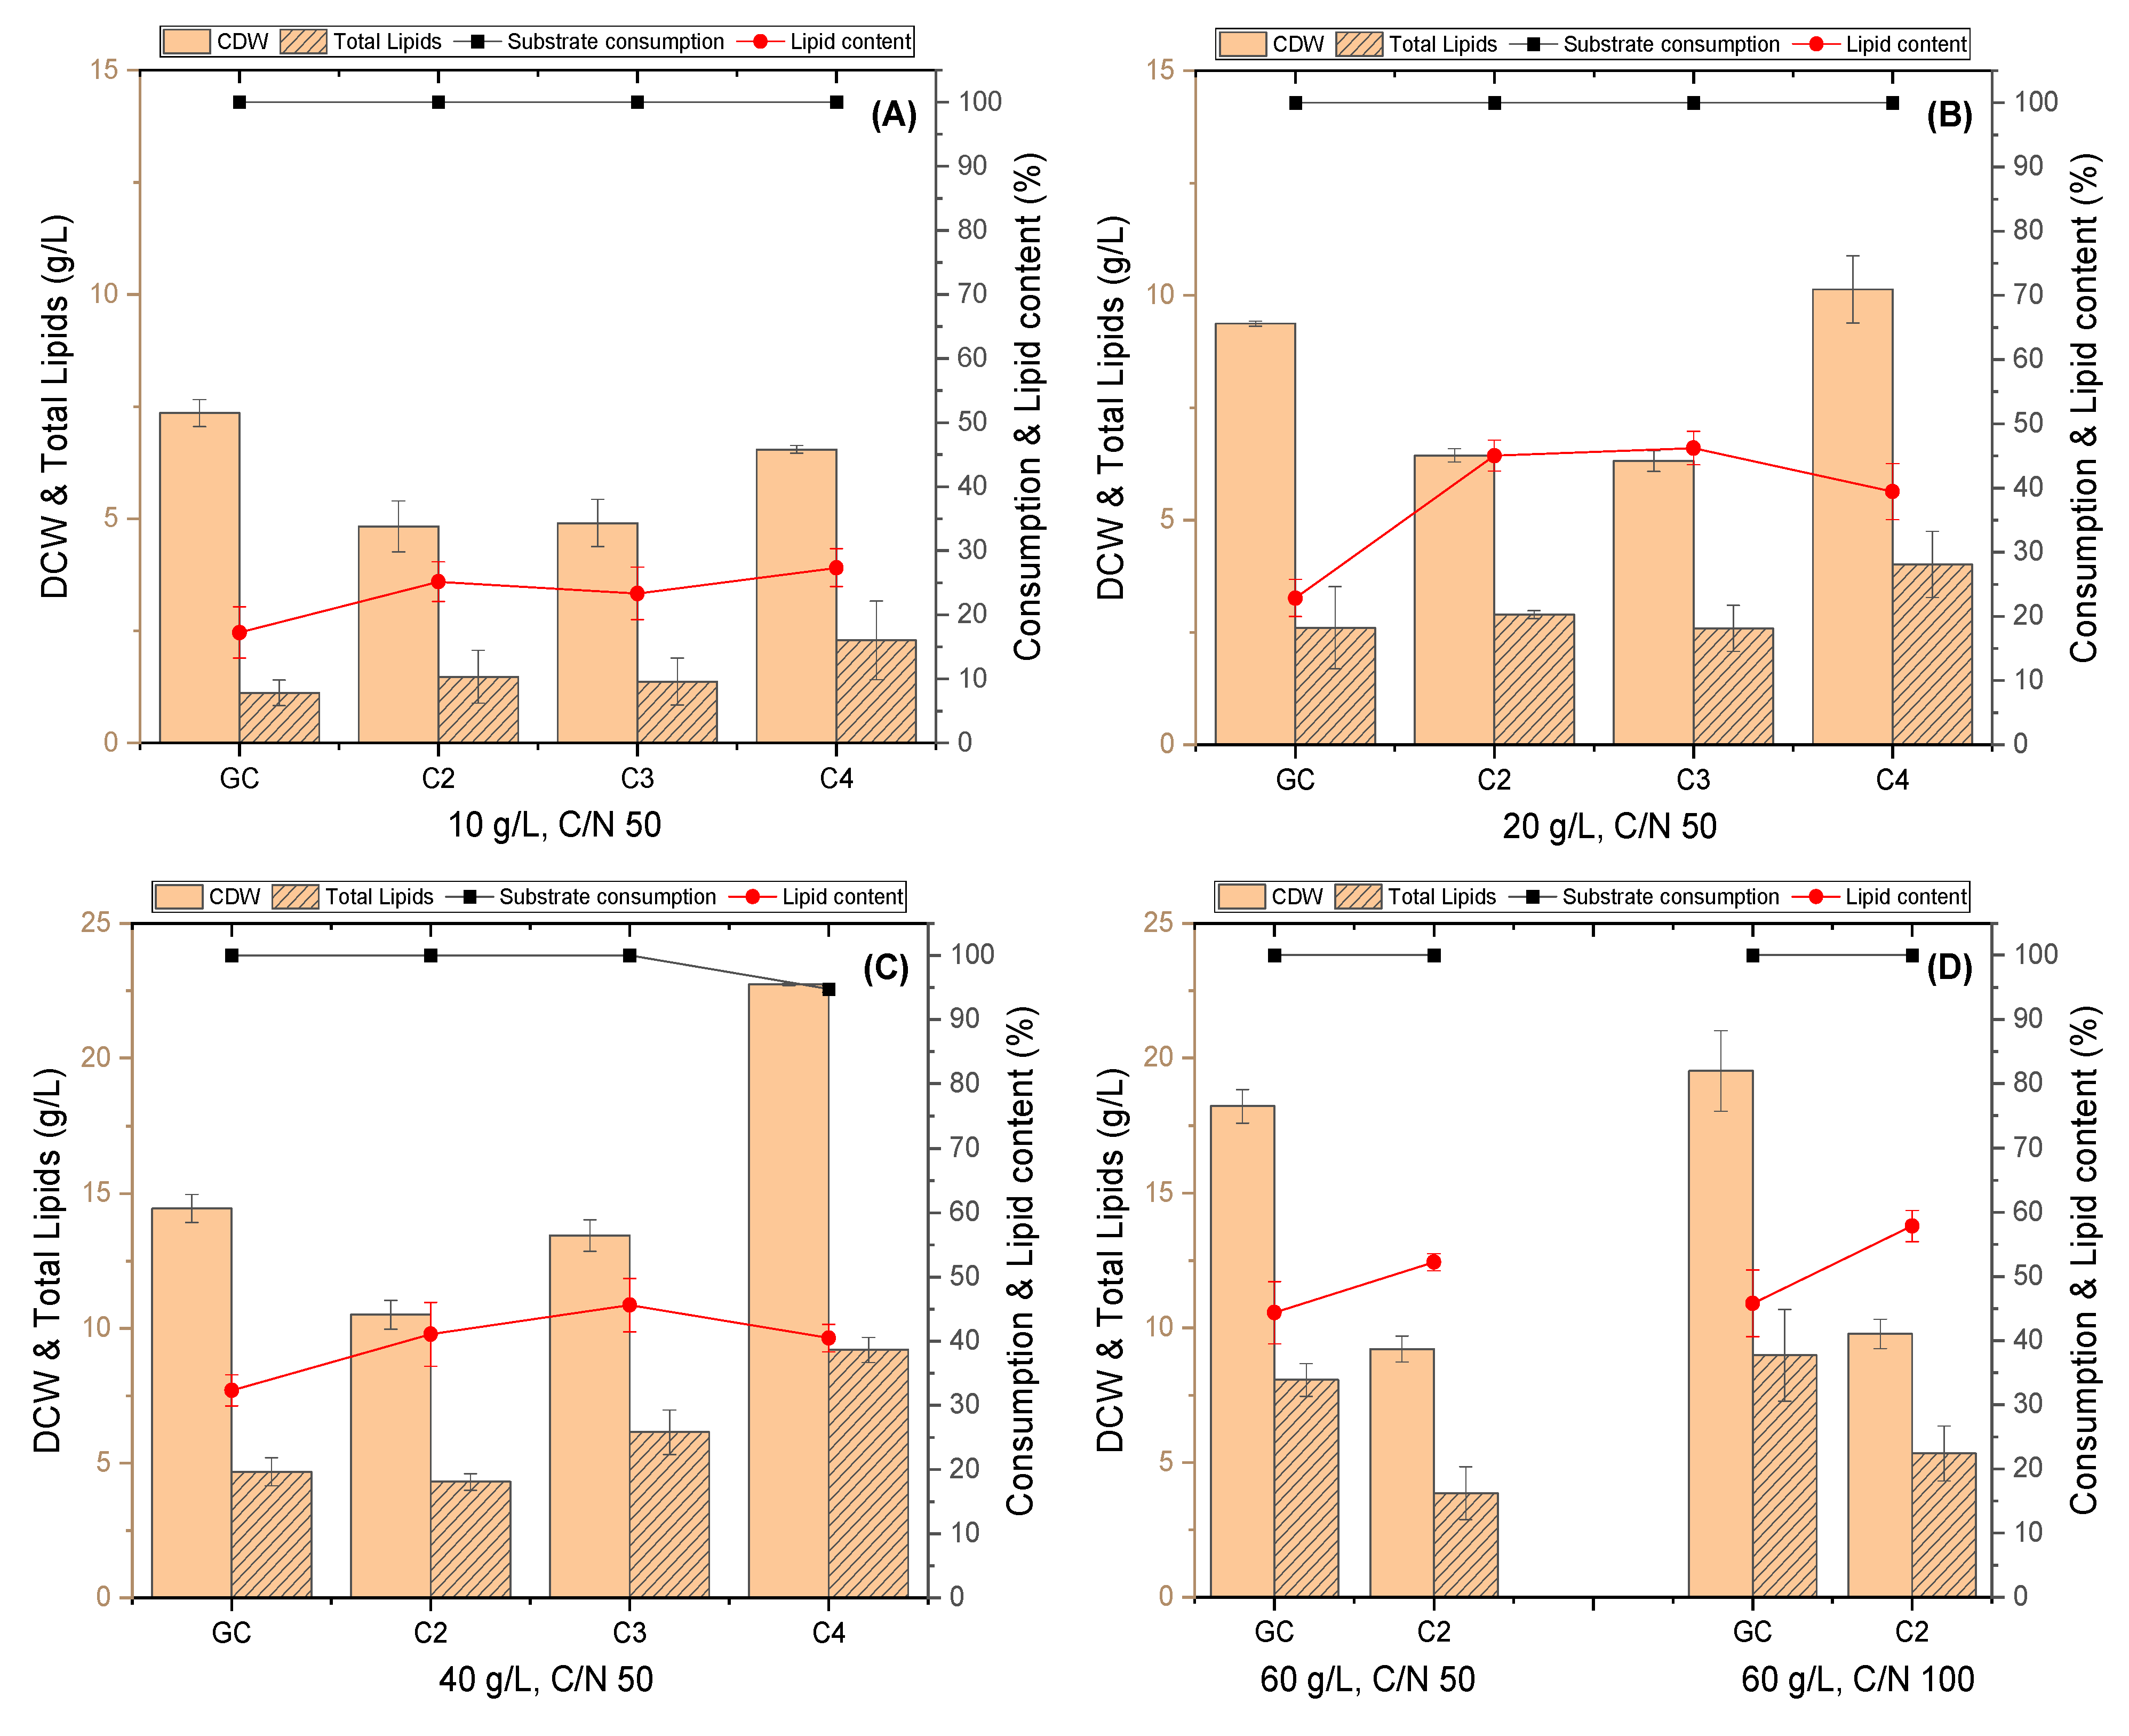
3.2. Evaluation of C. curvatus Growth on Different Concentrations of VFAs

C. curvatus appeared to tolerate higher concentrations of VFAs as can be seen by the VFA consumption (Figure 4), and biomass and lipid accumulation (Figure 5).
At an initial concentration of 10 g/L, all the three different VFAs were completely consumed (Figure 4A). Similarly with R. toruloides, acetic acid was the most favorable VFA with a growth rate close to that of glucose. Increasing the concentration to 20 g/L did not impact the ability of the yeast to completely consume all three VFAs, albeit at a slower rate. By further increasing the concentration to 40 g/L, acetic and propionic acid were completely consumed, despite at a slower rate. However, the growth of C. curvatus on butyric acid slowed down significantly, although a final consumption of 94.7% was finally reached. When the initial concentration increased to 60 g/L, acetic acid was again completely consumed, but no growth was observed with propionic and butyric acid (data not shown). Finally, to identify the upper limits of acetic acid tolerance, an initial concentration of 80 g/L was used, where the consumption of acetic acid was only 22.6% (data not shown). Increased tolerance of C. curvatus to higher concentrations of acetic acid has been previously reported [48,49]. However, the maximum concentration that the yeast could completely utilize was 30 g/L [49], while in our study, the strain tested was capable of fully consuming a double concentration of acetic acid (60 g/L). In a previous study where the tolerance of C. curvatus was tested on propionic and butyric acid [49], it was found that the highest VFAs concentration before yeast growth starts to slow down at 15 g/L for both acids. In our study, we demonstrate an increased tolerance of C. curvatus towards propionic and butyric acid up to 40 g/L initial concentration.
The lipid and biomass accumulation of C. curvatus when using VFAs as a carbon source was different than that of R. toruloides (Figure 5). Propionic and butyric acid seemed to also be favorable for the growth and lipid accumulation of C. curvatus alongside acetic acid. At 10 g/L initial carbon concentration (Figure 5A), the highest DCW was obtained with glucose (7.5 g/L), followed by butyric acid (6.5 g/L). DCW with acetic and propionic acid was similar (4.8 g/L and 4.9 g/L, respectively). The highest lipid accumulation was achieved with butyric acid (2.3 g/L) together with the highest lipid content (27.3% w/w). Acetic and propionic acid proved to be also good substrates for lipids production (1.5 g/L for C2 and 1.4 g/L for C3) with a high lipid content (25.2% w/w for C2 and 23.3% w/w for C3). With glucose as a carbon source, the lipids production was lower (1.1 g/L and 17.3% w/w) compared to VFAs. When the concentration increased to 20 g/L (Figure 5B), biomass accumulation was the highest with butyric acid (10.1 g/L), followed by glucose (9.4 g/L), and acetic and propionic acid, which resulted in similar DCW values (6.4 g/L for C2 and 6.3 g/L for C3). Even though the lipid accumulation on butyric acid was the highest (4 g/L), this was not the case with the lipid content, which was higher for propionic acid (46.2% w/w), followed by acetic acid (45% w/w) and butyric acid (39.5% w/w). It can be observed that acetic and propionic acid have a similar trend toward lipid accumulation (2.9 g/L for C2 and 2.6 g/L for C3) and content. When glucose was used as a substrate, lipid accumulation and content had the lowest values (2.6 g/L and 22.9% w/w). At 40 g/L initial concentration (Figure 5C), there was a significant increase in the DCW with butyric acid as a substrate (22.7 g/L) and the lipid accumulation was also the highest (9.2 g/L). The lipid content, however, did not increase (40.5%) when compared to that of 20 g/L butyric acid (39.5%). After butyric acid, the highest DCW was observed with glucose (14.4 g/L), and a higher DCW was obtained with propionic than with acetic acid (13.4 g/L and 10.5 g/L, respectively). Propionic acid resulted in the highest lipid concentration (6.1 g/L) after butyric acid, followed by glucose (4.7 g/L) and acetic acid (4.3 g/L). The lipid content, however, had a different trend, with propionic acid having the highest value (45.6% w/w), followed by acetic acid (41.1% w/w), butyric acid (40.5% w/w), and lastly, glucose (32.3% w/w). At 60 g/L (Figure 5D) and C/N 50, the DCW and lipids for glucose (18.2 g/L and 8.1 g/L, respectively) were double than acetic acid (9.2 g/L and 3.9 g/L, respectively). However, acetic acid had higher lipid content than glucose (52.2% w/w for C2 and 44.4% w/w for GC).
When the C/N ratio increased to 100 for 60 g/L, the substrate consumption of C. curvatus with glucose and acetic acid had the same response as R. toruloides. Specifically, a slower consumption rate was observed for both substrates compared to C/N 50. Additionally, the biomass accumulation was similar to that with C/N 50 (19.5 g/L for glucose and 9.8 g/L for C2), but the lipid accumulation and lipid content increased for both substrates. For glucose, the lipid accumulation increased to 9.0 g/L, and the lipid content to 45.8% w/w. For acetic acid, the increase was bigger, and lipid concentration reached 5.3 g/L, while the lipid content increased to 57.9% w/w, which is also the maximum lipid content for acetic acid among all the tested conditions.
The aforementioned observations are supported by the biomass and lipid yields that are depicted in Figure 6. By increasing the carbon source concentration for C. curvatus, the biomass yield on glucose and acetic acid decreases (Figure 6A). The lipid yield (Figure 6B) on glucose remained relatively stable through 10–40 g/L and it increased at 60 g/L, where it reached a maximum with a C/N 100 (0.15 g/gsubstrate). For acetic acid, the lipid yield had the highest value at 10 g/L (0.15 g/gsubstrate) and thereafter it decreased when the concentration increased. For propionic and butyric acid, a decrease in the biomass and lipid yield is observed when increasing from 10 g/L to 20 g/L, but a further increase in the yields was observed when the concentration increased to 40 g/L. It is worth noting that for C. curvatus, the biomass and lipid yields have the highest values for butyric acid (0.23 g/gsubstrate; lipid yield) compared to the other VFAs, but also compared to glucose, which signifies that there is a higher conversion to cell biomass and lipids when butyric acid is used as a substrate. This observation has been previously reported by Zeng et al. and Liu et al. [49,50]. The findings of this study indicate that butyric acid in concentrations up to 40 g/L is more beneficial for biomass and lipid accumulation for C. curvatus among the tested VFAs.

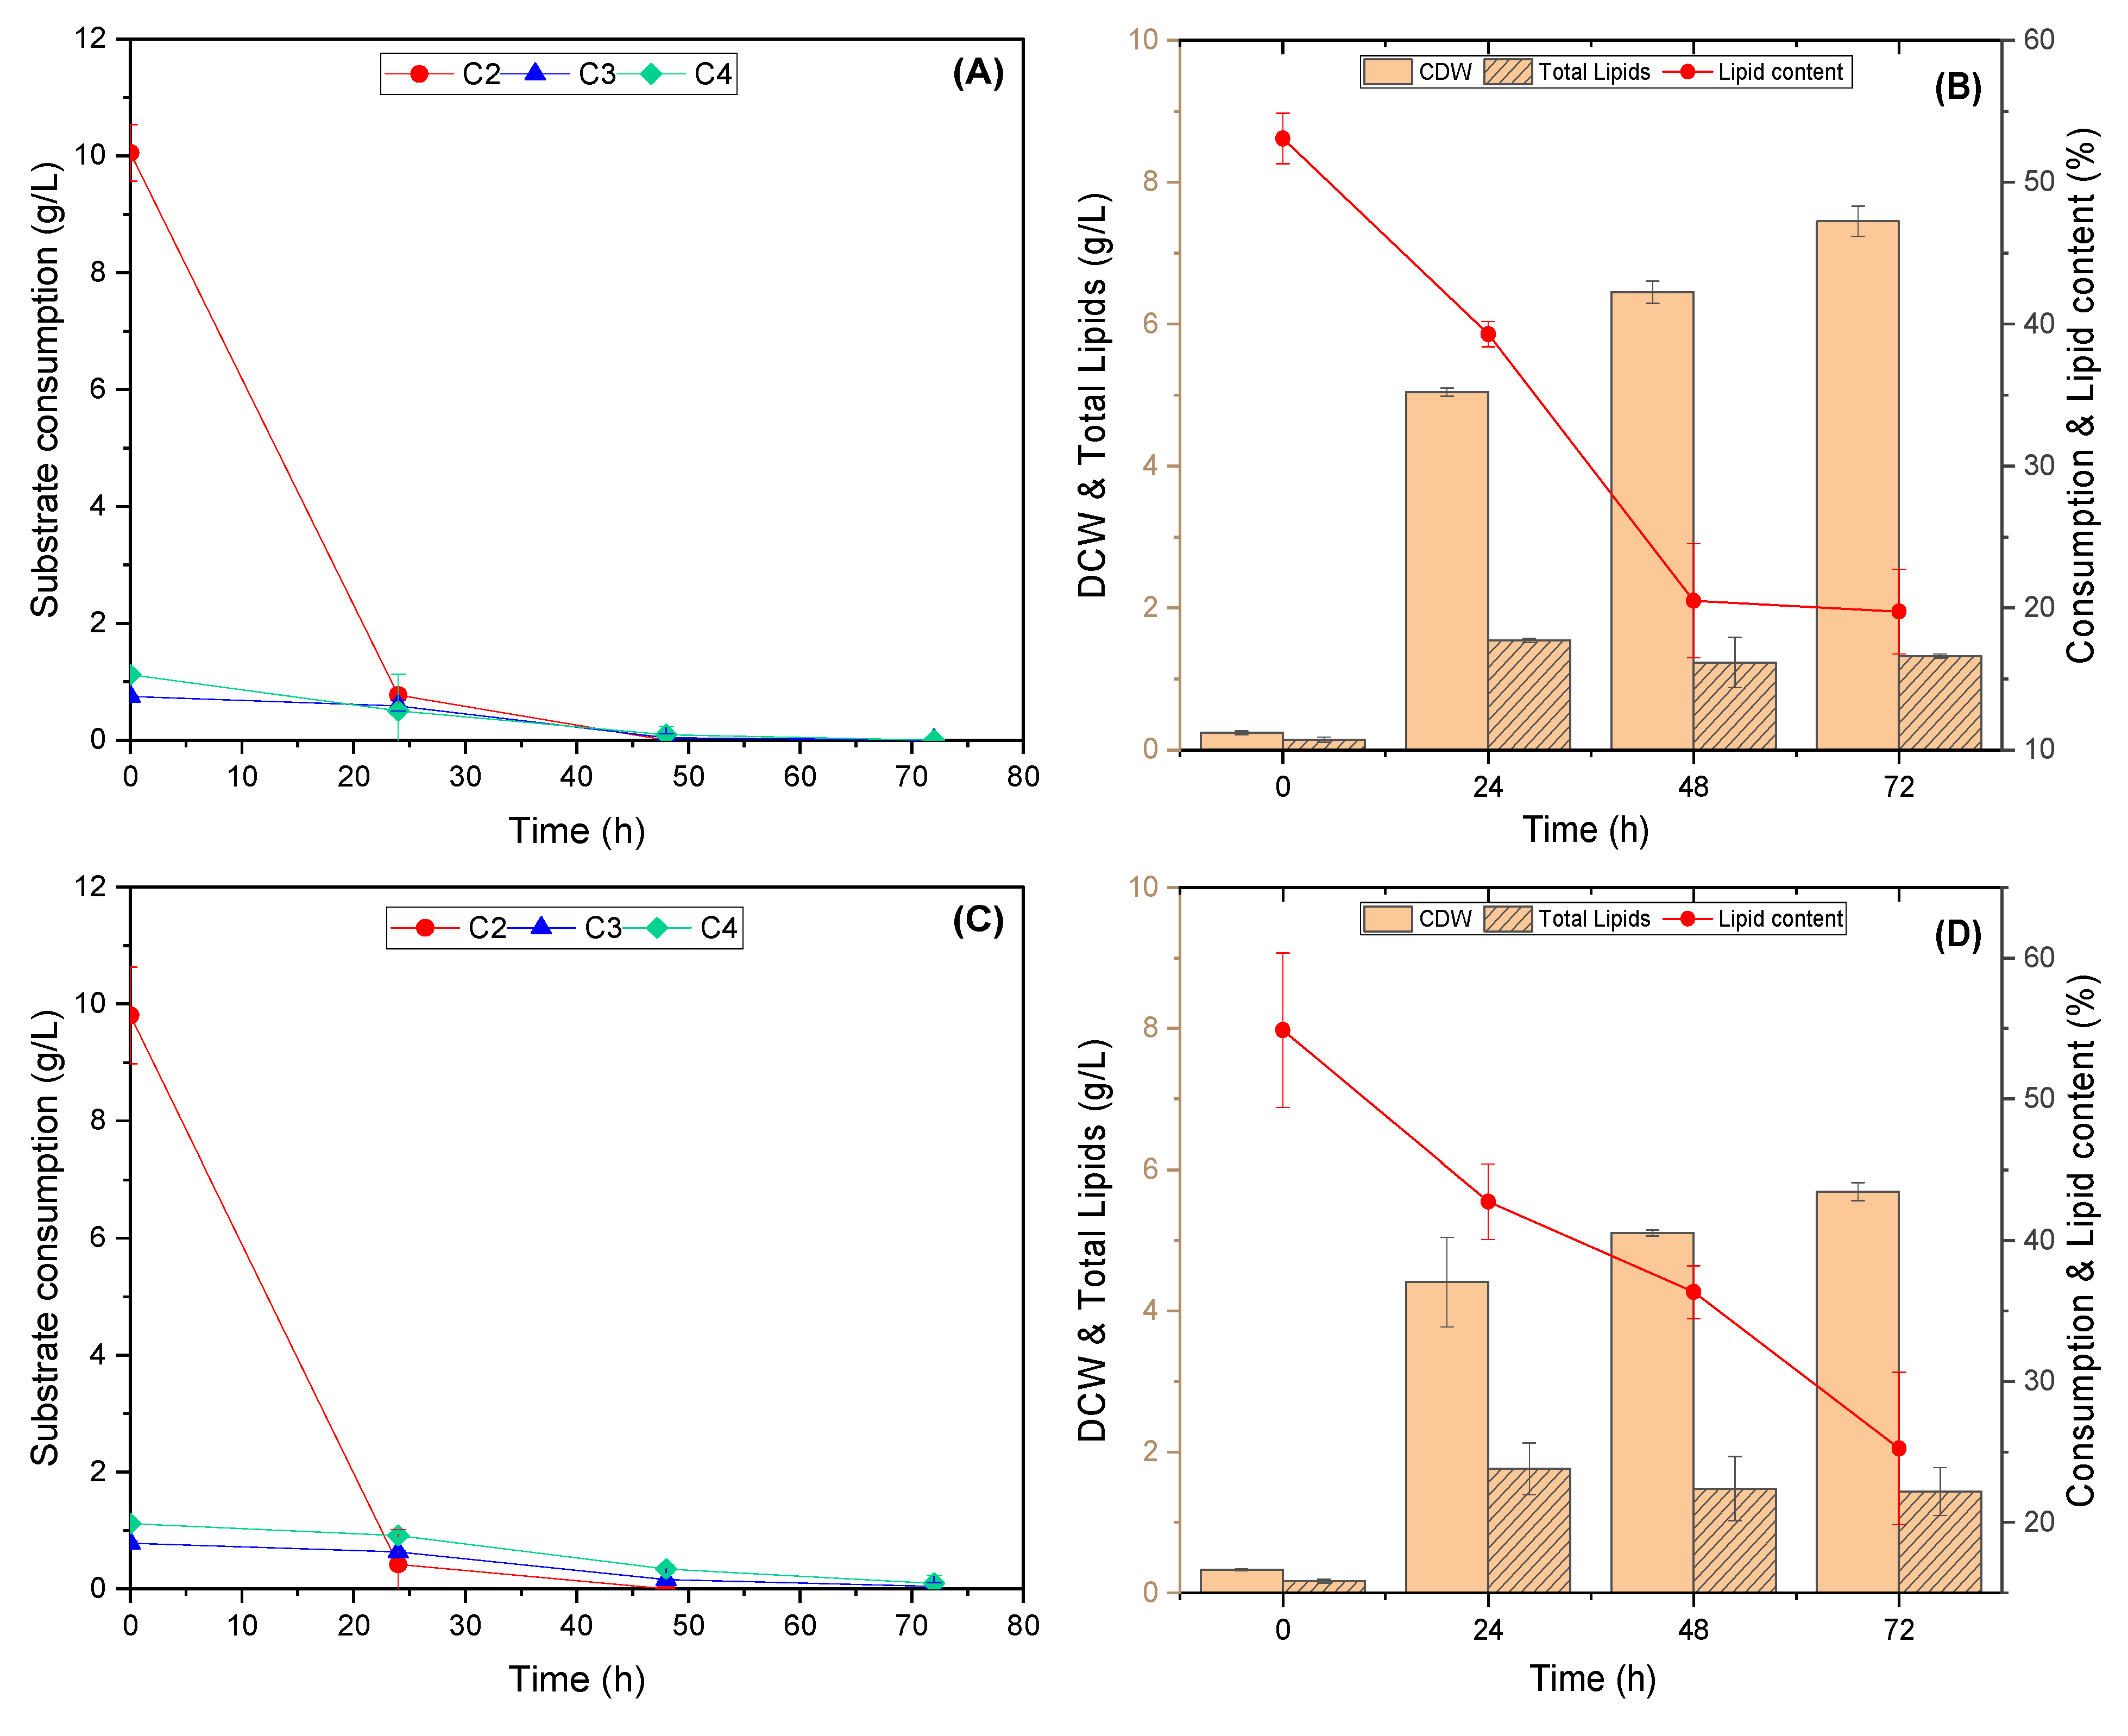
3.3. Evaluation of the Yeasts’ Growth on VFAs Derived from the Acidogenic Fermentation of BSG

VFAs produced from BSG acidogenic fermentation were tested as a cost-competitive raw material for the production of lipids from oleaginous yeasts. The VFAs effluent contained in total 12.1 g/L of short-chain VFAs (10.1 g/L C2, 0.8 g/L C3, 1.2 g/L C4). The higher amount of acetic acid as compared to the low amounts of propionic and butyric acid is beneficial for the growth of the yeasts, while the absence of long-chain VFAs reduces any potential inhibitory effect [51].
Both C. curvatus (Figure 7A) and R. toruloides (Figure 7C) could utilize the VFAs mixture, with acetic acid being consumed at a faster rate than propionic and butyric acid, as expected by the results when individual VFAs were tested. Biomass production reached a maximum concentration at 72 h, which was 7.4 g/L for C. curvatus (Figure 7B) and 5.7 g/L for R. toruloides (Figure 7D). It is worth noting that for both yeasts, higher biomass concentration was achieved on the acidogenic effluent as compared to the synthetic media with 10 g/L of acetic acid. Specifically, the increase in the DCW was 54% for C. curvatus and 21% for R. toruloides. The above observation suggests that the VFA effluent has very good potential for the growth of the yeasts. One explanation as to why the increase was higher for C. curvatus can be due to the higher preference of this strain to produce high amounts of biomass with butyric acid as a substrate compared to R. toruloides. Therefore, the combination of acetic together with butyric acid, even in low concentration, leads to an improvement on the conversion towards biomass accumulation for this yeast species.
The lipid concentration reached its highest value in 24 h of cultivation for both yeasts (1.8 g/L for RT and 1.5 g/L for CC) (Figure 7B,D). The same is observed for the lipid content, with R. toruloides having 42.8% w/w and C. curvatus with 39.3% w/w. After this point, the lipid concentration declined, despite a steady increase in DCW being observed. That can be attributed to the rapid consumption of the VFAs within 24 h of cultivation. Moreover, when VFA effluent was used, the lipid accumulation and lipid content for both yeasts improved compared to 10 g/L acetic acid as synthetic media. Specifically, an increase in the lipid concentration was observed for both yeasts, however, this was considerably higher for R. toruloides (4.2% for CC and 57% for RT). The lipid content increased 56% for C. curvatus and 54% for R. toruloides, respectively. This can be explained again due to the different substrate preferences of the two strains. As indicated earlier, R. toruloides has higher lipid yield when acetic acid is used as a substrate, while for C. curvatus, this is the case when butyric acid is used. Therefore, since the VFA effluent contains higher amounts of acetic acid, the produced lipids for C. curvatus are not expected to have such a significant improvement. C. curvatus would benefit more regarding lipids formation by a higher content of butyric acid in the composition of the VFA effluent.
As supported by other studies [3,52,53,54], it can be concluded that the use of VFAs derived from the digestion of a variety of waste sources, containing a mixture of different VFAs in varying ratios, can support the biomass and lipid accumulation of the yeasts. In this study, the effect of VFAs derived from BSG, which contained a mixture of acetic, propionic, and butyric acid was tested and the acquired results were compared to previous studies using synthetic or waste-derived VFAs as carbon sources for the growth of C. curvatus and R. toruloides and are summarized in Table 1 and Table 2.

3.4. Single-Cell Oil (SCO)

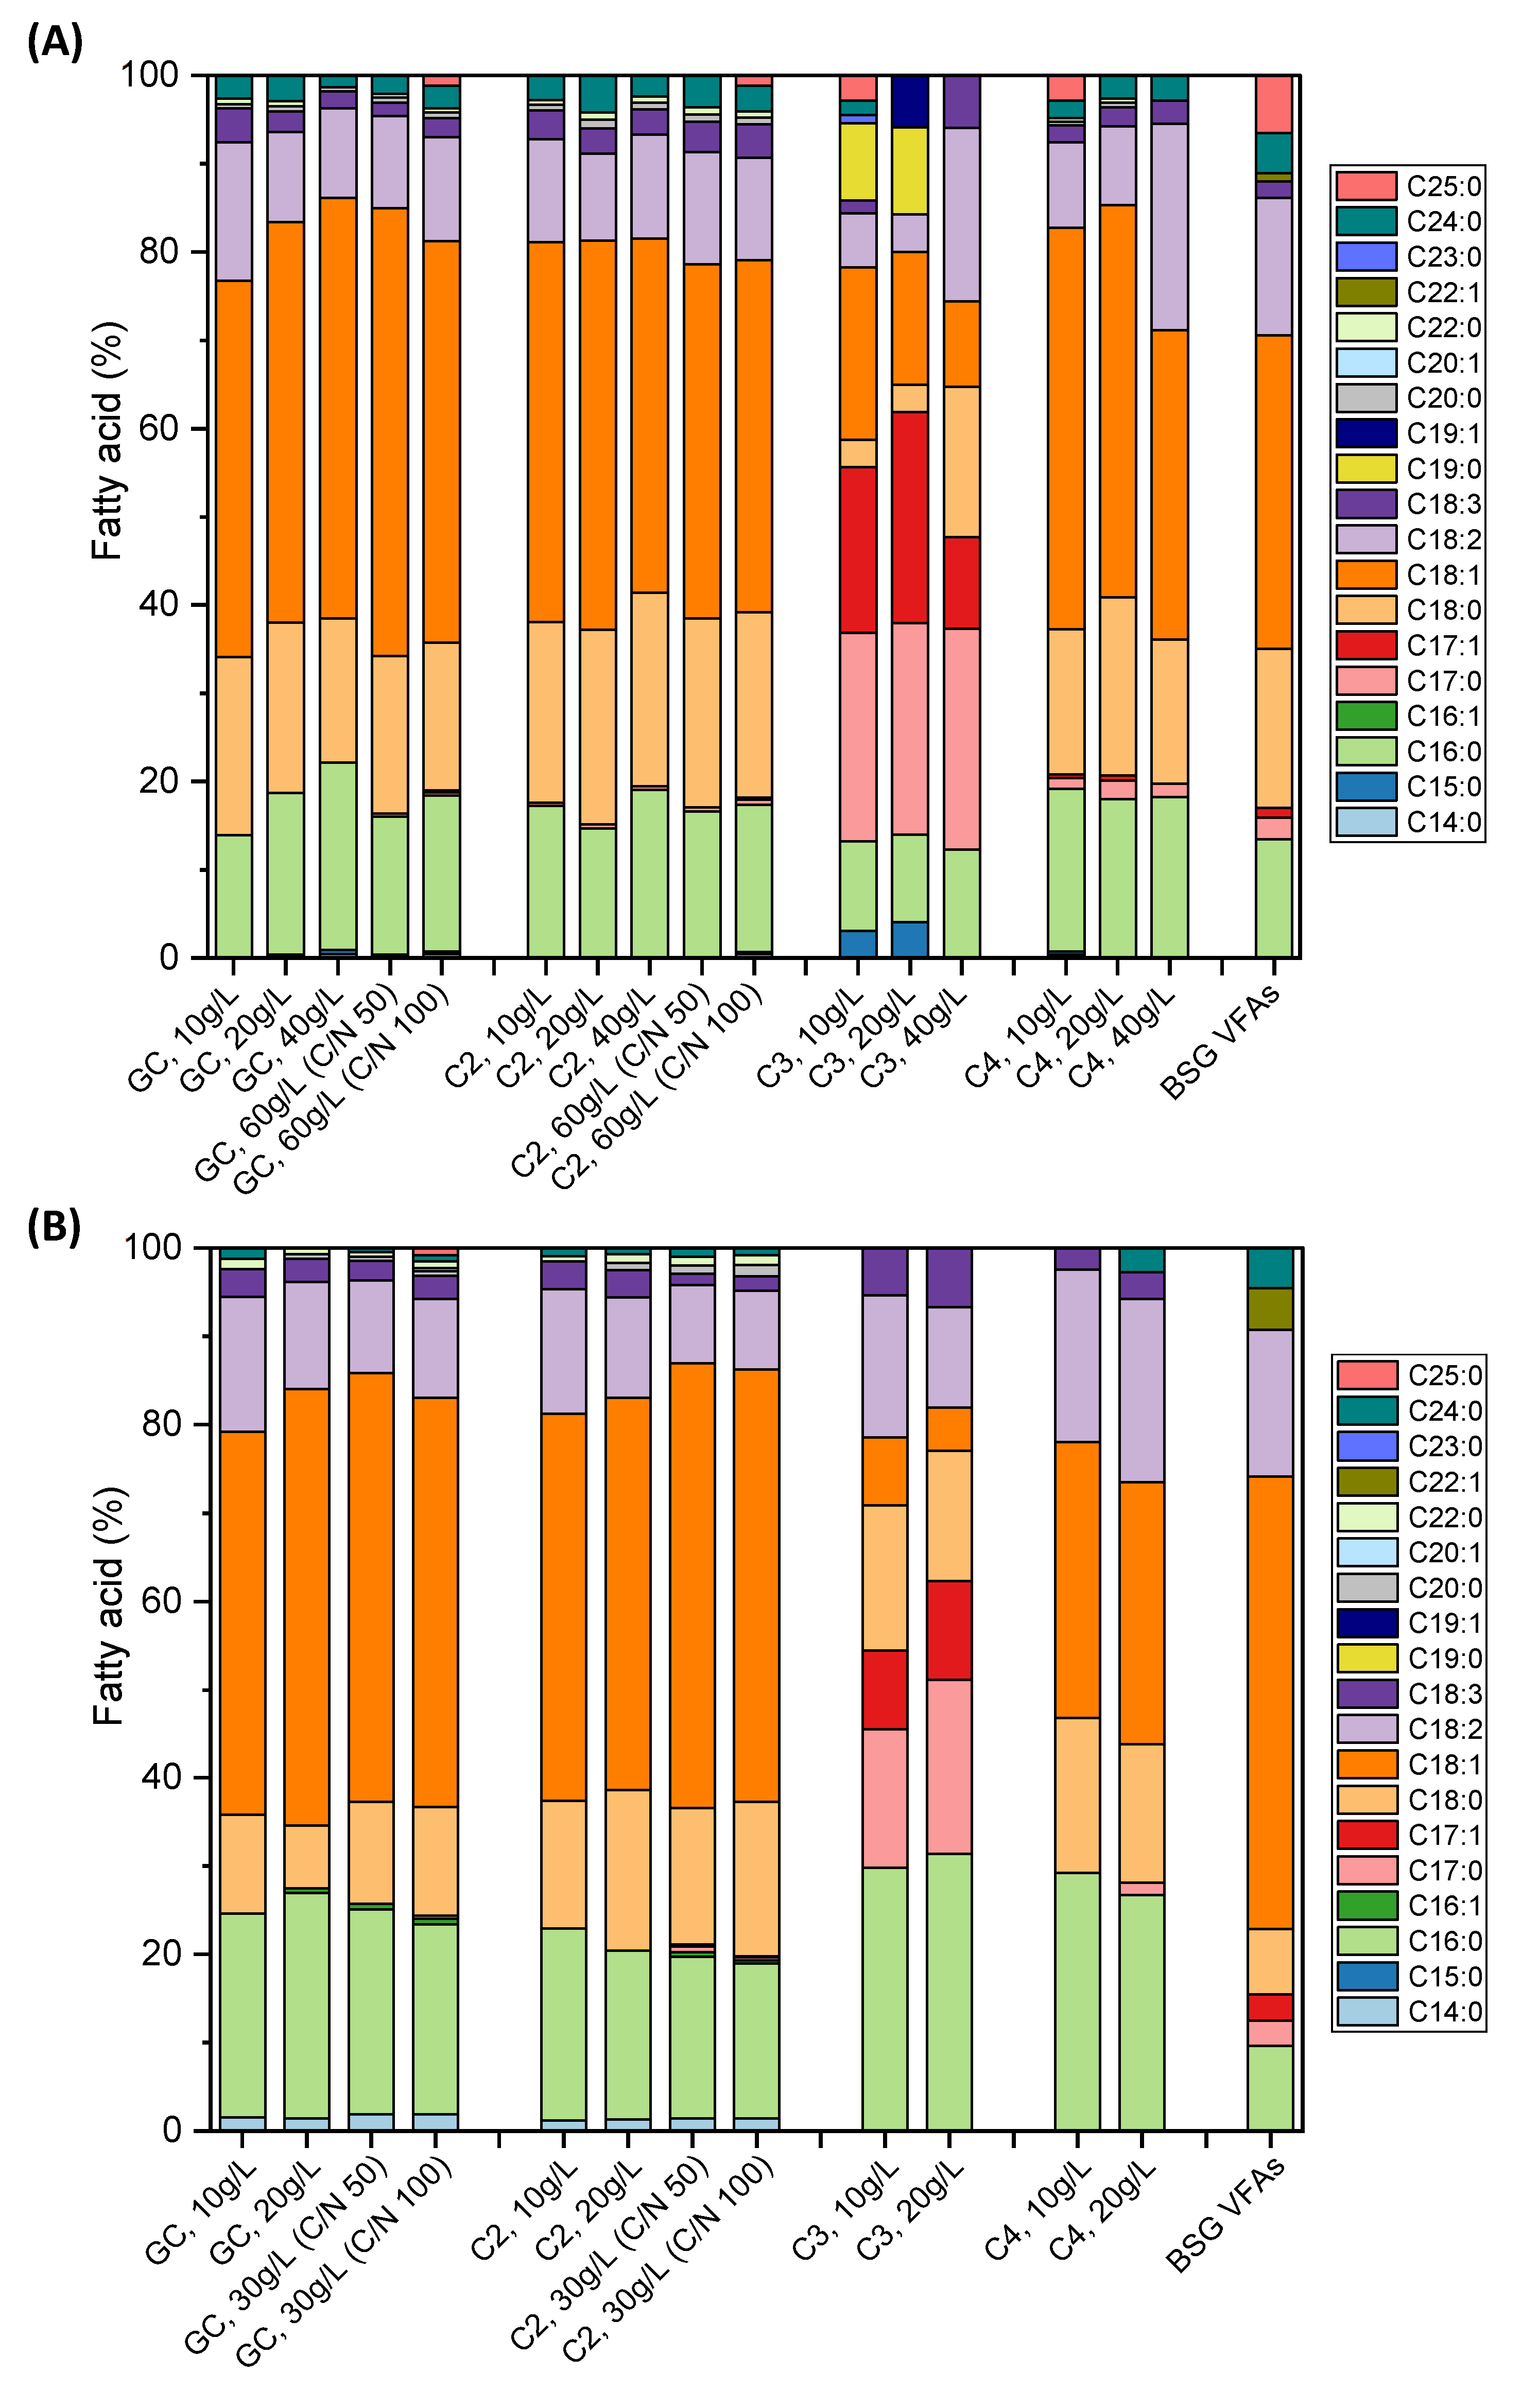
3.4.1. Fatty Acid Composition of the SCO
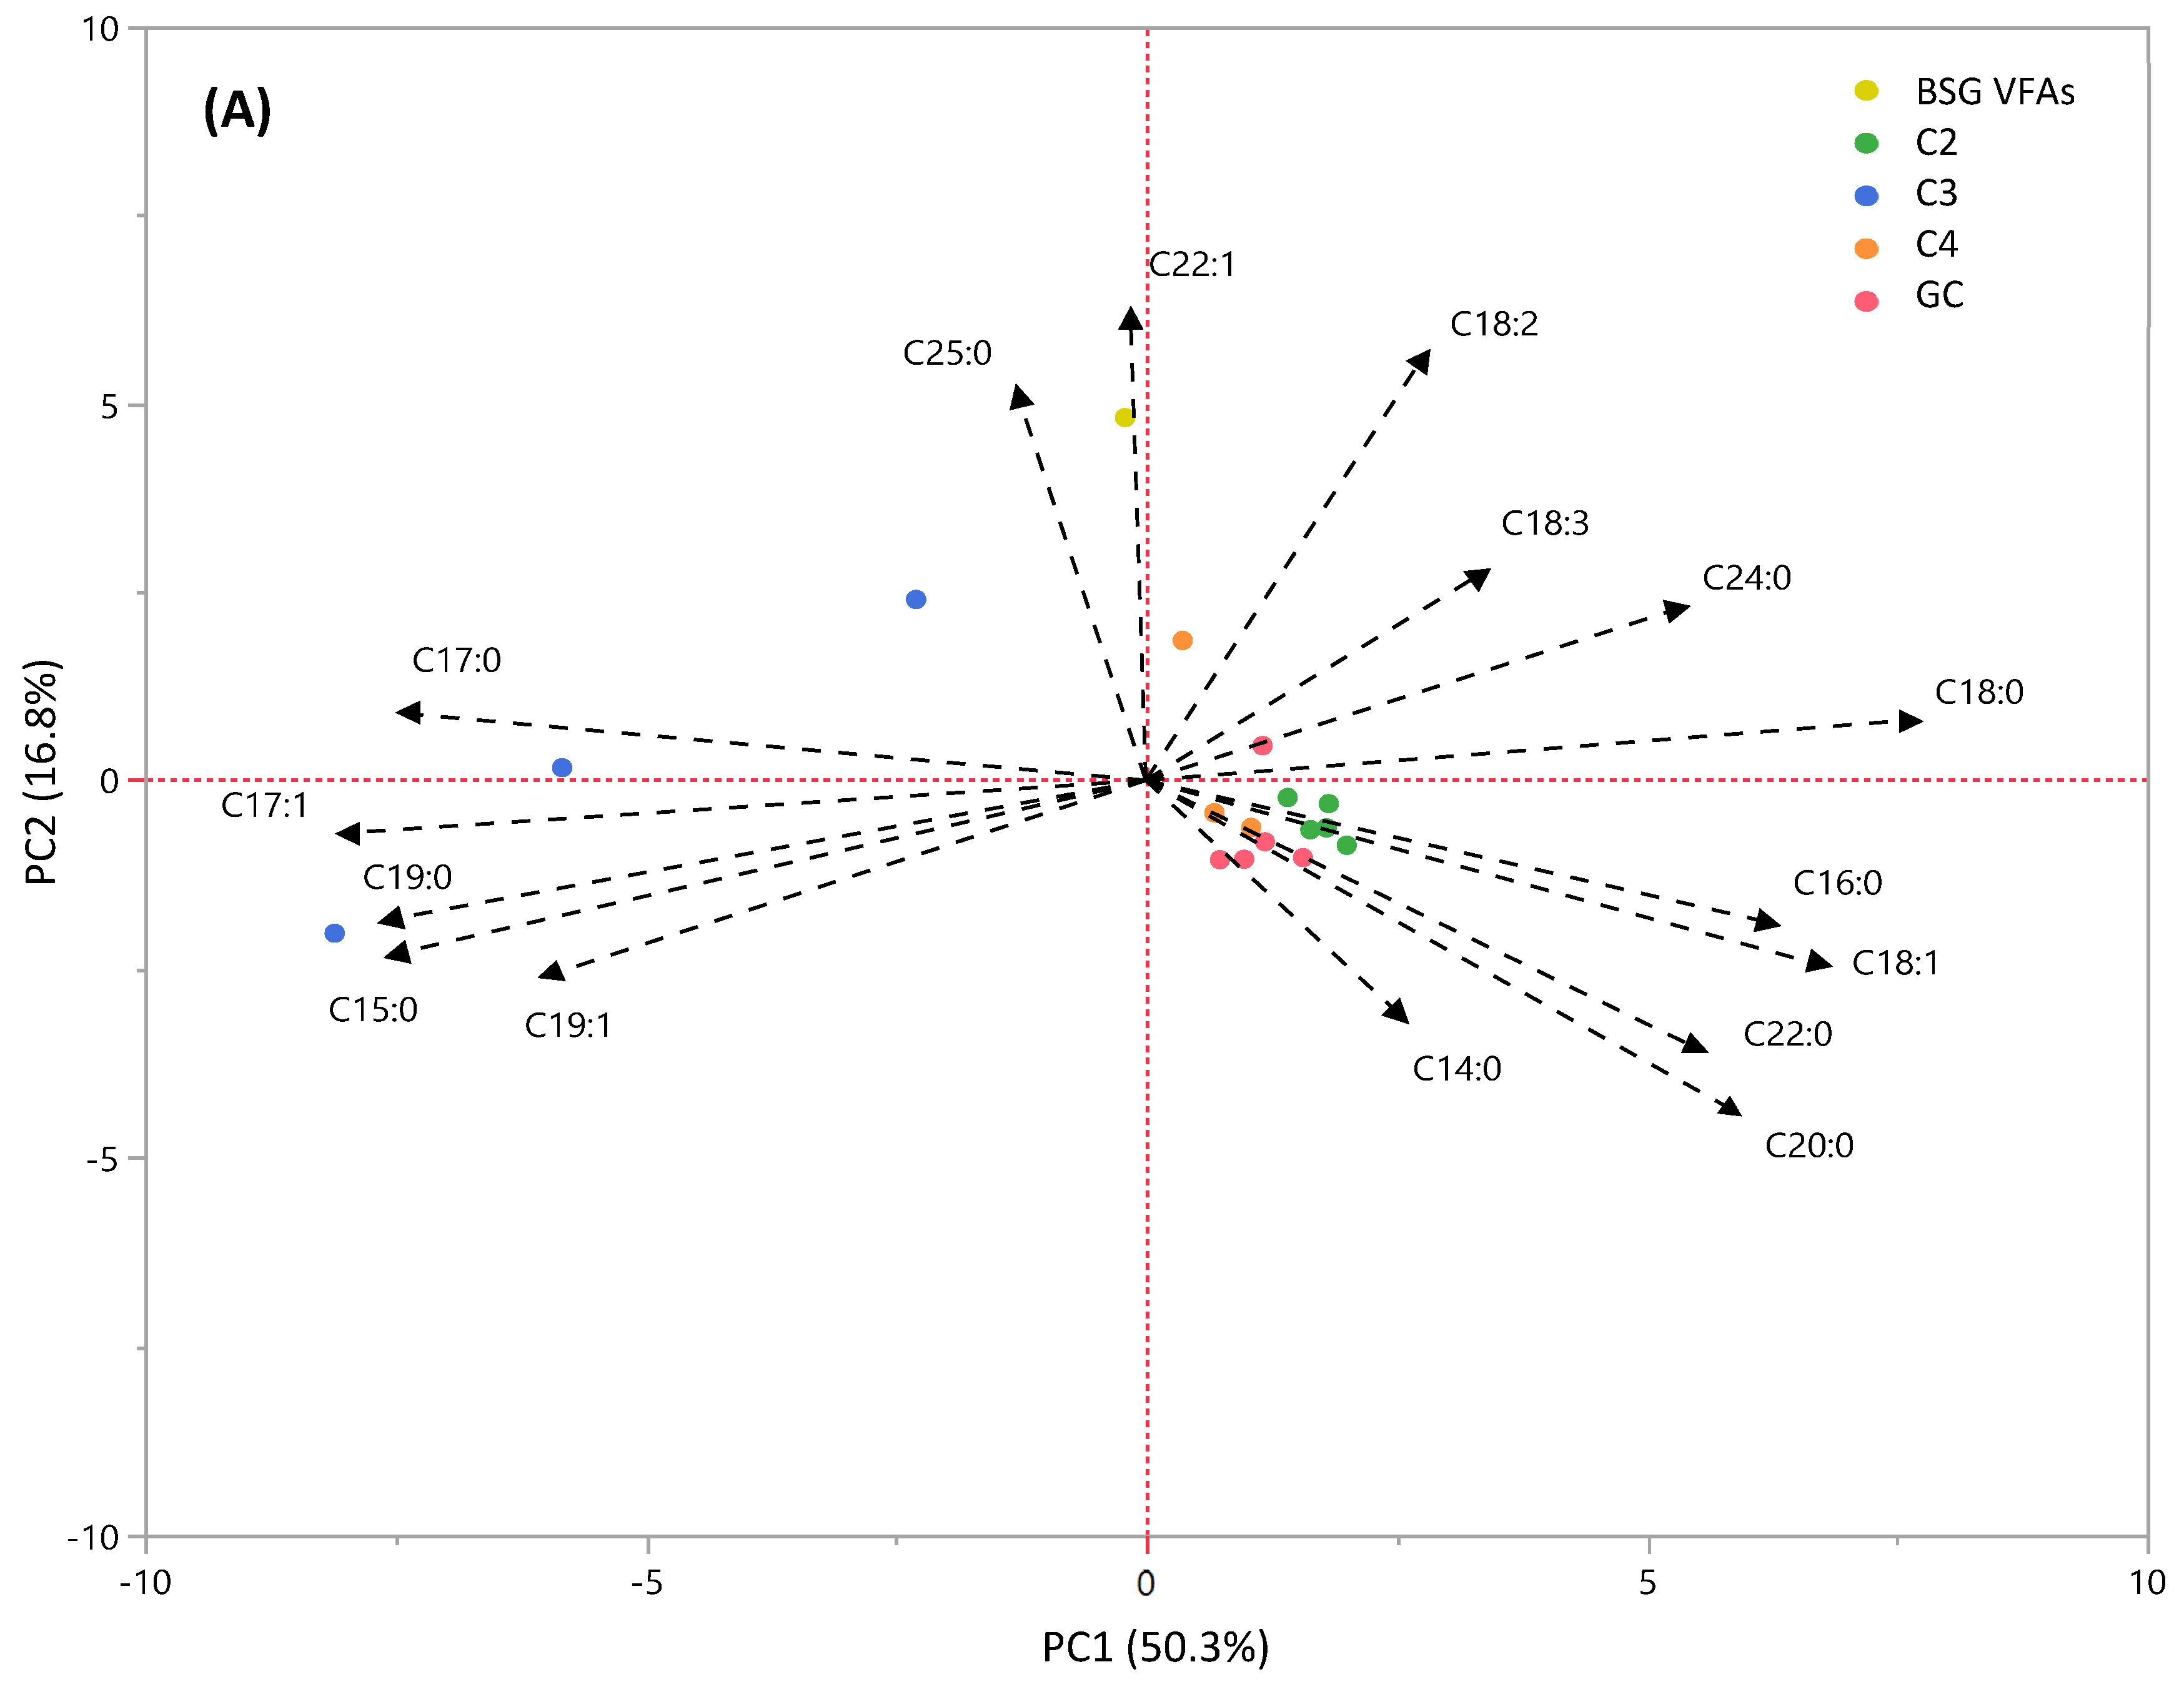
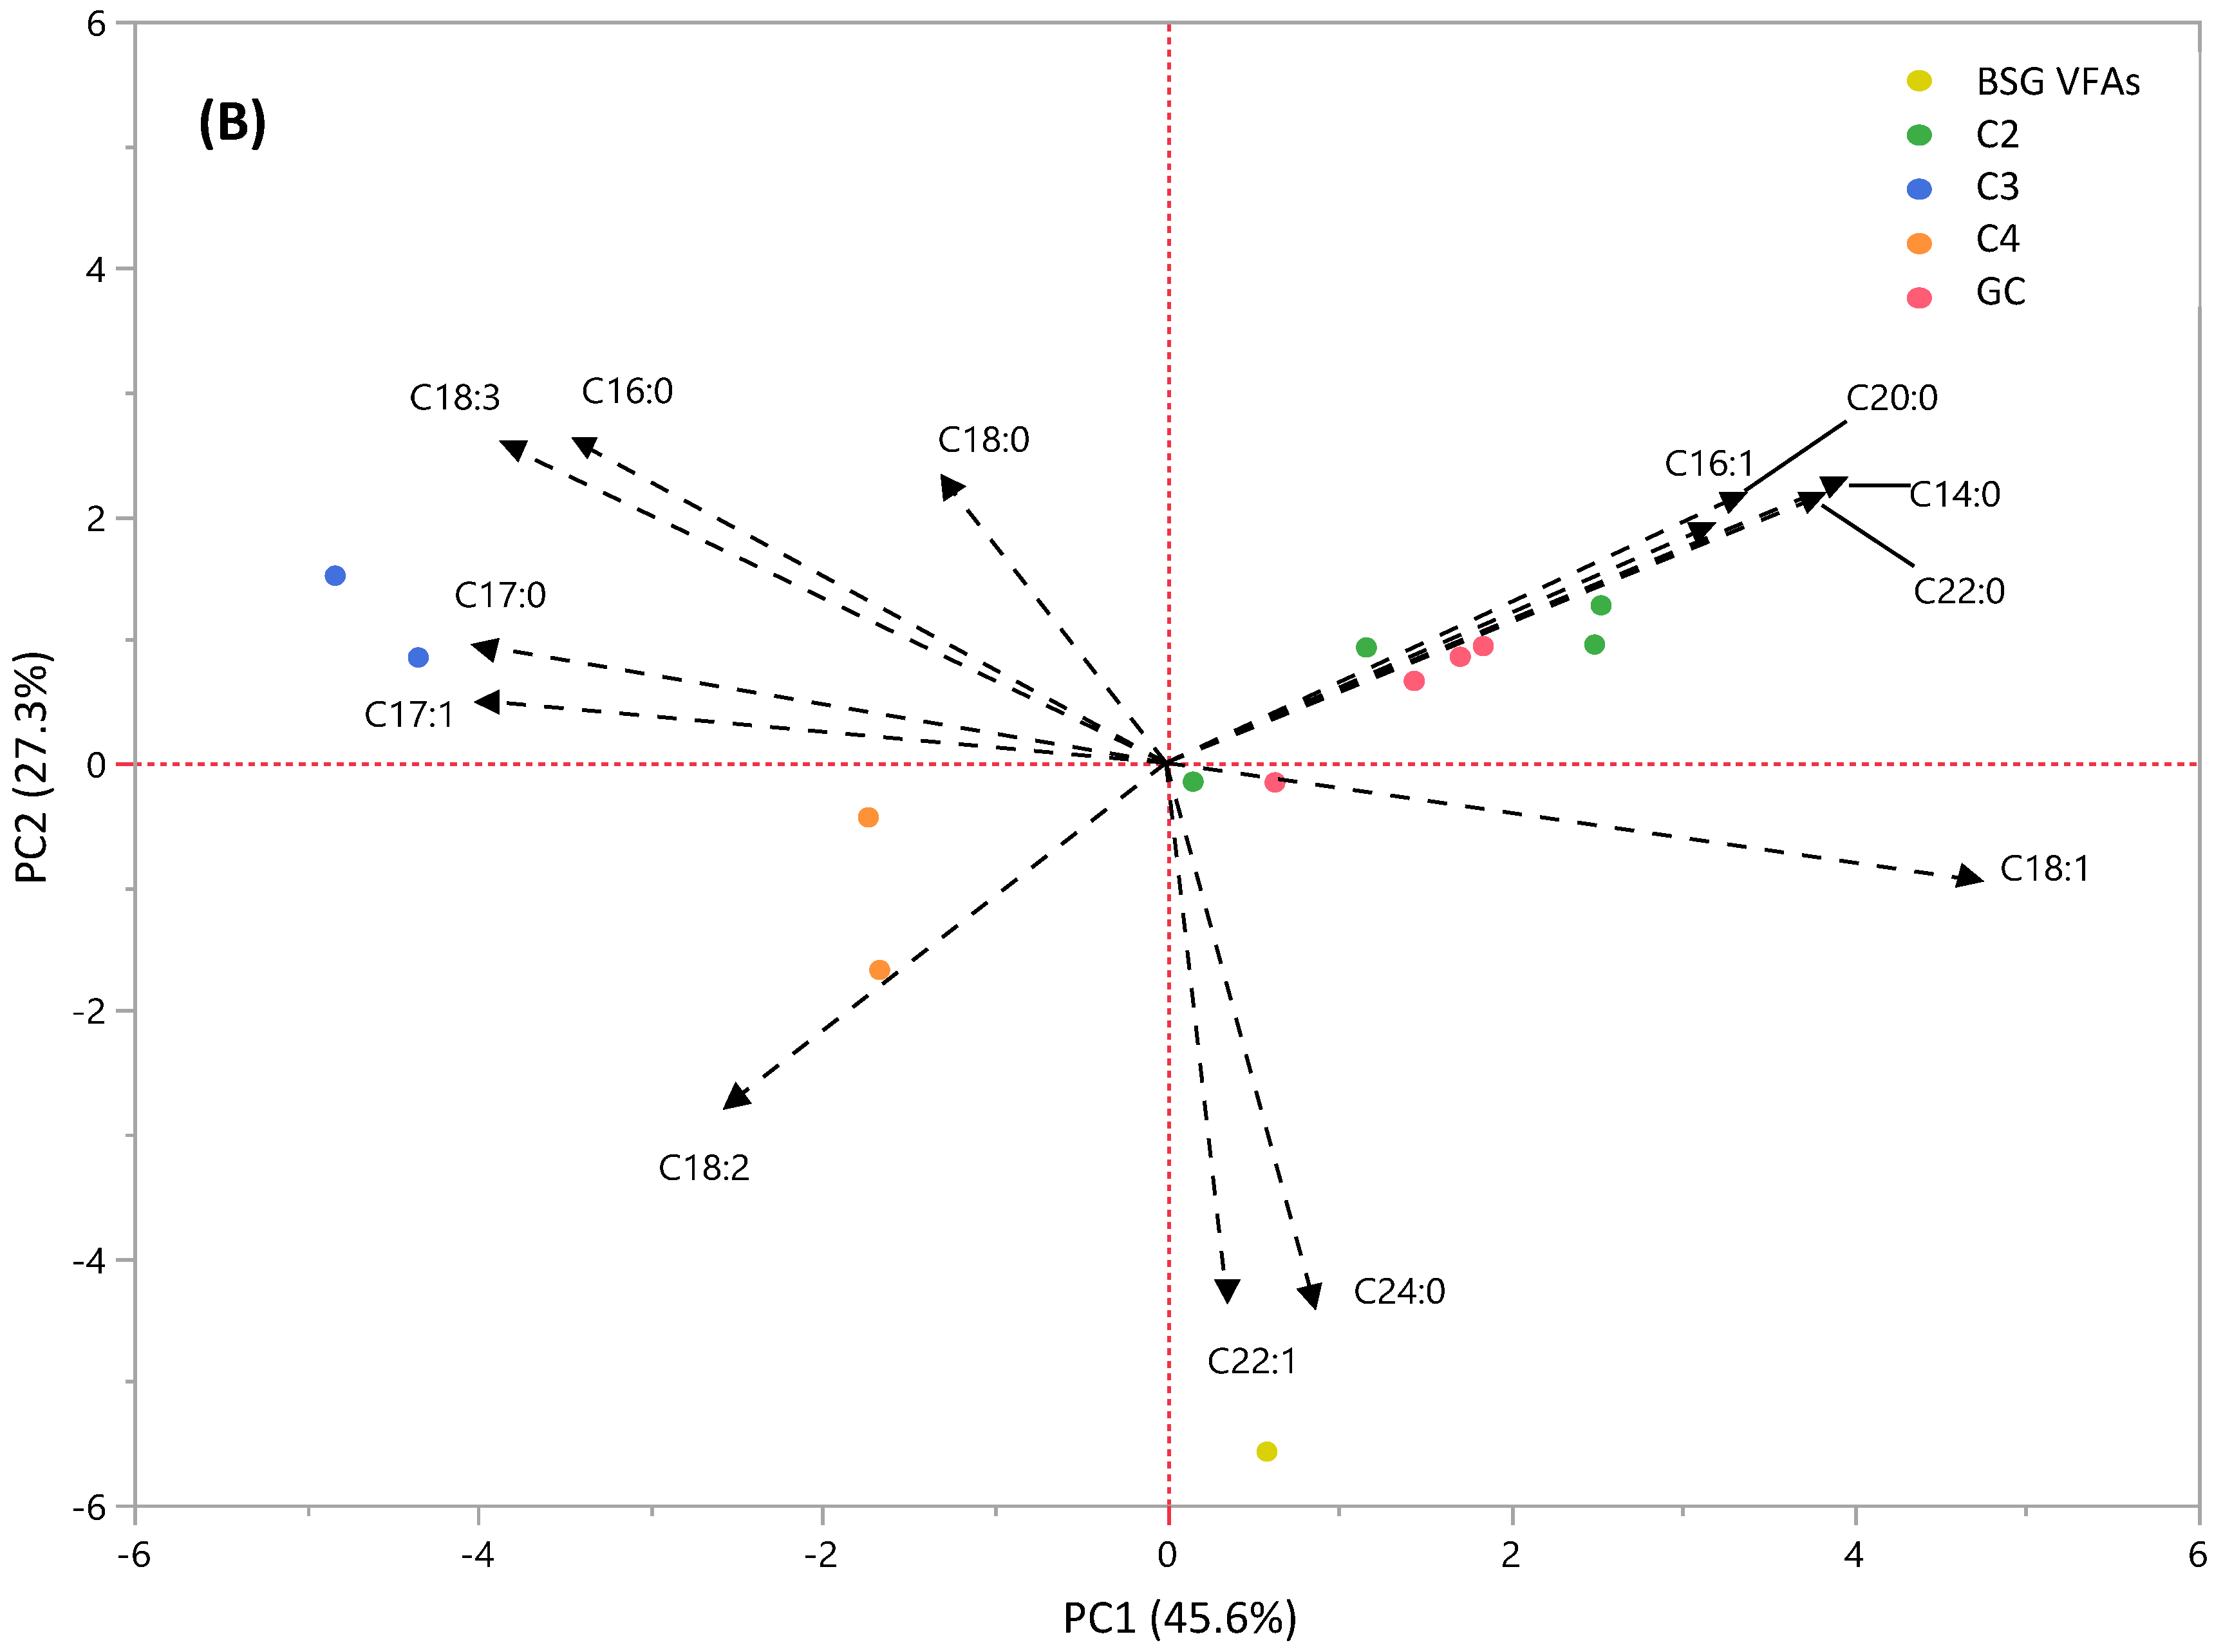
The fatty acid profile of the two yeasts is depicted in Figure 8 and is mainly comprised of palmitic acid (C16:0) (9.3–31.4%), stearic acid (C18:0) (3.0–22.0%), oleic acid (C18:1) (4.8–50.65%), and linoleic acid (C18:2) (4.3–23.4%). This composition is in accordance with previous studies that showed an abundance of C18 and C16 fatty acids [3,46,48,49,52,53,54,55,57,58,59,60]. Although the fatty acid profiles had similar major fatty acids alongside the tested conditions, an impact of the carbon source on the fatty acids was observed. For R. toruloides, a small amount of myristic acid (C14:0) was observed (up to 1.8%) when glucose and acetic acid are used as substrates. Additionally, the fatty acids for R. toruloides showed a higher abundance of palmitic acid (C16:0) compared to C. curvatus, which contained higher amounts of stearic acid (C18:0) instead. Increased production of margaric acid (C17:0) (up to 25%) and heptadecenoic acid (C17:1) (up to 23.9%) was noted when propionic acid was used as a substrate, which was higher for C. curvatus than for R. toruloides. The oleic (C18:1) and linoleic (C18:2) acid content was similar between the two yeasts.
It is worth noting that when acetic and butyric acid were used as carbon sources for the growth of C. curvatus, there was an increased formation of the long-chain fatty acid lignoceric acid (C24:0) (1.9–4.6%) compared to glucose (1.3–2.9%) and to the lignoceric acid produced by R. toruloides (0.4–1.2%). Small production of lignoceric acid was also reported in another study using acetic acid to test the growth of C. curvatus [60] and R. toruloides [46]. For C. curvatus, a small production of pentacosanoic acid (C25:0) (up to 6.5%) was also noted in some cases. The shift from a C/N ratio of 50 to 100 for glucose and acetic acid did not result in changes in the fatty acid profile for either yeast. The same observation was previously reported by Beligon et al. [58].
When waste-derived VFAs were used, a small production of margaric acid (C17:0) (2.5%) and heptadecenoic acid (C17:1) (1.0%) was noticed in C. curvatus, which is due to the presence of propionic acid, together with a higher amount of lignoceric acid (4.6%) and pentacosanoic acid (6.5%). R. toruloides had a similar fatty acid profile to C. curvatus, with a production of margaric acid (2.7%) and heptadecenoic acid (2.9%). In addition, there was a higher production of lignoceric acid (4.3%) as well.
Table 3 shows the levels of saturated fatty acids (SFAs), monounsaturated fatty acids (MUFAs), and polyunsaturated fatty acids (PUFAs) for both yeasts and all the tested conditions. In all cases, when propionic acid was used as a carbon source, the produced lipids had a higher percentage of SFAs (50.9–65.9%) and the lowest MUFA content (16.0–16.6% for RT and 20–44.8% for CC). When BSG VFAs were used, the lipids produced by C. curvatus had higher amounts of SFAs (45.1%), while the lipids produced by R. toruloides had higher amounts of MUFAs (57.2%).

3.4.2. PCA Analysis

PCA was employed to further investigate the effect of the different VFAs on the fatty acid composition of SCO. PCA biplots are shown in Figure 9A for C. curvatus and in Figure 9B for R. toruloides. The biplots occur as a combination of the loading plot together with the score plot. The plots represent the two-dimensional projection of the samples which contain the main principal components (PCs) as the newly constructed axes. The PCs are a new set of orthogonal axes that are uncorrelated but display the variation present in the original variables since they occur as a linear combination of the latter. For instance, the first two PCs capture the maximum variation of the original variables and are usually enough for descriptive purposes. For C. curvatus, PC1 retained 50.3% of the variance, while PC2 16.8%, accounting for a total of 67.1% variance. For R. toruloides, PC1 retained 45.6% of the variance, while PC2 27.3%, resulted again in a total of 72.9% variance. The correlation between the variables is described by the loading factors.
For instance, PC1 for C. curvatus better differentiated the samples according to the following fatty acids (factor loadings higher than 0.7): positive direction; C18:0, C18:1, C16:0, C20:0, negative direction; C17:1, C19:0, C15:0, C17:0, C19:1. On the other hand, PC2 better separated the samples according to the following fatty acids (factor loadings higher than 0.5): positive direction; C22:1, C18:2, C25:0, negative direction; C20:0. The positive or negative direction of the factor loadings indicates that a factor will be higher in the respective axis of that PC. For example, C18:0 has a high positive loading on PC1, therefore the samples located in that part of PC1, like glucose, acetic acid, and butyric acid (pink, green, and orange scores, respectively) will contain higher amounts of C18.0, while propionic acid (blue scores) will contain lower amounts of C18.0, but higher amounts of C17:1, which has a high negative loading factor on PC1. Additionally, based on the cosine of the angle from the center between two loading plots, an assumption on their correlation can be made. When two factors form an angle of 180° between each other, the cosine is −1, therefore the two factors are negatively correlated. Two uncorrelated factors will form a 90° angle, where the cosine would be 0. Based on these, by observing the PCA biplot for C. curvatus (Figure 9A), two distinct clusters of fatty acids occur: the ones that are located on the negative axis of PC1, which are all odd-chain fatty acids (OCFAs), and the ones on the positive axis of PC1, which are all even-chain fatty acids (ECFAs). Additionally, supporting the previous findings, all propionic acid scores are grouped on the negative axis of PC1, indicating a strong correlation with the OCFAs formation, while glucose, acetic, and butyric acid indicate a correlation with the ECFAs. The score for BSG VFAs falls in the middle of the PC1 axis, as it results in a combination of both fatty acid groups, while it has a strong association with fatty acids C22:1, C25:0, and C18:2.
Based on the loading values for PC1 for R. toruloides biplot (Figure 9B), it better differentiated the following fatty acids (factor loadings higher than 0.7): positive direction; C18:1, C14:0, C22:0, negative direction; C17:0, C17:1, C18:3. PC2 better explains the following fatty acids (factor loadings higher than 0.5): positive direction; C16:0, C18:3, negative direction; C24:0, C22:1, C18:2. By observing the scores for the substrates, it can be concluded that they form distinct groupings on the four quadrants of the biplot. The samples for propionic acid are grouped in the upper left quadrant, close to the OCFAs C17:0 and C17:1, verifying their strong relationship. The scores for butyric acid are grouped on the lower left quadrant, close to C18:2 fatty acid, which indicates a higher formation of that fatty acid in the SCO when butyric acid is used as a substrate. The samples for glucose and acetic acid are again grouped on the positive axis of PC1, proving a strong correlation with ECFAs, like C14:0, C16:1, C18:1, C20:0, and C22:0. The score for BSG VFAs (yellow) is located close to the middle of the axis, resulting in a combination of different fatty acid groups, and it shows a strong correlation with fatty acids C22:1 and C24:0, as it is close to their loading factors.

3.4.3. SCO from Oleaginous Yeasts towards the Production of Odd-Chain Fatty Acids (OCFAs)

When propionic acid was provided as a carbon source for C. curvatus, margaric acid (C17:0) accounted for up to 25% of the total fatty acids and heptadecenoic acid up to 23.9% of the total fatty acids. At the same time, there was a huge decrease in the amount of C18 fatty acids and an increased formation of odd-chain fatty acids such as pentadecanoic acid (C15:0) (up to 4.1%) and nonadecanoic acid (C19:0) (up to 9.8%). For R. toruloides, the same behavior was observed with propionic acid, where margaric acid up to 19.7% was formed and heptadecenoic acid up to 11.1%. However, no production of nonadecanoic acid was noted. When butyric acid was used, both yeasts synthesized a very small amount of margaric acid of up to 2%. The use of propionic acid as a substrate has already been associated with the biosynthesis of odd-chain fatty acids [3,50,61]. However, the main OCFAs that have been reported are C15:0, C17:0, and C17:1, while in our study, the formation of C19:0 and C25:0 were also noted by C. curvatus. It has also been shown that the combination of propionic and butyric acid in the absence of acetic acid for C. curvatus increases the OCFAs [49]. Additionally, it has been indicated that the even-numbered fatty acids, acetic and butyric acid, are inducing the biosynthesis of even-numbered fatty acids since they are converted to acetyl-CoA, in contrast to the propionic acid which is converted to propionyl-CoA [37,55]. This is also verified by the findings of this study.
Table 3 summarizes the percentage of OCFAs in the total lipids, alongside their concentration. It can be thus assumed that the formation of OCFAs should be combined with a satisfactory total lipid concentration to yield high production. The use of propionic acid alone does not yield high lipid concentrations, especially for R. toruloides; therefore, the OCFAs concentration is low. As it has been previously suggested, the combination of different VFAs in different ratios will benefit not only the lipids production but also the formation of OCFAs. This combination will differently impact the two yeasts since they show different responses toward individual VFAs. By the observations of this study, it can be assumed that R. toruloides will result in higher lipids production by an increase in the acetic acid concentration, while C. curvatus by an increase in the butyric acid concentration, which is in line with the reports of Liu et al. [49]. It can be also concluded that the production of OCFAs is more pronounced for C. curvatus than R. toruloides, indicating the suitability of this yeast to use VFAs towards microbial oils that can be applied not only in the traditional biofuel industry but also for simultaneous production of high-quality fatty acids with a wide range of applications. Further studies are needed in order to optimize the production of microbial lipids towards the formation of OCFAs, combining different VFAs in varying ratios with different cultivation methods. Metabolic studies can further improve the naturally produced amounts of OCFAs by oleaginous yeasts. This approach was employed using Yarrowia lipolytica and propionic acid as a carbon source. The maximum concentration of OCFAs that was produced by the engineered strain reached 0.75 g/L [37], however, in our study, the maximum amount of naturally occurring OCFAs reached 2.17 g/L by C. curvatus using 40 g/L of propionic acid. With the waste-derived VFAs as substrate, C. curvatus produced 0.15 g/L OCFAs, while R. toruloides 0.10 g/L.

3.4.4. Biodiesel Properties

It is well documented that the quality of biodiesel is closely related to the fatty acid composition of the microbial lipids, specifically the type of fatty acids, the chain length, the double bonds number, and position [62,63]. The fuel properties that have a big impact on biodiesel quality are indicatively the oxidative stability (h), cetane number (CN), kinematic viscosity (mm2/s), cold filter plugging point (°C) (CFPP), together with cloud point (°C) and pour point (°C) [12,64]. The predicted biodiesel properties of the lipids produced by the oleaginous yeasts at the cultivation conditions that yielded the highest lipid concentration are indicated in Table 4.
A high CN is associated with better ignition and combustion quality of biodiesel [11]. Typical CN values range from 35 to 65. As depicted in Table 4, the SCO derived from R. toruloides has CN values that range from 57.6 to 63.9, while the SCO from C. curvatus ranged from 55.2 to 62.6, all falling within the accepted standard limits. For both yeasts, the oil that resulted in the highest CN values is derived from the cultivation using propionic acid, which is related to the high SFAs amounts that occur in the SCO (Table 3). The lowest CN value for both yeasts was obtained with butyric acid.
The kinematic viscosity (υ) of the produced biodiesel also falls within the narrow range of the standard limits, with the lowest values obtained on propionic acid (3.5 mm2/s) and the highest values on acetic acid (4.1 mm2/s) for both yeasts. The lower the viscosity is, the more likely that better quality finer fuel droplets will get injected into the combustion chamber, while the higher the viscosity, the more likely that engine performance-related problems will occur [12,65,66]. For a better kinematic viscosity (i.e., lower values), a shorter chain length is preferred [8,67], which is obtained with propionic acid as a substrate (low LCSF values). The cis configuration of the double bonds (such as in C17:1) has also been related to reducing the kinematic viscosity of the produced biodiesel [67,68].
Oxidative stability (OS) of biodiesel is another important factor and is closely related to the level of unsaturation and the number of double bonds in the fatty acid chains, which are interacting with oxygen when being exposed to air [13]. Specifically, low PUFAs amounts are beneficial for oxidative stability since double bonds together with the adjacent allylic (i.e., CH2 moiety adjacent to a single double bond) and bis-allylic (i.e., CH2 moiety located directly between two double bonds) sites are easily oxidized [65,66,68]. It has been also suggested that oxidative stability is more closely related to the total number of bis allylic sites, rather than the total number of double bonds [69]. The biodiesel produced by both yeasts and for all the tested conditions fulfill the established requirements by both standards regarding the oxidative stability values, with the highest values being 13.7 h for R. toruloides and 10.2 h for C. curvatus, both when acetic was used among the other VFAs where the SCO had the lowest amounts of PUFAs.
To predict the biodiesel’s performance in low temperatures, the CFPP (°C) is an important parameter, which is a filterability test that specifies the lowest temperature at which the fuel can pass through the standardized filter [16,64]. The limits of the CFPP are not specified by the international standards, since this parameter is country and season specified. As can be seen in Table 4, the CFPP point for R. toruloides ranges from 18.7 °C to 32.8 °C while for C. curvatus, ranges from 14.1 °C to 46.6 °C. It is noteworthy that the lowest CFPP values for both yeasts are achieved when propionic acid was used, in which the SCO contained the highest SFAs amount, but the lowest LCSF values. It has been indicated that a low LCSF benefits the CFPP [12]. For the case of the SCO produced when BSG VFAs were used as a substrate, the CFPP was lower for R. toruloides (25.2 °C) than for C. curvatus (44.9 °C). Furthermore, for both yeasts, a slight decrease in the CFPP was noted (29.4% for CC and 18.3% for RT) when the yeasts were grown in BSG VFAs (containing acetic acid as the dominant fatty acid) than in acetic acid alone. We can thus assume that this decrease was due to the combination of acetic acid with propionic acid, which results in lower CFPP values, indicating that tuning the composition of effluent VFAs can result in improved biodiesel properties.
The CFPP values are within the ranges expected for yeast SCOs, with few exceptions [12]. The poor cold flow behavior is the biggest problem associated with the production of biodiesel by oleaginous yeasts. However, several approaches have been suggested to overcome this, such as blending with different biodiesels or petrodiesel, winterization, fractionation, use of additives, and structural modifications of alcohol moieties [13,14,68]. Another approach to improve the CFPP is to genetically engineer the microorganisms to regulate the production of certain fatty acids so that biodiesel with desirable physicochemical properties will be produced. It should be noted, however, that it is challenging to produce biodiesel with ideal properties since the targeted requirements can have a contradictory effect on the fatty acid composition [68].
Finally, it is also noteworthy that higher amounts of saturated fatty acids, and especially the LCSF ones in the produced biodiesel, are responsible to lower the nitrogen oxides (NOx) emissions [64,68]. NOx is formed due to the high combustion temperature and is composed of NO and NO2 [62]. Therefore, since the LCSF values are high in the SCOs produced in the current work, it can be assumed that the produced biodiesel by the oleaginous yeasts will occur in low NOx emissions.

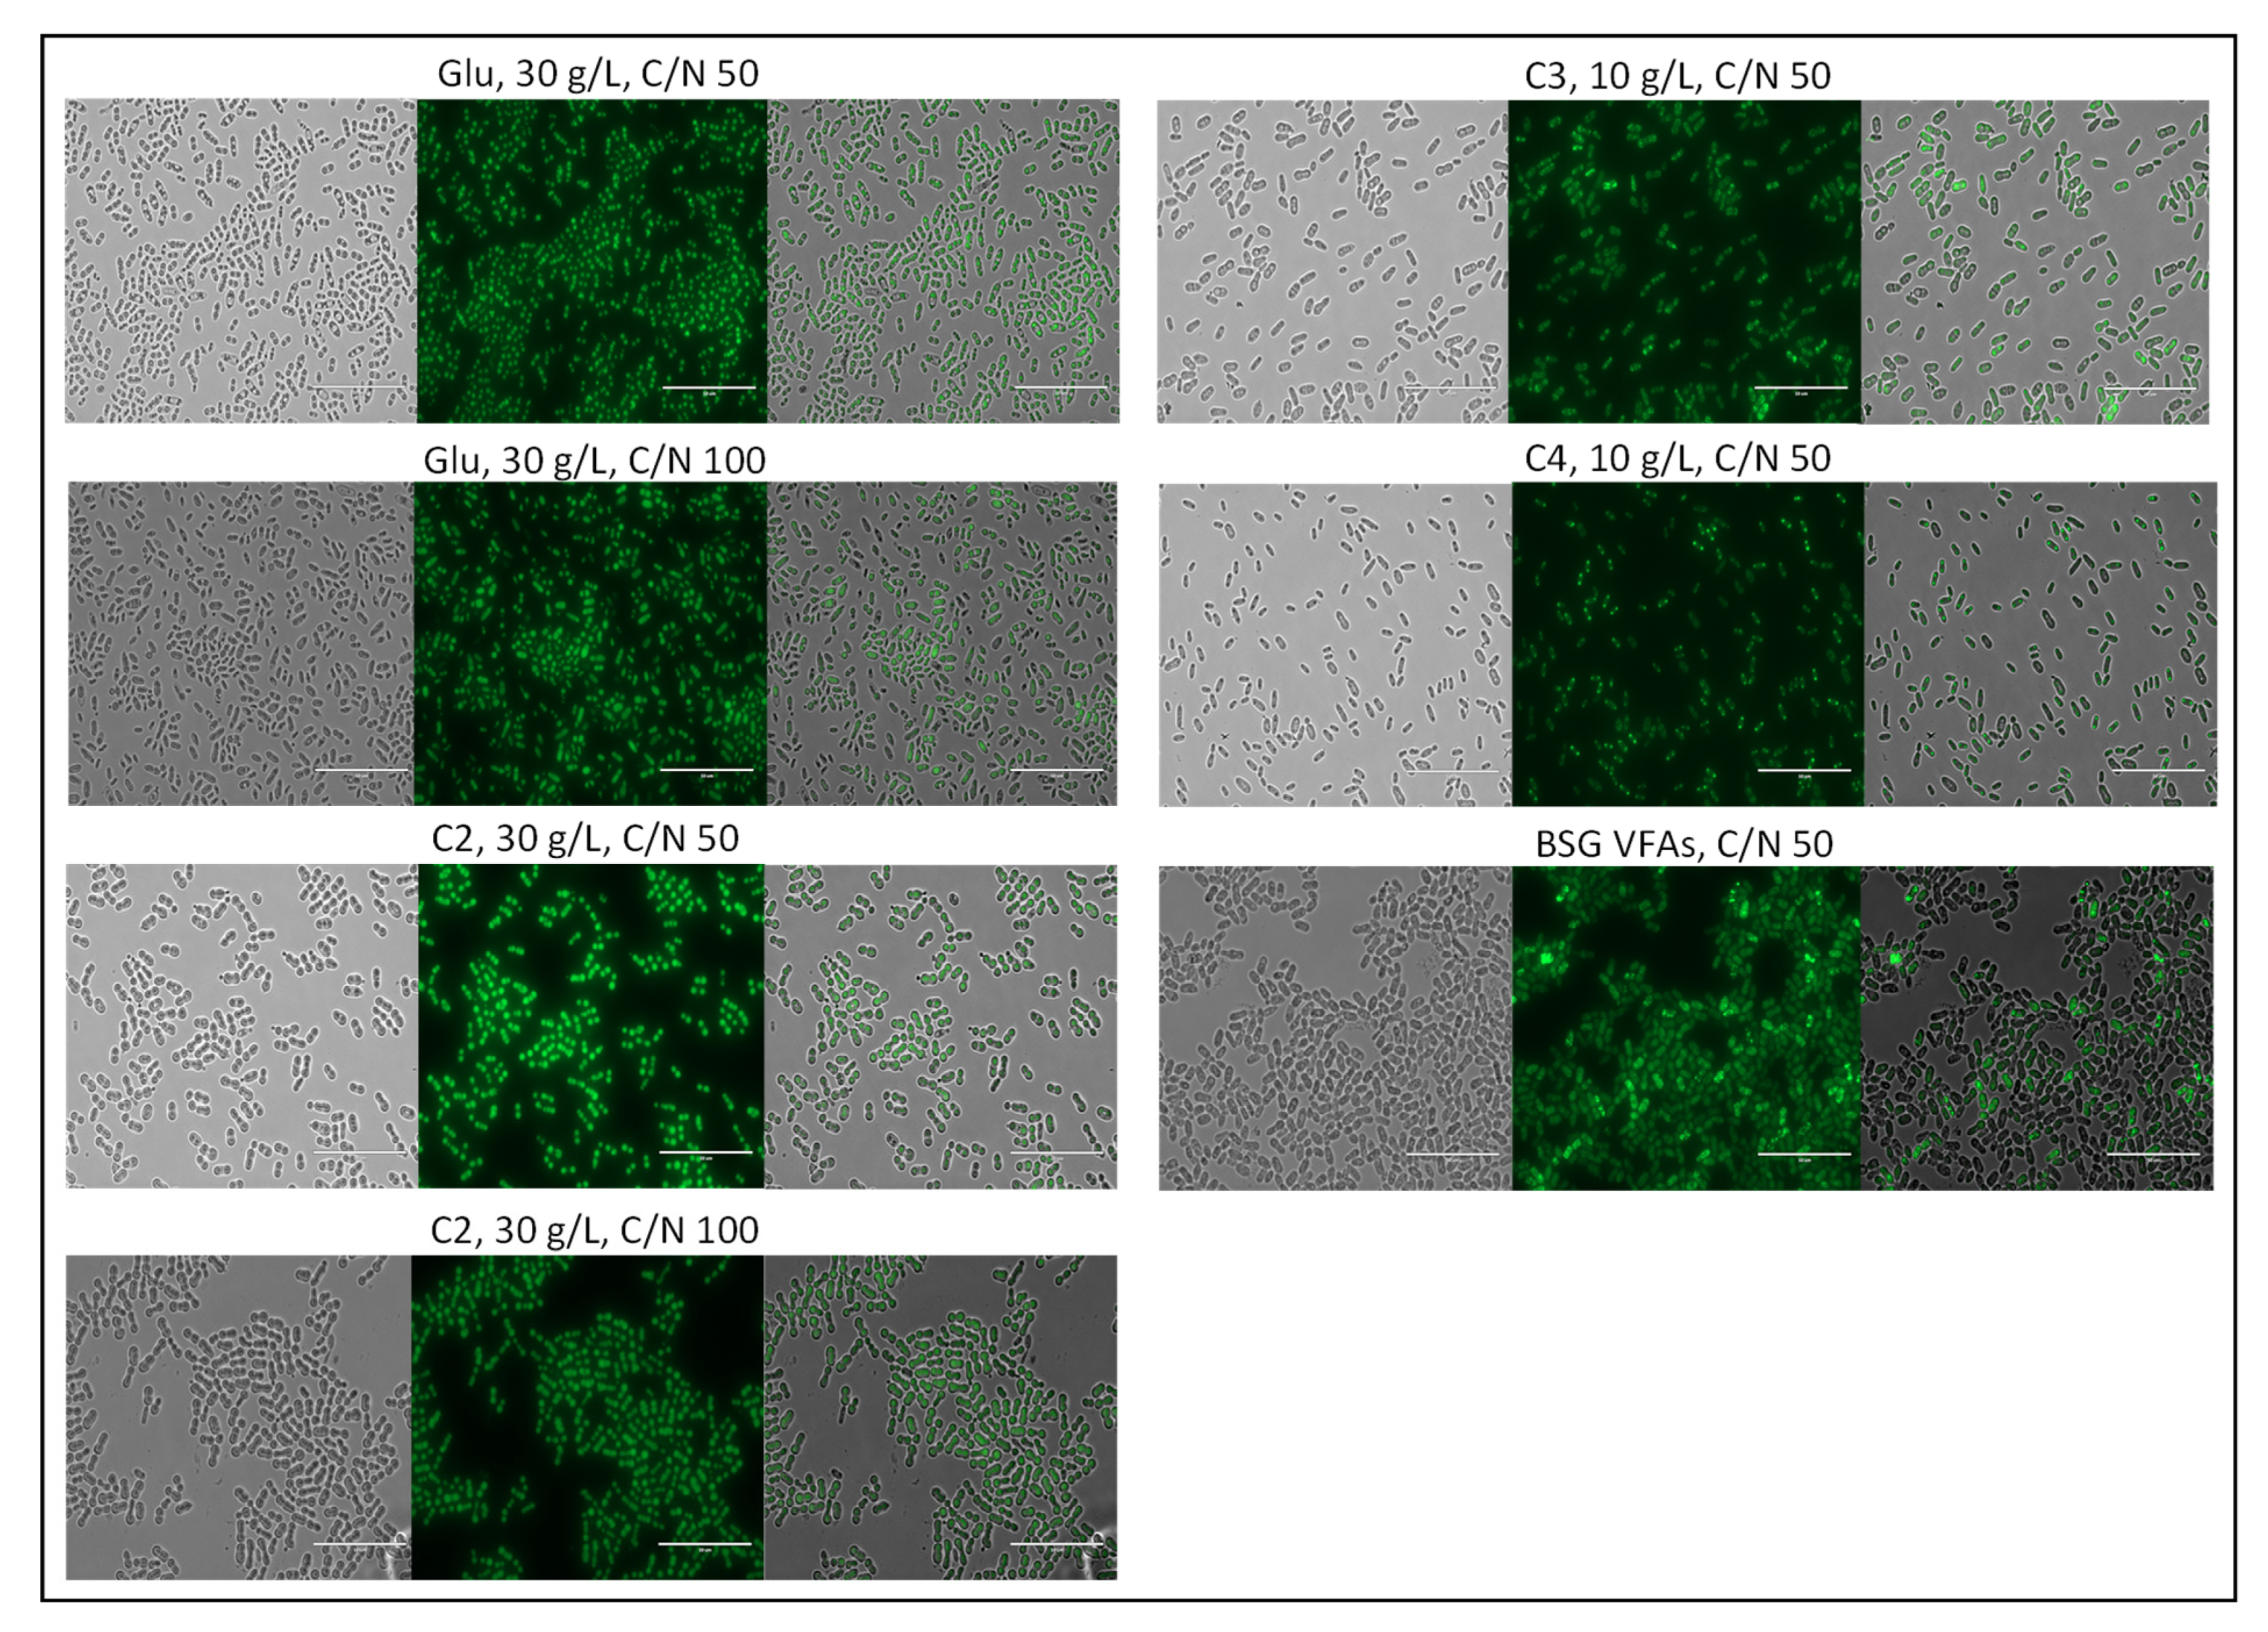
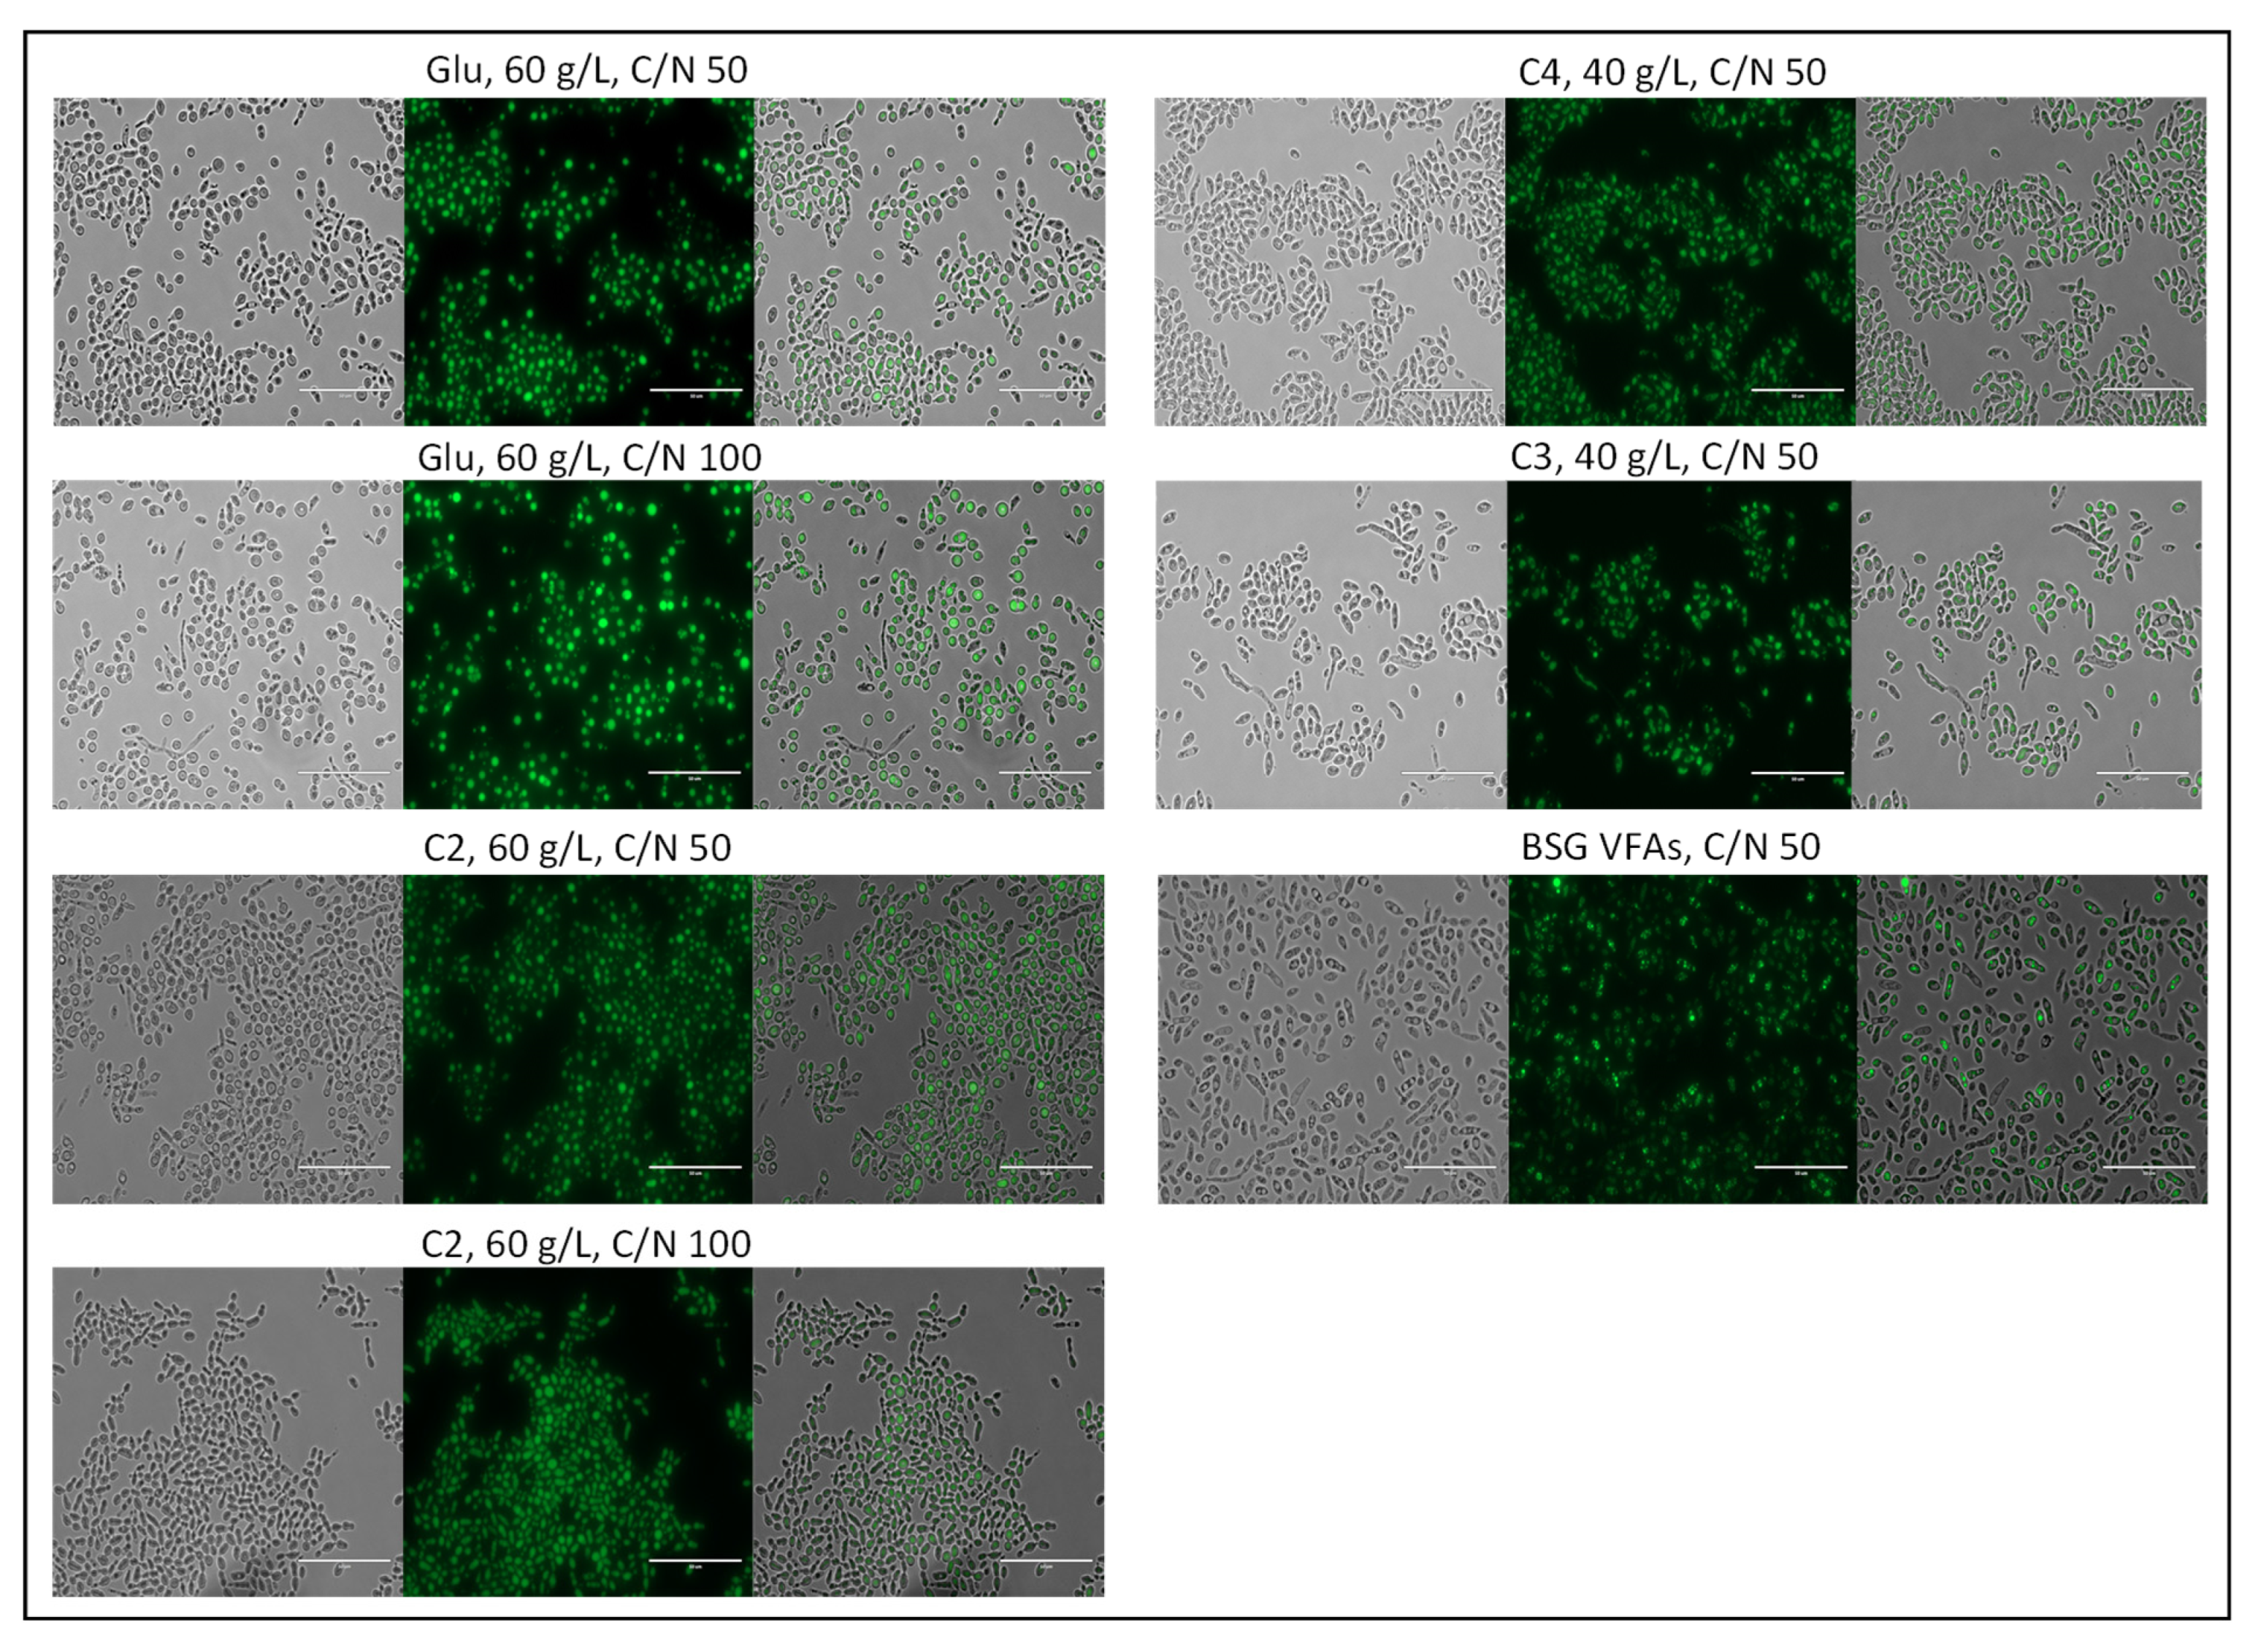
3.4.5. Morphology of SCO within the Yeast Cells

The yeast cells were observed by live fluorescence microscopy after BODIPY493/503 staining (Figure 10 and Figure 11). It can be observed for both yeasts that when the cells were grown on acetic acid, the lipid droplets were bigger and more spherical compared to the lipid droplets formed when the cells were grown on glucose. They were also more uniformly dispersed in the cells, forming one or a maximum of two central big lipid droplets. When the C/N ratio increased from 50 to 100, the lipid droplets seemed to be slightly bigger, however, the change was not that significant, even though there was an increase in the lipid content and concentration. When the cells for both yeast species were grown in propionic acid, it can be noted that they form smaller and more numerous lipid droplets that are dispersed within the cells. R. toruloides cells grown on propionic acid are bigger compared to the cells grown in glucose, while C. curvatus cells seem to be more oval-shaped when grown on propionic acid, compared to the more round-shaped cells when the yeast is grown on glucose, but similar in size. When butyric acid was used as a substrate it can be observed that R. toruloides formed a low number of lipid droplets, which are also very small in size. The size of the cells was also smaller than when the yeast grew on glucose, verifying that butyric acid is not a suitable substrate for R. toruloides. On the other hand, when C. curvatus grew on butyric acid, a high number of lipid droplets can be observed, which have a similar shape to the lipid droplets formed on propionic acid. When VFAs effluent was used as a substrate, the formed lipid droplets were small in size but very abundant for both yeasts. In addition, the cell size was rather big and their morphology resembled a combination of the morphology obtained with individual VFAs. The above observations indicate that morphological changes that occur in the cells are species and substrate-dependent.

4. Conclusions

Volatile fatty acids (VFAs) proved to be promising substrates for both yeast species, with C. curvatus showing an increased tolerance to VFAs. Specifically, with acetic acid, the highest concentration that the yeast could completely consume was 60 g/L. For propionic and butyric acid, that concentration was 40 g/L. R. toruloides on the other hand showed reduced tolerance towards high VFA concentrations, reaching a maximum of 30 g/L with acetic acid, and 10 g/L with propionic and butyric acid. C. curvatus resulted in the highest biomass and lipid concentration with 40 g/L butyric acid, reaching 22.7 and 9.2 g/L, respectively, and generally higher biomass and lipid yields were achieved with butyric acid among the tested VFAs. R. toruloides resulted in the highest biomass and lipid concentration with 30 g/L acetic acid, reaching 7.5 and 4.2 g/L, respectively. The highest biomass yield, however, was achieved with 10 g/L butyric acid, but in the case of the lipid yield, was achieved with acetic acid. As indicated by a PCA analysis studying the effect of the substrates on the fatty acid profile of the SCO, it can be concluded that propionic acid favors the formation of OCFAs. Additionally, by comparing the estimated biodiesel properties of the produced SCO, it was observed that when the yeasts were grown on propionic acid, CFPP values were the lowest, resulting in improved cold flow performance of biodiesel. The effluent VFA mixture was tested and the resulting SCO showed optimal characteristics regarding the production of OCFAs and biodiesel properties, highlighting the importance of further studying the effect of different VFAs in varying ratios to find the optimal combination for each yeast species.

Author Contributions

Conceptualization, L.M., U.R., P.C. and A.P.; methodology, E.K., L.M., U.R., P.C. and A.P. investigation, E.K.; data analysis, E.K., L.M. and A.P.; writing—original draft preparation, E.K.; writing—review and editing, L.M., U.R., P.C. and A.P.; supervision, L.M. and A.P. All authors have read and agreed to the published version of the manuscript.

Funding

This research was funded by the Swedish Research Council for sustainable development (FORMAS), grant number 2018-00818.

Institutional Review Board Statement

Not applicable.

Informed Consent Statement

Not applicable.

Data Availability Statement

Not applicable.

Conflicts of Interest

The authors declare no conflict of interest. The funder had no role in the design of the study; in the collection, analyses, or interpretation of data; in the writing of the manuscript, or in the decision to publish the results.

References

  1. Papanikolaou, S. Oleaginous Yeasts: Biochemical Events Related with Lipid Synthesis and Potential Biotechnological Applications. Ferment. Technol. 2012, 1, 1–3. [Google Scholar] [CrossRef] [Green Version]
  2. Papanikolaou, S.; Aggelis, G. Lipids of Oleaginous Yeasts. Part I: Biochemistry of Single Cell Oil Production. Eur. J. Lipid Sci. Technol. 2011, 113, 1031–1051. [Google Scholar] [CrossRef]
  3. Llamas, M.; Dourou, M.; González-Fernández, C.; Aggelis, G.; Tomás-Pejó, E. Screening of Oleaginous Yeasts for Lipid Production Using Volatile Fatty Acids as Substrate. Biomass Bioenergy 2020, 138, 1–10. [Google Scholar] [CrossRef]
  4. Llamas, M.; Magdalena, J.A.; González-Fernández, C.; Tomás-Pejó, E. Volatile Fatty Acids as Novel Building Blocks for Oil-Based Chemistry via Oleaginous Yeast Fermentation. Biotechnol. Bioeng. 2020, 117, 238–250. [Google Scholar] [CrossRef] [PubMed]
  5. Ledesma-amaro, R.; Lazar, Z.; Rakicka, M.; Guo, Z.; Fouchard, F.; Coq, A.C.; Nicaud, J. Metabolic Engineering of Yarrowia Lipolytica to Produce Chemicals and Fuels from Xylose. Metab. Eng. 2016, 38, 115–124. [Google Scholar] [CrossRef] [PubMed]
  6. Atabani, A.E.; Silitonga, A.S.; Anjum, I.; Mahlia, T.M.I.; Masjuki, H.H.; Mekhilef, S. A Comprehensive Review on Biodiesel as an Alternative Energy Resource and Its Characteristics. Renew. Sustain. Energy Rev. 2012, 16, 2070–2093. [Google Scholar] [CrossRef]
  7. Levering, J.; Broddrick, J.; Zengler, K. Engineering of Oleaginous Organisms for Lipid Production. Curr. Opin. Biotechnol. 2015, 36, 32–39. [Google Scholar] [CrossRef] [Green Version]
  8. Sitepu, I.R.; Garay, L.A.; Sestric, R.; Levin, D.; Block, D.E.; German, J.B.; Boundy-Mills, K.L. Oleaginous Yeasts for Biodiesel: Current and Future Trends in Biology and Production. Biotechnol. Adv. 2014, 32, 1336–1360. [Google Scholar] [CrossRef] [Green Version]
  9. Patel, A.; Antonopoulou, I.; Enman, J.; Rova, U.; Christakopoulos, P.; Matsakas, L. Lipids Detection and Quantification in Oleaginous Microorganisms: An Overview of the Current State of the Art. BMC Chem. Eng. 2019, 1, 1–26. [Google Scholar] [CrossRef] [Green Version]
  10. Patel, A.; Arora, N.; Sartaj, K.; Pruthi, V.; Pruthi, P.A. Sustainable Biodiesel Production from Oleaginous Yeasts Utilizing Hydrolysates of Various Non-Edible Lignocellulosic Biomasses. Renew. Sustain. Energy Rev. 2016, 62, 836–855. [Google Scholar] [CrossRef]
  11. Giakoumis, E.G.; Sarakatsanis, C.K. A Comparative Assessment of Biodiesel Cetane Number Predictive Correlations Based on Fatty Acid Composition. Energies 2019, 12, 422. [Google Scholar] [CrossRef] [Green Version]
  12. Patel, A.; Arora, N.; Mehtani, J.; Pruthi, V.; Pruthi, P.A. Assessment of Fuel Properties on the Basis of Fatty Acid Profiles of Oleaginous Yeast for Potential Biodiesel Production. Renew. Sustain. Energy Rev. 2017, 77, 604–616. [Google Scholar] [CrossRef] [Green Version]
  13. Knothe, G.; Razon, L.F. Biodiesel Fuels. Prog. Energy Combust. Sci. 2017, 58, 36–59. [Google Scholar] [CrossRef]
  14. Sierra-Cantor, J.F.; Guerrero-Fajardo, C.A. Methods for Improving the Cold Flow Properties of Biodiesel with High Saturated Fatty Acids Content: A Review. Renew. Sustain. Energy Rev. 2017, 72, 774–790. [Google Scholar] [CrossRef]
  15. Giakoumis, E.G. A Statistical Investigation of Biodiesel Physical and Chemical Properties, and Their Correlation with the Degree of Unsaturation. Renew. Energy 2013, 50, 858–878. [Google Scholar] [CrossRef]
  16. Knothe, G. “Designer” Biodiesel: Optimizing Fatty Ester Composition to Improve Fuel Properties. Energy Fuels 2008, 22, 1358–1364. [Google Scholar] [CrossRef]
  17. Meng, X.; Yang, J.; Xu, X.; Zhang, L.; Nie, Q.; Xian, M. Biodiesel Production from Oleaginous Microorganisms. Renew. Energy 2009, 34, 1–5. [Google Scholar] [CrossRef]
  18. Patel, A.; Mikes, F.; Bühler, S.; Matsakas, L. Valorization of Brewers’ Spent Grain for the Production of Lipids by Oleaginous Yeast. Molecules 2018, 23, 3052. [Google Scholar] [CrossRef] [Green Version]
  19. Patel, A.; Krikigianni, E.; Rova, U.; Christakopoulos, P.; Matsakas, L. Bioprocessing of Volatile Fatty Acids by Oleaginous Freshwater Microalgae and Their Potential for Biofuel and Protein Production. Chem. Eng. J. 2022, 438, 135529. [Google Scholar] [CrossRef]
  20. Patel, A.; Mahboubi, A.; Horváth, I.S.; Taherzadeh, M.J.; Rova, U.; Christakopoulos, P.; Matsakas, L. Volatile Fatty Acids (VFAs) Generated by Anaerobic Digestion Serve as Feedstock for Freshwater and Marine Oleaginous Microorganisms to Produce Biodiesel and Added-Value Compounds. Front. Microbiol. 2021, 12, 1–17. [Google Scholar] [CrossRef]
  21. Bachmann, S.A.L.; Calvete, T.; Féris, L.A. Potential Applications of Brewery Spent Grain: Critical an Overview. J. Environ. Chem. Eng. 2022, 10. [Google Scholar] [CrossRef]
  22. Lynch, K.M.; Steffen, E.J.; Arendt, E.K. Brewers’ Spent Grain: A Review with an Emphasis on Food and Health. J. Inst. Brew. 2016, 122, 553–568. [Google Scholar] [CrossRef]
  23. Sarkar, O.; Rova, U.; Christakopoulos, P.; Matsakas, L. Influence of Initial Uncontrolled PH on Acidogenic Fermentation of Brewery Spent Grains to Biohydrogen and Volatile Fatty Acids Production: Optimization and Scale-Up. Bioresour. Technol. 2021, 319, 124233. [Google Scholar] [CrossRef] [PubMed]
  24. Patel, A.; Sarkar, O.; Rova, U.; Christakopoulos, P.; Matsakas, L. Valorization of Volatile Fatty Acids Derived from Low-Cost Organic Waste for Lipogenesis in Oleaginous Microorganisms—A Review. Bioresour. Technol. 2021, 321, 124457. [Google Scholar] [CrossRef] [PubMed]
  25. Dulermo, T.; Tréton, B.; Beopoulos, A.; Gnankon, A.P.K.; Haddouche, R.; Nicaud, J.M. Characterization of the Two Intracellular Lipases of Y. Lipolytica Encoded by TGL3 and TGL4 Genes: New Insights into the Role of Intracellular Lipases and Lipid Body Organisation. Biochim. Biophys. Acta - Mol. Cell Biol. Lipids 2013, 1831, 1486–1495. [Google Scholar] [CrossRef] [PubMed]
  26. Lukitawesa; Patinvoh, R.J.; Millati, R.; Sárvári-Horváth, I.; Taherzadeh, M.J. Factors Influencing Volatile Fatty Acids Production from Food Wastes via Anaerobic Digestion. Bioengineered 2020, 11, 39–52. [Google Scholar] [CrossRef] [Green Version]
  27. Patel, A.; Delgado Vellosillo, I.; Rova, U.; Matsakas, L.; Christakopoulos, P. A Novel Bioprocess Engineering Approach to Recycle Hydrophilic and Hydrophobic Waste under High Salinity Conditions for the Production of Nutraceutical Compounds. Chem. Eng. J. 2022, 431. [Google Scholar] [CrossRef]
  28. Lindmark, H. Fatty Acids in Bovine Milk Fat. Food Nutr. Res. 2008, 52, 1–3. [Google Scholar] [CrossRef] [Green Version]
  29. Stephanie, V.W.; Richard, L.; Edward, A.D. Efficacy of Dietary Odd-Chain Saturated Fatty Acid Pentadecanoic Acid Parallels Broad Associated Health Benefits in Humans: Could It Be Essential? Sci. Rep. 2020, 10, 8161. [Google Scholar] [CrossRef]
  30. Vlaeminck, B.; Fievez, V.; Cabrita, A.R.J.; Fonseca, A.J.M.; Dewhurst, R.J. Factors Affecting Odd- and Branched-Chain Fatty Acids in Milk: A Review. Anim. Feed Sci. Technol. 2006, 131, 389–417. [Google Scholar] [CrossRef]
  31. Imamura, F.; Fretts, A.; Marklund, M.; Korat, A.V.A.; Yang, W.; Lankinen, M.; Qureshi, W.; Helmer, C.; Chen, T.; Wong, K.; et al. Fatty Acid Biomarkers of Dairy Fat Consumption and Incidence of Type 2 Diabetes: A Pooled Analysis of Prospective Cohort Studies. PLoS Med. 2018, 15, e1002670. [Google Scholar] [CrossRef] [PubMed] [Green Version]
  32. Hodson, L.; Skeaff, C.M.; Fielding, B.A. Fatty Acid Composition of Adipose Tissue and Blood in Humans and Its Use as a Biomarker of Dietary Intake. Prog. Lipid Res. 2008, 47, 348–380. [Google Scholar] [CrossRef] [PubMed]
  33. Pfeuffer, M.; Jaudszus, A. Pentadecanoic and Heptadecanoic Acids: Multifaceted Odd-Chain Fatty Acids. Adv. Nutr. 2016, 7, 730–734. [Google Scholar] [CrossRef] [PubMed] [Green Version]
  34. Grzegorz, D.; Konopka, I. Update on Food Sources and Biological Activity of Odd-Chain, Branched and Cyclic Fatty Acids––A Review. Trends Food Sci. Technol. 2022, 119, 514–529. [Google Scholar] [CrossRef]
  35. Park, Y.K.; Ledesma-Amaro, R.; Nicaud, J.M. De Novo Biosynthesis of Odd-Chain Fatty Acids in Yarrowia Lipolytica Enabled by Modular Pathway Engineering. Front. Bioeng. Biotechnol. 2020, 7, 1–11. [Google Scholar] [CrossRef]
  36. Park, Y.K.; Bordes, F.; Letisse, F.; Nicaud, J.M. Engineering Precursor Pools for Increasing Production of Odd-Chain Fatty Acids in Yarrowia Lipolytica. Metab. Eng. Commun. 2021, 12, e00158. [Google Scholar] [CrossRef]
  37. Park, Y.K.; Dulermo, T.; Ledesma-Amaro, R.; Nicaud, J.M. Optimization of Odd Chain Fatty Acid Production by Yarrowia Lipolytica. Biotechnol. Biofuels 2018, 11, 1–12. [Google Scholar] [CrossRef] [Green Version]
  38. Lee Chang, K.J.; Mansour, M.P.; Dunstan, G.A.; Blackburn, S.I.; Koutoulis, A.; Nichols, P.D. Odd-Chain Polyunsaturated Fatty Acids in Thraustochytrids. Phytochemistry 2011, 72, 1460–1465. [Google Scholar] [CrossRef]
  39. Wang, F.; Bi, Y.; Diao, J.; Lv, M.; Cui, J.; Chen, L.; Zhang, W. Metabolic Engineering to Enhance Biosynthesis of Both Docosahexaenoic Acid and Odd-Chain Fatty Acids in Schizochytrium sp. S31. Biotechnol. Biofuels 2019, 12, 1–14. [Google Scholar] [CrossRef] [Green Version]
  40. Oliver, L.; Fern, L.; Dietrich, T.; Villaran, M.C.; Barrio, J. Production of Docosahexaenoic Acid and Odd-Chain Fatty Acids by Microalgae Schizochytrium Limacinum Grown on Waste-Derived Volatile Fatty Acids. Appl. Sci. 2022, 12, 3976. [Google Scholar] [CrossRef]
  41. Wu, H.; San, K. Engineering Escherichia Coli for Odd Straight Medium Chain Free Fatty Acid Production. Appl. Microbiol. Biotechnol. 2014, 8145–8154. [Google Scholar] [CrossRef] [PubMed]
  42. Zhang, L.S.; Liang, S.; Zong, M.H.; Yang, J.G.; Lou, W.Y. Microbial Synthesis of Functional Odd-Chain Fatty Acids: A Review. World J. Microbiol. Biotechnol. 2020, 36, 1–9. [Google Scholar] [CrossRef] [PubMed]
  43. Van Wychen, S.; Ramirez, K.; Laurens, L.M.L.; Van Wychen, S.; Ramirez, K. Determination of Total Lipids as Fatty Acid Methyl Esters (FAME) by In Situ Transesterification (NREL/TP-5100-60958); Laboratory Analytical Procedures (LAP): Gold, CO, USA, 2013. [Google Scholar]
  44. Talebi, A.F.; Tabatabaei, M.; Chisti, Y. BiodieselAnalyzer©: A User-Friendly Software for Predicting the Properties of Prospective Biodiesel. Biofuel Res. J. 2014, 1, 55–57. [Google Scholar] [CrossRef]
  45. Gong, Z.; Shen, H.; Zhou, W.; Wang, Y.; Yang, X.; Zhao, Z.K. Efficient Conversion of Acetate into Lipids by the Oleaginous Yeast Cryptococcus Curvatus. Biotechnol. Biofuels 2015, 8, 1–9. [Google Scholar] [CrossRef]
  46. Huang, X.F.; Liu, J.N.; Lu, L.J.; Peng, K.M.; Yang, G.X.; Liu, J.N. Culture Strategies for Lipid Production Using Acetic Acid as Sole Carbon Source by Rhodosporidium Toruloides. Bioresour. Technol. 2016, 206, 141–149. [Google Scholar] [CrossRef] [PubMed]
  47. Afonso, V.; Tangerino, L.; Oliveira, D.; Raposo, S. Culture Strategies for Lipid Production Using Low-Cost Carbon Sources by Rhodosporidium Toruloides. In INCREaSE; Mortal, A., Aníbal, J., Monteiro, J., Sequeira, C., Semião, J., Silva, M.M., Oliveira, M., Eds.; Springer: Berlin/Heidelberg, Germany, 2017; pp. 103–116. [Google Scholar]
  48. Liu, J.; Huang, X.; Chen, R.; Yuan, M.; Liu, J. Efficient Bioconversion of High-Content Volatile Fatty Acids into Microbial Lipids by Cryptococcus Curvatus ATCC 20509. Bioresour. Technol. 2017, 239, 394–401. [Google Scholar] [CrossRef]
  49. Liu, J.; Yuan, M.; Liu, J.N.; Huang, X.F. Bioconversion of Mixed Volatile Fatty Acids into Microbial Lipids by Cryptococcus Curvatus ATCC 20509. Bioresour. Technol. 2017, 241, 645–651. [Google Scholar] [CrossRef]
  50. Zheng, Y.; Chi, Z.; Ahring, B.K.; Chen, S. Oleaginous Yeast Cryptococcus Curvatus for Biofuel Production: Ammonia’s Effect. Biomass Bioenergy 2012, 37, 114–121. [Google Scholar] [CrossRef]
  51. Gao, R.; Li, Z.; Zhou, X.; Cheng, S.; Zheng, L. Oleaginous Yeast Yarrowia Lipolytica Culture with Synthetic and Food Waste-Derived Volatile Fatty Acids for Lipid Production. Biotechnol. Biofuels 2017, 10, 1–15. [Google Scholar] [CrossRef]
  52. Annamalai, N.; Sivakumar, N.; Fernandez-Castane, A.; Oleskowicz-Popiel, P. Production of Microbial Lipids Utilizing Volatile Fatty Acids Derived from Wastepaper: A Biorefinery Approach for Biodiesel Production. Fuel 2020, 276, 118087. [Google Scholar] [CrossRef]
  53. Liu, J.; Liu, J.N.; Yuan, M.; Shen, Z.H.; Peng, K.M.; Lu, L.J.; Huang, X.F. Bioconversion of Volatile Fatty Acids Derived from Waste Activated Sludge into Lipids by Cryptococcus Curvatus. Bioresour. Technol. 2016, 211, 548–555. [Google Scholar] [CrossRef] [PubMed]
  54. Béligon, V.; Noblecourt, A.; Christophe, G.; Lebert, A.; Larroche, C.; Fontanille, P. Proof of Concept for Biorefinery Approach Aiming at Two Bioenergy Production Compartments, Hydrogen and Biodiesel, Coupled by an External Membrane. Biofuels 2018, 9, 163–174. [Google Scholar] [CrossRef]
  55. Liu, J.; Yuan, M.; Liu, J.N.; Lu, L.J.; Peng, K.M.; Huang, X.F. Microbial Conversion of Mixed Volatile Fatty Acids into Microbial Lipids by Sequencing Batch Culture Strategy. Bioresour. Technol. 2016, 222, 75–81. [Google Scholar] [CrossRef] [PubMed]
  56. Christophe, G.; Deo, J.L.; Kumar, V.; Nouaille, R.; Fontanille, P.; Larroche, C. Production of Oils from Acetic Acid by the Oleaginous Yeast Cryptococcus Curvatus. Appl. Biochem. Biotechnol. 2012, 167, 1270–1279. [Google Scholar] [CrossRef] [PubMed]
  57. Gong, Z.; Zhou, W.; Shen, H.; Yang, Z.; Wang, G.; Zuo, Z.; Hou, Y.; Zhao, Z.K. Co-Fermentation of Acetate and Sugars Facilitating Microbial Lipid Production on Acetate-Rich Biomass Hydrolysates. Bioresour. Technol. 2016, 207, 102–108. [Google Scholar] [CrossRef]
  58. Béligon, V.; Poughon, L.; Christophe, G.; Lebert, A.; Larroche, C.; Fontanille, P. Improvement and Modeling of Culture Parameters to Enhance Biomass and Lipid Production by the Oleaginous Yeast Cryptococcus Curvatus Grown on Acetate. Bioresour. Technol. 2015, 192, 582–591. [Google Scholar] [CrossRef]
  59. Xu, X.; Kim, J.Y.; Cho, H.U.; Park, H.R.; Park, J.M. Bioconversion of Volatile Fatty Acids from Macroalgae Fermentation into Microbial Lipids by Oleaginous Yeast. Chem. Eng. J. 2015, 264, 735–743. [Google Scholar] [CrossRef]
  60. Lian, J.; Garcia-Perez, M.; Coates, R.; Wu, H.; Chen, S. Yeast Fermentation of Carboxylic Acids Obtained from Pyrolytic Aqueous Phases for Lipid Production. Bioresour. Technol. 2012, 118, 177–186. [Google Scholar] [CrossRef]
  61. Kolouchová, I.; Schreiberová, O.; Sigler, K.; Masák, J.; Řezanka, T. Biotransformation of Volatile Fatty Acids by Oleaginous and Non-Oleaginous Yeast Species. FEMS Yeast Res. 2015, 15, 1–8. [Google Scholar] [CrossRef] [Green Version]
  62. Hoekman, S.K.; Robbins, C. Review of the Effects of Biodiesel on NOx Emissions. Fuel Processing Technol. 2012, 96, 237–249. [Google Scholar] [CrossRef]
  63. Knothe, G. Dependence of Biodiesel Fuel Properties on the Structure of Fatty Acid Alkyl Esters. Fuel Processing Technol. 2005, 86, 1059–1070. [Google Scholar] [CrossRef]
  64. Sakthivel, R.; Ramesh, K.; Purnachandran, R.; Mohamed Shameer, P. A Comparative Assessment of Biodiesel Cetane Number Predictive Correlations Based on Fatty Acid Composition. Renew. Sustain. Energy Rev. 2018, 82, 2970–2992. [Google Scholar] [CrossRef]
  65. Knothe, G.; Dunn, R.O. Dependence of Oil Stability Index of Fatty Compounds on Their Structure and Concentration and Presence of Metals. JAOCS J. Am. Oil Chem. Soc. 2003, 80, 1021–1026. [Google Scholar] [CrossRef]
  66. Wadumesthrige, K.; Smith, J.C.; Wilson, J.R.; Salley, S.O.; Ng, K.Y.S. Investigation of the Parameters Affecting the Cetane Number of Biodiesel. JAOCS J. Am. Oil Chem. Soc. 2008, 85, 1073–1081. [Google Scholar] [CrossRef]
  67. Knothe, G.; Steidley, K.R. Kinematic Viscosity of Biodiesel Fuel Components and Related Compounds. Influence of Compound Structure and Comparison to Petrodiesel Fuel Components. Fuel 2005, 84, 1059–1065. [Google Scholar] [CrossRef]
  68. Lanjekar, R.D.; Deshmukh, D. A Review of the Effect of the Composition of Biodiesel on NOx Emission, Oxidative Stability and Cold Flow Properties. Renew. Sustain. Energy Rev. 2016, 54, 1401–1411. [Google Scholar] [CrossRef]
  69. McCormick, R.L.; Ratcliff, M.; Moens, L.; Lawrence, R. Several Factors Affecting the Stability of Biodiesel in Standard Accelerated Tests. Fuel Processing Technol. 2007, 88, 651–657. [Google Scholar] [CrossRef]
Figure 1. Consumption of VFAs and glucose (GC) throughout cultivation in 10 g/L (A), 20 g/L (B), and 30 g/L (C) initial concentration for R. toruloides.
Applsci 12 06541 g001
Figure 2. DCW (g/L), total lipids (g/L), lipid content (% w/w), and substrate consumption (% w/w) on the last day of cultivation of R. toruloides on synthetic VFAs and glucose (GC) with (A) 10 g/L and C/N 50, (B) 20 g/L and C/N 50, and (C) 30 g/L with C/N 50 and C/N 100.
Applsci 12 06541 g002
Figure 3. (A) Biomass (YX/S) and (B) lipid (YL/S) yield for R. toruloides when grown on different concentrations of synthetic VFAs and glucose (GC).
Applsci 12 06541 g003
Figure 4. Consumption of VFAs and glucose throughout cultivation in 10 g/L (A), 20 g/L (B), 40 g/L (C), and 60 g/L (D) initial concentration for C. curvatus.
Applsci 12 06541 g004
Figure 5. DCW (g/L), total lipids (g/L), lipid content (% w/w) and substrate consumption (% w/w) on the last day of cultivation of C. curvatus on VFAs and glucose (GC) with (A) 10 g/L concentration and C/N 50, (B) 20 g/L concentration and C/N 50, (C) 40 g/L concentration and C/N 50, and (D) 60 g/L concentration with C/N 50 and C/N 100.
Applsci 12 06541 g005
Figure 6. (A) Biomass (YX/S) and (B) lipid (YL/S) yields for C. curvatus when grown on different concentrations of synthetic VFAs and glucose (GC).
Applsci 12 06541 g006
Figure 7. Substrate consumption (g/L), DCW (g/L), total lipids (g/L), and lipid content (% w/w) on a time-course experiment for C. curvatus (A,B) and R. toruloides (C,D) using BSG-derived VFAs as a substrate.
Applsci 12 06541 g007
Figure 8. Fatty acid (FA) profile of the lipids produced with (A) C. curvatus, and (B) R. toruloides.
Applsci 12 06541 g008
Figure 9. PCA biplots of PC1-PC2 for C. curvatus (A) and R. toruloides (B). The scores (dots) signify the substrates that were used for cultivation (glucose, acetic acid, propionic acid, butyric acid, BSG VFAs) and the loading plots (arrows) refer to the fatty acids of the SCO.
Applsci 12 06541 g009aApplsci 12 06541 g009b
Figure 10. Morphological analysis of the cells and lipid droplets when R. toruloides was cultivated on synthetic and BSG-derived VFAs, as well as glucose. The cells were stained with the lipid dye BODIPY493/53. Scale bars correspond to 50 μm.
Applsci 12 06541 g010
Figure 11. Morphological analysis of the cells and lipid droplets when C. curvatus was cultivated on synthetic and BSG-derived VFAs, as well as glucose. The cells were stained with the lipid dye BODIPY493/53. Scale bars correspond to 50 μm.
Applsci 12 06541 g011
Table 1. Comparative table of the studies carried out for C. curvatus using synthetic VFAs or derived from AD.
Yeast StrainCulture StrategyCarbon SourceConcentration (g/L)Lipid Content (%)Reference
C. curvatus NRRL-Y-1511BatchVFAs from anaerobic digestion effluent5, 10, 1529.2; 32.6; 36.9[3]
C. curvatus DSM 70022BatchVFAs mix (C2:C3:C4)2 (5:1:4)36.3[52]
5 (5:1:4)28.1
10 (5:1:4)17.0
5 (5:1:4)23.6
5 (5:2:3)26.2
5 (6:2:2)30.1
5 (6:1:3)38.6
VFAs from waste office paper 17.28 (5.3 C2: 3.6 C3: 1.1 C4)41.2
VFAs from waste newspaper 10.23 (4.9 C2: 3.6 C3: 1.7 C4)27.7
C. curvatus MUCL 29819BatchVFAs from waste activated sludge (WAS)1.7 C2; 0.7 C313.86[53]
sequencing batch culture SBC (5 cycles)VFAs from waste activated sludge (WAS)3.3539.6
C. curvatus MUCL 29819sequencing batch culture SBC (4 cycles)VFAs mix (C2:C3:C4)4 (6:3:1)42.7[55]
C. curvatus MUCL 29819Two-stage batchGlu + C25 + 547.3[56]
pH-stat two-stage fed-batch bioreactorGlu + C215 + 550.9
C. curvatus ATCC 20509 BatchC2 (5–40 g/L)30; 4058.0; 62.5[48]
BatchVFAs mix (C2:C3:C4)30; 40 (6:3:1)53.3; 63.2
C. curvatus ATCC 20509 BatchC2 (5–40 g/L)3057.9[49]
C3 (5–40 g/L)
C4 (5–40 g/L)
VFAs mix (C2:C3:C4)30 (15:5:10)56.9
C. curvatus ATCC 20509 Fed-batchVFAs from dark fermentation1242[54]
C. curvatus ATCC 20509 BatchGlu + C230 + 531.7[57]
Glu + C230 + 1037.9
Glu + C230 + 2047.6
Glu + C230 + 3056.0
Xylose + C230 + 528.1
C. curvatus ATCC 20509 Fed-batchC2553[58]
C. curvatus ATCC 20509 BatchC23073.4[45]
Continuous cultureC23066.4
C. curvatus ATCC 20509 Repeated fed-batchVFAs mix (C2:C3:C4)9.861[59]
C. curvatus ATCC 20509 BatchC2 (5–60 g/L)2041.3 [60]
C. curvatus DSM 101032BatchC2 (10–80 g/L)10, 20, 40, 6025.2; 45; 41.1; 52.2This study
C2 (C/N 100)6057.9
C3 (10–60 g/L)10, 20, 4023.3; 46.2; 45.6
C4 (10–60 g/L)10, 20, 4027.3; 39.5; 40.5
VFAs from BSG(10.1 C2: 0.8 C3: 1.2 C4)39.3 (24 h)
Table 2. Comparative table of the studies carried out for R. toruloides using synthetic VFAs or derived from AD.
Yeast StrainCulture StrategyCarbon SourceConcentrationLipid Content (%)Reference
R. toruloides NRRL-Y-27012BatchVFAs from anaerobic digestion effluent5, 10, 1525.7; 19.9; no growth[3]
R. toruloides CECT 1499BatchC25–18 g/L [47]
Fed-batchC21520
R. toruloides AS 2.1389BatchC22048.2[46]
BatchC2415.2
Two-stage batchGlu + C240 + 2050.1
Two-stage batchGlu + C240 + 513.7
Sequencing batchC2438.6
R. toruloides AS 2.1389BatchVFAs from waste activated sludge (WAS)1.7 C2; 0.7 C310.43[53]
R. toruloides ATCC 10788BatchC23033[45]
R. toruloides Y4 C23054.9
R. toruloides NCYC 1576BatchC2 (10–40 g/L)10, 20, 3027.9; 40.3; 49.3This study
C2 (C/N 100)3056.4
C3 (10–40 g/L)10, 209.3; 9.2
C4 (10–40 g/L)10, 208.8; 13.3
VFAs from BSG(10.1 C2: 0.8 C3: 1.2 C4)42.8 (24 h)
Table 3. Percentage (%) of saturated FAs (SFAs), monounsaturated FAs (MUFAs), polyunsaturated FAs (PUFAs), and odd-chain FAs (OCFAs) of the total FAs produced.
C. curvatus
Concentration (g/L)SubstrateSFA (%)MUFA (%)PUFA (%)OCFAs/Total Lipids (%)OCFAs (g/L)
10GC37.842.719.60.00.00
C242.143.014.90.40.01
C354.138.47.558.10.80
C442.545.911.64.80.11
20GC42.145.312.60.00.00
C243.244.112.70.50.01
C350.944.84.467.71.75
C443.84511.12.70.11
40GC40.247.712.10.40.02
C245.639.914.50.40.02
C354.420.025.635.42.17
C439.035.026.01.50.14
60 (C/N 50)GC37.350.712.00.40.03
C243.940.016.10.40.02
60 (C/N 100)GC40.445.713.92.00.18
C245.040.615.62.10.11
(10.1 C2; 0.8 C3; 1.2 C4)BSG VFAs45.137.517.410.00.15
R. toruloides
Concentration (g/L)SubstrateSFA (%)MUFA (%)PUFA (%)OCFAs/Total Lipids (%)OCFAs (g/L)
10GC38.243.318.50.00.00
C238.943.817.30.00.00
C361.916.621.424.60.18
C447.930.521.60.00.00
20GC35.349.914.80.00.00
C241.244.314.50.00.00
C365.916.018.130.80.16
C446.629.723.71.40.01
30 (C/N 50)GC38.149.112.70.00.00
C238.851.010.20.80.03
30 (C/N 100)GC38.947.213.91.20.07
C239.949.510.60.50.02
(10.1 C2; 0.8 C3; 1.2 C4)BSG VFAs23.657.216.05.70.10
Table 4. Biodiesel properties of the SCO produced by C. curvatus and R. toruloides and comparison to the standard fuel parameters, ASTM D6751-02 and EN 14,214.
C. curvatusStandard Fuel Parameters
60 g/L GC (C/N100)60 g/L C2 (C/N100)40 g/L C340 g/L C4BSG VFAsASTM D6751-02EN 14214
DU73.37171.53160.84887.07470.298--
SV198.115199.814182.656200.917182.257--
IV68.18068.09460.55181.03765.153-120 (Max)
CN58.50958.29462.55755.23261.58747 (Min)51 (Min)
LCSF16.62620.0889.75215.71719.548--
CFPP35.75846.63514.16132.90144.936country specific
CP4.2953.8941.4904.6152.114country specific
PP−2.158−2.594−5.204−1.811−4.526--
APE73.37171.53160.84887.07470.298--
BAPE17.44220.90531.53528.62319.235--
OS11.04810.1667.2007.1219.375≥3≥6
HHV39.07939.52635.42339.56536.278--
υ4.0634.1603.4604.0343.7261.9–63.5–5.0
ρ0.8610.8710.7830.8740.7990.880.86–0.9
R. toruloidesStandard Fuel Parameters
GC 30 g/L (CN100)C2 30 g/L, (CN100)C3 10 g/LC4 10 g/LBSG VFAsASTM D6751-02EN 14214
DU74.99570.43850.56873.64881.704--
SV201.314201.159188.023203.134177.267--
IV70.09665.01150.75468.70373.678-120 (Max)
CN57.64058.80563.90957.71160.51247 (Min)51 (Min)
LCSF11.40815.08211.20315.70813.279--
CFPP19.36430.90518.72032.87325.241country specific
CP6.3544.24310.68510.058−0.097country specific
PP0.077−2.2154.7784.097−6.926--
APE74.05170.07750.56873.64881.704--
BAPE17.52014.71726.85523.96216.014--
OS11.06613.7458.0898.0539.955≥3≥6
HHV39.19139.50635.91039.52335.400--
υ3.9644.1163.4944.0223.5631.9–63.5–5.0
ρ0.8660.8710.7940.8730.7810.880.86–0.9
SFA, saturated fatty acids (%); MUFA, monounsaturated fatty acids (%); PUFA, polyunsaturated fatty acids (%); DU, degree of unsaturation; SV, saponification value (mg/g); IV, iodine value; CN, cetane number; LCSF, long-chain saturation factor; CFPP, cold filter plugging point (°C); CP, cloud point (°C); PP, pour point (°C); APE, allylic position equivalent; BAPE, bis-allylic position equivalent; OS, oxidation stability (h); HHV, higher heating value; υ, kinematic viscosity (mm2/s); ρ, density (g/cm3). Min, minimum; Max, maximum; -, no standard limit designated by ASTM D6751-02 and EN 14,214 biodiesel standards.
Publisher’s Note: MDPI stays neutral with regard to jurisdictional claims in published maps and institutional affiliations.

