Article

Fabricating a Novel Three-Dimensional Skin Model Using Silica Nonwoven Fabrics (SNF)

1
Graduate School of Engineering Science, Yokohama National University, Tokiwadai 79-5, Hodogaya-ku, Yokohama 240-8501, Japan
2
Faculty of Engineering, Yokohama National University, Tokiwadai 79-5, Hodogaya-ku, Yokohama 240-8501, Japan
*
Author to whom correspondence should be addressed.
Appl. Sci. 2022, 12(13), 6537; https://doi.org/10.3390/app12136537
Submission received: 10 May 2022 / Revised: 18 June 2022 / Accepted: 25 June 2022 / Published: 28 June 2022

Abstract

:
Silica nonwoven fabrics (SNF) prepared using electrospinning have high biocompatibility, thermal stability, and porosity that allows growing three-dimensional culture of cells. In this study, we used SNF to construct a three-dimensional artificial skin model consisting of epidermal and dermal layers with immortalized and primary human cell lines, creating a novel model that minimizes tissue shrinkage. As a result, SNF dermal/epidermal models have enhanced functions in the basement membrane, whereas Collagen dermal/epidermal models have advantages in keratinization and barrier functions. The SNF dermal/epidermal model with mechanical strength formed a basement membrane mimicking structure, suggesting the construction of a stable skin model. Next, we constructed three-dimensional skin models consisting of SNF and collagen. In the combination models, the expression of genes in the basement membrane was significantly increased compared with that in the Collagen dermal/epidermal model, and the gene for keratinization was increased compared with that in the SNF dermal/epidermal model. We believe that the combination model can be a biomimetic model that takes advantage of both SNF and collagen and can be applied to various basic research. Our new skin model is expected to be an alternative method for skin testing to improve the shrinkage of the collagen matrix gel.

1. Introduction

In tissue engineering, especially for regenerated tissues, it is important for cell scaffolds to function as a replacement for the extracellular matrix (ECM). The native ECM supports cells by providing structural [1] and biochemical conditions for cell adhesion, maintenance, proliferation, self-replication, and differentiation [2]. Therefore, the main goal of tissue engineering is to reproduce the cellular microenvironment that controls and regulates cellular functions in vivo using an in vitro culture system.
The behavior of individual cells is regulated by their interactions with neighboring cells and ECM [3]. The complex biological systems in the in vivo microenvironment cannot be reproduced by cells cultured in 2D monolayers [4]. There are various culture methods to grow cells in a three-dimensional system, such as seeding in scaffolds comprising protein-based natural biomaterials [5], polymer hydrogels [6], and porous and fibrous materials [7,8]. Protein-based natural biomaterials can be fabricated using collagen, gelatin, and fibrinogen. Collagen, the most abundant protein in the human dermis, is secreted by fibroblasts and is responsible for tensile rigidity of the ECM [9]. In a collagen matrix skin model, epidermal growth is enhanced when the collagen matrix is organized by fibroblasts [10]. Thus, the use of a collagen matrix as a scaffold for skin models leads to epidermal keratinization and mimicry of skin tissue.
However, models using collagen matrices have problems such as shrinkage after long-term culture and inability to form elastin fibers important for the elasticity of the dermis [11]. As the cultivation period lengthens, the surviving epidermis shows all the signs of a normal differentiation program [12], so that long-term culture is important for skin models. Contraction of the human collagen matrix is regulated by tension homeostasis—the balance between the ECM and intracellular traction forces [13,14,15,16]. To improve the poor mechanical properties of collagen matrices [17], investigations has been made to add poly (caprolactone) (PCL) to collagen [18], used gelatin instead of collagen [19], and reproduced the tension equilibrium by pulling the collagen matrix [20].
Silica nonwoven fabrics (SNF) prepared by electric field spinning via a sol-gel process developed by Kawakami et al. [21,22,23] show high biocompatibility [24] and high thermal stability [25]. SNF with interconnected highly porous microstructures [26] mimic the fibrillar ECM [27,28] and are effective as a three-dimensional scaffold for cell culture [29,30]. Studies with NIH3T3 and Normal human dermal fibroblasts (NHDF) cells also showed that SNF contributed to the high functionality of these cells [30,31]. Furthermore, their mechanical properties showed sufficient mechanical strength and permeability for implantation [32,33]. The SNFs’ mechanical strength and high elasticity makes them suitable for long-term cell cultivation as they do not shrink even when cells migrate and grow. Therefore, SNF are a useful biomimetic material with high cell functionality that can morphologically mimic the ECM and function as a cell scaffold for skin models [30,31].
With this SNF, the problem of collagen matrices which has shrinkage after long-term cultivation [11] can be improved. Also, collagen matrices lack the ability to form elastin fibers, would be able to solve by applying SNF, which contains high porous microstructures [26], that has the potential to enhance fibroblast function within SNFs. Using SNF to construct a three-dimensional artificial skin model can improve the problems of known models such as the collagen matrix.
In this study, we evaluated the usefulness of SNF by creating a three-dimensional artificial skin model. We created skin models using immortalized and primary cultured cell lines and conducted morphological observations, gene expression analysis, and skin corrosion tests. Finally, we propose a new model for the combination of SNF and collagen that utilizes the stability of the rigid SNF skin model.

2. Materials and Methods

2.1. Reagents

SNF (Cellbed, thickness 150 µm) were purchased from Japan Vilene Co., Ltd., (Tokyo, Japan). Collagen gel was purchased as a collagen gel culturing kit from Nitta Gelatin Inc. (Osaka, Japan). This kit contained 3 mg/mL collagen solution (Cellmatrix Type 1-A, pig tendon, pH 3.0), 10× Ham’s medium, and 50 mM reconstitution buffer (NaOH solution containing 260 mM NaHCO3 and 200 mM HEPES). For the skin corrosion test, 3-(4,5-dimethylthial-2-yl)-2,5-diphenyltetrazalium bromide (MTT) was purchased from Fujifilm Co., Ltd., (Tokyo, Japan). Ultrapure water (18.2 MΩcm) was prepared using Direct-Q UV5 (Merck KGaA, Darmstadt, Germany).

2.2. Cell Culture

The NIH3T3 cell line was acquired from ATCC (Manassas, VA, USA). The human keratinocyte cell line (HaCaT) was obtained from Cosmobio Co., Ltd., (Tokyo, Japan). These cells were cultured in Dulbecco’s modified Eagle’s medium (D-MEM, 4.5 g/L glucose, Nacalai Tesque, Inc., Kyoto, Japan) supplemented with 10% (v/v) fetal bovine serum (Corning Inc., Corning, NY, USA) and 1% (v/v) penicillin-streptomycin mixed solution (stabilized, anti, Nacalai Tesque, Inc., Kyoto, Japan). The cells were cultured in humidified air with 5% CO2 at 37 °C. Both cell lines used for the experiments were in passages 3–32.
Normal human dermal fibroblasts (NHDF) from pooled donors and normal human epidermal keratinocytes (NHEK) from pooled donors, obtained from PromoCell, Inc. (Heidelberg, Germany), were cultured in Fibroblast Basal Medium 2 and Keratinocyte Growth Medium 2 (PromoCell GmbH., Heidelberg, Germany), respectively. The medium was supplemented with 1% (v/v) of anti. The cells were cultured in humidified atmosphere with 5% CO2 at 37 °C. NHDF used for experiments were in passages 1–4 and NHEK were in passages 1–2.

2.3. Preparation of Skin Models

2.3.1. Preparation of a Single Material Skin Models with Immortalized Cells or Primary Cells

We prepared four types of models: Epidermal, SNF epidermal, SNF dermal/epidermal, and Collagen dermal/epidermal. SNF were punched in 11 mm diameter circles using a hole punch and attached to a cell culture insert (Corning Inc., NY, USA) with porous polyethylene terephthalate (PET) track-etched membranes (membrane pore size: 0.4 µm). The cell culture insert, attached to 12-well plate (VIOLAMO, IKEDA SCIENTIFIC Co., Ltd., Tokyo, Japan), was then filled with 100 µL 70% ethanol for 10 min. After the ethanol was removed, 100 µL of phosphate-buffered saline (PBS, Thermo Fisher Scientific K. K., Tokyo, Japan) was added for 10 min and removed. This was repeated thrice. The number of fibroblasts [34] and keratinocytes [35] were adjusted to the cell density in a previous study. We seeded 5.0 × 10⁵ NIH3T3 cells in 400 µL D-MEM medium on the SNF and poured 1 mL D-MEM outside the cell culture insert for the SNF dermal/epidermal model. We cultured the model for 5 days while changing the medium every 2 or 3 days. After 5 days, 2.5 × 10⁵ HaCaT/400 µL assay medium was seeded on the SNF in the cell culture insert. For the Collagen dermal/epidermal model, 5.0 × 10⁵ NIH3T3/10 µL D-MEM were prepared. At 4 °C, 400 µL of 3 mg/mL collagen solution, 50 µL of 10 × Ham’s medium, and 50 µL of 50 mM reconstitution buffer were mixed together. From this mixture, 390 µL was taken out and 10 µL of the NIH3T3 cell suspension was added. Next, 400 µL of this mixture was poured onto the cell culture insert. After incubation at 37 °C with 5% CO2 for 1 h until the collagen gelated, 2.5 × 10⁵ HaCaT/400 µL assay medium were seeded on the collagen in the cell culture insert. After HaCaT seeding, the process was the same for all models. One milliliter of assay medium was poured outside the insert. After 24 h, the medium in the insert was removed and the culture was started at the air-liquid interface. The medium was changed every 2 or 3 days for 14 days. Excluding the process of seeding NIH3T3 from the SNF dermal/epidermal model would give the SNF epidermal model, and excluding SNF would give the Epidermal model (Figure 1).

2.3.2. Preparation of Skin Model with Primary Cells

For primary cell cultures, 24-well plates (VIOLAMO, IKEDA SCIENTIFIC Co., Ltd., Tokyo, Japan) were used: 2.11 × 10⁵ NHDF/well and 2.0 × 10⁵ NHEK/well (Figure 1). The experimental manipulation is the same as in Section 2.3.1.

2.3.3. Preparation of Skin Model Combining SNF and Collagen with Immortalized Cells

For the sCS (solution of collagen-treated SNF) model, 2 mL of 70% ethanol were placed in a 6-well plate and SNF (11 mm diameter) was immersed for 10 min. Next, 2 mL of 0.01% or 0.1% collagen was added to the 6-well plate and the SNF was immersed for 1 h in each. Sterile water (2 mL) was added to the 6-well plate and the SNF was placed in the cell culture insert after light soaking in sterile water. This cell culture insert was attached to 12-well plate. We then seeded 5.0 × 10⁵ NIH3T3/400 µL D-MEM medium on the SNF and poured 1 mL of D-MEM outside the cell culture insert. We cultured the model for 5 days while changing the medium every 2 or 3 days. After five days, we seeded 2.5 × 10⁵ HaCaT/400 µL of assay medium on the SNF in the cell culture insert and poured 1 mL of assay medium outside the insert. After 24 h, the medium in the insert was removed, and the culture was started at the air-liquid interface. The medium was changed every 2 or 3 days for 14 days. For the gCS (gel of collagen with SNF) model, 2 mL of 70% ethanol were placed in a 6-well plate and SNF was immersed for 10 min. Next, 2 mL of PBS was added to a 6-well plate, and the process was repeated thrice to soak the SNF for 3 min. We placed the SNF in a cell culture insert, seeded 5.0 × 10⁵ NIH3T3/200 µL D-MEM medium on the SNF, and poured 1 mL of D-MEM outside the cell culture insert. We cultured the model for 5 days while changing the medium every 2 or 3 days. After five days, 20 µL of 3 mg/mL collagen solution, 15 µL of Ham’s medium, and 15 µL of reconstitution buffer were mixed at 4 °C (1.2 mg/mL). In addition, 40 µL of a 3 mg/mL collagen solution, 5 µL of Ham’s medium, and 5 µL of reconstitution buffer were mixed at 4 °C on ice (2.4 mg/mL). From these mixtures, 30 µL was collected from each sample and poured into the cell culture insert. After incubation at 37 °C with 5% CO2 for 1 h, collagen gelated. We seeded 2.5 × 10⁵ HaCaT/400 µL of assay medium on the SNF in the cell culture insert and poured 1 mL of assay medium outside the insert. After 24 h, the medium in the insert was removed, and the culture was started at the air-liquid interface. The medium was changed every 2 or 3 days for 14 days (Figure 1).

2.4. Histology

The model was cut out of the cell culture insert with a scalpel and placed in a cassette (41701, Asone Corp., Osaka, Japan) in a 10 cm dish (Thermo Fisher Scientific K. K., Tokyo, Japan). The models were fixed in 4.0% paraformaldehyde phosphate buffer solution (Nacalai Tesque, Inc., Kyoto, Japan) and embedded in paraffin after dehydration; 5 or 10 µm sections were stained with hematoxylin and eosin. The samples were observed under an optical microscope (BX50, OLYMPUS Corp., Tokyo, Japan). We acquired five images per section, measured the thickness in two places each, and took the average value (n = 10). However, for sections for which we could not take 5 pictures, we counted them to n = 10.

2.5. High Resolution Scanning Electron Microscopic (SEM) Observation

The models were immersed in liquid nitrogen containing a cell culture insert for 10 s and then lyophilized overnight in a freeze-dryer (FDU-1200, Tokyo Rikakikai Co., Ltd., Tokyo, Japan). The specimens were coated with Au for 20 s using a Quick Coater (SC-701; Sanyu Electron Co., Ltd., Tokyo, Japan) and observed using SEM (VE-8800; Keynence Corp., Osaka, Japan).

2.6. Reverse Transcription-Quantitative Polymerase Chain Reaction (RT-qPCR) Analysis

Total RNA was isolated from the models using QIAzol Lysis Reagent (QIAGEN, Hilden, Germany) according to the manufacturer’s protocol. The RNA concentration was measured using an ultra-trace spectrophotometer (NanoDrop One, Thermo Fisher Scientific K. K., Tokyo, Japan). First-strand cDNA was synthesized using 0.5 μg of total RNA with ReverTra Ace® qPCR RT Master Mix with a gDNA Remover kit (Toyobo Co., Ltd., Osaka, Japan) using a thermal cycler (Mastercycler®, Eppendorf Co., Ltd., Tokyo, Japan). RT-qPCR was performed with the THUNDERBIRD® SYBR® qPCR Mix (Toyobo, Co., Ltd., Osaka, Japan) using a thermocycler (CFX ConnectTM Real-Time PCR Detection System, Bio-Rad Laboratories, Inc., CA, USA). RT-qPCR conditions were as follows: 95 °C (60 s), 40 cycles of 95 °C (15 s), and 60 °C (60 s). We used 10 gene primers for the gene expression analysis (Table S1 and Figure S1). Data were normalized to GAPDH, and evaluated by relative mRNA abundance as determined by the ΔΔCt method. Melting curve analysis was conducted after the amplification step to eliminate the possibility of amplification of nonspecific amplification or primer dimer formation.

2.7. Skin Corrosion Test by MTT Assay

The skin corrosion was evaluated using the MTT assay [36]. The MTT test was performed on a skin model using NHEK and NHDF cells. The model was removed from the CO2 incubator and 100 µL of 14.4% hydrochloric acid (Fujifilm Co., Ltd., Tokyo, Japan) and 8 N KOH (anhydride ratio 0.85, Fujifilm Co., Ltd., Tokyo, Japan) were added. Distilled water (100 µL) was used as the negative control. Each model was incubated for 3 min at room temperature and for 60 min in incubator. The test and control items were then dosed with PBS approximately five times around the insert and on the model surface. Then, 300 µL of 1 mg/mL MTT solution was applied to the model surface and incubated for 3 h [36]. After 3 h, the whole membrane filter of each insert was cut with a scalpel and the cultured epidermal fragments were placed in 1.5 mL microtubes. The microtubes were filled with 1 mL of dimethyl sulfoxide (DMSO) and washed with a biomasher (Power Masher II, Nippi Inc., Tokyo, Japan) for 1 min. The microtubes were then subjected to sonication (38 kHz, Ultrasonic Cleanser US-104N, SND Co., Ltd., Nagano, Japan) for 10 min and mixed thoroughly. The extracted formazan solution was placed in 96-well microplates (TPP AG., Trasadingen, Switzerland) in three wells with 200 µL in each well, and the formazan products were quantified by measuring absorbance at 530 nm with absorption spectrophotometry (POWERSCAN HT, DS Pharma Biomedical Co., Ltd., Osaka, Japan). The cell viability was calculated as follows:
% Viability = Evaluation   substance   absorbance Blank   ( DMSO )   absorbance Negative   control   absorbance Blank   ( DMSO )   absorbance
In accordance with OECD Test Guideline 431, the following acceptance criteria must be met [36]: the condition of corrosiveness occurs when the survival rate is “less than 50% after exposure for 3 min or greater than 50% after 3 min exposure and less than 15% after 60 min exposure and the condition of non-corrosiveness is when the survival rate is >50% after 3 min of exposure and >15% after 60 min of exposure”. Two samples were considered for each condition (n = 2).

3. Results

3.1. Three-Dimensional Model of SNF Skin Using Immortalized Cells

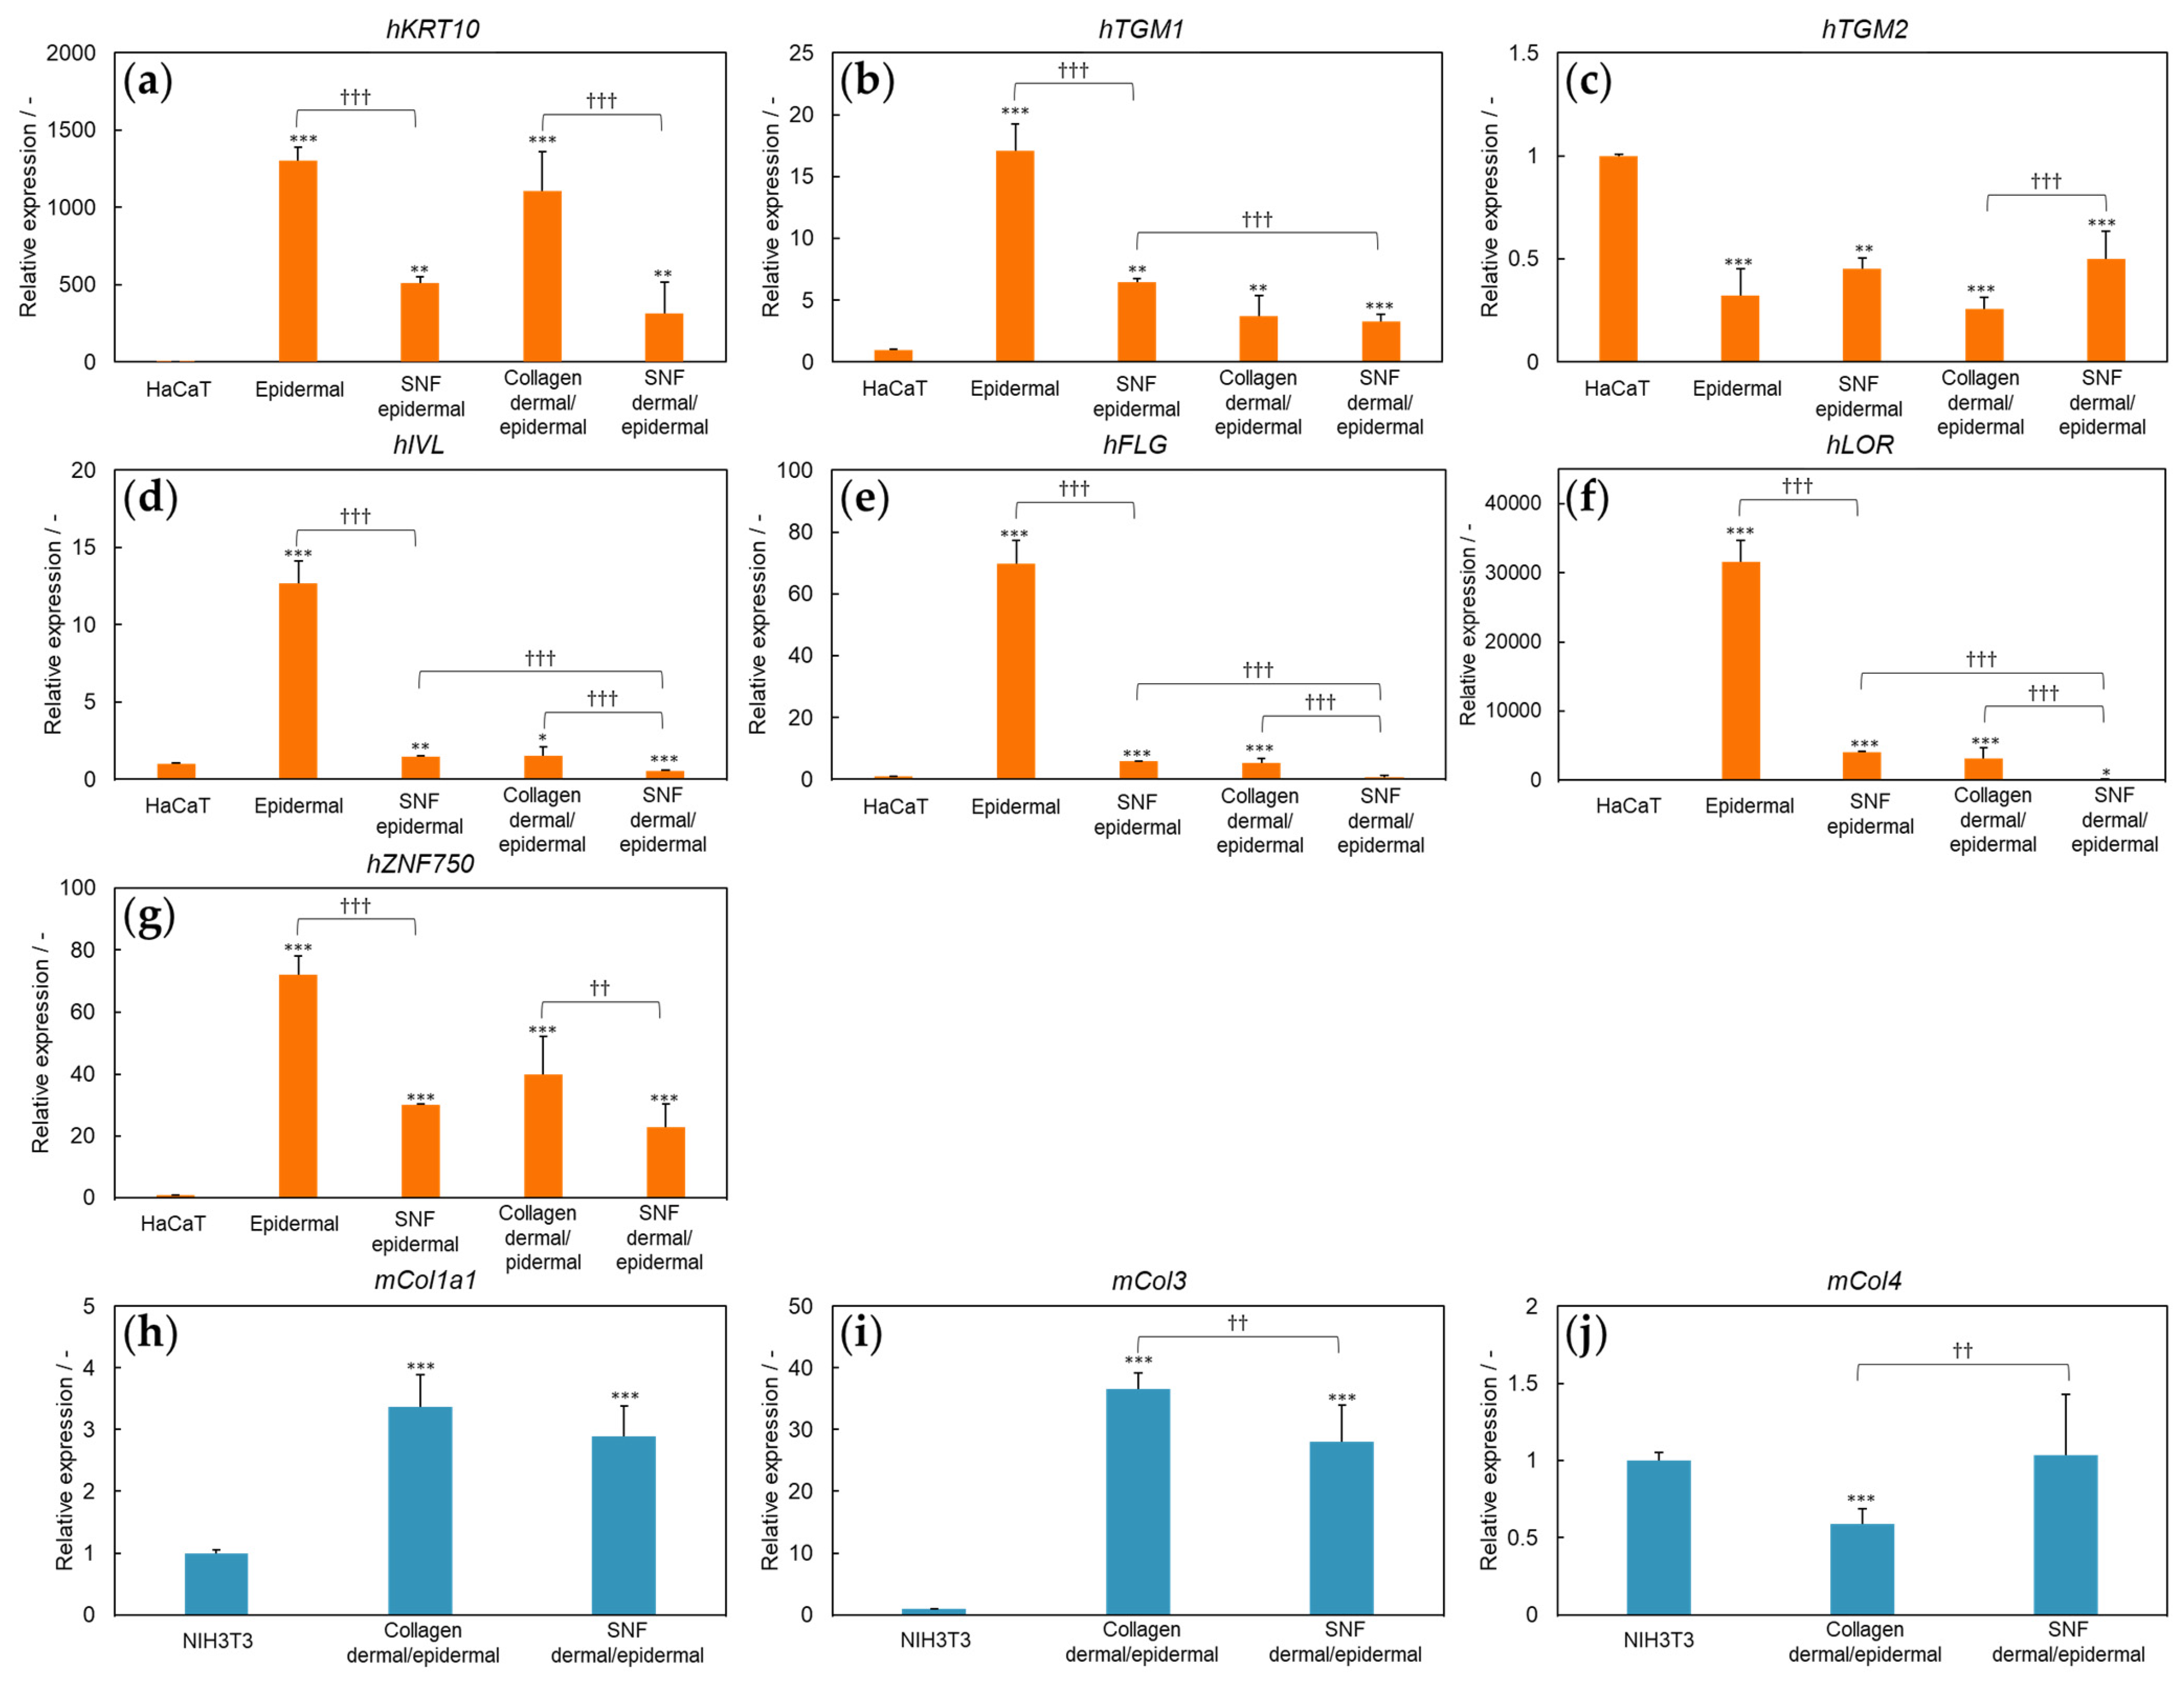
First, we compared the models using only epidermal cells by comparing Epidermal and SNF epidermal models. Morphological observations using hematoxylin-eosin staining showed that an epidermis-like layer was constructed on the cell culture insert membrane in the Epidermal model and SNF epidermal model, while some HaCaT cells were present inside the SNF. In addition, the SNF epidermal model (63.8 ± 7.1 µm) had a thicker epidermal layer than the Epidermal model (47.1 ± 17.4 µm) (Figure 2a,b,e). The cells of both models had the same round shape in most parts of the model. The SNF epidermal model also showed cells in the lower epidermal layer where SNF was present. For the RT-qPCR, human genes hKRT10 (Keratin 10), hTGM1 (Transglutaminase 1), hTGM2 (Transglutaminase 2), hIVL (Involucrin), hFLG (Filaggrin), hLOR (Loricrin), and hZNF750 (Zinc finger protein 750) were selected as epidermal layer markers in this experiment. The mouse genes mCol1a1 (Collagen I α1), mCol3 (Collagen III), and mCol4 (Collagen IV) were selected as dermal layer markers. The expression of hTGM2 showed no significant difference in both models. The expression of hKRT10, hTGM1, hIVL, hFLG, hLOR, and hZNF750 was significantly upregulated in the Epidermal model compared with that in the SNF epidermal model (Figure 3).
To examine the material of the dermal layer, we compared the SNF dermal/epidermal model with the Collagen dermal/epidermal model. Morphological observations using hematoxylin-eosin staining showed that the Collagen dermal/epidermal model (87.1 ± 13.7 µm) had a thicker epidermal layer than the SNF dermal/epidermal model (63.8 ± 7.1 µm) (Figure 2c–e). Furthermore, the cells in both models were round in the lower part and flattened in the upper part. In the Collagen dermal/epidermal model, the epidermal layer formed on top of the collagen and some fibroblasts could be seen in the dermal collagen layer. In contrast, in the SNF dermal/epidermal model, few cells were observed in the SNF, and the epidermal layer formed on top of the SNF. The results of RT-qPCR showed that the expression of hTGM2 and mCol4 was upregulated in the SNF dermal/epidermal model compared with the Collagen dermal/epidermal model, while the expression of hKRT10, hIVL, hFLG, hLOR, hZNF750, and mCol3 was significantly upregulated in the Collagen dermal/epidermal model compared with the SNF dermal/epidermal model (Figure 3).
We also compared the SNF epidermal model and SNF dermal/epidermal model to determine the effect of fibroblasts in the SNF layer. Morphological observations using hematoxylin-eosin staining showed that there was no significant difference in epidermal thickness between the SNF epidermal model (63.8 ± 7.1 µm) and the SNF dermal/epidermal model (65.2 ± 10.9 µm) (Figure 2b,d,e). The results of RT-qPCR showed that the expression of hTGM1, hIVL, hFLG, and hLOR was significantly upregulated in the SNF epidermal model compared with that in the SNF dermal/epidermal model (Figure 3).

3.2. Three-Dimensional Model of SNF Skin Using Primary Cultured Cells

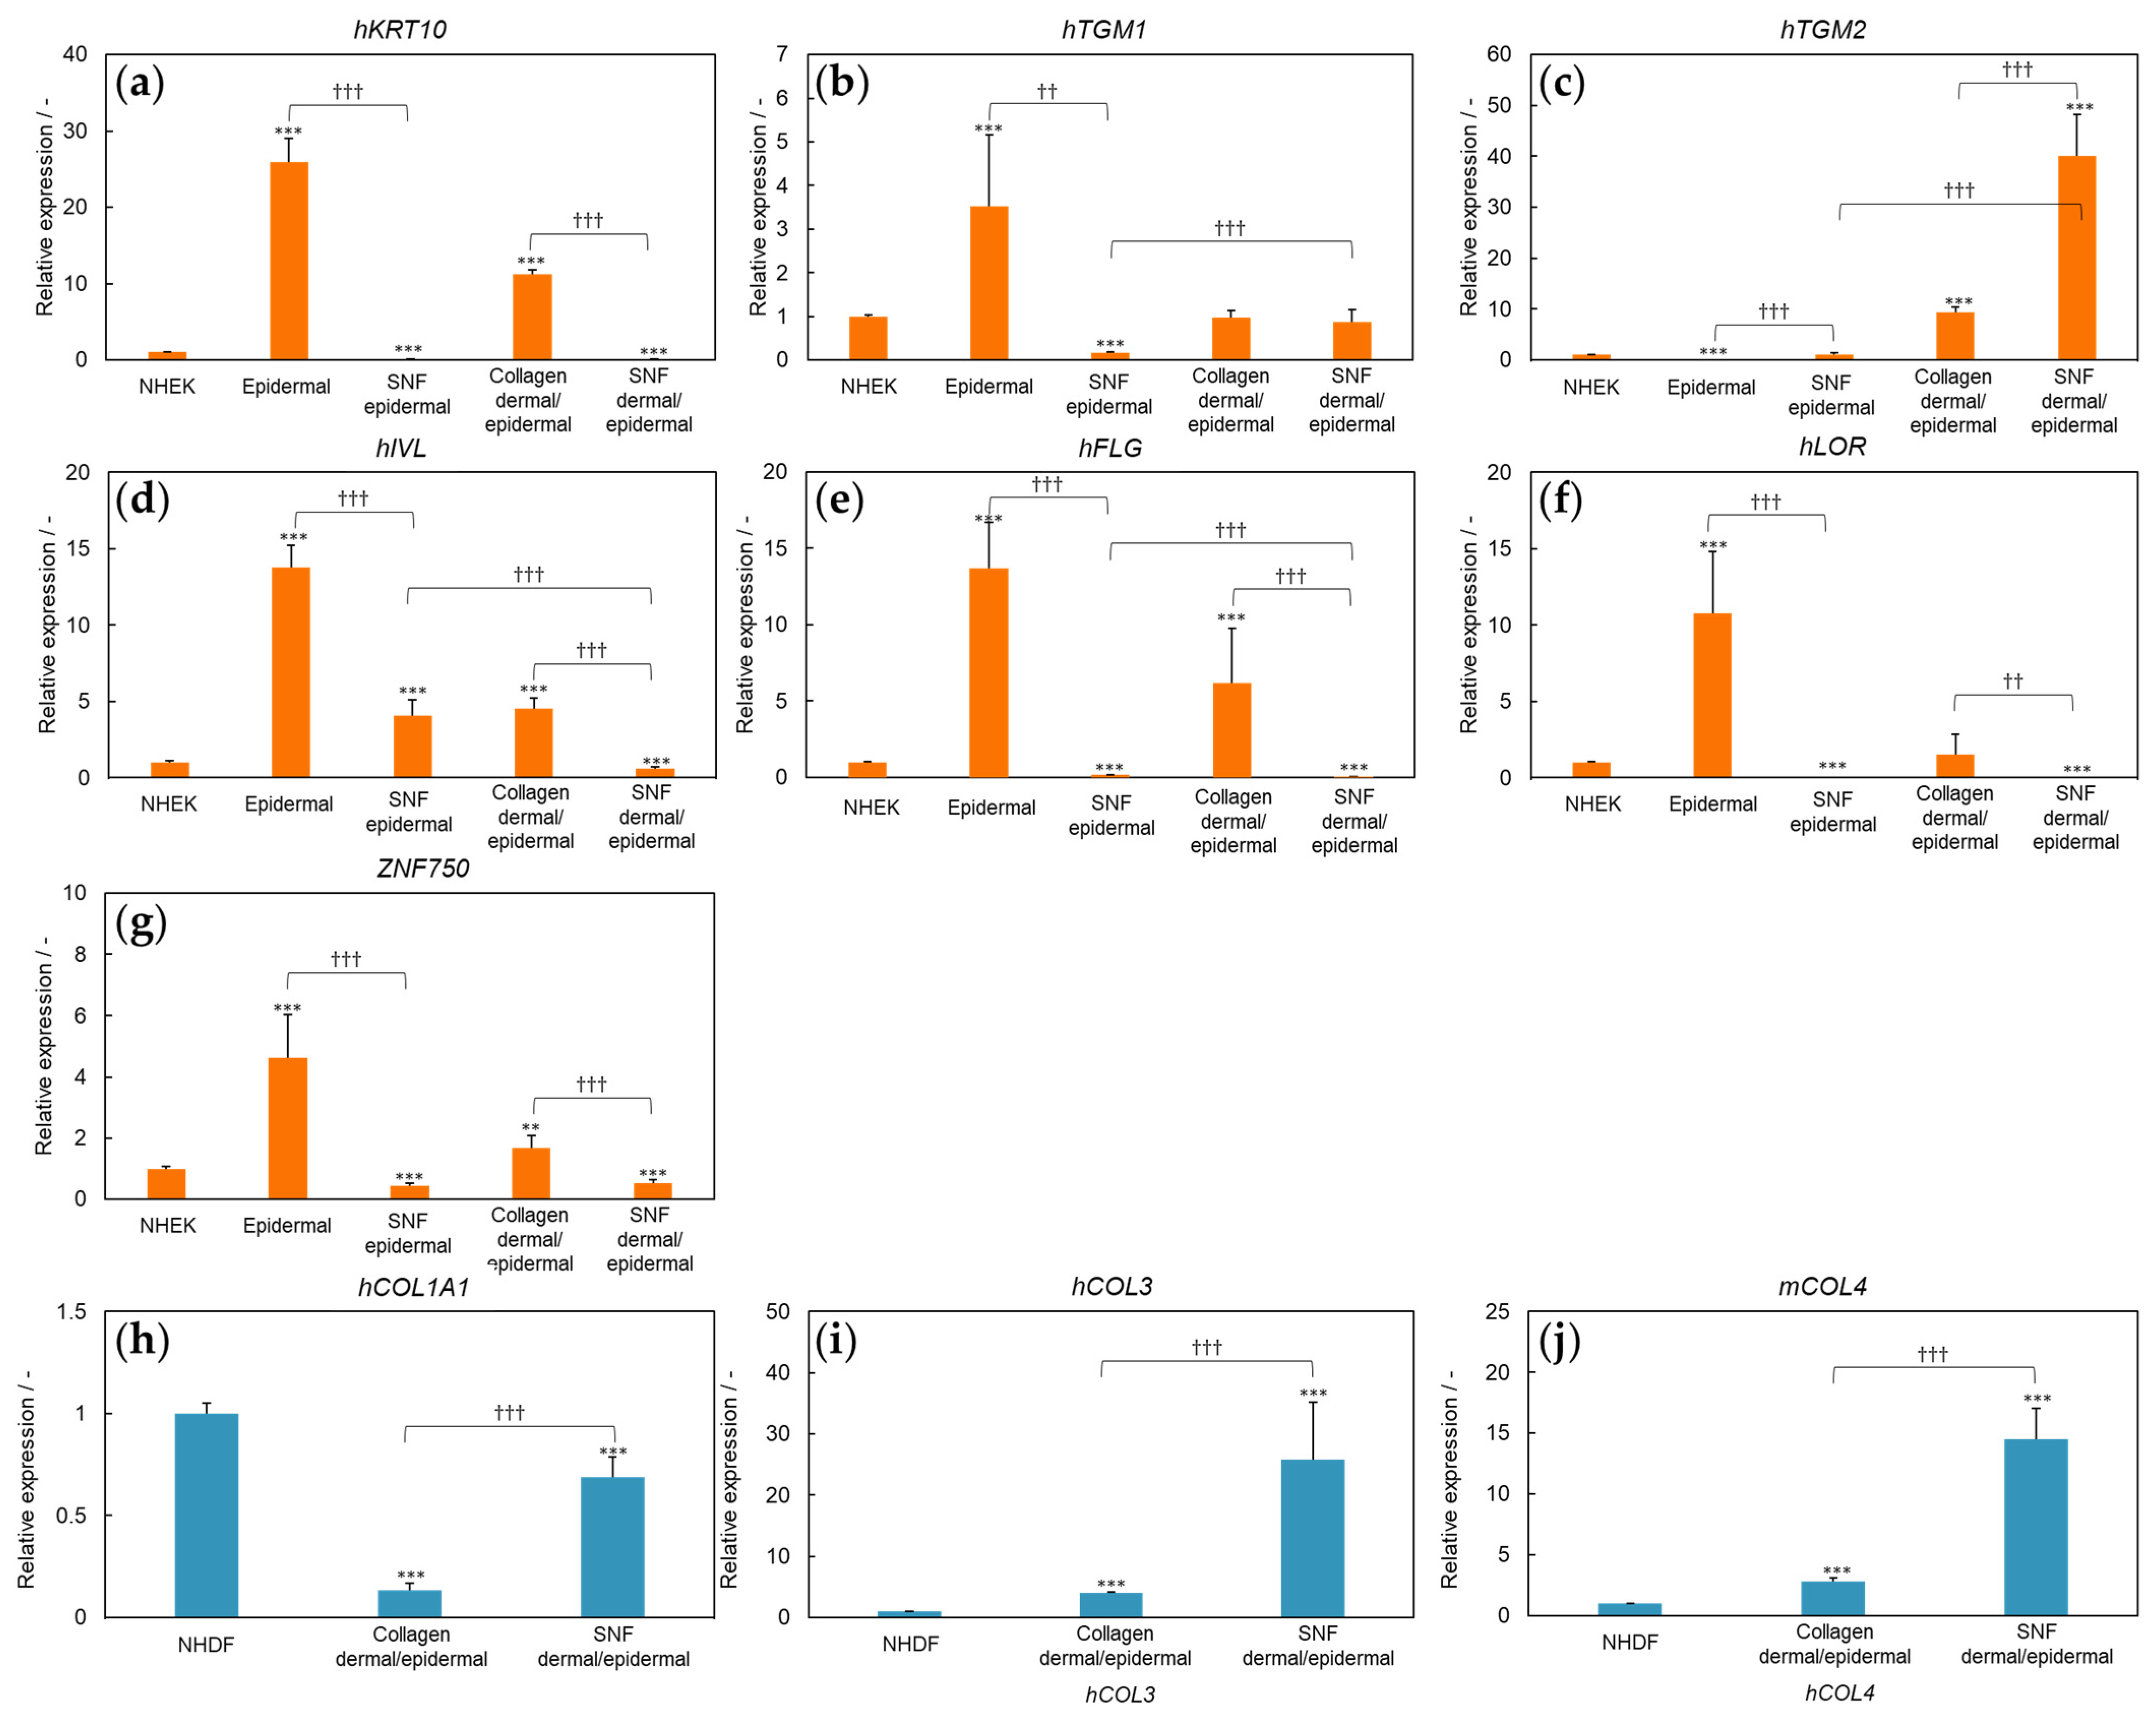
We constructed models using only epidermal cells and compared the Epidermal and SNF epidermal models. RT-qPCR showed that the expression of hTGM2 was upregulated in the SNF epidermal model compared with the Epidermal model, while the expression of hKRT10, hTGM1, hIVL, hFLG, hLOR, and hZNF750 was significantly upregulated in the Epidermal model (Figure 4).
To examine the dermis material, we compared the SNF dermal/epidermal model with the Collagen dermal/epidermal model. The expression of hTGM2, hCOL1A1, hCOL3, and hCOL4 was upregulated in the SNF dermal/epidermal model compared with that in the Collagen dermal/epidermal model, while the expression of hKRT10, hIVL, hFLG, hLOR, and hZNF750 was significantly upregulated in the Collagen dermal/epidermal model compared with that in the SNF dermal/epidermal model (Figure 4).
We also compared the SNF epidermal model and SNF dermal/epidermal model to determine the effect of fibroblasts in the SNF layer. The expression of hTGM1 and hTGM2 was upregulated in the SNF dermal/epidermal model compared with that in the SNF epidermal model, whereas the expression of hIVL and hFLG was significantly upregulated in the SNF epidermal model compared with the SNF dermal/epidermal model (Figure 4).

3.3. Application of Skin Models to Skin Corrosion Testing

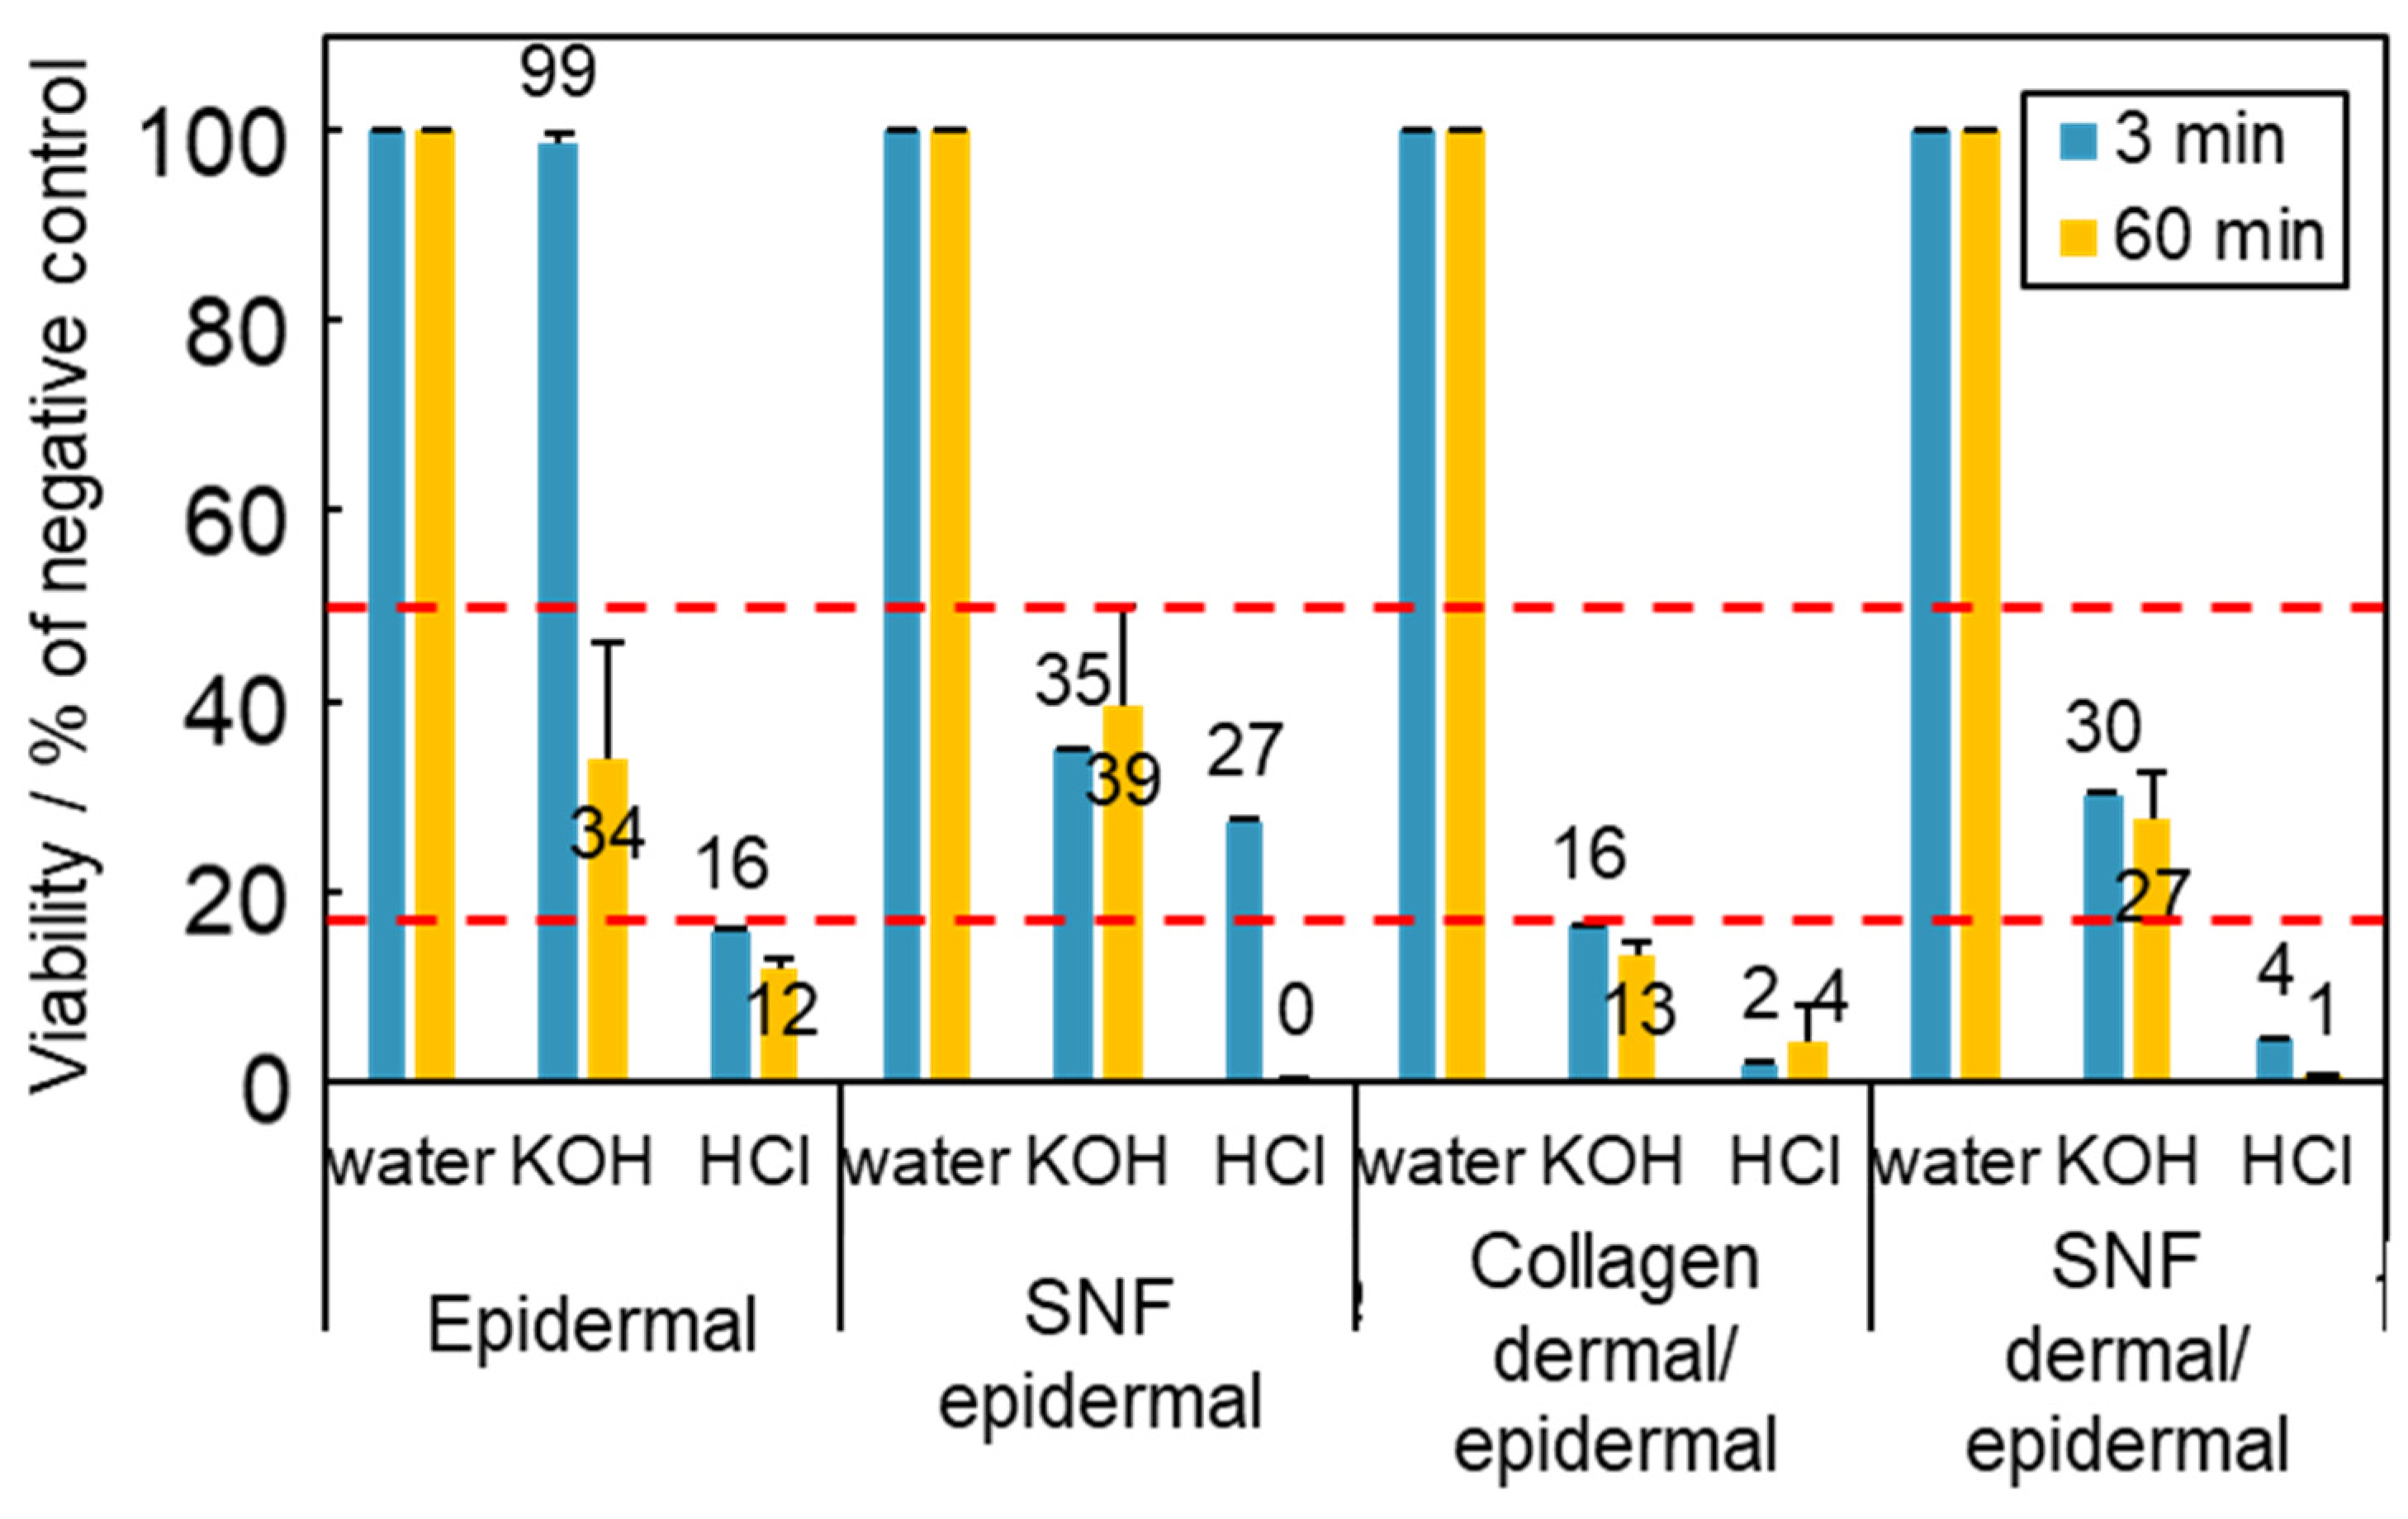
For the SNF epidermal, SNF dermal/epidermal, and Collagen dermal/epidermal models, the survival rate was lower than 50% at 3 min after the addition of 8 N KOH and 14.4% HCl. In contrast, for the epidermal model, the survival rate was >50% at 3 min after the addition of 8 N KOH, and even at 60 min, the survival rate was >15% (Figure 5).

3.4. Three-Dimensional Model of SNF and COLLAGEN Using Immortalized Cells

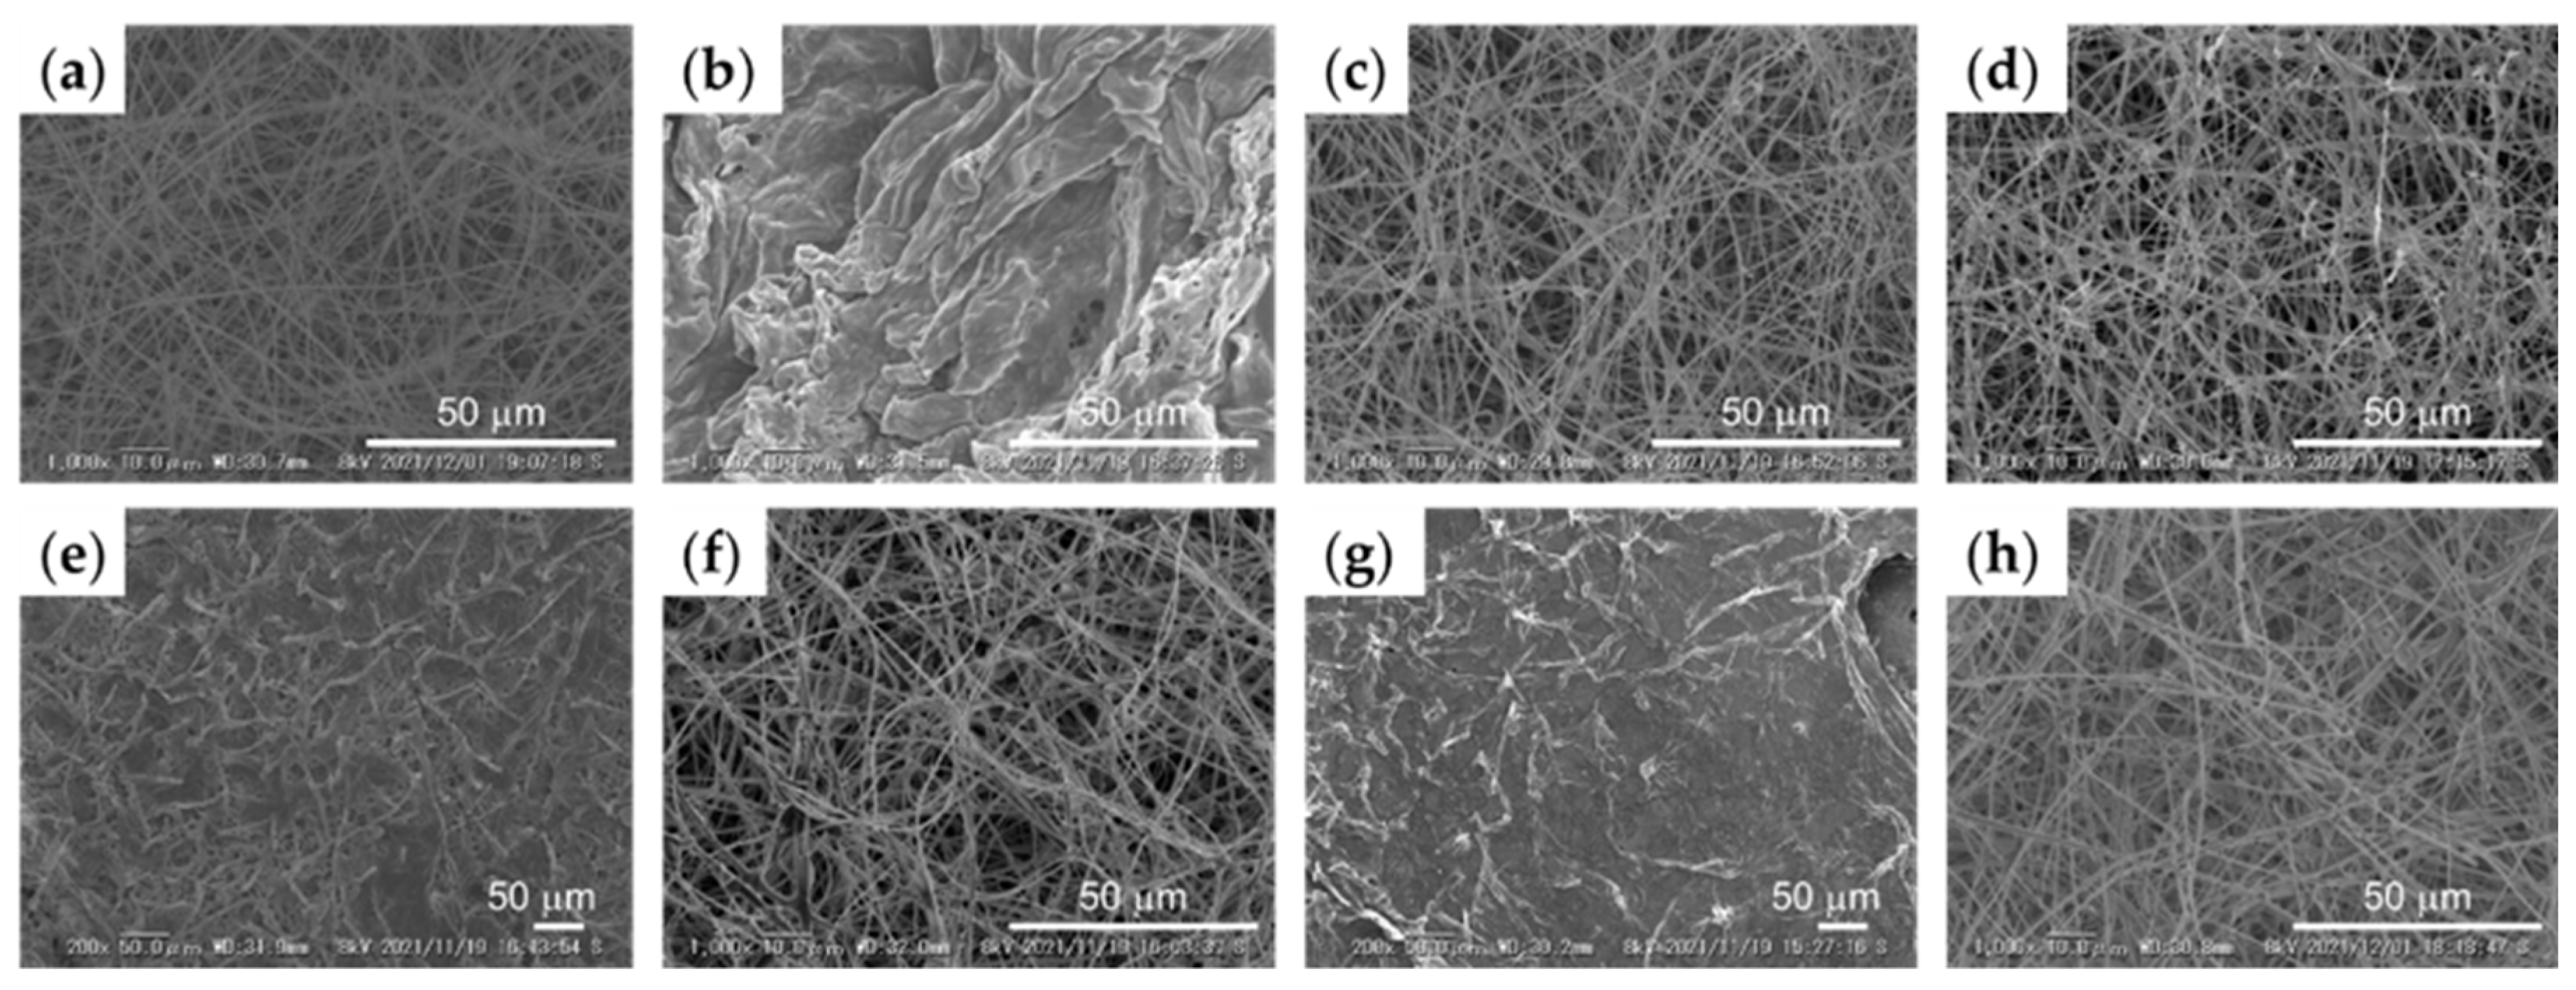
In the combination model of SNF and collagen, we examined two models: the sCS (solution of collagen-treated SNF) model where the SNF was immersed in a collagen solution and the gCS (gel of collagen with SNF) model where the collagen gel was poured into the SNF. Each model was examined using different collagen concentrations. We first observed each model using SEM. The SNF dermal/epidermal model showed SNF lined up in a fibrous pattern with voids (Figure 6a). In the Collagen dermal/epidermal model, collagen covered the entire surface (Figure 6b). In the sCS models, collagen modification around the SNF was observed at both concentrations (Figure 6c,d). For the gCS models, both concentrations showed a high density of collagen modification on the SNF in the upper layer but voids were observed (Figure 6e,g). In the middle layer of the gCS model, SNF was modified with collagen like in the sCS model (Figure 6c–h).
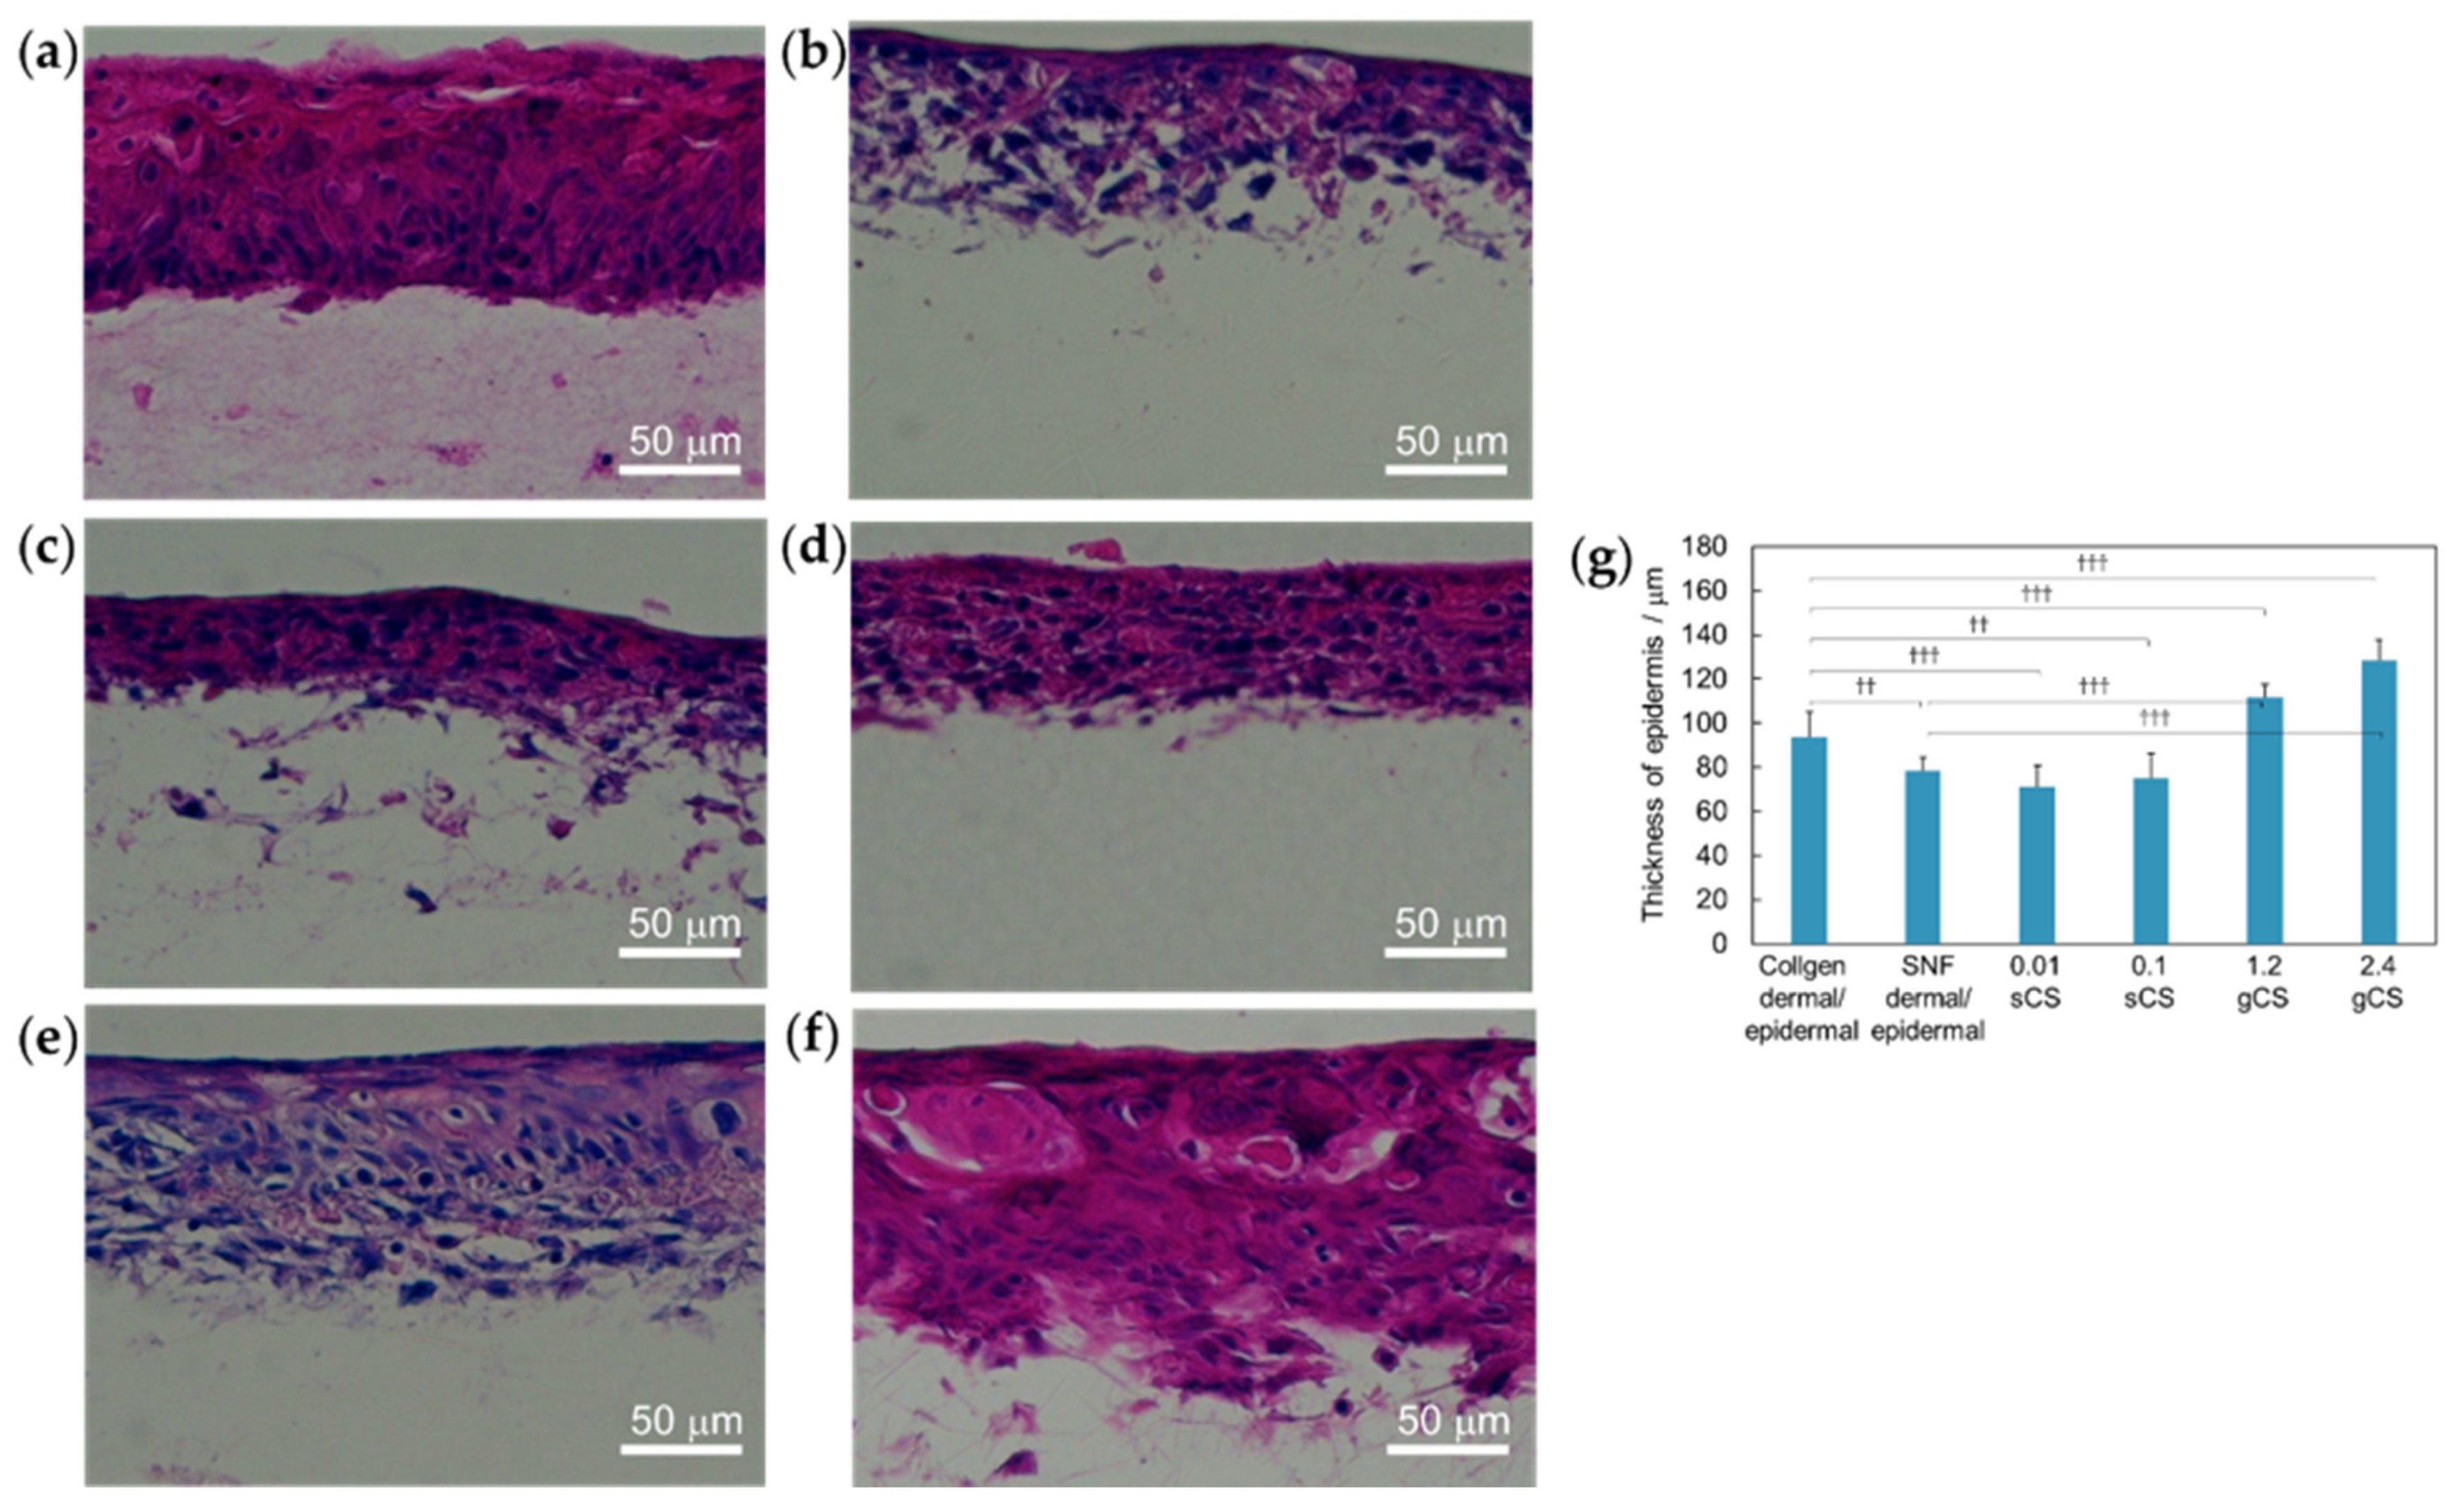
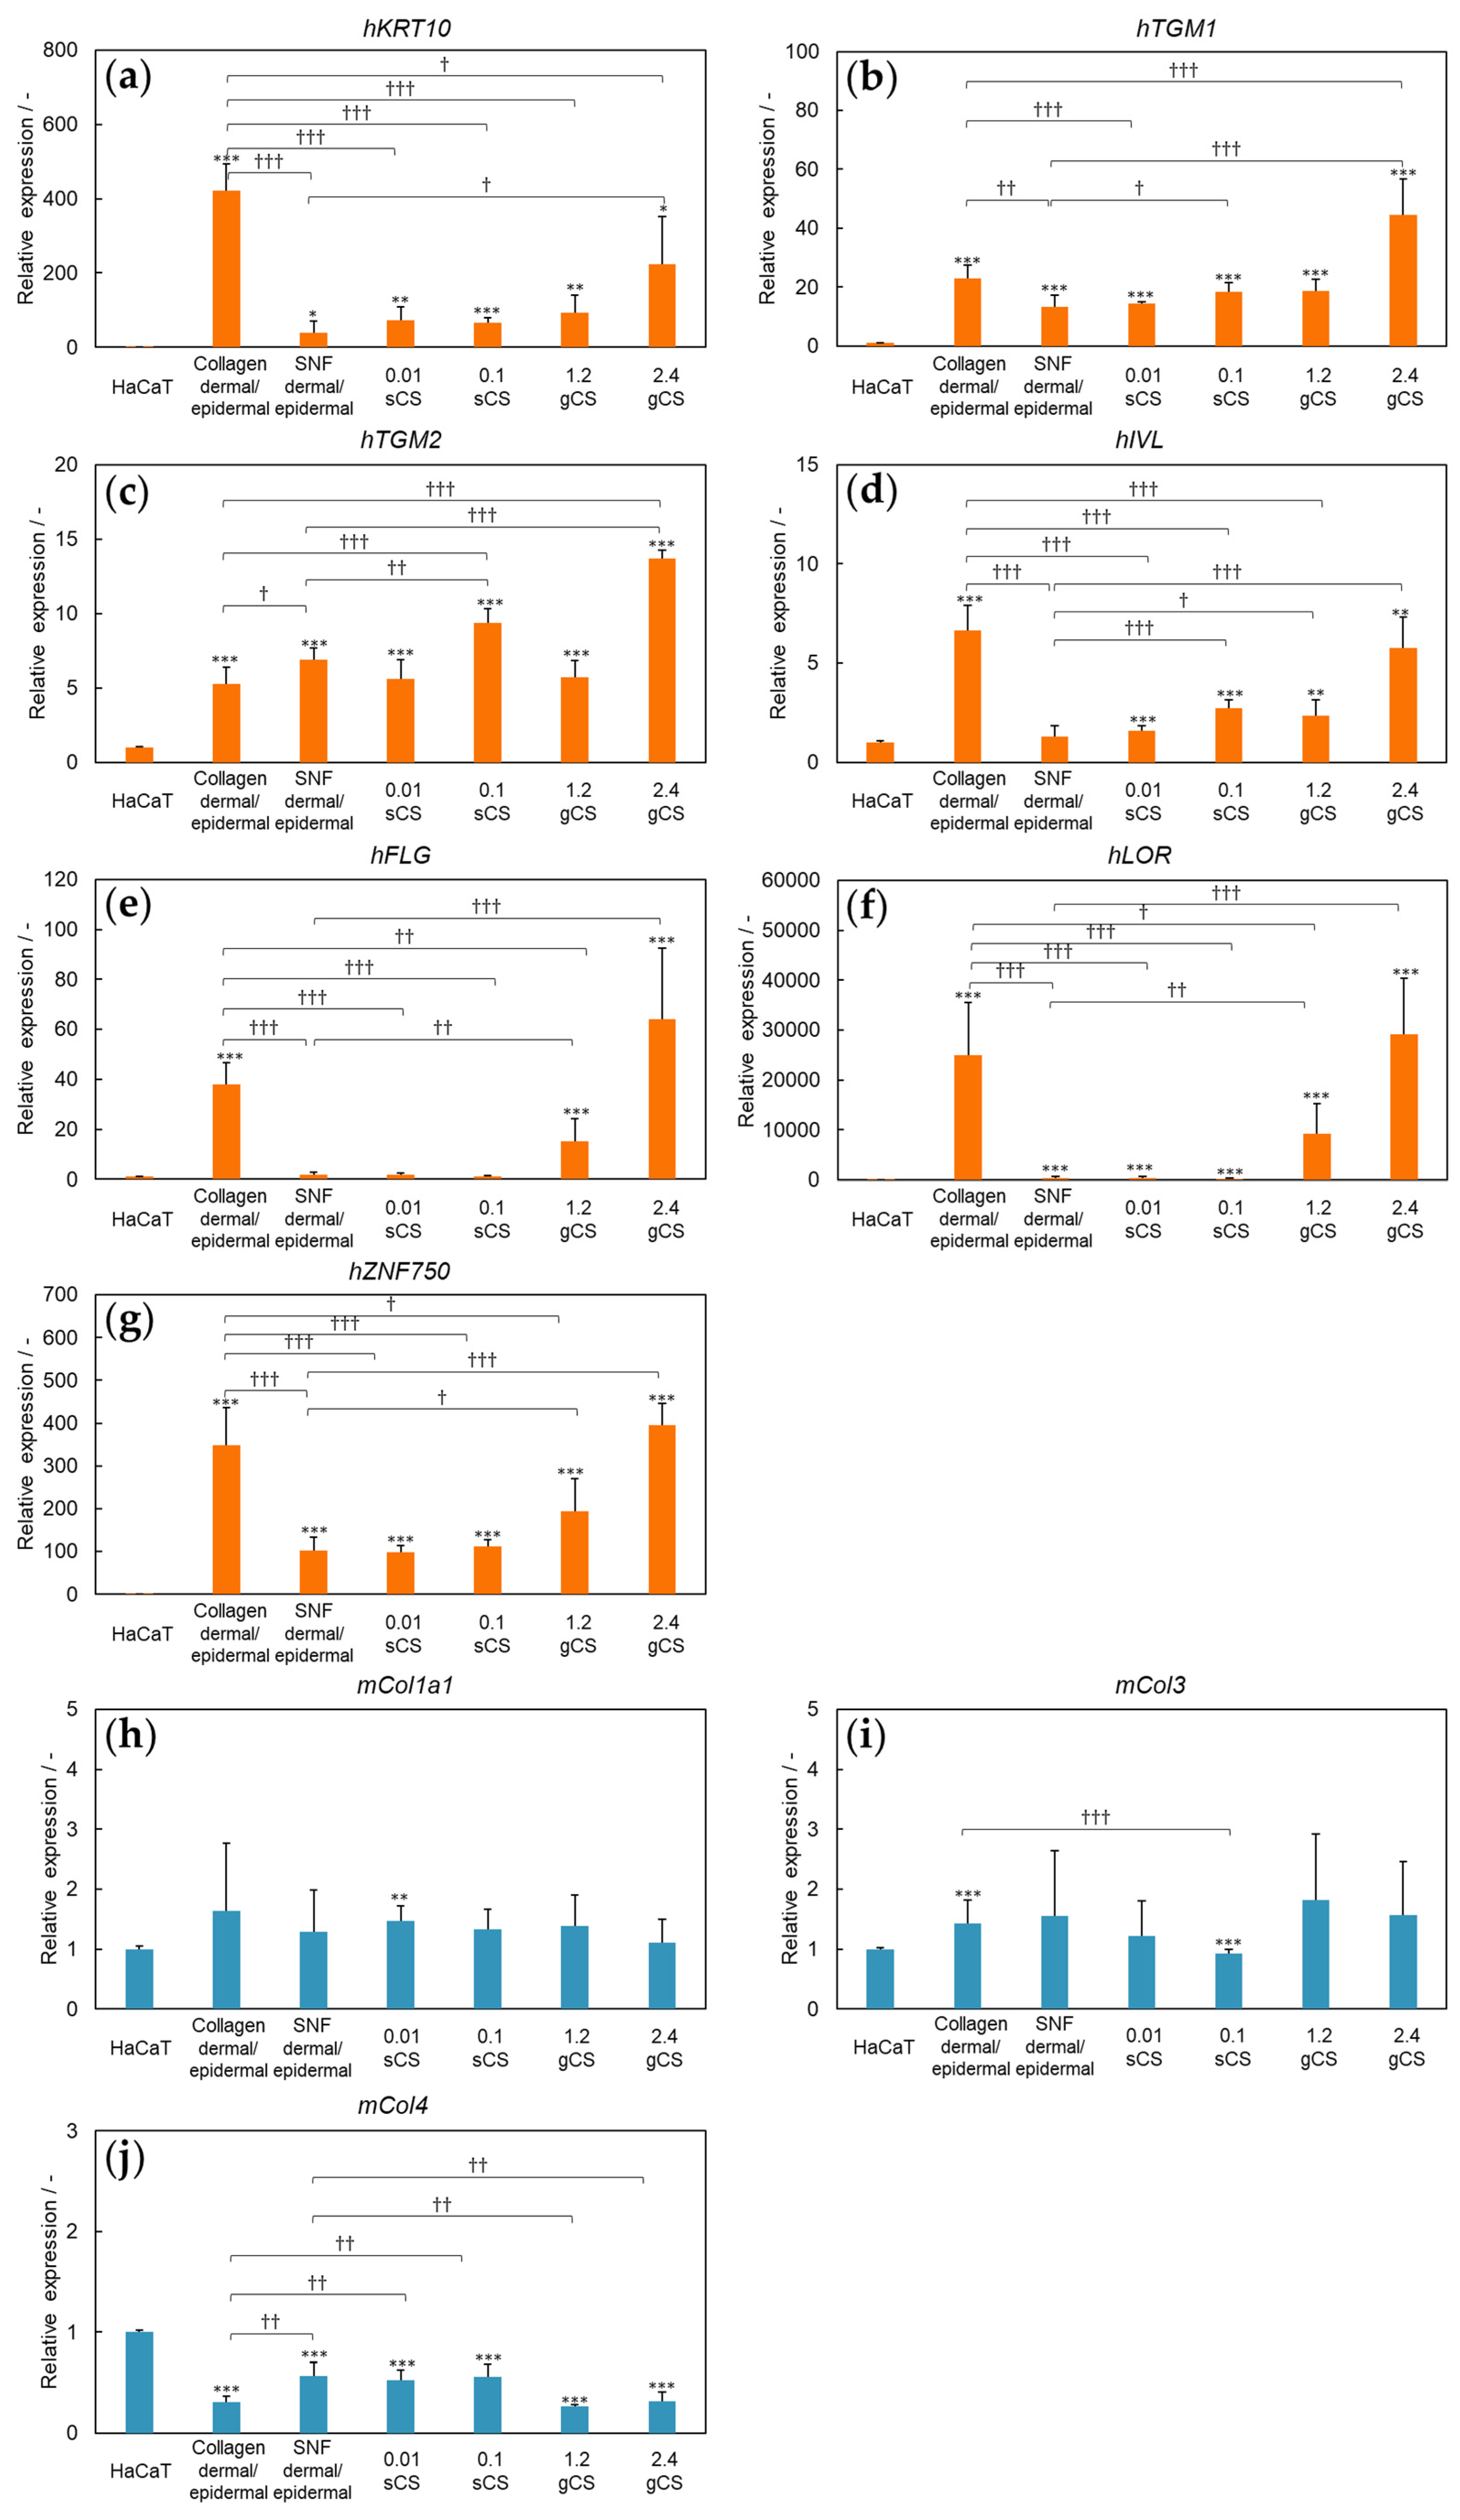
We compared these combination models with the SNF dermal/epidermal model and Collagen dermal/epidermal model. First, we compared them with a SNF dermal/epidermal model. Morphological observations using hematoxylin-eosin staining showed that there was no significant difference between the sCS model (0.01 sCS model: 70.9 ± 9.6 µm, 0.1 sCS model: 75.1 ± 10.9 µm) the SNF dermal/epidermal model (78.6 ± 5.9 µm) in epidermal thickness (Figure 7a,c,d,g). Also, both 1.2 gCS model (111.7 ± 5.7 µm) and 2.4 gCS model (128.0 ± 9.7 µm) had a thicker epidermal layer than the SNF dermal/epidermal model (78.6 ± 5.9 µm) (Figure 7b,e–g). Furthermore, the cells in the 1.2 and 2.4 gCS model were round in the lower part and flattened in the upper part, while the 0.01 and 0.1 sCS model had the same shape cells in most parts. In addition, in the 0.01 sCS model, most of the epidermal layer was formed on top of the SNF, although some cells were present in the SNF. On the other hand, in the 0.1 sCS, 1.2 gCS, and 2.4 gCS model, there were few cells in the SNF and the epidermal layer was formed on top of the SNF. The results of RT-qPCR showed that the expression of hTGM1, hTGM2, and hIVL were significantly up-regulated in the 0.1 sCS model compared with the SNF dermal/epidermal model (Figure 8). hIVL, hFLG, hLOR, and hZNF750 were significantly upregulated in the 1.2 gCS model compared with the SNF dermal/epidermal model, while mCol4 was significantly upregulated in the SNF dermal/epidermal model (Figure 8). hKRT10, hTGM1, hTGM2, hLOR, hIVL, hFLG, and hZNF750 were significantly upregulated in the 2.4 gCS model compared with the SNF dermal/epidermal model, while mCol4 was significantly upregulated in the SNF dermal/epidermal model (Figure 8).
Next, we compared the combination model with the Collagen dermal/epidermal model. As the models continue to be cultured, collagen is partially detached from the insert wall, while combinatory scaffold such as sCS and gCS models attached to the insert wall (Figure S2). Morphological observations using hematoxylin-eosin staining showed that both 0.01 sCS model (70.9 ± 9.6 µm) and 0.1 sCS model (75.1 ± 10.9 µm) had a thinner epidermal layer than the Collagen dermal/epidermal model (93.7 ± 11.3 µm) (Figure 7a,c,d,g). Both 1.2 gCS model (111.7 ± 5.7 µm) and 2.4 gCS model (128.0 ± 9.7 µm) had a thicker epidermal layer than the Collagen dermal/epidermal model (93.7 ± 11.3 µm) (Figure 7a,e–g). The results of RT-qPCR showed that the 0.01 sCS model had higher expression of mCol4 compared with the Collagen dermal/epidermal model, while the Collagen dermal/epidermal model had higher expression of hKRT10, hTGM1, hIVL, hFLG, hLOR, and hZNF750 compared with the 0.01 sCS model (Figure 8). The 0.1 sCS model showed upregulated expression of hTGM2 and mCol4 compared with the Collagen dermal/epidermal model, whereas the latter showed higher expression of hKRT10, hIVL, hFLG, hLOR, hZNF750, and mCol3 compared with the former (Figure 8). Compared to the 1.2 gCS model, the expression of hKRT10, hIVL, hFLG, hLOR, and hZNF750 was significantly upregulated in the Collagen dermal/epidermal model (Figure 8). In the 2.4 gCS model, there was a significant upregulation in the expression of hTGM1 and hTGM2 compared with the Collagen dermal/epidermal model. The Collagen dermal/epidermal model had higher expression of hKRT10 than the 2.4 gCS model (Figure 8).

4. Discussion

In this study, we created a three-dimensional model of the skin using SNF with immortalized cells and primary cultured cells. Both immortalized and primary cultured cells have several advantages. Immortalized cells have a long lifespan and their quality is maintained at the genetic level, even at high passages [35]. However, when immortalized keratinocytes are compared with primary cultured keratinocytes, the epidermis is thinner and does not have full differentiation potential in terms of morphology [37]. In addition, immortalized fibroblasts show a weaker response to cytotoxicity and differ from primary cultured fibroblasts in gene expression analysis [38]. Immortalized cell lines were used to take advantage of the small experimental error and long lifespan, whereas primary cultured cells have characteristics similar to those of human skin. Therefore, in this study, we used both the methods. First, to evaluate the effect of SNF on the epidermis, we compared Epidermal and SNF epidermal models. Compared to the Epidermal model, the SNF epidermal model was thicker in the immortalized cell models (Figure 2a,b,e). We then analyzed the expression of genes related to keratinization, basal epidermal formation, barrier function, proliferation, and dermis formation in both immortalized and primary cultured cell models. The expression of hTGM2—the formation factor of the epidermal basal layer [39]—was significantly upregulated in the SNF epidermal model compared with that in the Epidermal model in primary cultured cell models (Figure 3). Upregulated expression of hTGM2 means that it has high functions as a skin model. hTGM2 contributes to epithelial barrier function by reducing ECM degradation and stabilizing ECM-cell interactions [40,41]. This leads to cell adhesion [42], and stabilization of extracellular structures such as basement membrane complexes [43]. hTGM2 expression was upregulated in the SNF epidermal model, suggesting that skin modeling in SNF enhances cell and ECM function and stabilizes basement membrane structure. In contrast, the expression of hKRT10, and hTGM1 a factor of keratinization [44,45]; hIVL, hFLG, and hLOR, factors of barrier function [44], and hZNF750, a factor of cell proliferation [46], was significantly upregulated in the Epidermal model. SNF did not affect the promotion of keratinization but functioned as a basement membrane structure.
Next, to examine the scaffold materials of the dermis, we compared the SNF dermal/epidermal and Collagen dermal/epidermal models. Compared to the SNF dermal/epidermal model, the Collagen dermal/epidermal model had a larger thickness in the immortalized cell models (Figure 2c–e). In terms of cell shape in the epidermis, cells in both models became flattened as they migrated upward, suggesting epidermal keratinization in both models. RT-qPCR showed that the gene expression of hTGM2 and mCol4, the formation factor of the epidermal basal layer [39] and the basement membrane [47], respectively, was significantly upregulated in the SNF dermal/epidermal model in the immortalized cell models (Figure 3). On the other hand, the expression of hTGM2, the formation factor of the epidermal basal layer [39]; hCOL1A1 and hCOL3, present in the entire dermis and upper dermis [48], respectively, and hCOL4, component of basement membrane [47], was significantly upregulated in the SNF dermal/epidermal model in primary cultured cell models (Figure 4). The results that genes expressed in the epidermal basal layer and dermis were significantly upregulated in the SNF dermal/epidermal model compared with the Collagen dermal/epidermal model suggested that while fibroblasts in the Collagen dermal/epidermal model were covered by collagen, fibroblasts in rigid SNF were highly proliferative. hCOL1, hCOL3, and hCOL4 are associated with skin elasticity [20,48,49,50]. Therefore, upregulated expression of hCOL1, hCOL3, and hCOL4 in SNF dermal/epidermal model means that it has high functions as a dermal/epidermal skin model. Fibroblasts secrete soluble factors that diffuse into the epidermal cells of the epithelium and induce the production of basement membrane proteins [51]. Therefore, SNF enhanced the function of fibroblasts and promoted a significant upregulation of basement membrane constitutive factors. These results suggest that the absence of fibroblasts in SNF was not because they were not present, but because the material may have been physically detached during the staining process (Figure 2). In contrast, factors related to keratinization and barrier function were more highly expressed in the Collagen dermal/epidermal model than in the SNF dermal/epidermal model. In a collagen skin model, epidermal growth was enhanced when the collagen matrix was organized by fibroblasts [10]. Therefore, in the SNF dermal/epidermal model, keratinization was observed at the visual level but inferior to the Collagen dermal/epidermal model at the genetic level.
To examine the effect of fibroblasts in the SNF layer, we compared the SNF epidermal and SNF dermal/epidermal models. Morphological observations showed that there was no significant difference in epidermal thickness between the SNF epidermal model and the SNF dermal/epidermal model in the immortalized cell models, suggesting that fibroblasts do not affect epidermal thickness (Figure 2b,d,e). The models made from immortalized cells showed that hTGM1, factor of keratinization [45], hIVL, hFLG, and hLOR, factors of epidermal barrier function [44] were significantly upregulated in the SNF epidermal model compared with those in the SNF dermal/epidermal model (Figure 3). On the other hand, in primary cultured cell models, the gene expression of hTGM1, factor of keratinization [45] and hTGM2, factor of epidermal basal layer forming [39] was upregulated in the SNF dermal/epidermal model compared with the SNF epidermal model. The gene expression of the barrier function [44], hIVL and hFLG was significantly upregulated in the SNF epidermal model in primary cultured cell models. Barrier function was inferior when the model was cultured with fibroblasts in SNF. The expression of cornified envelope-associated genes related to barrier function, such as hIVL, hFLG, and hLOR in HaCaT is different from that in NHEK [52]. From here, the difference in gene expression of these barrier function-related genes is due to cellular differences. Also, for the expression of hTGM2, there were no significant differences between immortalized and primary cultured cells, allowing for alternative gene expression analysis [52]. Therefore, the addition of fibroblasts to the SNF dermal layer takes advantage of SNF’s basement membrane-mimicking structure.
Furthermore, the usefulness of the SNF skin model as a three-dimensional skin model was evaluated by examining the skin corrosivity test using the MTT assay. Except for the Epidermal model, the other models showed skin corrosiveness theoretically, indicating that the MTT test could be performed. So, we demonstrated that skin corrosion tests are applicable on SNF [36].
Finally, we attempted to create a model that incorporated the advantages of both SNF and collagen. SEM results of the combination models showed that the interface between SNF and collagen adheres without repelling (Figure 6c–h). In this study, collagen was immobilized via physical adsorption, which is a common approach to glass surface modification, so the interface between SNF and collagen is firmly adhered due to van der Waals forces [53,54]. The sCS model had collagen modifications in proportion to collagen concentration (Figure 6c,d). In the gCS model, although collagen accumulated in the upper part of the SNF due to the high viscosity of the collagen gel, the collagen gel-modified SNF was successfully formed (Figure 6e–h). Next, we examined the model using hematoxylin-eosin staining (Figure 7). For the SNF dermal/epidermal model and the Collagen dermal/epidermal model, the cells flattened as they approached the surface, indicating that the epidermal layer had become keratinized. In the SNF and collagen combined models, the epidermal cells were flat near the surface in the gCS model, whereas the epidermal cells had the same round shape in most parts of the sCS model. Therefore, it was confirmed that the gCS model was sufficiently more keratinized than the sCS model. This is because collagen gel promotes higher keratinization than collagen solution [55]. Also, in both the sCS and gCS models, a higher collagen concentration resulted in a thicker epidermal model. A high collagen concentration leads to a thicker epidermal layer [46]. Finally, RT-qPCR results were analyzed. First, we compared the combination models with the SNF dermal/epidermal models. The 0.1 sCS model showed upregulated expression of hTGM1, factor of keratinization [45]; hIVL, factor of barrier function [44]; hTGM2, factor of epidermal basal layer forming [39] (Figure 8). When compared to the 1.2 gCS model, there was a significant upregulation in the expression of hIVL, hFLG, and hLOR, which are the factor of barrier function [44], and hZNF750, a factor of cell proliferation [46], compared with the SNF dermal/epidermal model, while mCol4, which is the formation factors of the basement membrane [47], was significantly upregulated in the SNF dermal/epidermal model compared with the 1.2 gCS model (Figure 8). In the 2.4 gCS model, there was a significant upregulation in the expression of hKRT10, and hTGM1, factor of keratinization [44,45]; hTGM2, factor of epidermal basal layer forming [39]; hIVL, hFLG, hLOR, factor of barrier function [44], and hZNF750, factor of cell proliferation [46], compared with the SNF dermal/epidermal model, while mCol4, which is the component of basement membrane [47], was significantly upregulated in the SNF dermal/epidermal model (Figure 8). These results indicate that the combination model, which the collagen was added to SNF, showed a significant increase in expression of factors related to keratinization and barrier function, which were significantly upregulated in the Collagen dermal/epidermal model. Furthermore, hTGM2, which represents increased adhesion, increased ECM cross-linking, and increased epidermal-dermal integration [56], was significantly upregulated in the 0.1 sCS and 2.4 gCS models compared to the SNF model, indicating that the addition of collagen to SNF enhances fibroblast adhesion and maximizes their function. We then compared the combination model with the Collagen dermal/epidermal model. From the results that the collagen in the Collagen dermal/epidermal model is partially detached from the insert wall, while sCS and gCS models attached to the insert wall, we can see that the Collagen dermal/epidermal models are contracted and cannot be attached to the insert wall, while sCS and gCS models complements collagen contraction. The 0.01 sCS model showed upregulated gene expression of mCol4, which is the component of basement membrane [47] compared with the Collagen dermal/epidermal model, while the expression of hKRT10, and hTGM1, a factor of keratinization [44,45]; hIVL, hFLG, hLOR, a factor of barrier function [44], and hZNF750, a factor of cell proliferation [46], was significantly upregulated in the Collagen dermal/epidermal model compared with the 0.01 sCS model (Figure 8). The 0.1 sCS model had upregulated gene expression of hTGM2, factor of epidermal basal layer forming [39], and mCol4, factor of dermal basement membrane forming [47], compared with the Collagen dermal/epidermal model, while the expression of hKRT10, a factor of keratinization [44]; hIVL, hFLG, hLOR, a factor of barrier function [44]; hZNF750, a factor of cell proliferation [46], and mCol3, a factor of upper dermis forming [48], was significantly upregulated in the Collagen dermal/epidermal model compared with the 0.1 sCS model (Figure 8). When compared to the 1.2 gCS model, the gene expression of hKRT10, a factor of keratinization [44]; hIVL, hFLG, hLOR, a factor of barrier function [44], and hZNF750, a factor of cell proliferation [46], was significantly upregulated in the Collagen dermal/epidermal model (Figure 8). In the 2.4 gCS model, there was a significant upregulation in the expression of hTGM1, a factor of keratinization [45], and hTGM2, factor of epidermal basal layer forming [39], compared with the Collagen dermal/epidermal model, while hKRT10, a factor of keratinization [44], was significantly upregulated in the Collagen dermal/epidermal model (Figure 8). From these results, gene factors related to keratinization and barrier function, which were inferior in the SNF dermal/epidermal model to the Collagen dermal/epidermal model, were upregulated in the combined model, while gene factors related to the epidermal basal layer and dermal basement membrane formation that were inferior in the Collagen dermal/epidermal model to the SNF model were complemented in the combined model. These results suggest that the combination model takes advantage of both SNF and collagen. Moreover, the gCS model is an excellent skin model that can compensate for the shrinkage that was originally a problem with the collagen model by adding SNF, and functionally forms a basement membrane-mimicking structure, which has stable properties.

5. Conclusions

The SNF dermal/epidermal model has enhanced functions in the basement membrane, whereas the Collagen dermal/epidermal model has advantages in keratinization and barrier functions. The SNF model with mechanical strength formed a basement membrane-mimicking structure, suggesting the construction of a stable skin model. Moreover, creating SNF and collagen combined models made stable skin models that take advantage of both models. Especially, gCS model, which the collagen gel was poured into the SNF, not only compensates for collagen contraction with SNF, but is also a more functional model and is expected to be applied as a stable skin-mimetic model in the future. We expect that this skin model will be applied as a safety assessment and pharmaceutical tool used as alternatives to animal experiments in the future.

Supplementary Materials

The following supporting information can be downloaded at: https://www.mdpi.com/article/10.3390/app12136537/s1, Table S1: Primer sequences [33,57,58,59,60,61,62,63,64,65,66,67,68,69]; Figure S1: Main expression sites of genes in dermis and epidermis; Figure S2: Macroscopic and optical microscopic images of Collagen dermal/epidermal model.

Author Contributions

Conceptualization, M.I. and K.I.; methodology, M.I.; validation, M.I.; writing—original draft preparation, M.I.; writing—review and editing, K.I.; project administration, K.I.; funding acquisition, K.I. All authors have read and agreed to the published version of the manuscript.

Funding

This research was funded by the Kose Cosmetology Research Promotion Foundation and the Hoyu Science Foundation.

Institutional Review Board Statement

Not applicable.

Informed Consent Statement

Not applicable.

Data Availability Statement

Not applicable.

Conflicts of Interest

The authors declare no conflict of interest.

References

  1. Lu, P.; Weaver, V.M.; Werb, Z. The extracellular matrix: A dynamic niche in cancer progression. J. Cell Biol. 2012, 196, 395–406. [Google Scholar] [CrossRef] [PubMed]
  2. Gattazzo, F.; Urciuolo, A.; Bonaldo, P. Extracellular matrix: A dynamic microenvironment for stem cell niche. Biochim. Biophys. Acta 2014, 1840, 2506–2519. [Google Scholar] [CrossRef]
  3. Smalley, K.S.M.; Lionic, M.; Herlyn, M. Life ins’t flat: Taking cancer biology to the next dimension. In Vitro Cell. Dev. Biol. Anim. 2006, 42, 242–247. [Google Scholar] [CrossRef]
  4. Mazzolen, G.; Lorenzo, D.D.; Steimberg, N. Modelling tissues in 3D: The next future of pharmaco-toxicology and food research? Genes Nutr. 2009, 4, 13–22. [Google Scholar] [CrossRef] [Green Version]
  5. Chattopadhyay, S.; Raines, R.T. Collagen-Based Biomaterials for Wound Healing. Biopolymers 2014, 101, 821–833. [Google Scholar] [CrossRef] [Green Version]
  6. Koutsopoulos, S. Self-assembling peptide nanofiber hydrogels in tissue engineering and regenerative medicine: Progress, design guidelines, and applications. J. Biomed. Mater. Res. A 2016, 104, 1002–1016. [Google Scholar] [CrossRef]
  7. Cheung, H.; Lau, K.; Lu, T.; Hui, D. A critical review on polymer-based bio-engineered materials for scaffold development. Compos. Part B 2007, 38, 291–300. [Google Scholar] [CrossRef]
  8. Braghirolli, D.I.; Steffens, D.; Pranke, P. Electrospinning for regenerative medicine: A review of the main topics. Drug Discov. Today 2014, 19, 743–753. [Google Scholar] [CrossRef] [PubMed]
  9. Urciuolo, F.; Casale, C.; Imparato, G.; Netti, P.A. Bioengineered Skin Substitutes: The Role of Extracellular Matrix and Vascularization in the Healing of Deep Wounds. J. Clin. Med. 2019, 8, 2083. [Google Scholar] [CrossRef] [Green Version]
  10. Coulomb, B.; Lebreton, C.; Dubertret, L. Influence of Human Dermal Fibroblasts on Epidermalization. J. Investig. Dermatol. 1989, 92, 122–125. [Google Scholar] [CrossRef] [PubMed] [Green Version]
  11. Ogura, Y.; Muta, K.; Matsunaga, Y.; Hirao, T.; Amano, S. In Vitro Reconstruction of 3-D Elastic Fiber in a Novel Dermal Equivalent. J. Soc. Cosmet. Chem. Jpn. 2010, 44, 278–284. [Google Scholar] [CrossRef]
  12. Ponec, M. Skin constructs for replacement of skin tissues for in vitro testing. Adv. Drug Deliv. Rev. 2002, 54, 19–30. [Google Scholar] [CrossRef]
  13. Heisenberg, C.P.; Bellaiche, Y. Forces in tissue morphogenesis and patterning. Cell 2013, 153, 948–962. [Google Scholar] [CrossRef] [Green Version]
  14. Paszek, M.J.; Zahir, N.; Johnson, K.R.; Lak ins, J.N.; Rozenberg, G.I.; Gefen, A.; Reinhart-King, C.A.; Margulies, S.S.; Dembo, M.; Boettiger, D.; et al. Tensional Homeostasis and the Malignant Phenotype. Cancer Cell 2005, 8, 241–254. [Google Scholar] [CrossRef] [PubMed] [Green Version]
  15. Discher, D.E.; Janmey, P.; Wang, Y.L. Tissue cells feel and respond to the stiffness of their substrate. Science 2005, 310, 1139–1143. [Google Scholar] [CrossRef] [Green Version]
  16. Anlas, A.A.; Nelson, C.M. Tissue mechanics regulates form, function, and dysfunction. Curr. Opin. Cell Biol. 2018, 54, 98–105. [Google Scholar] [CrossRef]
  17. Li, M.; Mondrinos, M.J.; Gandhi, M.R.; Ko, F.K.; Weiss, A.S.; Lelkes, P.I. Electrospun protein fibers as matrices for tissue engineering. Biomaterials 2005, 26, 5999–6008. [Google Scholar] [CrossRef]
  18. Powell, H.M.; Boyce, S.T. Engineered human skin fabricated using electrospun collagen-PCL blends: Morphogenesis and mechanical properties. Tissue Eng. Part A 2009, 15, 2177–2187. [Google Scholar] [CrossRef] [PubMed]
  19. Kwak, B.S.; Choi, W.; Jeon, J.; Wona, J.; Sung, G.Y.; Kim, B.; Sung, J.H. In vitro 3D skin model using gelatin methacrylate hydrogel. J. Ind. Eng. Chem. Res. 2018, 66, 254–261. [Google Scholar] [CrossRef]
  20. Kimura, S.; Tsuchiya, A.; Ogawa, M.; Ono, M.; Suda, N.; Sekimoto, K.; Takeo, M.; Tsuji, T. Tissue-scale tensional homeostasis in skin regulates structure and physiological function. Commun. Biol. 2020, 3, 637. [Google Scholar] [CrossRef]
  21. Kawakami, K.; Yoshida, S. Thermal Stabilization of Lipase by Sol-Gel Entrapment in Organically Modified Silicate Formed on Kiselguhr. J. Ferment. Bioeng. 1996, 82, 239–245. [Google Scholar] [CrossRef]
  22. Yamaguchi, T.; Sakai, S.; Kawakami, K. Application of silicate electrospun nanofibers for cell culture. J. Sol-Gel Sci. Technol. 2008, 48, 350–355. [Google Scholar] [CrossRef]
  23. Yamaguchi, T.; Sakai, S.; Watanabe, R.; Tarao, T.; Kawakami, K. Heat Treatment of Electrospun Silicate Fiber Substrates Enhances Cellular Adhesion and Proliferation. J. Biosci. Bioengin. 2010, 109, 304–306. [Google Scholar] [CrossRef] [PubMed]
  24. Ahola, M.S.; Säilynoja, E.S.; Raitavuo, M.H.; Vaahtio, M.M.; Salonen, J.I.; Yli-Urpo, A.U. In vitro release of heparin from silica xerogels. Biomaterials 2001, 22, 2163–2170. [Google Scholar] [CrossRef]
  25. Xue, M.; Yang, S.; Chen, Y.; Yang, L.; Zhao, F.; Ding, B.; Yu, J. Silica nanofibrous membranes with robust flexibility and thermal stability for high-efficiency fine particulate filtration. RSC Adv. 2012, 2, 12216–12223. [Google Scholar] [CrossRef]
  26. Otsuka, H.; Sasaki, K.; Okimura, S.; Nagamura, M.; Watanabe, R.; Kawabe, M. Contribution of fibroblasts cultured on 3D silica nonwoven fabrics to cocultured hepatocytes function. Chem. Lett. 2014, 43, 343–345. [Google Scholar] [CrossRef]
  27. Oh, S.H.; Park, K.; Kim, J.M.; Lee, J.H. In vitro and in vivo characteristics of PCL scaffolds with pore size gradient fabricated by a centrifugation method. Biomaterials 2007, 28, 1664–1671. [Google Scholar] [CrossRef]
  28. Rubenstein, D.; Han, D.; Goldgraben, S.; Elgendi, H.; Gouma, P.I.; Frame, M.D. Bioassay Chamber for Angiogenesis with Perfused Explanted Arteries and Electrospun Scaffolding. Microcirculation 2007, 14, 723–737. [Google Scholar] [CrossRef]
  29. Ikari, R.; Mukaisho, K.; Kageyama, S.; Nagasawa, M.; Kubota, S.; Nakayama, T.; Murakami, S.; Taniura, N.; Tanaka, H.; Kushima, R.P.; et al. Differences in the Central Energy Metabolism of Cancer Cells between Conventional 2D and Novel 3D Culture Systems. Int. J. Mol. Sci. 2021, 22, 1805. [Google Scholar] [CrossRef]
  30. Ishikawa, S.; Iijima, K.; Sasaki, K.; Kawabe, M.; Osawa, S.; Otsuka, H. Silica-Based Nonwoven Fiber Fabricated by Electrospinning to Promote Fibroblast Functions. Bull. Chem. Soc. Jpn. 2020, 93, 477–481. [Google Scholar] [CrossRef]
  31. Ishikawa, S.; Iijima, K.; Sasaki, K.; Kawabe, M.; Otsuka, H. Improvement of Hepatic Functions by Spheroids Coculture with Fibroblasts in 3D Silica Nonwoven Fabrics. J. Nanosci. Nanotechnol. 2018, 18, 1–8. [Google Scholar] [CrossRef] [PubMed]
  32. Iijima, K.; Ishikawa, S.; Sasaki, K.; Hashizume, M.; Kawabe, M.; Otsuka, H. Osteogenic Differentiation of Bone Marrow-Derived Mesenchymal Stem Cells in Electrospun Silica Nonwoven Fabrics. ACS Omega 2018, 3, 10180–10187. [Google Scholar] [CrossRef] [PubMed]
  33. Ishikawa, S.; Iijima, K.; Sasaki, K.; Hashizume, M.; Kawabe, M.; Otsuka, H. Cartilage Differentiation of Bone Marrow-Derived Mesenchymal Stem Cells in Three-Dimensional Silica Nonwoven Fabrics. Appl. Sci. 2018, 8, 1398. [Google Scholar] [CrossRef] [Green Version]
  34. Schoop, V.M.; Mirancea, N.; Fusenig, N.E. Epidermal organization and differentiation of HaCaT keratinocytes in organotypic coculture with human dermal fibroblasts. J. Investig. Dermatol. 1999, 112, 343–353. [Google Scholar] [CrossRef]
  35. Liu, N.; Matsumura, H.; Kato, T.; Ichinose, S.; Takada, A.; Namiki, T.; Asakawa, K.; Morinaga, H.; Mohri, Y.; Arcangelis, A.D.; et al. Stem cell competition orchestrates skin homeostasis and ageing. Nature 2019, 568, 344–350. [Google Scholar] [CrossRef]
  36. OECD. Test No. 431: In Vitro Skin Corrosion (Human Skin Model Test); OECD: Paris, France, 2014. [Google Scholar]
  37. Strudwick, X.L.; Lang, D.L.; Smith, L.E.; Cowin, A.J. Combination of Low Calcium with Y-27632 Rock Inhibitor Increases the Proliferative Capacity, Expansion Potential and Lifespan of Primary Human Keratinocytes while Retaining Their Capacity to Differentiate into Stratified Epidermis in a 3D Skin Model. PLoS ONE 2014, 10, e0123651. [Google Scholar] [CrossRef] [Green Version]
  38. Song, S.; Raja, I.; Lee, Y.; Kang, M.; Seo, H.; Lee, H.; Han, D. Comparison of cytotoxicity of black phosphorus nanosheets in different types of fibroblasts. Biomater. Res. 2019, 23, 1–7. [Google Scholar] [CrossRef]
  39. Chermnykh, E.S.; Alpeeva, E.V.; Vorotelyak, E.A. Transglutaminase 3: The Involvement in Epithelial Differentiation and Cancer. Cells 2020, 9, 1996. [Google Scholar] [CrossRef]
  40. Choi, E.; Kang, Y.G.; Hwang, S.H.; Kim, J.K.; Hong, Y.D.; Park, W.S.; Kim, D.; Kim, E.; Cho, J.Y. In Vitro Effects of Dehydrotrametenolic Acid on Skin Barrier Function. Molecules 2019, 24, 4583. [Google Scholar] [CrossRef] [Green Version]
  41. Scholz, G.M.; Sulaiman, N.S.; Baiiaty, S.A.; Kwa, M.Q.; Reynolds, E.C. A novel regulatory relationship between RIPK4 and ELF3 in keratinocytes. Cell. Signal. 2016, 28, 1916–1922. [Google Scholar] [CrossRef]
  42. Telci, D.; Griffin, M. Tissue transglutaminase (TG2)—A wound response enzyme. Front. Biosci. 2006, 11, 867–882. [Google Scholar] [CrossRef] [PubMed] [Green Version]
  43. Aeschlimann, D.; Paulsson, M. Cross-linking of laminin-nidogen complexes by tissue transglutaminase. A novel mechanism for basement membrane stabilization. J. Biol. Chem. 1991, 266, 15308–15317. [Google Scholar] [CrossRef]
  44. Klicksa, J.; Molitora, E.; Ertongur-Fauthb, T.; Rudolf, R. In vitro skin three-dimensional models and their applications. J. Cell. Biotechnol. 2017, 3, 21–39. [Google Scholar] [CrossRef] [Green Version]
  45. Eckert, R.L.; Sturniolo, M.T.; Broome, A.; Ruse, M.; Rorke, E.A. Transglutaminase function in epidermis. J. Investig. Dermatol. 2005, 124, 481–492. [Google Scholar] [CrossRef] [PubMed] [Green Version]
  46. Cohen, I.; Birnbaum, R.Y.; Leibson, K.; Taube, R.; Sivan, S.; Birk, O.S. ZNF750 Is Expressed in Differentiated Keratinocytes and Regulates Epidermal Late Differentiation Genes. PLoS ONE 2012, 7, e42628. [Google Scholar] [CrossRef] [PubMed] [Green Version]
  47. Pöschl, E.; Schlötzer-Schrehardt, U.; Brachvogel, B.; Saito, K.; Ninomiya, Y.; Mayer, U. Collagen IV is essential for basement membrane stability but dispensable for initiation of its assembly during early development. Development 2004, 131, 1619–1628. [Google Scholar] [CrossRef] [Green Version]
  48. Ohto-Fujita, E.; Shimizu, M.; Sano, S.; Kurimoto, M.; Yamazawa, K.; Atomi, T.; Sakurai, T.; Murakami, Y.; Takami, T.; Murakami, T.; et al. Solubilized eggshell membrane supplies a type III collagen-rich elastic dermal papilla. Cell Tissue Res. 2019, 376, 123–135. [Google Scholar] [CrossRef]
  49. Potekaev, N.N.; Borzykh, O.B.; Medvedev, G.V.; Petrova, M.M.; Gavrilyuk, O.A.; Karpova, E.I.; Trefilova, V.V.; Demina, O.M.; Popova, T.E.; Shnayder, N.A. Genetic and Epigenetic Aspects of Skin Collagen Fiber Turnover and Functioning. Cosmetics 2021, 8, 92. [Google Scholar] [CrossRef]
  50. Varkey, M.; Ding, J.; Tredget, E.E. Superficial dermal fibroblasts enhance basement membrane and epidermal barrier formation in tissue-engineered skin: Implications for treatment of skin basement membrane disorders. Tissue Eng. Part A 2014, 20, 540–552. [Google Scholar] [CrossRef] [Green Version]
  51. el-Ghalbzouri, A.; Gibbs, S.; Lamme, E.; Van Blitterswijk, C.A.; Ponec, M. Effect of fibroblasts on epidermal regeneration. Br. J. Dermatol. 2002, 147, 230–243. [Google Scholar] [CrossRef]
  52. Seo, M.; Kang, T.; Lee, C.; Lee, A.; Noh, M. HaCaT Keratinocytes and Primary Epidermal Keratinocytes Have Different Transcriptional Profiles of Cornified Envelope-Associated Genes to T Helper Cell Cytokines. Biomol. Ther. 2012, 20, 171–176. [Google Scholar] [CrossRef] [PubMed] [Green Version]
  53. Straley, K.S.; Heilshorn, S.C. Design and adsorption of modular engineered proteins to prepare customized, neuron-compatible coatings. Front. Neuroeng. 2009, 2, 1–10. [Google Scholar] [CrossRef] [PubMed] [Green Version]
  54. Spargo, B.J.; Testoff, M.A.; Nielsen, T.B.; Stenger, D.A.; Hickman, J.J.; Rudolph, A.S. Spatially controlled adhesion, spreading, and differentiation of endothelial cells on self-assembled molecular monolayers. Proc. Natd. Acad. Sci. USA 1994, 91, 11070–11074. [Google Scholar] [CrossRef] [Green Version]
  55. Fujisaki, H.; Futaki, S.; Yamada, M.; Sekiguchi, K.; Hayashi, T.; Ikejima, T.; Hattori, S. Respective optimal calcium concentrations for proliferation on type I collagen fibrils in two keratinocyte line cells, HaCaT and FEPE1L-8. Regen. Ther. 2018, 8, 73–79. [Google Scholar] [CrossRef] [PubMed]
  56. Küttner, V.; Mack, C.; Gretzmeier, C.; Bruckner-Tuderman, L.; Dengjel, J. Loss of collagen VII is associated with reduced transglutaminase 2 abundance and activity. J. Investig. Dermatol. 2014, 134, 2381–2389. [Google Scholar] [CrossRef] [Green Version]
  57. Regl, G.; Kasper, M.; Schnidar, H.; Eichberger, T.; Neill, G.; Ikram, M.; Quinn, A.; Philpott, M.; Frischauf, A.; Aberger, F. The zinc-finger transcription factor GLI2 antagonizes contact inhibition and differentiation of human epidermal cells. Oncogene 2004, 23, 1263–1274. [Google Scholar] [CrossRef] [Green Version]
  58. Bause, A.; Matsui, M.; Haigis, M. The Protein Deacetylase SIRT3 Prevents Oxidative Stress-induced Keratinocyte Differentiation. J. Biol. Chem. 2013, 288, 36484–36491. [Google Scholar] [CrossRef] [Green Version]
  59. Fontana, R.; Raccosta, L.; Rovati, L.; Steffensen, K.R.; Paniccia, A.; Jakobsson, T.; Melloni, G.; Bandiera, A.; Mangili, G.; Bergamini, A.; et al. Nuclear receptor ligands induce TREM-1 expression on dendritic cells: Analysis of their role in tumors. Oncoimmunology 2019, 8, 1554967. [Google Scholar] [CrossRef] [Green Version]
  60. Cai, P.; Otten, A.B.C.; Cheng, B.; Ishii, M.A.; Zhang, W.; Huang, B.; Qu, K.; Sun, B.K. A genome-wide long noncoding RNA CRISPRi screen identifies PRANCR as a novel regulator of epidermal homeostasis. Genome Res. 2020, 30, 22–34. [Google Scholar] [CrossRef]
  61. Wang, W.; Yu, X.; Wu, C.; Jin, H. IL-36γ inhibits differentiation and induces inflammation of keratinocyte via Wnt signaling pathway in psoriasis. Int. J. Med. Sci. 2017, 14, 1002–1007. [Google Scholar] [CrossRef] [Green Version]
  62. Park, C.; Min, S.; Yu, H.; Kim, K.; Kim, S.; Lee, H.; Kim, J.; Park, Y. Effects of Apigenin on RBL-2H3, RAW264.7, and HaCaT Cells: Anti-Allergic, Anti-Inflammatory, and Skin-Protective Activities. Int. J. Mol. Sci. 2020, 21, 4620. [Google Scholar] [CrossRef] [PubMed]
  63. Nambara, S.; Masuda, T.; Tobo, T.; Kidogami, S.; Komatsu, H.; Sugimachi, K.; Saeki, H.; Oki, E.; Maehara, Y. Clinical significance of ZNF750 gene expression, a novel tumor suppressor gene, in esophageal squamous cell carcinoma. Oncology 2017, 14, 1795–1801. [Google Scholar] [CrossRef] [PubMed] [Green Version]
  64. Tang, J.; Jiang, X.; Zhou, Y.; Dai, Y. Effects of A2BR on the biological behavior of mouse renal fibroblasts during hypoxia. Mol. Med. Rep. 2015, 11, 4397–4402. [Google Scholar] [CrossRef] [PubMed] [Green Version]
  65. Pickard, A.; Adamson, A.; Lu, Y.; Chang, J.; Garva, R.; Hodson, N.; Kadler, K.E. Collagen assembly and turnover imaged with a CRISPR-Cas9 engineered Dendra2 tag. bioRxiv 2018, 331496. [Google Scholar] [CrossRef] [Green Version]
  66. Zhou, Z.; Xu, M.; Cai, Y.; Wang, W.; Jiang, J.X.; Varga, Z.V.; Feng, D.; Pacher, P.; Kunos, G.; Torok, N.J.; et al. Neutrophil–Hepatic Stellate Cell Interactions Promote Fibrosis in Experimental Steatohepatitis. Cell. Mol. Gastroenterol. Hepatol. 2018, 5, 399–413. [Google Scholar] [CrossRef] [Green Version]
  67. Rachmawati, H.; Novel, M.; Nisa, R.M.; Berlian, G.; Tandrasasmita, O.M.; Rahma, A.; Riani, C.; Tjandrawinata, R.R. Co-delivery of curcumin-loaded nanoemulsion and Phaleria macrocarpa extract to NIH 3T3 cell for antifibrosis. J. Drug. Deliv. Sci. Technol. 2017, 39, 123–130. [Google Scholar] [CrossRef]
  68. François, A.; Chatelus, E.; Wachsmann, D.; Sibilia, J.; Bahram, S.; Alsaleh, G.; Gottenberg, J. B lymphocytes and B-cell activating factor promote collagen and profibrotic markers expression by dermal fibroblasts in systemic sclerosis. Arthritis Res. Ther. 2013, 15, R168. [Google Scholar] [CrossRef] [Green Version]
  69. Wanga, T.; Sunb, J.; Huanga, Y.; Wua, H.; Chend, L.; Lin, F. Skin basement membrane and extracellular matrix proteins characterization and quantification by real time RT-PCR. Biomaterials 2006, 27, 5059–5068. [Google Scholar] [CrossRef]
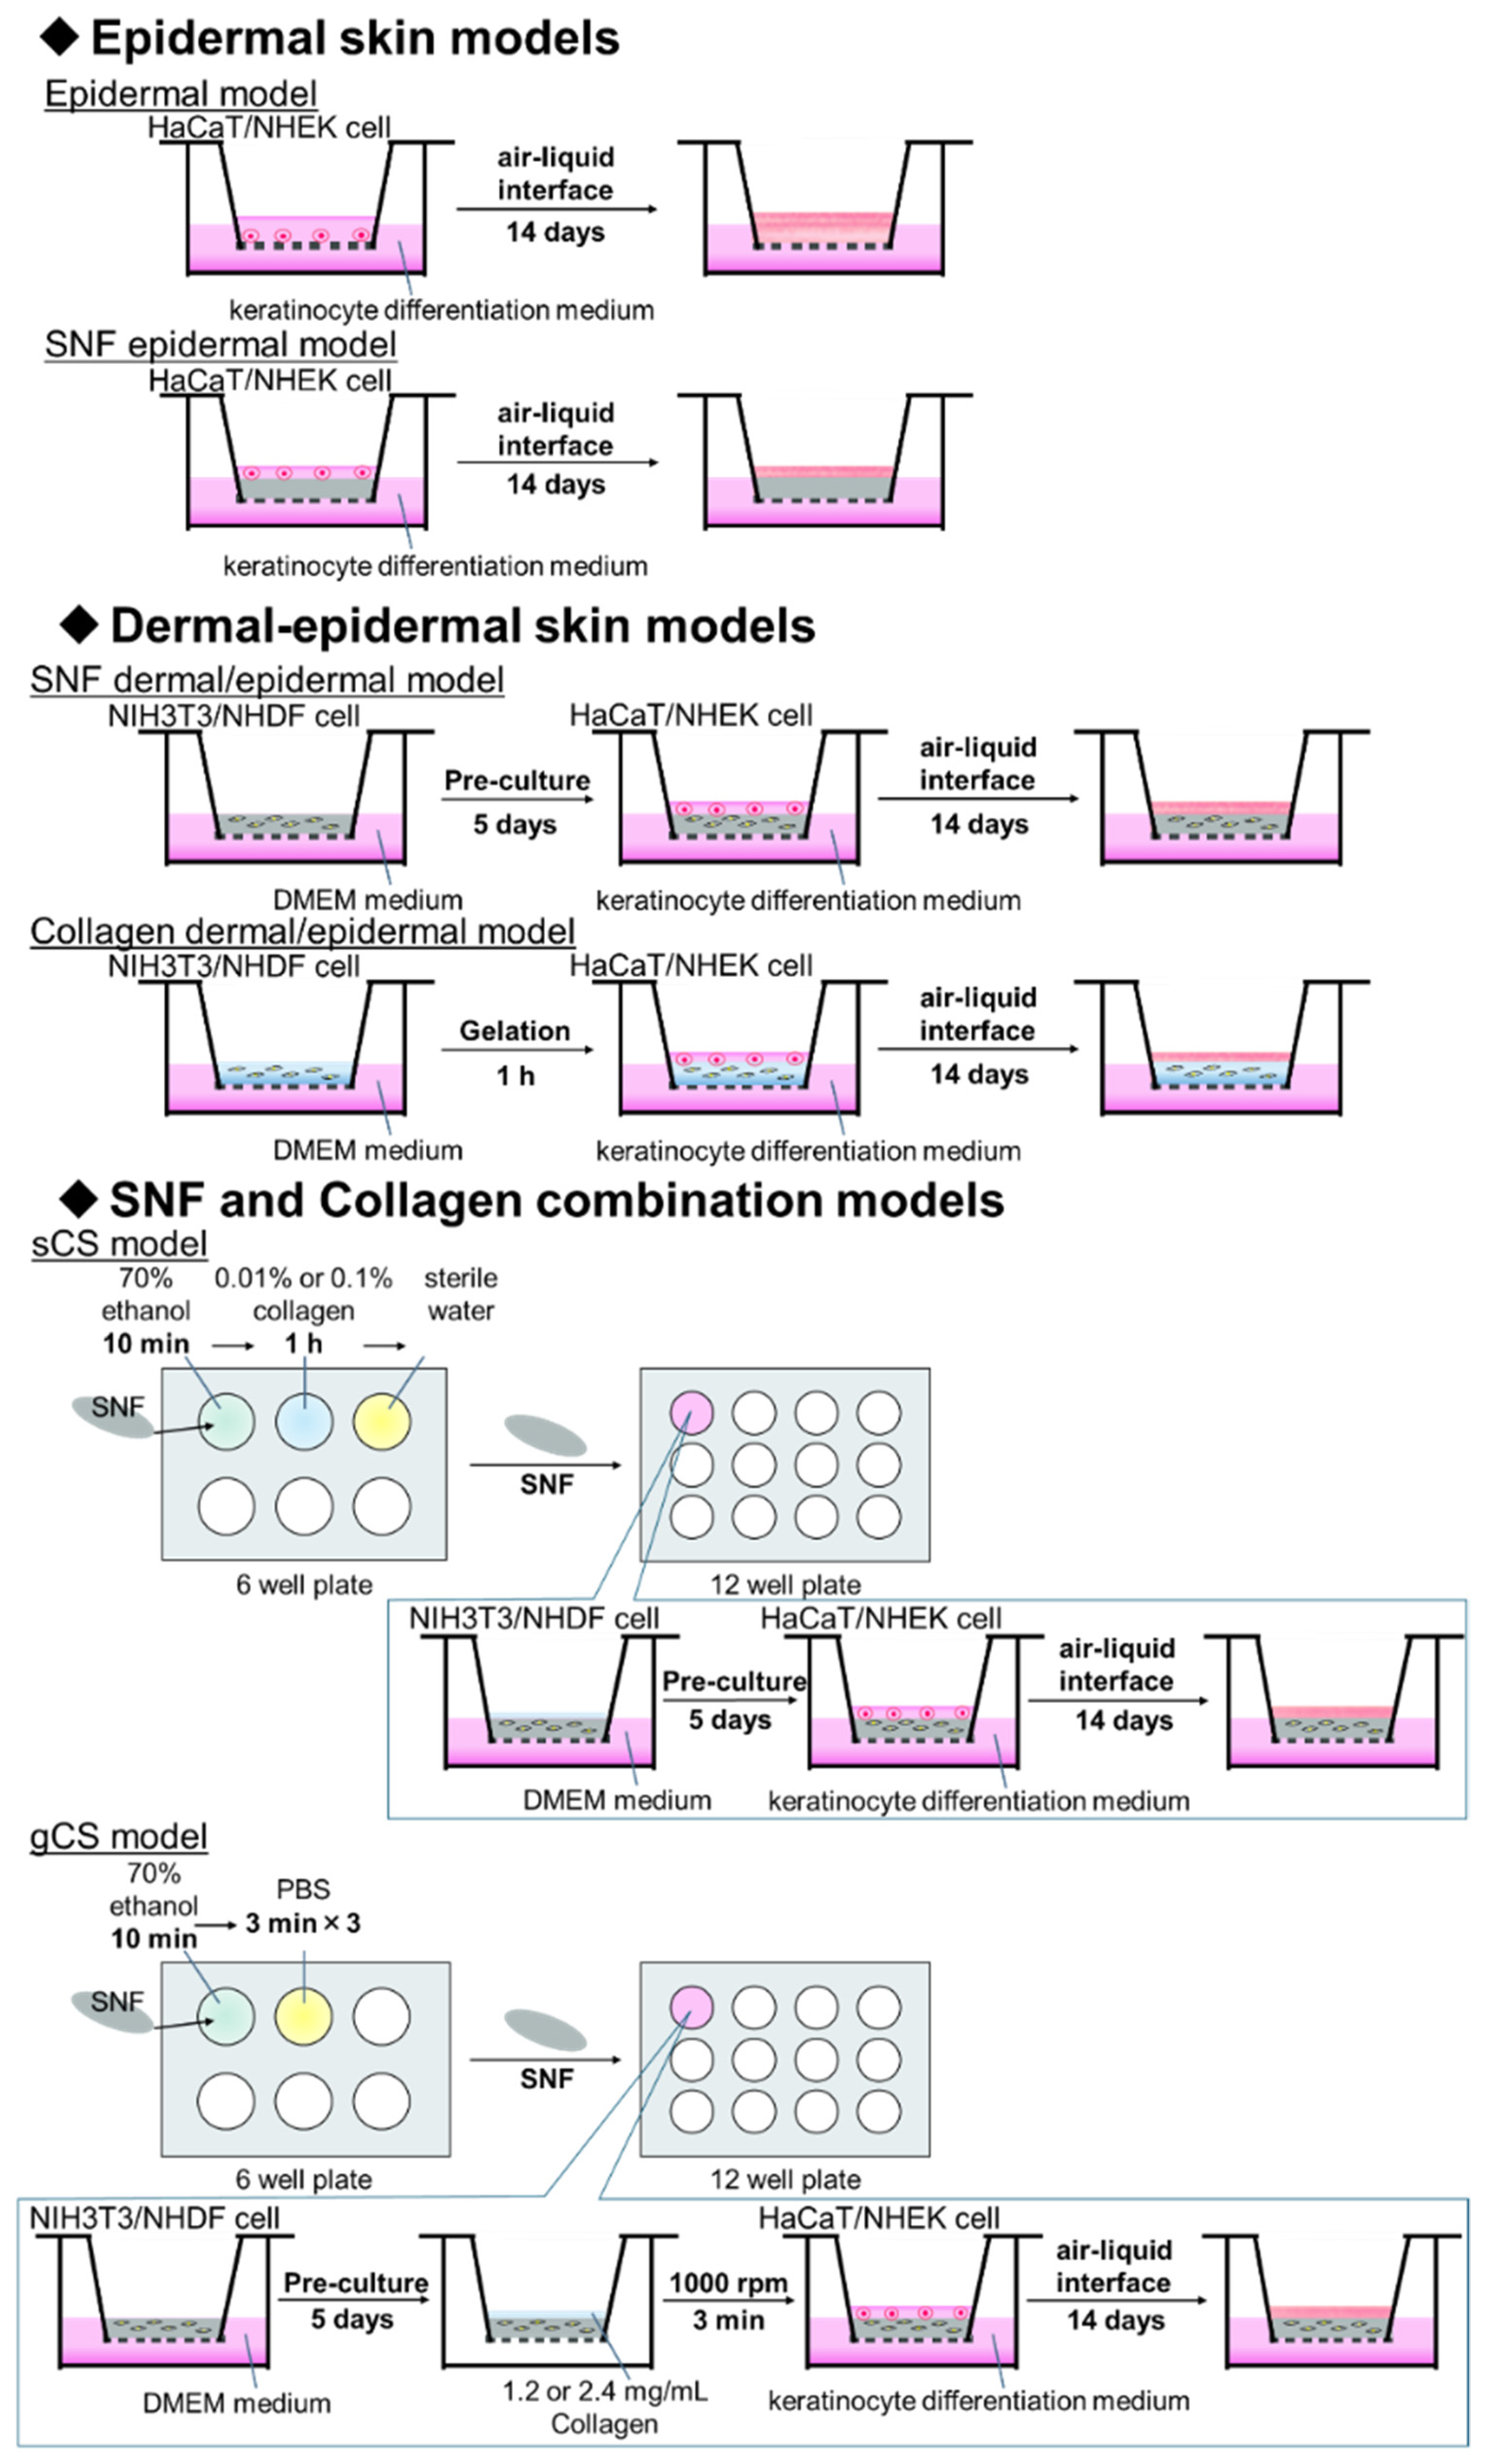
Figure 1. Methods of making the three-dimensional skin models.
Applsci 12 06537 g001
Figure 2. (ad) Morphological observation of a skin models using immortalized cells. (a) Representative hematoxylin and eosin images of the Epidermal model, (b) SNF epidermal model, (c) Collagen dermal/epidermal model, and (d) SNF dermal/epidermal model. (e) Thickness of epidermal layer of each skin model constructed with immortalized human and mouse cells (n = 10, † p < 0.05, †† p < 0.01). Data is represented as the mean ± standard error of the mean (sem); five picture t-test. Scale bar 50 µm.
Applsci 12 06537 g002
Figure 3. (ag) The relative expression of human epidermis and (hj) mouse dermis marker genes in cells cultured in PS plates (HaCaT and NIH3T3) and skin models constructed with immortalized human and mouse cells (Epidermal model, SNF epidermal model, Collagen dermal/epidermal model, SNF dermal/epidermal model). (a) hKRT10, (b) hTGM1, (c) hTGM2, (d) hIVL, (e) hFLG, (f) hLOR, (g) hZNF750, (h) mCol1a1, (i) mCol3, and (j) mCol4. (n = 3, * p < 0.05, ** p < 0.01, *** p < 0.001, vs. pre-cultured HaCaT or NIH3T3. †† p < 0.01, ††† p < 0.001). Data are represented as the means ± sem.
Applsci 12 06537 g003
Figure 4. (ag) The relative expression of human epidermis and (hj) mouse dermis marker genes in cells cultured in PS plates (NHEK and NHDF) and skin models constructed with primary human cells (Epidermal model, SNF epidermal model, Collagen dermal/epidermal model, SNF dermal/epidermal model). (a) hKRT10, (b) hTGM1, (c) hTGM2, (d) hIVL, (e) hFLG, (f) hLOR, (g) hZNF750, (h) hCOL1A1, (i) hCOL3, and (j) hCOL4. n = 3, ** p < 0.01, *** p < 0.001, vs. pre-cultured NHEK or NHDF; †† p < 0.01, ††† p < 0.001. Data are represented as the mean ± sem.
Applsci 12 06537 g004
Figure 5. Results of MTT assay of the skin models using primary cells. Viability of cells in skin models after exposure to corrosive and noncorrosive substances, according to 431 OECD [35]. Dashed lines indicate 15% and 50% viability thresholds (n = 2).
Applsci 12 06537 g005
Figure 6. (ah) Scanning electron microscope (SEM) images of skin models. (a) SNF dermal/epidermal model, (b) Collagen dermal/epidermal model, (c) 0.01 sCS model, (d) 0.1 sCS model, (e) 1.2 gCS model top layer, (f) 1.2 gCS model medium layer, (g) 2.4 gCS model top layer, and (h) 2.4 gCS model medium layer. Scale bar 50 µm.
Applsci 12 06537 g006
Figure 7. (af) Morphological observation of skin models combining SNF and collagen. (a) Representative hematoxylin and eosin images of the SNF dermal/epidermal models, (b) Collagen dermal/epidermal model, (c) 0.01 sCS model, (d) 0.1 sCS model, (e) 1.2 gCS model, and (f) 2.4 gCS model. (g) Thickness of epidermal layer of each skin model constructed with immortalized human and mouse cells (n = 10, †† p < 0.01, ††† p < 0.001). Means ± sem; five picture t-test. Scale bar 50 µm.
Applsci 12 06537 g007
Figure 8. (ag) The relative expression of human epidermis and (hj) mouse dermis marker genes in cells cultured in PS plates (HaCaT and NIH3T3) and skin models constructed with immortalized human and mouse cells (Epidermal model, SNF epidermal model, Collagen dermal/epidermal model, SNF dermal/epidermal model). (a) hKRT10, (b) hTGM1, (c) hTGM2, (d) hIVL, (e) hFLG, (f) hLOR, (g) hZNF750, (h) mCol1a1, (i) mCol3, and (j) mCol4. (n = 3, * p < 0.05, ** p < 0.01, *** p < 0.001, vs. pre-cultured HaCaT or NIH3T3. † p < 0.05, †† p < 0.01, ††† p < 0.001). Data are represented as the mean ± sem.
Applsci 12 06537 g008
Publisher’s Note: MDPI stays neutral with regard to jurisdictional claims in published maps and institutional affiliations.