Article

Detection and Classification of Artificial Defects on Stainless Steel Plate for a Liquefied Hydrogen Storage Vessel Using Short-Time Fourier Transform of Ultrasonic Guided Waves and Linear Discriminant Analysis

1
Smart NDE Team, Safety Measurement Institute, Korea Research Institute of Science and Science, 267 Gajeong-ro, Yuseong-gu, Daejeon 34113, Korea
2
Smart Control & Sensing Co., Ltd., Unit 106, Bldg. A, Migun Techno World Phase II, 187, Techno 2-ro, Yuseong-gu, Daejeon 34025, Korea
3
Acoulab Co., Ltd., 8, Sudo-ro 55 beon-gil, Bucheon-si 14516, Gyeonggi-do, Korea
4
Korea National Cleaner Production Center, Korea Institute of Industrial Technology, 322, Teheran-ro, Gangnam-gu, Seoul 06211, Korea
5
Department of Bio-Industrial Machinery Engineering, College of Agriculture and Life Science, Gyeongsang National University, 501, Jinju-daero, Jinju-si 52828, Gyeongsangnam-do, Korea
6
Institute of Smart Farm, Gyeongsang National University, 501, Jinju-daero, Jinju-si 52828, Gyeongsangnam-do, Korea
7
Department of Science of Measurement, University of Science and Technology, 217, Gajeong-ro, Yuseong-gu, Daejeon 34113, Korea
*
Authors to whom correspondence should be addressed.
These authors contributed equally to this work.
Appl. Sci. 2022, 12(13), 6502; https://doi.org/10.3390/app12136502
Submission received: 2 June 2022 / Revised: 21 June 2022 / Accepted: 24 June 2022 / Published: 27 June 2022
(This article belongs to the Special Issue Recent Advances of Ultrasonic Testing in Materials)

Abstract

:
Liquefied hydrogen storage vessels (LHSVs) are vulnerable to surface-crack initiation, propagation, and fracture on their surfaces because they are under high-pressure, low-temperature conditions. Defects can also occur in the coatings of the storage containers used to prevent hydrogen permeation, and these lead to surface defects such as pitting corrosions. Together, these increase the probability of liquid hydrogen leaks and can cause serious accidents. Therefore, it is important to detect surface defects during periodic surface inspections of LHSVs. Among the candidate non-destructive evaluation (NDE) techniques, testing using guided waves (GWs) is effective for detecting surface defects. Because of the ability of GWs to travel long distances without significant acoustic attenuation, GW testing has attracted much attention as a promising structural monitoring technique for LHSVs. In this study, an ultrasonic NDE method was designed for detecting surface defects of 304SS plate, which is the main material used for fabricating LHSVs. It involves the use of linear discriminant analysis (LDA) based on short-time Fourier transform (STFT) pixel information produced from GW data. To accomplish this, the differences in the number of STFT pixels between sound and defective specimens were used as a major factor in distinguishing the two groups. Consequently, surface defects could be detected and classified with 97% accuracy by the newly developed pixel-based mapping method. This indicates that the newly developed NDE method with LDA can be used to detect defects and classify LHSVs as either sound or defective.

1. Introduction

Recently, due to environmental problems such as air pollution and global warming caused by the abuse of fossil energy sources [1], interest in green and eco-friendly energy has been increasing [2]. Accordingly, research on hydrogen energy, which is an environmentally friendly energy source, has been actively conducted [3,4]. Now, hydrogen is being used in almost all fields, from the basic materials of the steel industry and semiconductors, to fuel cells and energy systems in such as hydrogen vehicles [4]. In terms of the amount of storage per weight or volume, the storage of hydrogen in a liquefied state is more effective than in a metal hydride or pressurized gas state [5,6]. Pressurized storage vessels have been used to store liquefied hydrogen at temperatures <20 K [7,8] because of its boiling point (about 20 K), so liquefied hydrogen should be kept in a freezer. Hence, storage vessels for liquefied hydrogen should have highly effective insulation properties to store or transfer liquefied hydrogen [9]. In particular, because hydrogen leakage from a storage vessel could cause a fire or explosion, containment safety is a critical factor.
Hydrogen affects the mechanical properties of materials, so that the quasi cleavage caused by fractures due to the brittleness of the material surface in a hydrogen environment can appear on fractured surfaces. This can cause brittleness due to a loss of elongation due to hydrogen filling [10,11,12]. Moreover, in cases where steel equipment is exposed to wet hydrogen sulfide (H2S), internal cracking occurs due to hydrogen-induced cracking (HIC) [12,13,14,15]. Accordingly, it is necessary to understand the effect of the container materials on mechanical properties according to the amount of hydrogen to solve this problem. In addition, the defects (such as pitting corrosion) that occur in the film coating of storage vessels, which are used to prevent hydrogen permeation, are one of the causes of explosion [16,17,18]. Early detection of defects and the ability to monitor their growth using a non-destructive evaluation (NDE) method is therefore required.
So far, because related research on the safety of liquefied hydrogen storage vessels (LHSVs) has been focused on improving storage efficiency, NDE methods suitable for LHSVs have not yet been sufficiently developed. Beyer et al. [19] reported the feasibility of measuring hydrogen effusion in austenitic stainless steel (1.4301) using neutron radiography at a research reactor. Bae et al. [20] non-destructively evaluated the damage and mechanical properties of hydrogen-filled stainless steel 304 using acoustic emission and ultrasound. Hwang et al. [21] employed the synthetic aperture focusing technique (SAFT) to describe HIC images, with location and size information close to the actual defects, and determined the presence or absence of stepwise cracks using a technique for identification of flaw signals using deconvolution (TIFD). As shown in these previous studies, radiography, acoustic emission, and ultrasound have been used for the NDE of LHSVs. Other techniques, such as eddy current testing, magnetic particle inspection, and liquid penetrate testing, can be applied non-destructively to detect defects in LHSVs [22].
Among the NDE techniques, ultrasonic testing has been widely used because of its advantages of being fast, safe, cost-effective, and easy to use [23]. However, the pulse-echo method, which uses one ultrasonic sensor, is unsuitable for LHSVs unless high-frequency ultrasound is used. This is because the shape of LHSVs is cylindrical, and the walls are usually ~3 mm thick, depending on the working pressure [18,24], so there is a technical limit to applying the conventional ultrasonic pulse reflection method using a longitudinal or transverse wave. In addition, at high frequency, it is difficult to evaluate the defects suggested in the received signal obtained by the pulse-echo method because of its high acoustic impedance (about 50 kg/m2 s). Guided waves (GWs) propagated within a geometric structure have been applied to a wide range of items in industrial fields (e.g., pipes, steam generator tubes, and thin plates) because of the superior characteristics of this approach for inspecting long-range specimens [25,26,27,28,29]. Unlike other ultrasonic testing methods, ultrasonic GWs can be used on all types of specimens without removing insulation or coatings [30,31,32]. In addition, because the acoustic attenuation is relatively small, it is not necessary to scan every part of the vessel, even when detecting defects in large vessels. Because there are several solutions to the propagation equation of ultrasonic GWs, various propagation modes can be found. Therefore, high-performance and high-efficiency results can be obtained by selecting the propagation mode most suitable for the test object.
To improve the defect detection ability of the technique using guided ultrasound, short-time Fourier transform (STFT) was employed to analyze the guided ultrasound mode and linear discriminant analysis (LDA) for classification according to the presence or absence of defects. Signals in the time–frequency domain obtained using STFT displayed information on arrival times according to frequencies, and the dispersion patterns of each mode could be clearly displayed [33]. LDA is a pattern-classification method that is suitable for two-group classification, such as the presence or absence of defects [34,35,36]. Various signal processing methods, such as wavelet transform, Hilbert transform, and empirical mode decomposition, have been widely used in the field of ultrasonic NDT technologies. In this study, a new machine learning method based on LDA with GW data for classifying defective specimens from sound specimens was developed because the LDA-based classifier is a well-known pattern classifier, and LDA is able to discover a linear combination of features that distinguish or classify two or more classes of events or objects [35]. Therefore, by analyzing the signal properties implemented in the time–frequency domain, features were extracted from the pixel information in the described images. These were used to find a linear combination of features better able to separate the two classes.
In this study, to develop an NDE method for LHSVs, ultrasonic GW techniques based on LDA and STFT were employed. First, artificial defects of various sizes were fabricated in specimens of 304SS plate such as those used for LHSVs. Second, the STFT was applied to the received ultrasonic GW signals that passed through defects; the differences in the STFT results between specimens with and without defects were analyzed. Finally, a model capable of detecting the defects based on STFT and LDA was developed, and its performance was evaluated. By verifying the results, we confirmed the feasibility of detecting defects in a liquid hydrogen container by applying the experimental techniques and analysis methods used in this study.

2. Materials and Methods

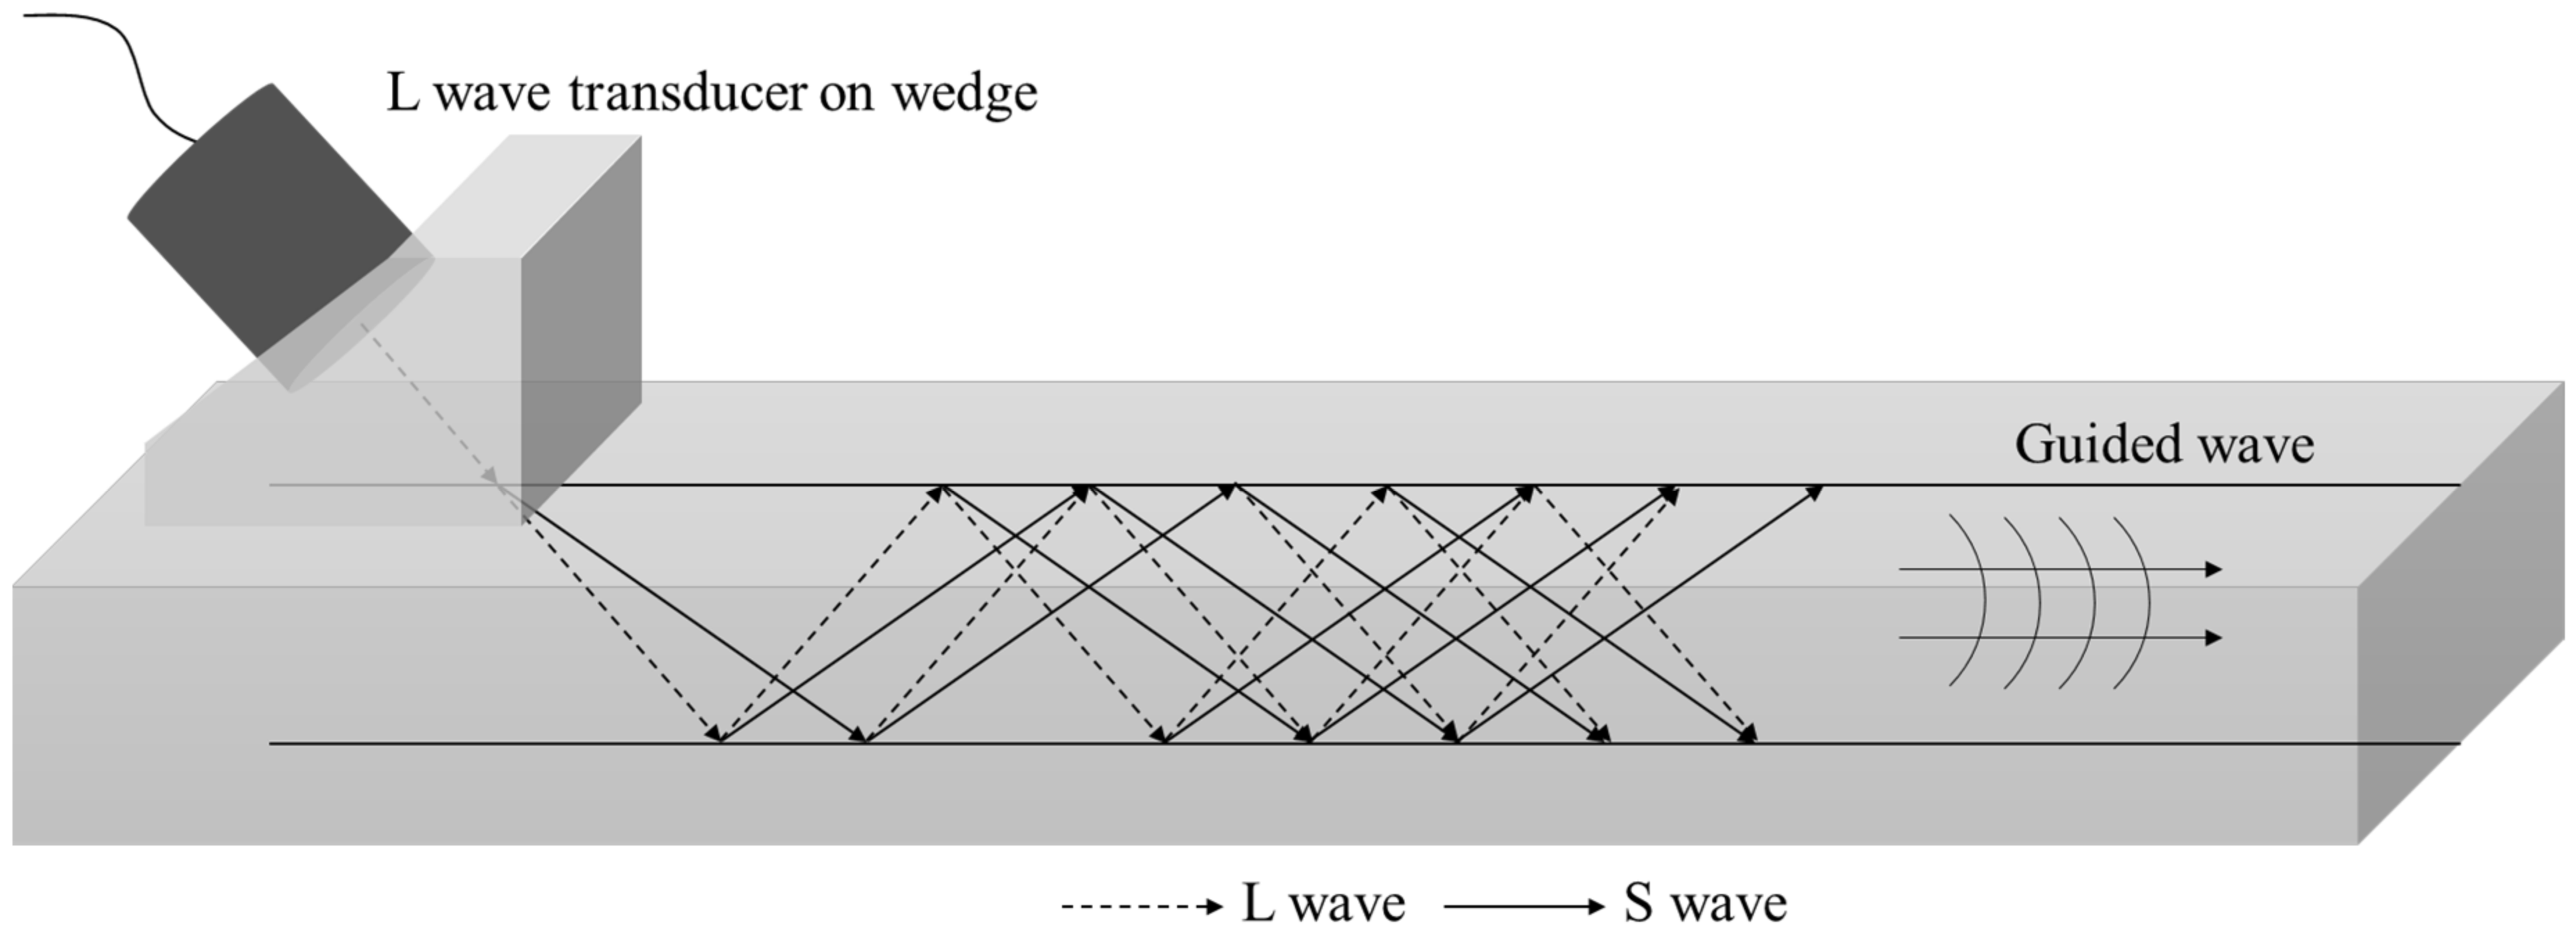
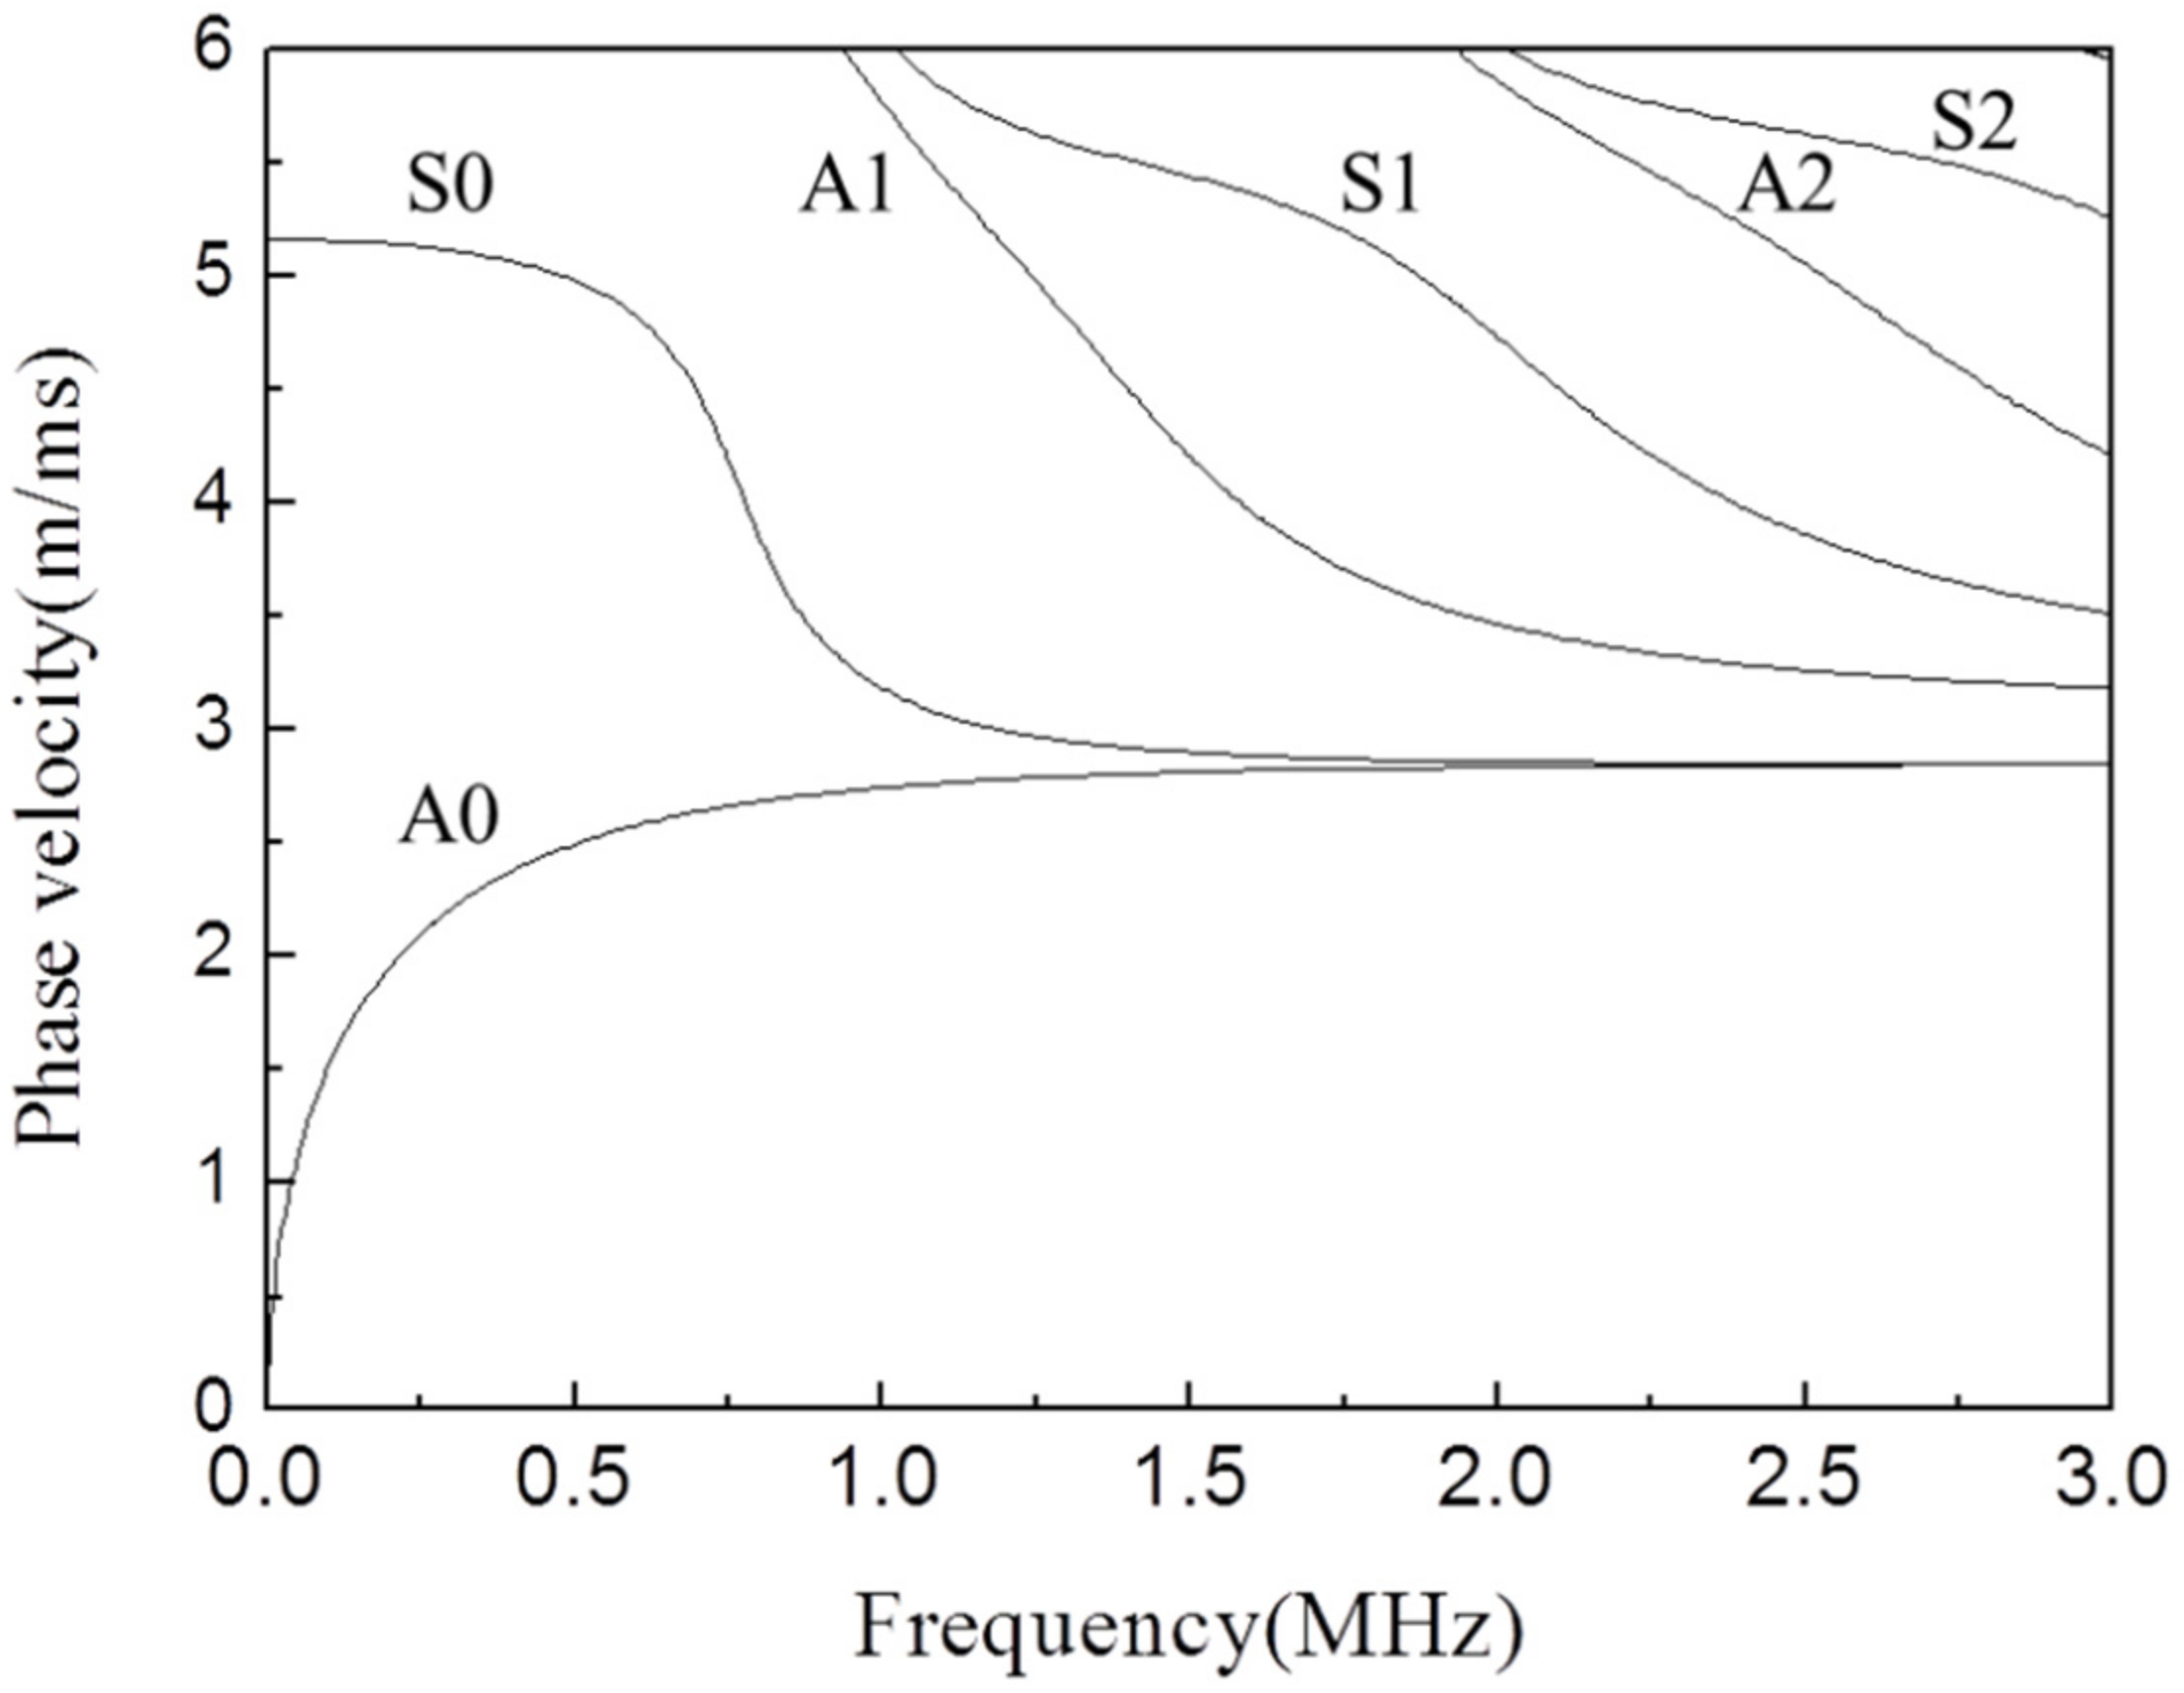
2.1. Generation of Ultrasonic GWs

Unlike bulk ultrasonic waves, an ultrasonic GW is generated by the summation of various propagating waves within an interface or thin plate, as shown in Figure 1 [27]. There are many propagating modes of ultrasonic GWs that vary according to the structural shapes of objects. Ultrasonic GWs can be generated by various methods, such as using a longitudinal ultrasonic transducer with a wedge, an electromagnetic acoustic transducer, and array transducers [37]. In this study, to generate ultrasonic GWs, we used a wedge that enables conversion of the incident longitudinal wave to a plate wave or Rayleigh wave at the interface between the wedge and the specimen. The optimal angle of the wedge for generating the GW can be determined using Snell’s law.
Ultrasonic waves have three propagation modes: longitudinal, torsional, and flexural [38]. Moreover, these modes can be classified by their degree of circumferential direction. Longitudinal and torsional modes show symmetric propagation, and the flexural mode shows asymmetric propagation. The longitudinal mode can occur under the condition that n = 0, where n is the degree of the circumferential direction. By solving the characteristic equation for longitudinal mode, the dispersion of the phase velocity can be calculated [39].
The optimal frequency can be determined by analysis of the dispersion curve describing the relation between the phase or group velocities and the frequency at a certain thickness of the object of concern. In this study, the test object considered was a 3 mm thick 304SS plate.

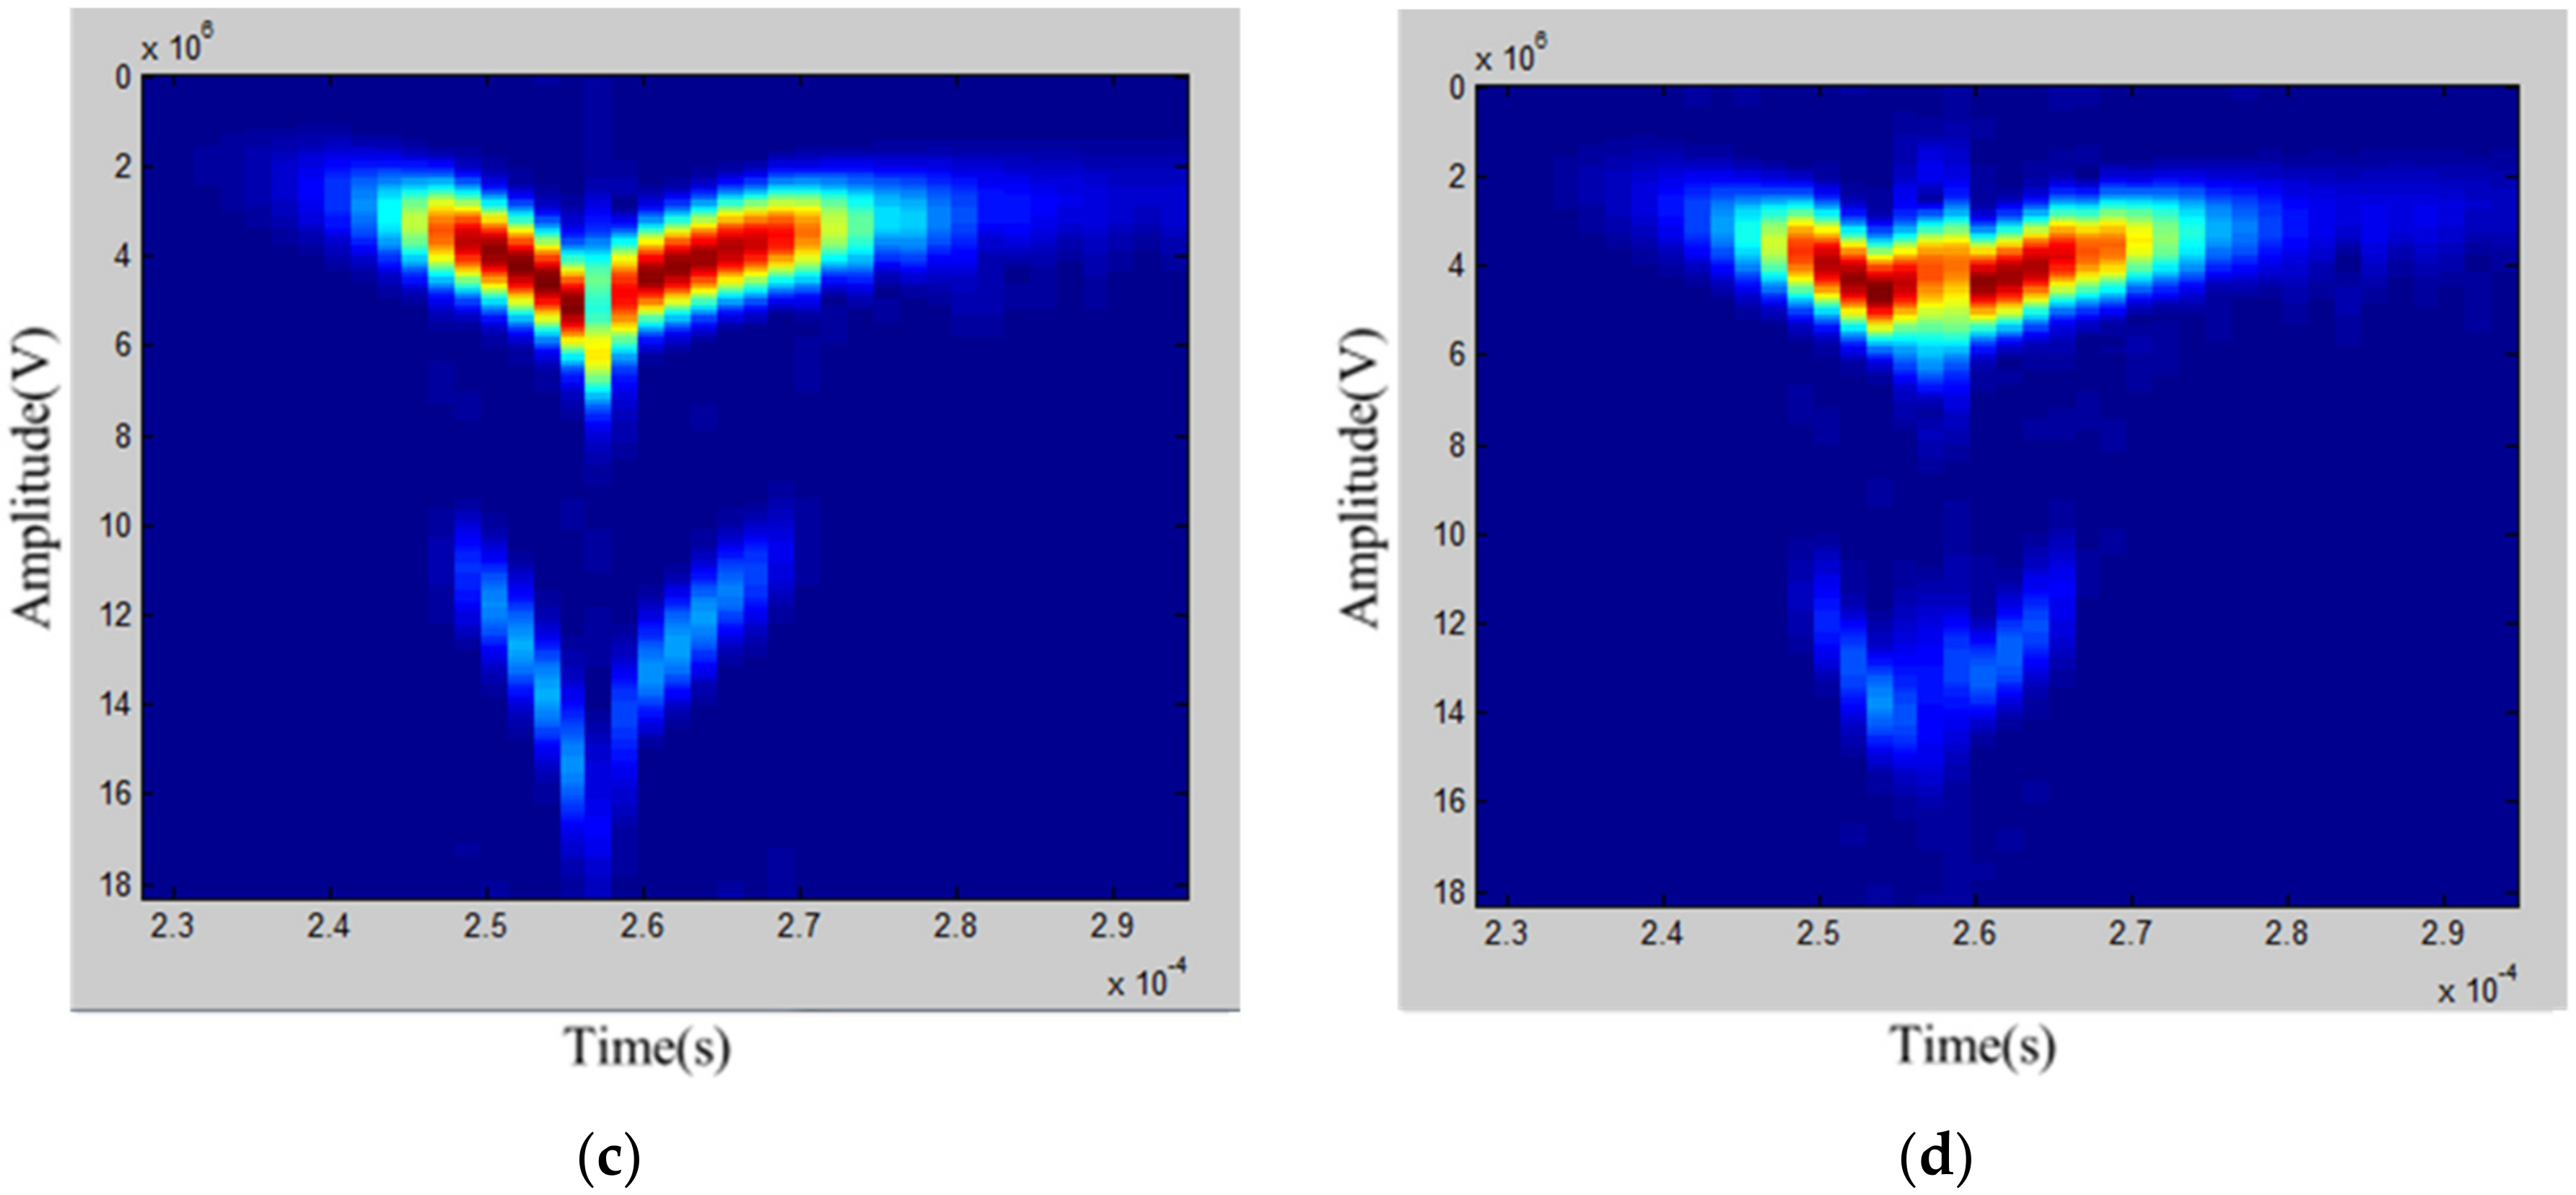
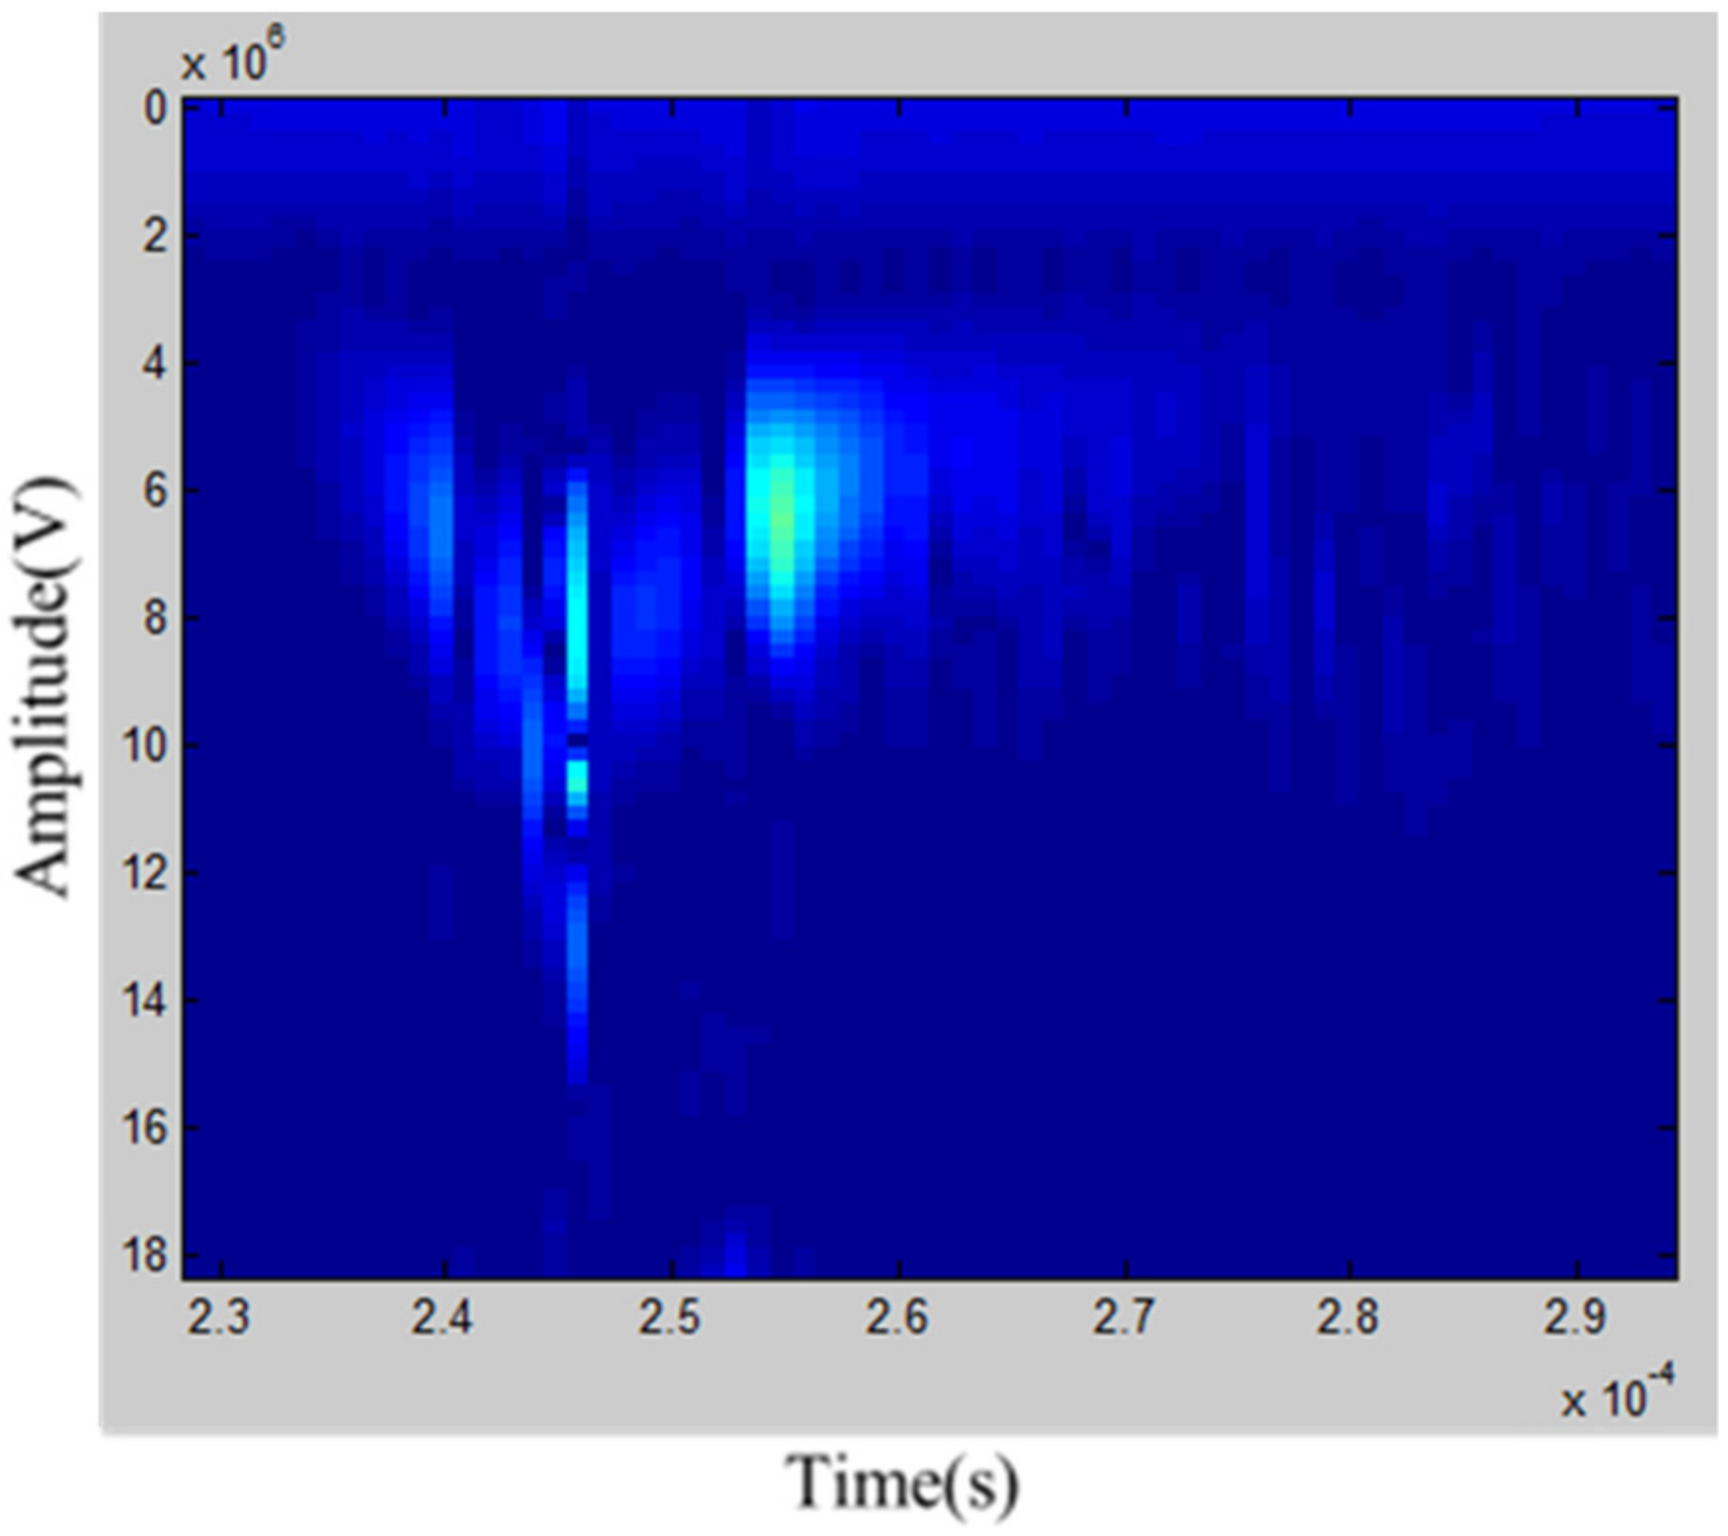
2.2. Short-Time Fourier Transform

Ultrasonic wave signals can be analyzed in the time and frequency domains. Time-of-flight and amplitude can be determined in time-domain analysis, and the components of frequencies and their magnitudes can be found from the frequency-domain analysis. The frequency spectrum of the original signal ( f t ) can be obtained by a Fourier transform as defined by [33]
F ω = + f t e i w t d t
where F ω is the amplitude of the component of frequency, ω is the angular frequency, and t is time. The original signal, f t , can be reconstructed by the summation of all frequency components. One of the drawbacks of the Fourier transform is that it does not offer any information about the original signal; hence, it is not useful for analyzing time-variant and non-stationary signals. From the Fourier transform of a continuous signal, only the frequency information at several time intervals can be acquired. In this study, to overcome this limitation, the STFT was applied to the received ultrasonic GW signals propagated through specimens. The STFT for a window function ( h ) is defined [33] as:
S T F T ω , τ = + f t h τ t e i w t d t
where the term, f t h τ t , has some information about the original signal f t at time τ. The result of S T F T ω , τ presents information about the original signal f t at time τ and frequency ω. Furthermore, the original signal f t can be reconstructed from a combination of localized information in the time and frequency domains [33], as indicated below.
f τ = 1 2 π + + S T F T ω , τ ψ τ u e i w t d w d t
The resulting image of the STFT of the received ultrasonic GW signal propagated through the 304SS plate represents the relationship between time and frequency; it is possible to express the time information according to frequency. Furthermore, dispersion characteristics can be seen clearly in each wave propagation mode. The dispersion rate depends on the propagation distance of the ultrasonic GW, but the dispersion trend is preserved. Hence, it is possible to classify the defects by analyzing the mode changes in the resulting image of the STFT of the ultrasonic GW signals from specimens with and without defects.
By analyzing the result in the time–frequency domain, it can be depicted as an image diagram to confirm the mode conversion difference. In a time–frequency image map, the color of each pixel represents an amplitude value for that time and frequency. Therefore, by comparing the difference in the number of pixels in the respective image diagrams, it can be confirmed that the color of the pixels in the image diagram varies according to the difference in the presence or absence of defects. Through this process, samples can be classified according to the presence or absence of defects from the STFT result of the received guided ultrasound.

2.3. Linear Discriminant Analysis

An attempt was made to classify the defects of specimens by means of the pixel numbers of an image map presenting the modes of ultrasonic GWs resulting from the STFT. For this purpose, LDA (a technique used for data classification and dimensionality reduction) was employed to find a linear combination of features [34]. This is a statistical method that reduces the dimensions of the feature vector by projecting the input data to a subspace consisting of the most discriminant directions maximizing the ratio of the variance between the classes to the variance within the classes in any particular data set. In this study, the experimental data of specimens with and without defects were classified using the discriminant line maximizing the separability of variance between two classes: with and without defects. To find the line that best separates the two groups for with-defect and no-defect signals, the variance between groups should be large, and the variance within a group should be small. Therefore, LDA (a method of reducing the dimensions by orthogonal projection to the principal axis to maximize the efficiency of separation into two groups) was used to analyze and classify ultrasonic signals for the presence or absence of defects [35,36].

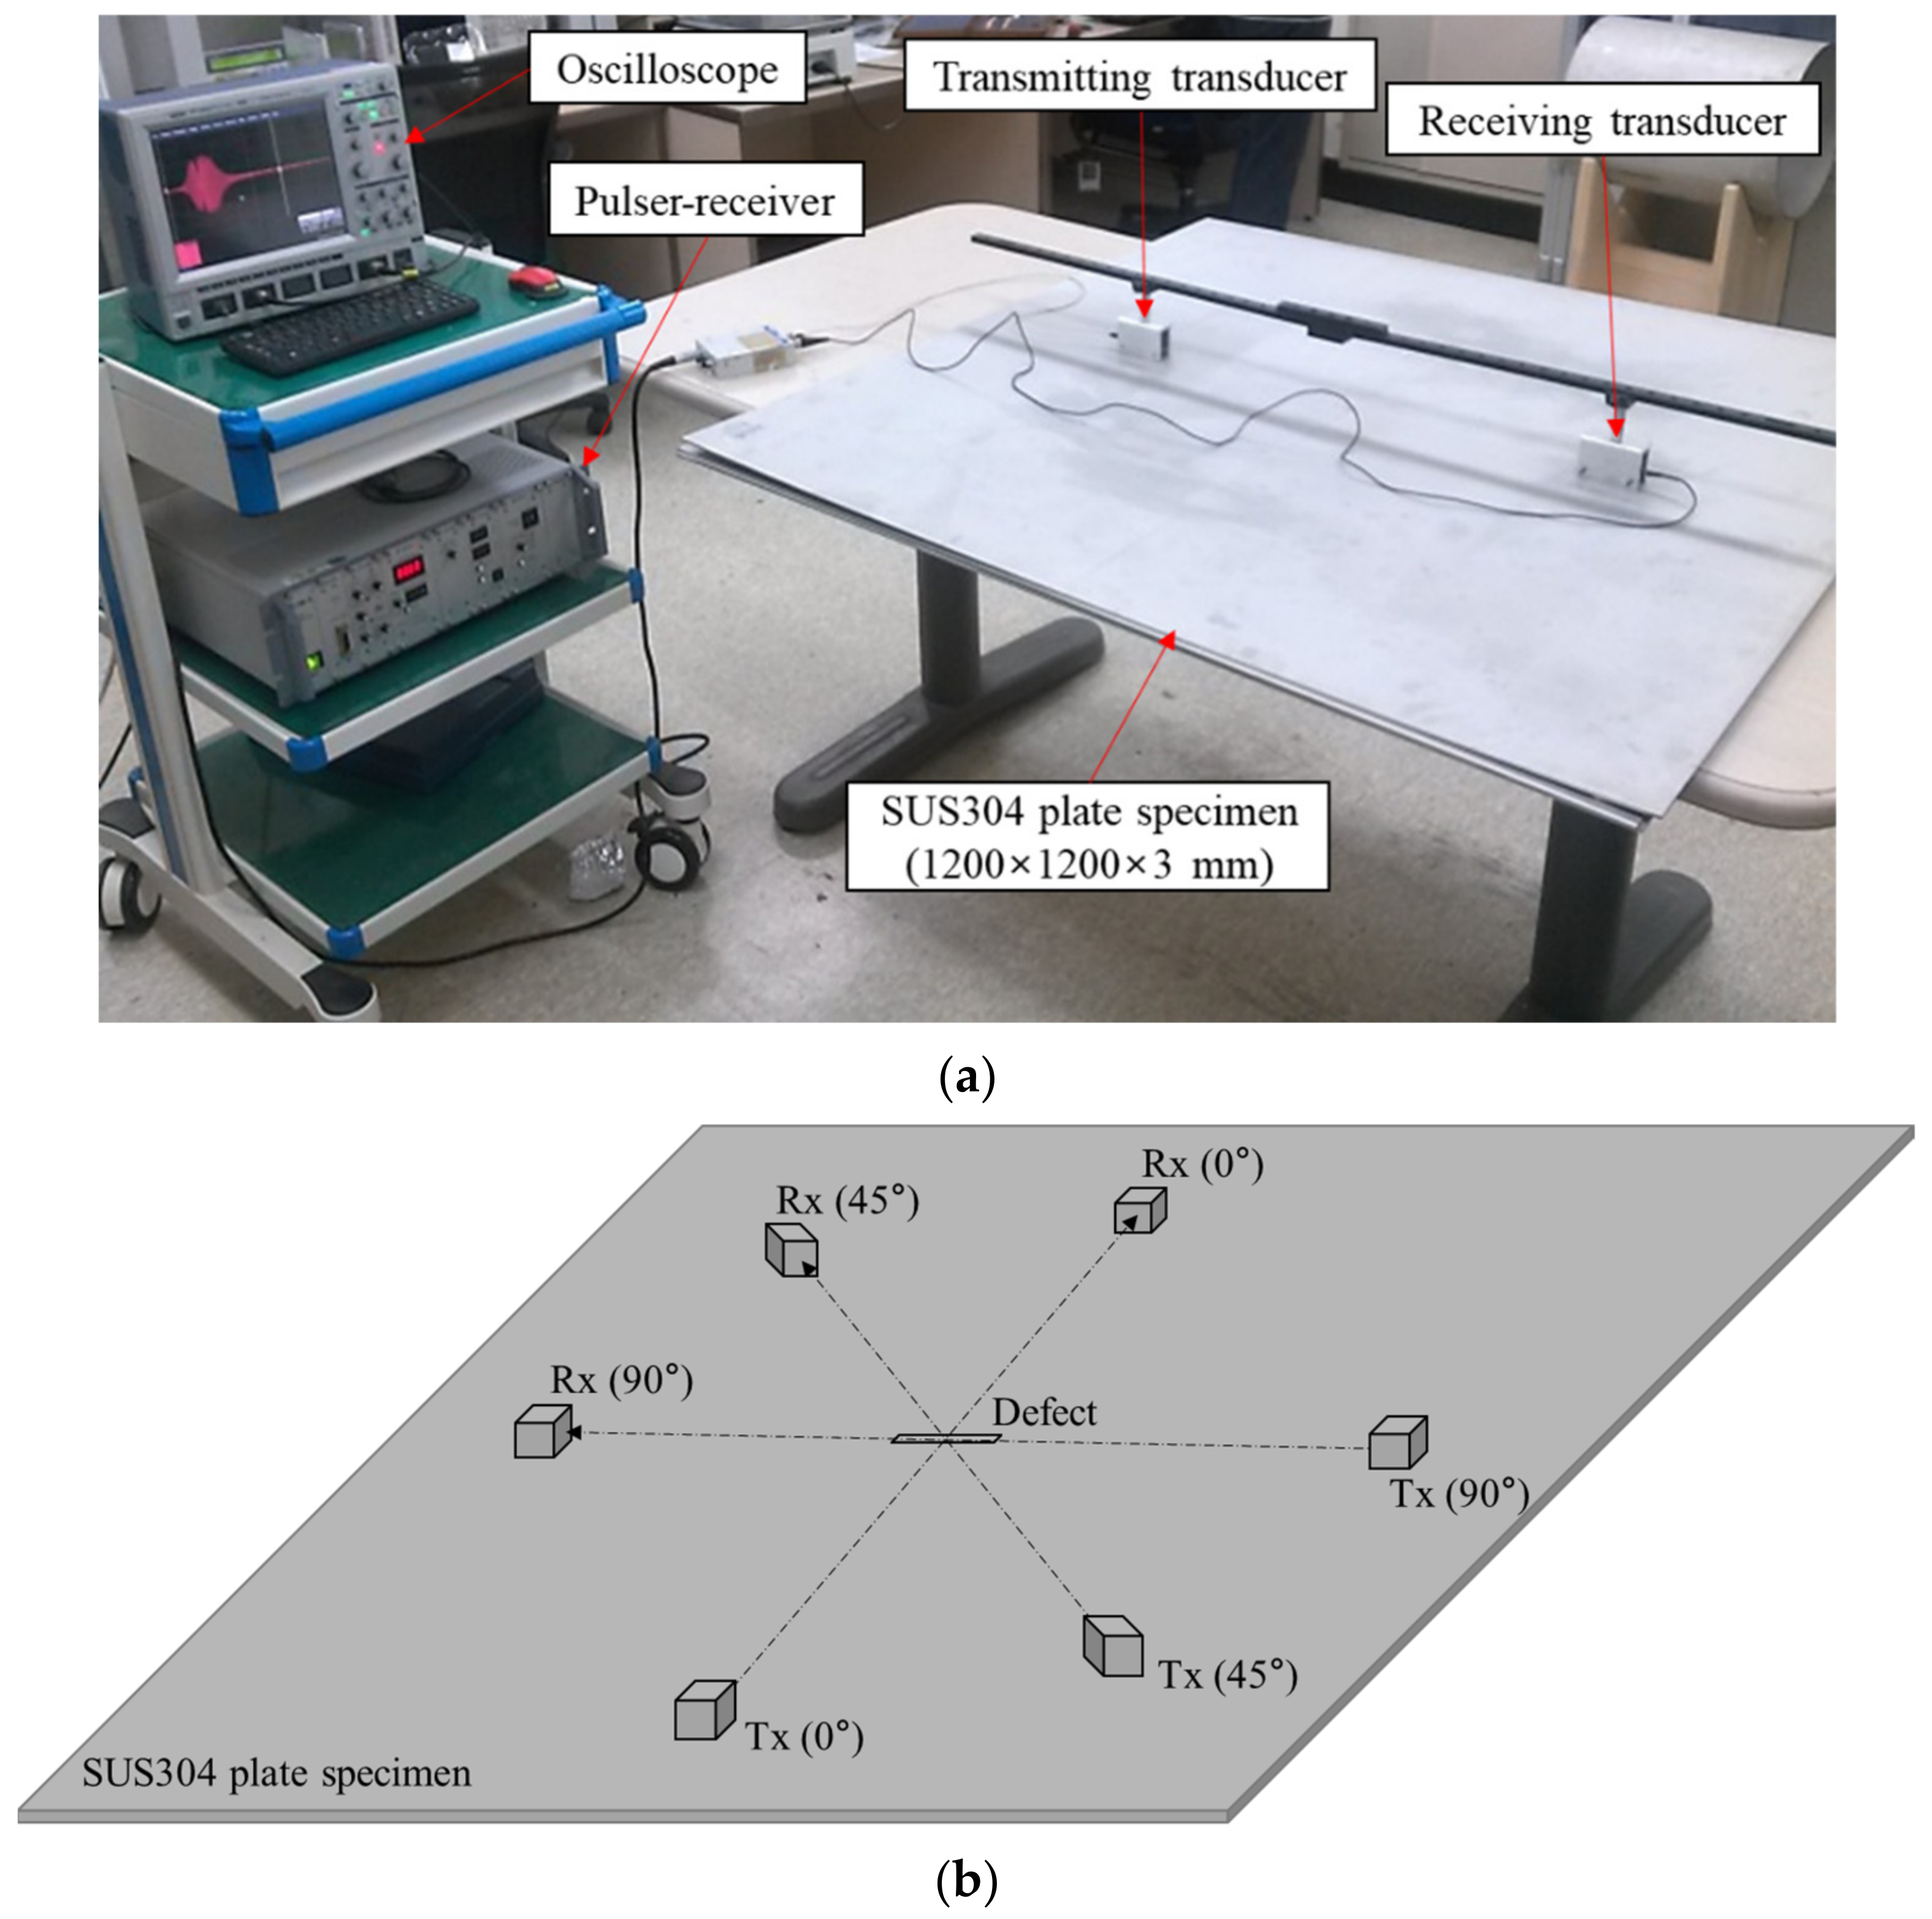
3. Ultrasonic GW System

The experimental setup we used for measuring the ultrasonic GW is shown in Figure 2a. It consisted of a pulser/receiver (HIS2, Krautkramer Japan Co., Ltd., Tokyo, Japan) to excite ultrasonic transducers (GAMMA series, KB-Aerotech, Lewistown, Pennsylvania, USA) and an oscilloscope (WaveRunner 62Xi, Teledyne LeCroy GmbH, Heidelberg, Germany) to display and acquire the receiving signals. The angle of incidence for generating the guided ultrasonic waves can be obtained using Snell’s law. To minimize the noise received, ultrasonic simulation was performed, so that reception of the noise signal reflected inside the wedge was avoided as much as possible. As a result, Plexiglas wedges with an incident angle of 53° were fabricated and attached to the front side of ultrasonic transducers, of which the nominal frequency was 2.25 MHz. The width, length, and thickness of the 304SS plates were 1200, 1200, and 3 mm, respectively.
Five kinds of artificial defects were fabricated on the surface of the metal specimens by the electrical discharge machining (EDM) method, as shown in Table 1. The defects were placed between the ultrasonic transmitter (Tx) and the receiver (Rx), and three directions of propagation of the ultrasound GW were selected: 0° (vertical), 45°, and 90° (horizontal) for the longest side of the defects, as shown in Figure 2b. All the ultrasonic GW signals were analyzed by the STFT algorithm according to their propagation angles.
Two types of data sets were acquired: one for calibrating the linear discriminant model and the other for validating the newly developed model. The number of data for each group were 200 and 100, respectively. The calibrating data set consisted of 100 data from no-defect specimens and 100 data from with-defect specimens. The validation data set consisted of 50 data from no-defect specimens and 50 from with-defect specimens.

4. Results and Discussion

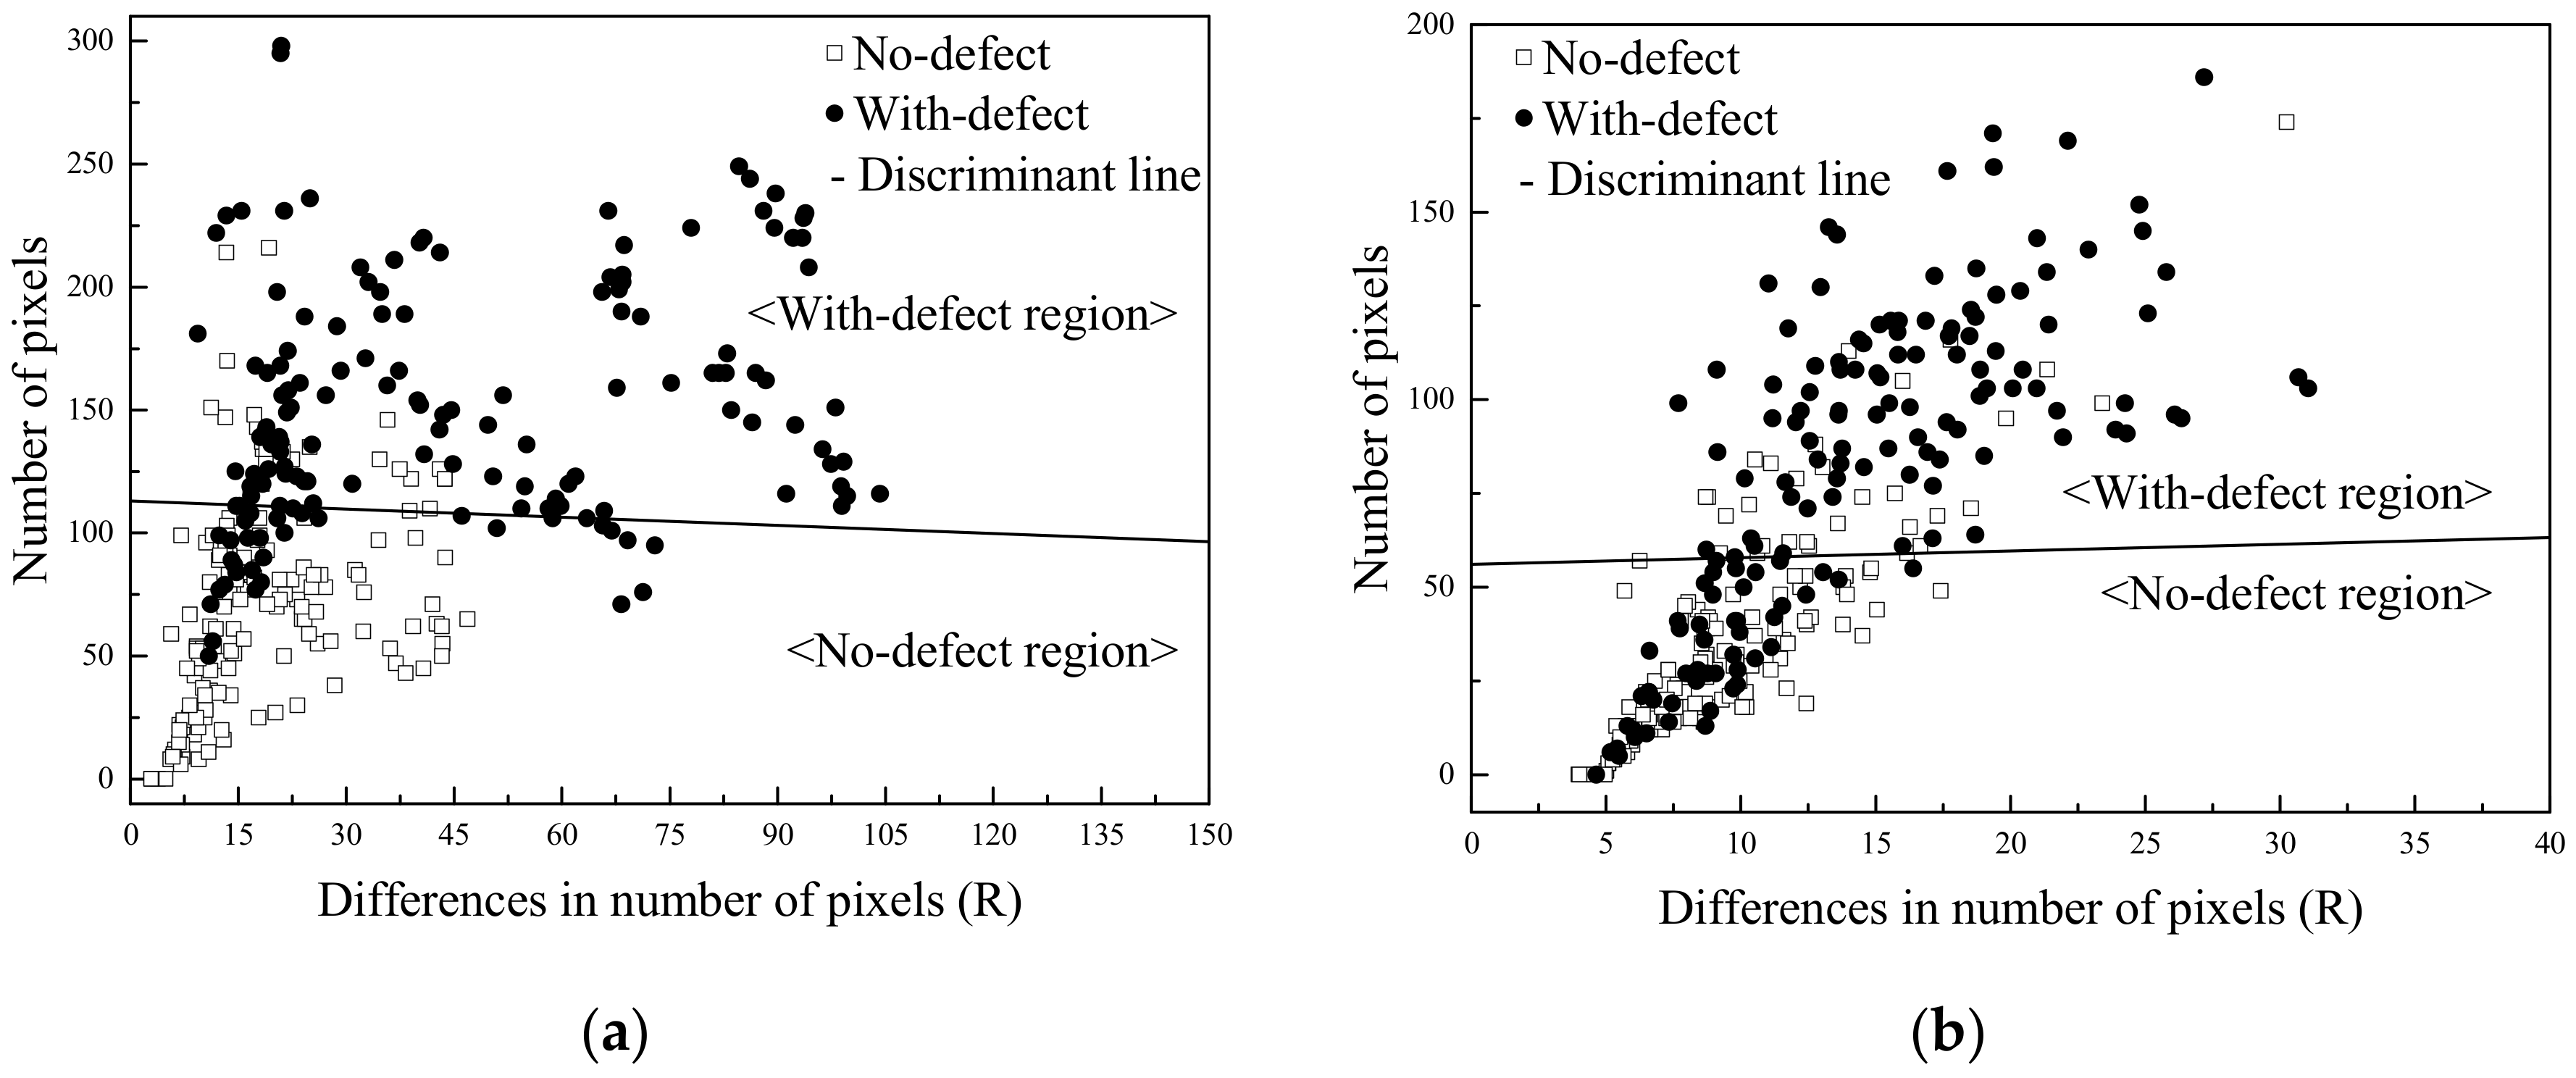
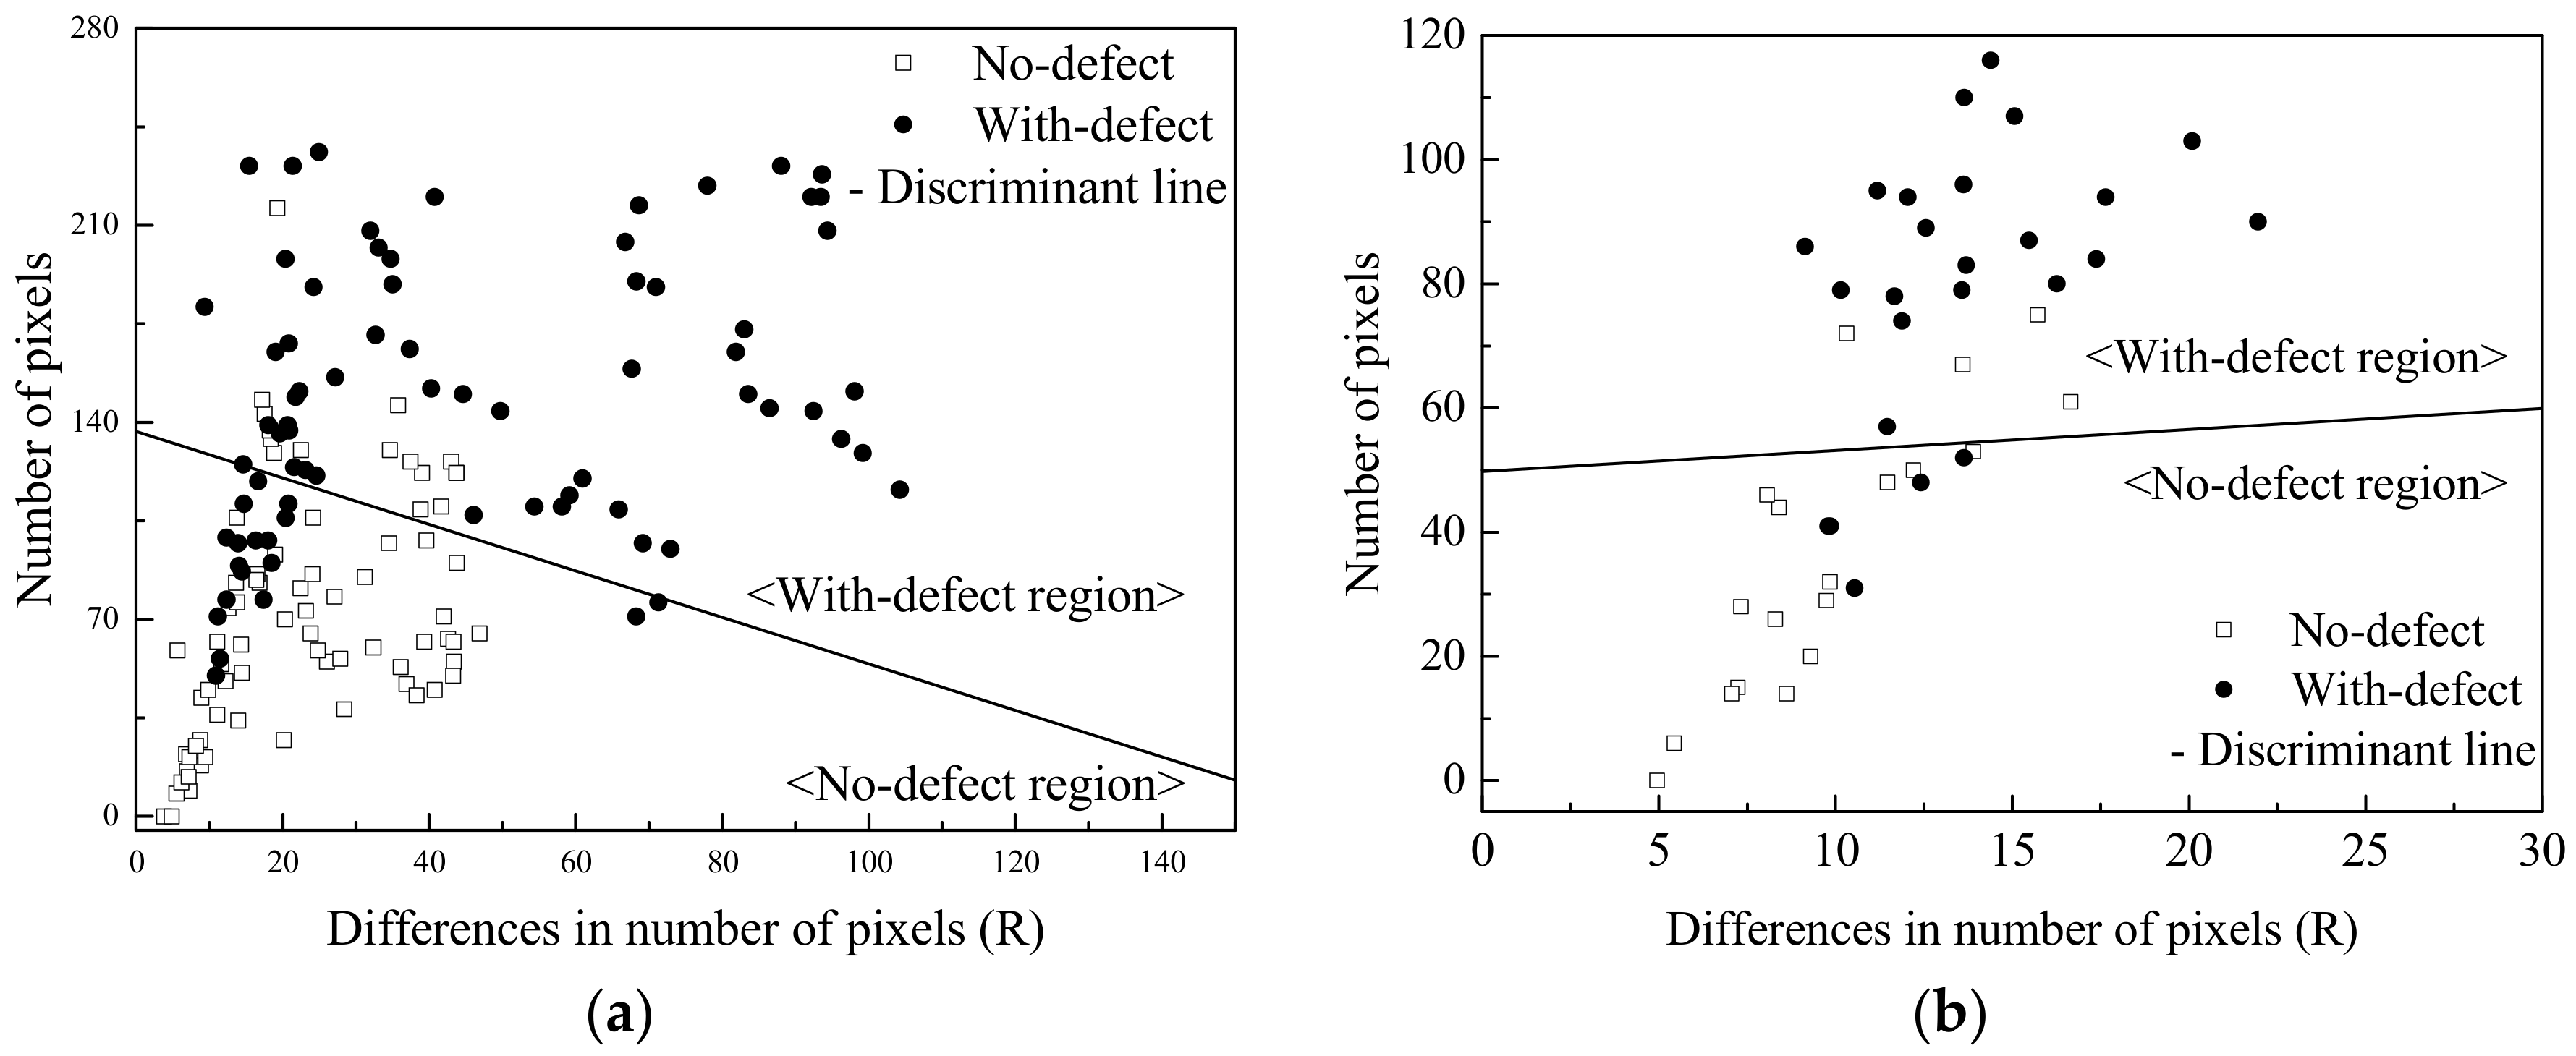
4.1. Discriminant Factor for Defects

Commercial software, “Disperse Version 2.0” (Imperial College NDT Lab, London, UK), was used to obtain the dispersion curve for the 3 mm thick 304SS plate, as shown in Figure 3. Because group velocities of S and A modes show constant values above 2.25 MHz, as the optimal frequency of the ultrasonic GW for the 3 mm thick 304SS plate, a pair of 2.25 MHz ultrasonic transducers was selected.
The ultrasonic GW signals generated using the ultrasonic transducers, and then received from test specimens with and without defects, were compared. The STFT algorithm was applied to all the measured data with a window length of 50. To consider the feasibility of the STFT for detecting defects, the signals measured from specimens with and without defects were compared. The results are shown in Figure 4a,b, which show the received ultrasonic GW signals for the specimens without and with defects in the time domain, respectively. It was difficult to recognize the significant differences between sound and defective specimens with the naked eye because of the small defect size. Figure 4c,d show the results of the STFT for the ultrasonic GW signals received from specimens with and without defects, respectively. The window length for the STFT was 500. In Figure 4c, the symmetric (red part in the upper left, S0) and asymmetric (red part in the upper right, A0) modes appear, and both modes are mixed in Figure 4d. Nevertheless, it was difficult to distinguish the two conditions from these results.
To find a factor for discriminating defects, the number of pixels in the area of each mode was counted in the resulting image after the STFT. Given that the area of modes (S0 and A0) in a specimen without defects is larger than that of a specimen with defects, as a discriminant factor, the differences in the number of pixels (R) of mode areas from the resulting images of STFT were defined by Equation (4):
R i , j = B i , j S i , j
where R i , j is the difference in the number of pixels of the mode area in the resulting image of the STFT between that without defects ( B ( i , j )) and that with defects ( S i , j ). Figure 5 shows the results of applying Equation (4) to the specimens with and without defects, and some differences in the number of pixels between specimens with and without defects were found. If Equation (4) was applied to the same specimens, the differences in the number of pixels would be zero or very small.

4.2. Discriminant Analysis for Classifying Defects

Ultrasonic GWs through the defects (numbered #1 to #5) were measured ten times for each defect at three measuring angles (0°, 45°, and 90°), as illustrated in Figure 2b. Figure 6a,b show the results of the LDA in the S0 and A0 modes, respectively, obtained by the STFT between specimens with and without defects. The lines in Figure 6a,b are discriminant lines obtained by the LDA to classify the defects.
In the two modes, the average discrimination rate by the LDA was 80.3% for S0 mode and 74.0% for A0 mode, as summarized in Table 2.
Table 2 shows that the classification rates for defects in the S0 and A0 modes were 80.3% and 74.0%, respectively. We thought that the LDA using S0 mode would be useful for the classification of no-defect specimens. As a method to classify the defects using LDA, first, all specimens were classified in S0 mode. Second, misclassified specimens were re-classified in A0 mode. For this purpose, the experimental data were randomly divided into two groups. As mentioned above, for the calibration set, no- and with-defect data were classified using the discriminant line in S0 mode, as shown in Figure 7a. Then, misclassified defect data (defect data within the no-defect region in Figure 7a) were classified again using the discriminant line in A0 mode, as shown in Figure 7b. From Figure 7a and Table 3, 15 no-defect data and 18 with-defect data were misclassified.
Figure 7b shows the classification results for misclassified data in the calibrating data set by LDA in A0 mode. The defect data misclassified by LDA in S0 mode were classified as defect data by LDA in A0 mode. From the results of Figure 7a,b, the classification rate for the calibrating set was 95.5%.
To validate the two newly developed discriminant lines in Figure 7a, the validation data set was applied to them. Table 4 shows the validation results of the newly developed LDA models for classifying the defects. The final classification rate was 97% (97 of 100). Based on the above results, we determined that the artificial defects of the 304SS specimen were successfully classified by the LDA model based on the difference in the number of pixels obtained by STFT between with-defect and no-defect specimens.

5. Conclusions

In this study, an ultrasonic GW technique was applied to detect artificial defects in 304SS plate specimens used in an LHSV. The ultrasonic GWs were generated and received by 2.25 MHz ultrasonic transducers with wedges. Five kinds of defects were artificially fabricated on the surfaces of plate specimens. The angles of transmission and reception of ultrasonic GWs through the defects were 0°, 45°, and 90°. As a parameter used to classify the defects, the differences in the number of pixels obtained by the STFT of the received ultrasonic GW signals between no- and with-defect specimens were used. A linear discriminant analysis was performed to classify the defects using the differences in S0 and A0 modes. The experimental data were divided into two groups: one was a calibration set and the other a validation set. An LDA model for the classification of defects was developed and validated. The classification rate for the validation set was about 97%. As a result, the classification accuracy of the proposed method, as shown by the final verification result, is very high compared with those of methods designed in other studies [40,41,42,43]. This result demonstrated that the defects of a specimen to be used for an LHSV can be classified with high accuracy using the newly developed LDA model. Additionally, as it shows high accuracy, we suggest that LDA, which has not been studied much for detecting defects by classifying signals until now, has the potential to be widely used together with other techniques [40,43], if conditions are met.
In the future, non-destructive evaluation studies are planned to detect internal defects in the same environmental conditions as the temperature and pressure of the LHSV being operated. In addition, based on this study, pixel-based ultrasound signal detection technology is expected to expand to research that increases accuracy by applying machine learning and deep learning models.

Author Contributions

Conceptualization, H.G.O., G.K. and K.-B.K.; data curation, M.-K.S. and G.K.; formal analysis, H.G.O. and G.K.; funding acquisition, K.-B.K.; investigation, Y.-I.H., M.-K.S., H.G.O., N.C. and G.K.; methodology, G.K.; project administration, K.-B.K.; resources, Y.-I.H., M.-K.S., H.G.O., N.C., G.K. and K.-B.K.; software, H.G.O.; supervision, G.K. and K.-B.K.; validation, Y.-I.H. and G.K.; visualization, Y.-I.H. and M.-K.S.; writing—original draft, Y.-I.H. and M.-K.S.; writing—review and editing, Y.-I.H., G.K. and K.-B.K. All authors have read and agreed to the published version of the manuscript.

Funding

This research was supported by a Development of Safety Measurement Technology for Infrastructure Industry grant funded by the Korea Research Institute of Standards and Science (KRISS-2022-GP2022-0010); and by the Korea Institute of Planning and Evaluation for Technology in Food, Agriculture and Forestry (IPET) through Agriculture, Food and Rural Affairs Convergence Technologies Program for Educating Creative Global Leader, funded by Ministry of Agriculture, Food and Rural Affairs (MAFRA) (Project No. 320001-4), Republic of Korea.

Institutional Review Board Statement

Not applicable.

Informed Consent Statement

Not applicable.

Data Availability Statement

Not applicable.

Conflicts of Interest

The authors declare no conflict of interest.

References

  1. Hunt, N.D.; Liebman, M.; Thakrar, S.K.; Hill, J.D. Fossil energy use, climate change impacts, and air quality-related human health damages of conventional and diversified cropping systems in Iowa, USA. Environ. Sci. Technol. 2020, 54, 11002–11014. [Google Scholar] [CrossRef] [PubMed]
  2. Olabi, A.G.; Mahmoud, M.; Soudan, B.; Wilberforce, T.; Ramadan, M. Geothermal based hybrid energy systems, toward eco-friendly energy approaches. Renew. Energy 2020, 147, 2003–2012. [Google Scholar] [CrossRef]
  3. Edwards, P.P.; Kuznetsov, V.L.; David, W.I. Hydrogen energy. Philosophical Transactions of the Royal Society A: Mathematical, Physical and Engineering. Sciences 2007, 365, 1043–1056. [Google Scholar]
  4. Crabtree, G.W.; Dresselhaus, M.S.; Buchanan, M.V. The hydrogen economy. Phys. Today 2004, 57, 39–44. [Google Scholar] [CrossRef]
  5. Rüdiger, H. Design characteristics and performance of a liquid hydrogen tank system for motor cars. Cryogenics 1992, 32, 327–329. [Google Scholar] [CrossRef]
  6. Ewald, R.; Kesten, M. Cryogenic equipment of liquid hydrogen powered automobiles. In Advances in Cryogenic Engineering; Springer: Boston, MA, USA, 1990; pp. 1777–1781. [Google Scholar]
  7. Barthélémy, H.; Weber, M.; Barbier, F. Hydrogen storage: Recent improvements and industrial perspectives. Int. J. Hydrogen Energy 2017, 42, 7254–7262. [Google Scholar] [CrossRef]
  8. Stetson, N.T.; McWhorter, S.; Ahn, C.C. Introduction to hydrogen storage. In Compendium of Hydrogen Energy; Woodhead Publishing: Cambridge, UK, 2016; pp. 3–25. [Google Scholar]
  9. Timmerhaus, K.D.; Flynn, T.M. Cryogenic Process Engineering; Springer Science & Business Media: New York, NY, USA, 2013. [Google Scholar]
  10. Fukuyama, S.; Zhang, L.; Yokogawa, K. Development of materials testing equipment in high pressure hydrogen and hydrogen environment embrittlement of austenitic stainless steels. J. Jpn. Inst. Met. 2004, 68, 62–65. [Google Scholar] [CrossRef] [Green Version]
  11. Nibur, K.A.; Bahr, D.F.; Somerday, B.P. Hydrogen effects on dislocation activity in austenitic stainless steel. Acta Mater. 2006, 54, 2677–2684. [Google Scholar] [CrossRef]
  12. Krüger, S.E.; Rebello, J.M.A.; De Camargo, P.C. Hydrogen damage detection by ultrasonic spectral analysis. NDT E Int. 1999, 32, 275–281. [Google Scholar] [CrossRef]
  13. Ye, C.; Kan, W.; Li, Y.; Pan, H. Experimental study of hydrogen embrittlement on AISI 304 stainless steels and Rayleigh wave characterization. Eng. Fail. Anal. 2013, 34, 228–234. [Google Scholar] [CrossRef]
  14. Gonzalez, J.L.; Ramirez, R.; Hallen, J.M.; Guzman, R.A. Hydrogen-induced crack growth rate in steel plates exposed to sour environments. Corrosion 1997, 53, 935–943. [Google Scholar] [CrossRef]
  15. TM0284 N.A.C.E; Standard Test Method-Evaluation of Pipeline and Pressure Vessel Steels for Resistance to Hydrogen-Induced Cracking. NACE International: Orlando, FL, USA, 2003.
  16. Klebanoff, L.E.; Pratt, J.W.; LaFleur, C.B. Comparison of the safety-related physical and combustion properties of liquid hydrogen and liquid natural gas in the context of the SF-BREEZE high-speed fuel-cell ferry. Int. J. Hydrogen Energy 2017, 42, 757–774. [Google Scholar] [CrossRef] [Green Version]
  17. Omidi Bidgoli, M.; Reza Kashyzadeh, K.; Rahimian Koloor, S.S.; Petru, M. Estimation of critical dimensions for the crack and pitting corrosion defects in the oil storage tank using finite element method and taguchi approach. Metals 2020, 10, 1372. [Google Scholar] [CrossRef]
  18. Wei, G.; Zhang, J. Numerical study of the filling process of a liquid hydrogen storage tank under different sloshing conditions. Processes 2020, 8, 1020. [Google Scholar] [CrossRef]
  19. Beyer, K.; Kannengiesser, T.; Griesche, A.; Schillinger, B. Study of hydrogen effusion in austenitic stainless steel by time-resolved in situ measurements using neutron radiography. Nucl. Instrum. Methods Phys. Res. Sect. A Accel. Spectrometers Detect. Assoc. Equip. 2011, 651, 211–215. [Google Scholar] [CrossRef]
  20. Bae, D.; Lee, J.; Lee, S.; Son, I.; Baek, U.; Nahm, S.; Lee, J. Evaluation on hydrogen embrittlement of material using nondestructive test. Int. J. Precis. Eng. Manuf. 2014, 15, 989–993. [Google Scholar] [CrossRef]
  21. Hwang, Y.I.; Kim, H.J.; Song, S.J.; Lim, Z.S.; Yoo, S.W. Improving the ultrasonic imaging of hydrogen-induced cracking using focused ultrasound. J. Mech. Sci. Technol. 2017, 31, 3803–3809. [Google Scholar] [CrossRef]
  22. Choudhary, S.; Vishwakarma, M.; Dwivedi, S.K. Evaluation and Prevention of Hydrogen Embrittlement by NDT Methods: A Review. Mater. Proc. 2021, 6, 18. [Google Scholar]
  23. Hwang, Y.I.; Kim, G.; Kim, Y.I.; Park, J.H.; Choi, M.Y.; Kim, K.B. Experimental measurement of residual stress distribution in rail specimens using ultrasonic LCR waves. Appl. Sci. 2021, 11, 9306. [Google Scholar] [CrossRef]
  24. Ahluwalia, R.K.; Hua, T.Q.; Peng, J.K.; Lasher, S.; McKenney, K.; Sinha, J.; Gardiner, M. Technical assessment of cryo-compressed hydrogen storage tank systems for automotive applications. Int. J. Hydrogen Energy 2010, 35, 4171–4184. [Google Scholar] [CrossRef]
  25. Song, S.J.; Park, J.S.; Shin, H.J. Guided wave mode selection and flaw detection for long range inspection of polyethylene coated steel gas pipes. J. Korean Soc. Nondestruct. Test. 2001, 21, 406–414. [Google Scholar]
  26. Rose, J.L.; Ditri, J.J.; Pilarski, A.; Rajana, K.; Carr, F. A guided wave inspection technique for nuclear steam generator tubing. NDT E Int. 1994, 27, 307–310. [Google Scholar] [CrossRef]
  27. Shin, H.J.; Rose, J.L. Guided wave tuning principles for defect detection in tubing. J. Nondestruct. Eval. 1998, 17, 27–36. [Google Scholar] [CrossRef]
  28. Alleyne, D.; Lowe, M.; Cawley, P. The inspection of chemical plant pipework using Lamb waves: Defect sensitivity and field experience. In Review of Progress in Quantitative Nondestructive Evaluation; Springer: Boston, MA, USA, 1996; pp. 1859–1866. [Google Scholar]
  29. Brook, M.V.; Ngoc, T.D.; Eder, J.E. Ultrasonic inspection of steam generator tubing by cylindrical guided waves. In Review of Progress in Quantitative Nondestructive Evaluation; Springer: Boston, MA, USA, 1990; pp. 243–249. [Google Scholar]
  30. Fitch, A.H. Observation of Elastic-Pulse Propagation in Axially Symmetric and Nonaxially Symmetric Longitudinal Modes of Hollow Cylinders. J. Acoust. Soc. Am. 1963, 35, 706–708. [Google Scholar] [CrossRef]
  31. Ditri, J.J.; Rose, J.L. Excitation of guided elastic wave modes in hollow cylinders by applied surface tractions. J. Appl. Phys. 1992, 72, 2589–2597. [Google Scholar] [CrossRef]
  32. Kwun, H.; Bartels, K.A. Experimental observation of elastic-wave dispersion in bounded solids of various configurations. J. Acoust. Soc. Am. 1996, 99, 962–968. [Google Scholar] [CrossRef]
  33. Goswami, J.C.; Chan, A.K. Fundamentals of Wavelets: Theory, Algorithms, and Applications; John Wiley & Sons: New York, NY, USA, 2011. [Google Scholar]
  34. Mika, S.; Ratsch, G.; Weston, J.; Scholkopf, B.; Mullers, K.R. Fisher discriminant analysis with kernels. In Neural Networks for Signal Processing IX: Proceedings of the 1999 IEEE Signal Processing Society Workshop (Cat. No. 98th8468), Madison, WI, USA, 25 August 1999; IEEE: New York, NY, USA, 1999; pp. 41–48. [Google Scholar]
  35. Luo, S.; Kim, E.H.; Dighe, M.; Kim, Y. Thyroid nodule classification using ultrasound elastography via linear discriminant analysis. Ultrasonics 2011, 51, 425–431. [Google Scholar] [CrossRef]
  36. Khan, A.; Kim, H.S. Classification and prediction of multidamages in smart composite laminates using discriminant analysis. Mech. Adv. Mater. Struct. 2020, 29, 230–240. [Google Scholar] [CrossRef]
  37. Rose, J.L. A baseline and vision of ultrasonic guided wave inspection potential. J. Press. Vessel Technol. 2002, 124, 273–282. [Google Scholar] [CrossRef]
  38. Liu, Z.; He, C.; Wu, B.; Wang, X.; Yang, S. Circumferential and longitudinal defect detection using T (0, 1) mode excited by thickness shear mode piezoelectric elements. Ultrasonics 2006, 44, e1135–e1138. [Google Scholar] [CrossRef]
  39. Pavlakovic, B.; Lowe, M.; Alleyne, D.; Cawley, P. Disperse: A general purpose program for creating dispersion curves. In Review of Progress in Quantitative Nondestructive Evaluation; Springer: Boston, MA, USA, 1997; pp. 185–192. [Google Scholar]
  40. Knak, M.; Wojtczak, E.; Rucka, M. Non-Destructive Diagnostics of Concrete Beams Strengthened with Steel Plates Using Modal Analysis and Wavelet Transform. Materials 2021, 14, 3014. [Google Scholar] [CrossRef] [PubMed]
  41. Liu, Y.; Xu, K.; Xu, J. An improved MB-LBP defect recognition approach for the surface of steel plates. Appl. Sci. 2019, 9, 4222. [Google Scholar] [CrossRef] [Green Version]
  42. Liu, Y.; Xu, K.; Xu, J. Periodic surface defect detection in steel plates based on deep learning. Appl. Sci. 2019, 9, 3127. [Google Scholar] [CrossRef] [Green Version]
  43. Tian, S.; Xu, K. An algorithm for surface defect identification of steel plates based on genetic algorithm and extreme learning machine. Metals 2017, 7, 311. [Google Scholar] [CrossRef]
Figure 1. Ultrasonic transducer with wedge to generate ultrasonic GW [37].
Applsci 12 06502 g001
Figure 2. (a) Photograph of the experimental setup and (b) measuring angles between each ultrasonic transducer and a defect.
Applsci 12 06502 g002
Figure 3. Calculation result of dispersion curve for 3 mm thick 304SS plate.
Applsci 12 06502 g003
Figure 4. (a) Received ultrasonic GW signals from specimens without and (b) with defects in the time domain, and (c) STFT results for specimens without and (d) with defects.
Applsci 12 06502 g004aApplsci 12 06502 g004b
Figure 5. Results of applying Equation (4) to the images resulting from the STFT from test specimens without and with defects.
Applsci 12 06502 g005
Figure 6. Results of LDA in (a) S0 and (b) A0 mode.
Applsci 12 06502 g006
Figure 7. Classification results of (a) calibration data set classified by LDA in S0 mode and (b) data in the calibration data set misclassified by LDA in A0 mode.
Applsci 12 06502 g007
Table 1. Dimensions of the five types of artificial defects.
Defect NumberLength × Width × Depth (mm)
#110 × 0.2 × 0.3
#210 × 0.4 × 0.3
#310 × 0.6 × 0.3
#4 10 × 0.2 × 0.05
#510 × 0.2 × 0.5
Table 2. Average classification rates for defects by LDA in S0 and A0 modes.
S0 ModeClassification RateA0 ModeClassification Rate
No defects (150)83.4%No defects (150)80.7%
With defects (150)77.4%With defects (150)67.3%
Total (300)80.3%Total (300)74.0%
Table 3. Classification results for calibrating set by LDA in S0 and A0 modes.
Step I in S0 ModeMisclassified DataStep II in A0 ModeMisclassified Data
No defects (100)19No defects (19)4
With defects (100)25With defects (25)5
Total (200)43Total (43)9
Table 4. Classification results of the newly developed LDA model for classifying the defects by validation set.
Step I in S0 ModeMisclassified DataStep II in S0 ModeMisclassified Data
No defects (50)4No defects (4)3
With defects (50)7With defects (7)0
Total (100)11Total (11)3
Publisher’s Note: MDPI stays neutral with regard to jurisdictional claims in published maps and institutional affiliations.

