
NDE Characterization of Surface Defects on Piston Rods in Shock Absorbers Using Rayleigh Waves

 ,
,  ,
,  and
and 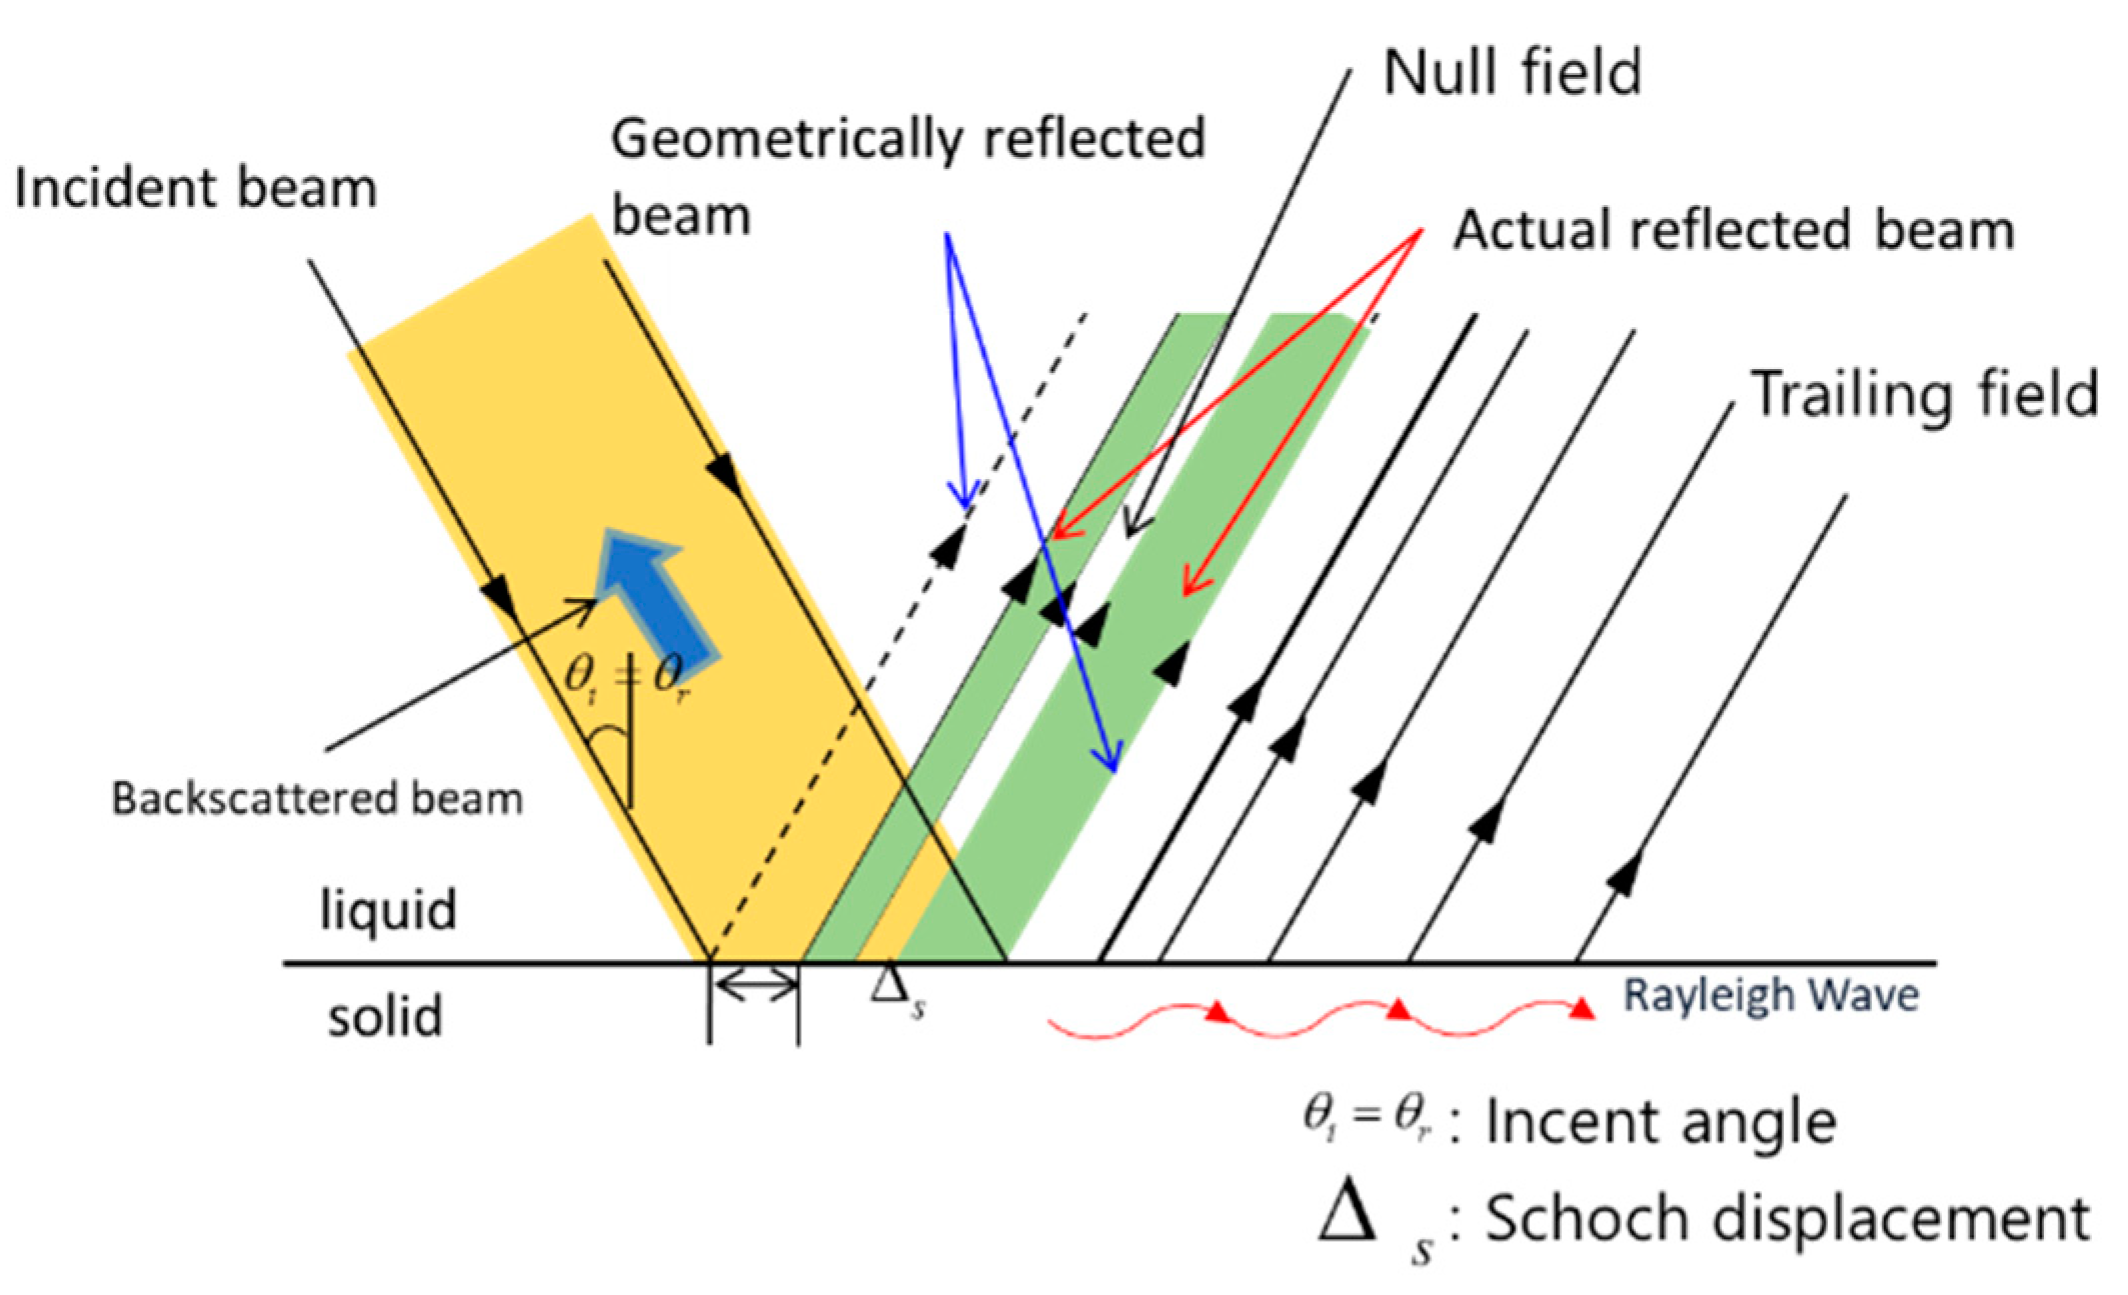
Abstract
:1. Introduction
2. Principle of Ultrasonic Waves and FEM Simulation
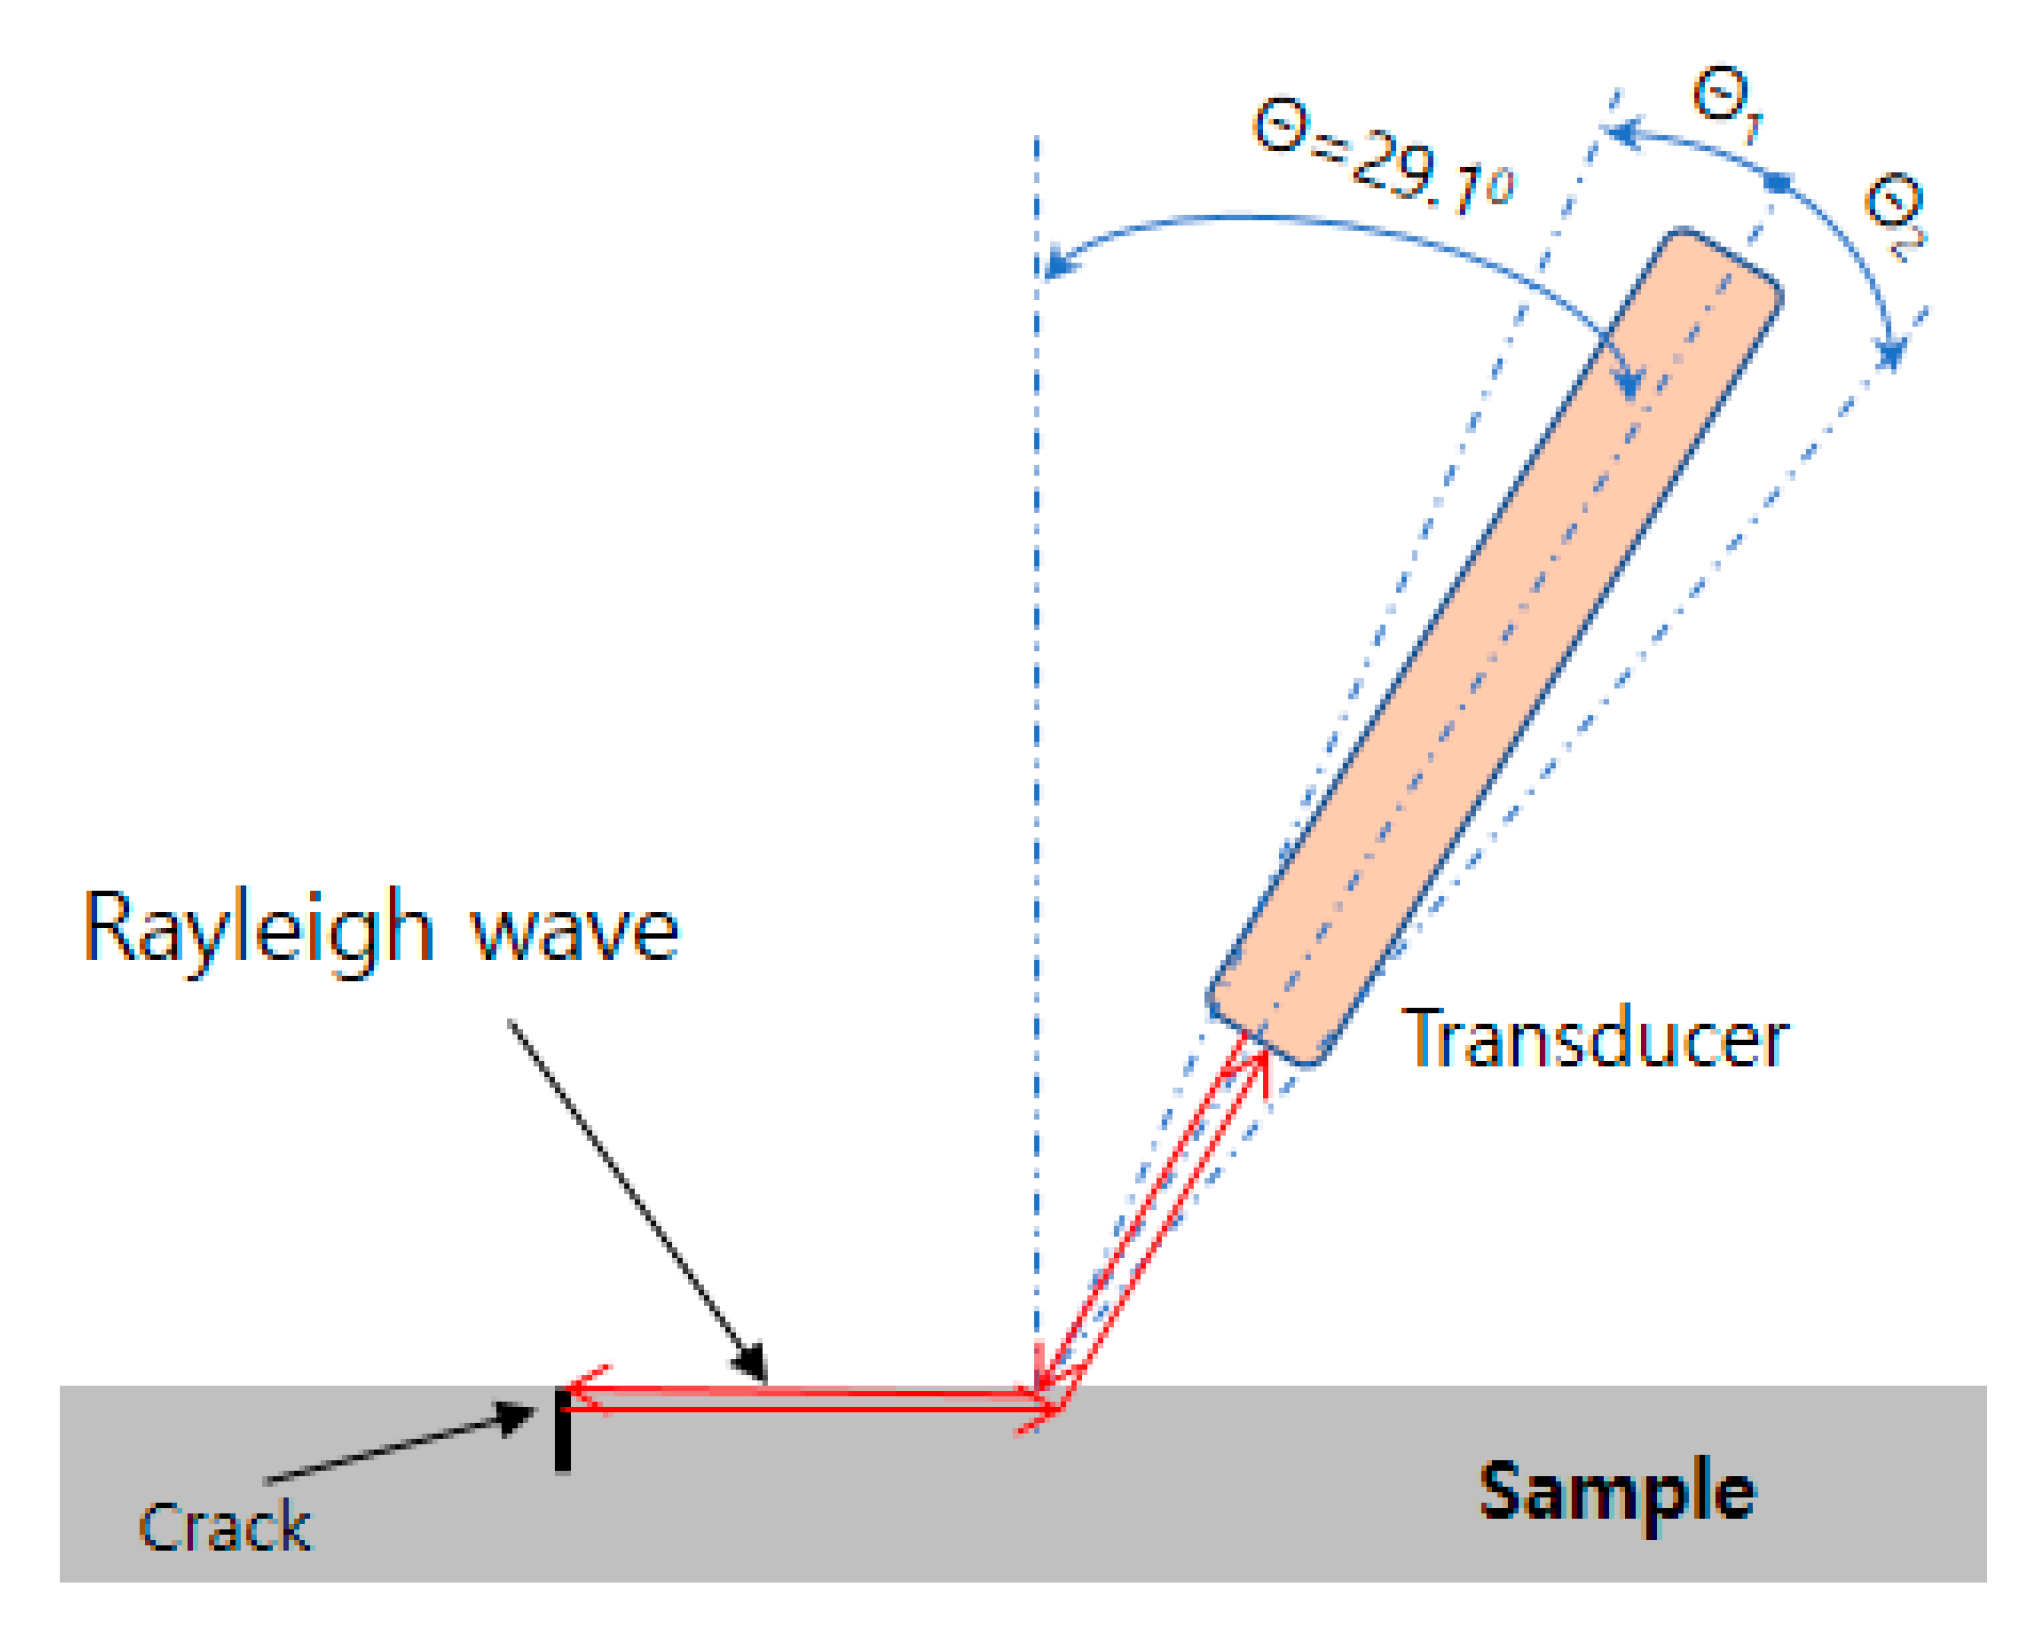
2.1. Measurement of Rayleigh Waves
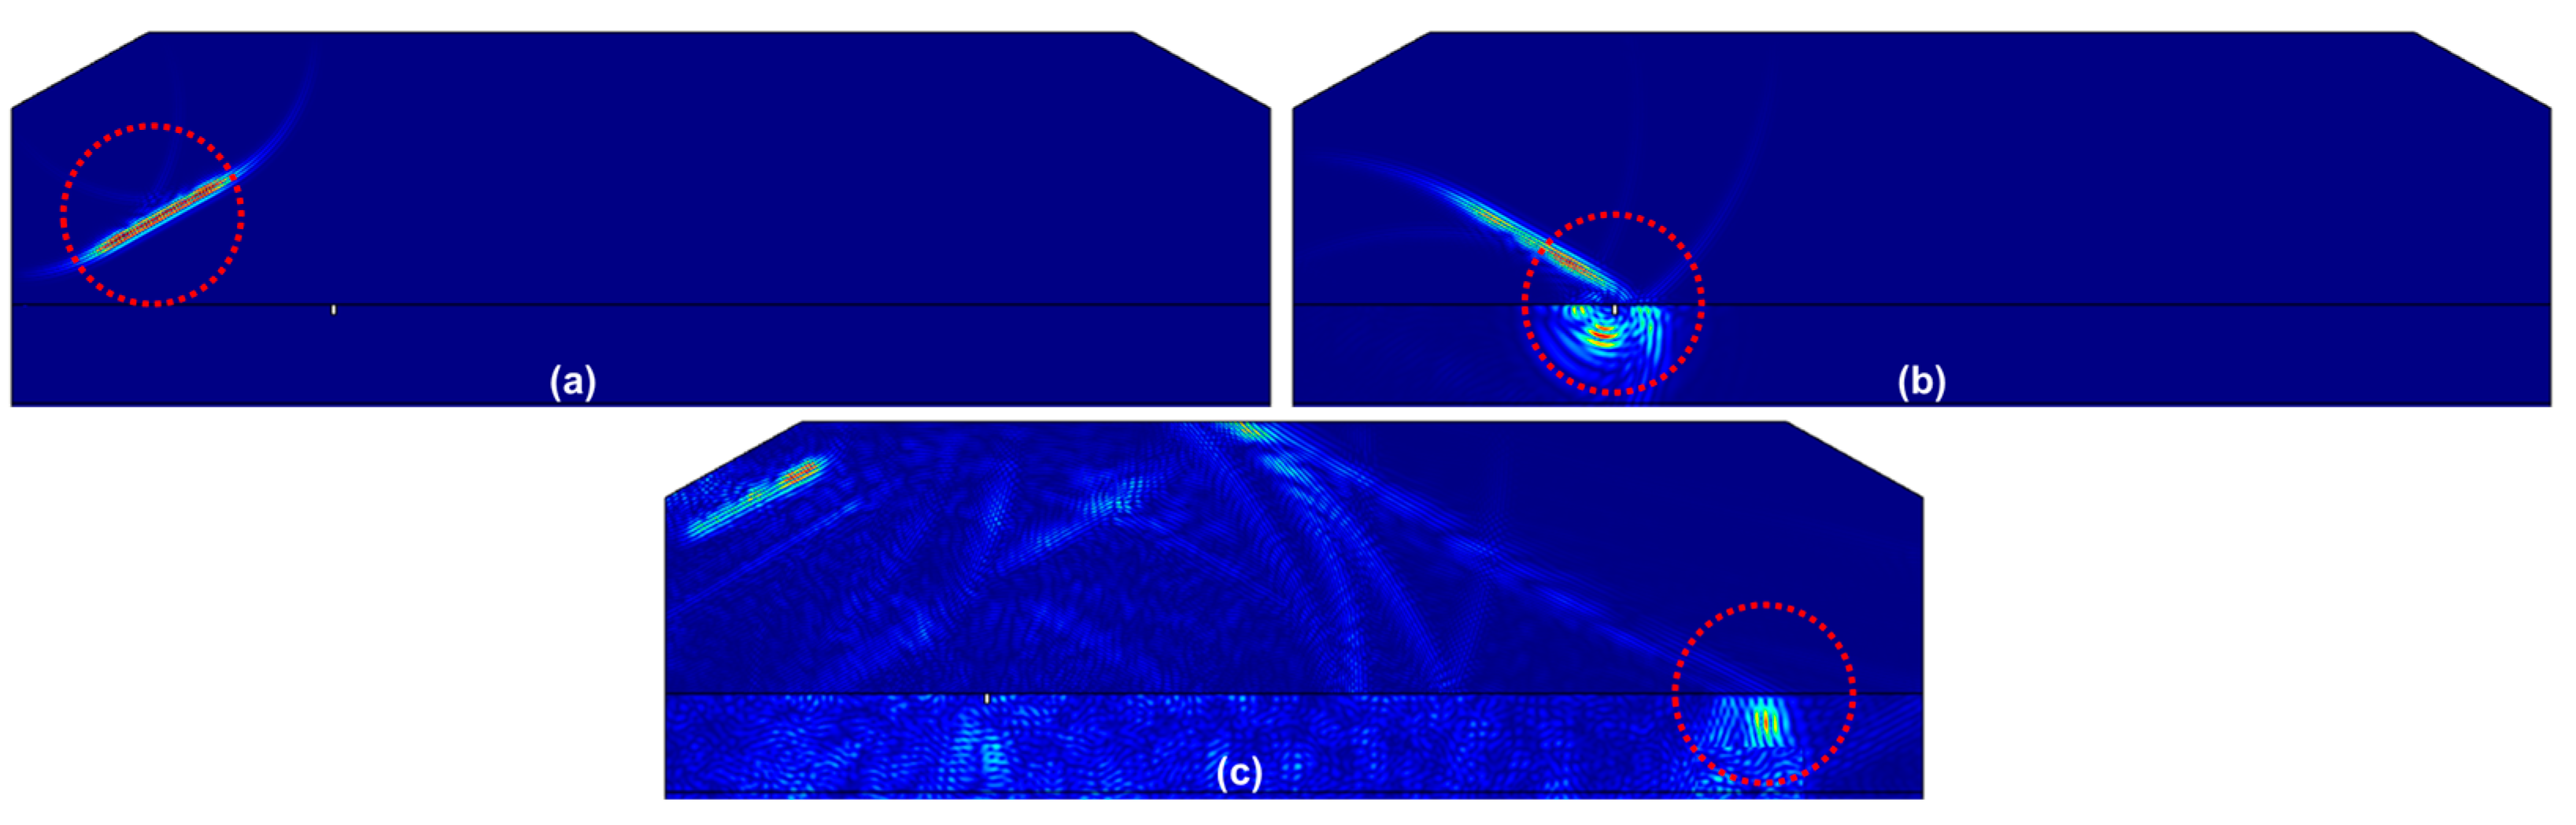
2.2. Simulation of Ultrasonic Wave Propagation
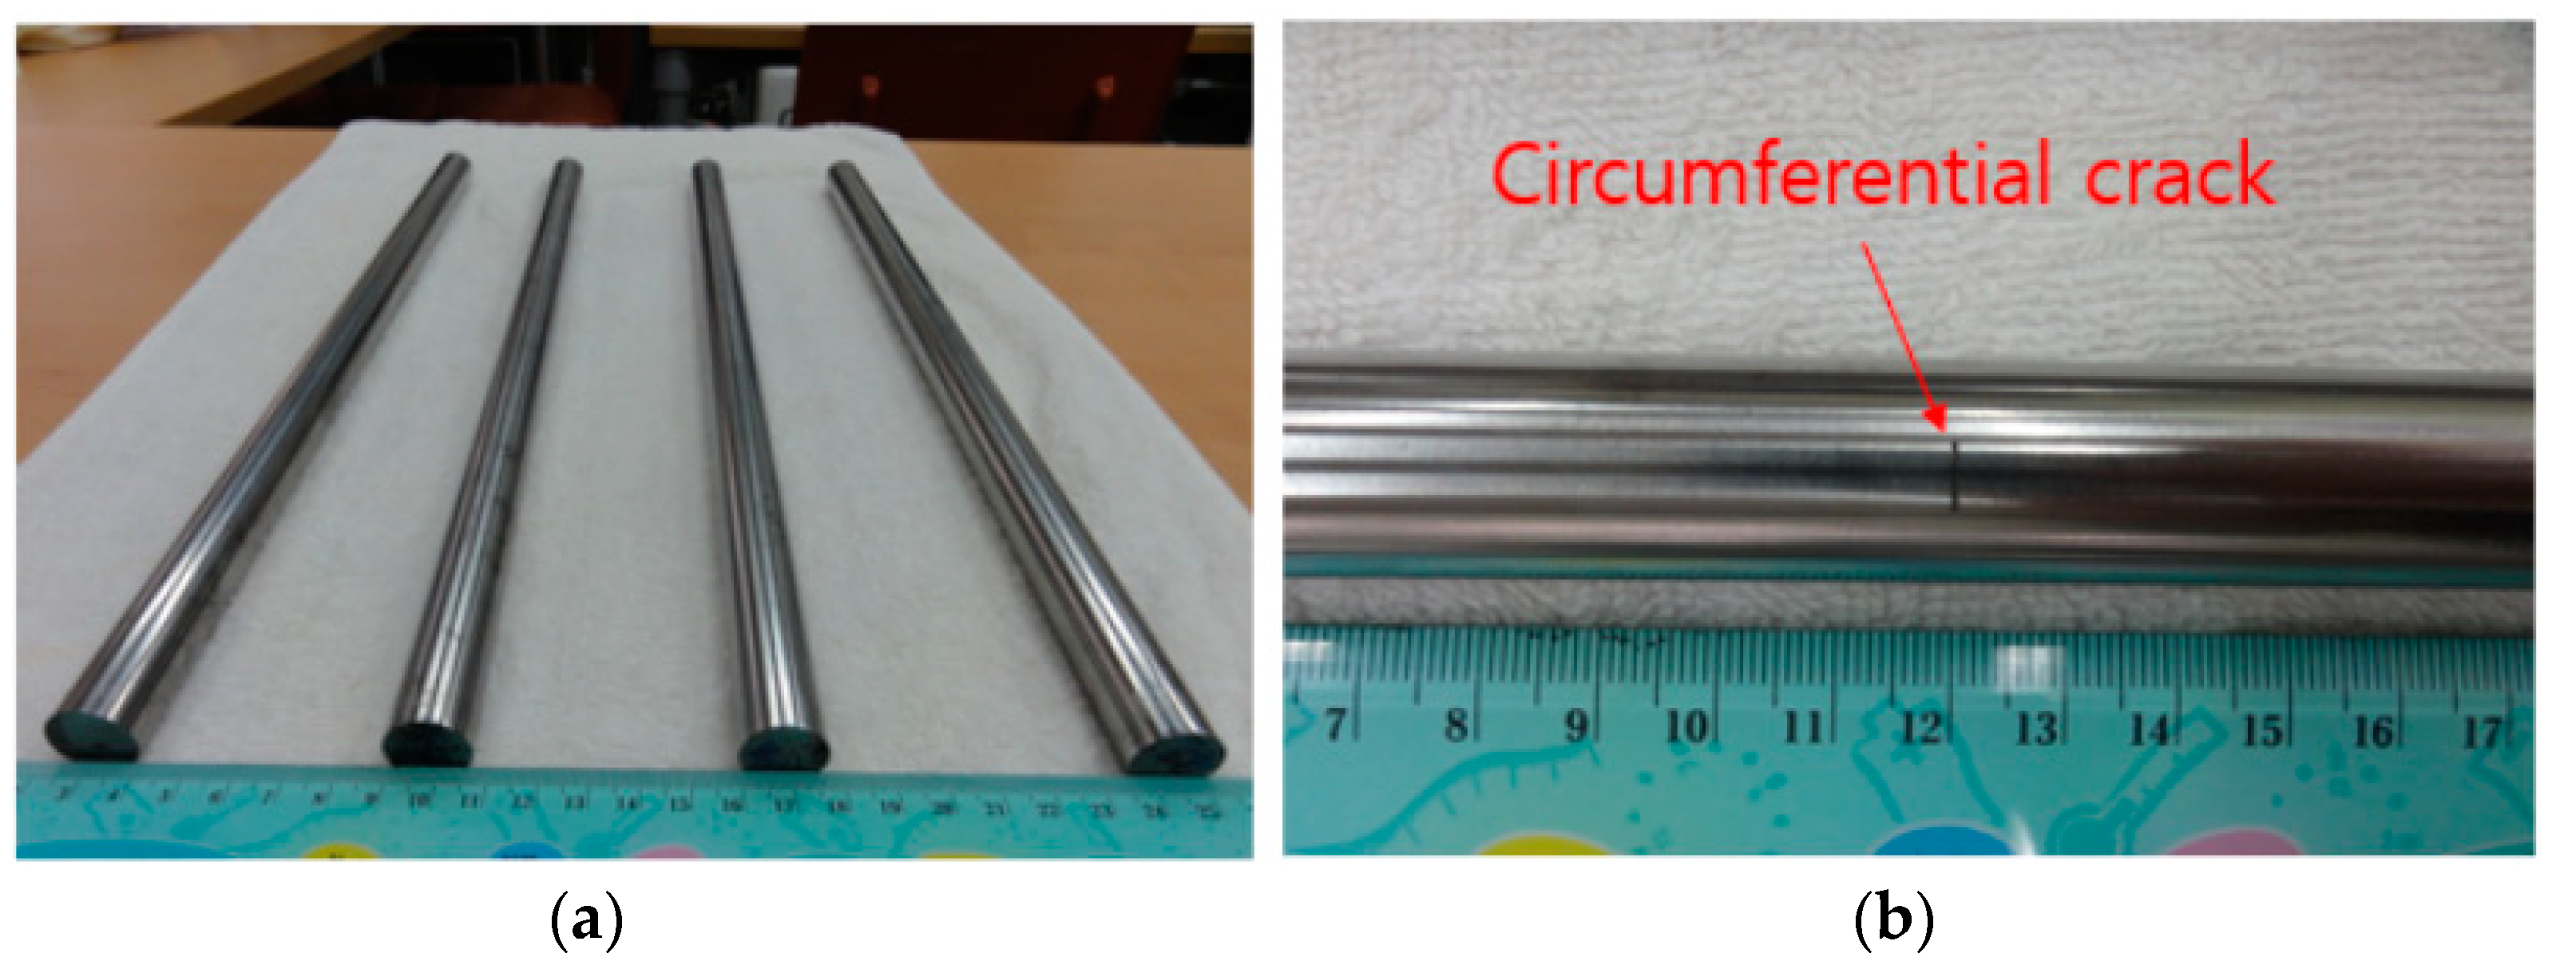
3. Experiment System and Measurement
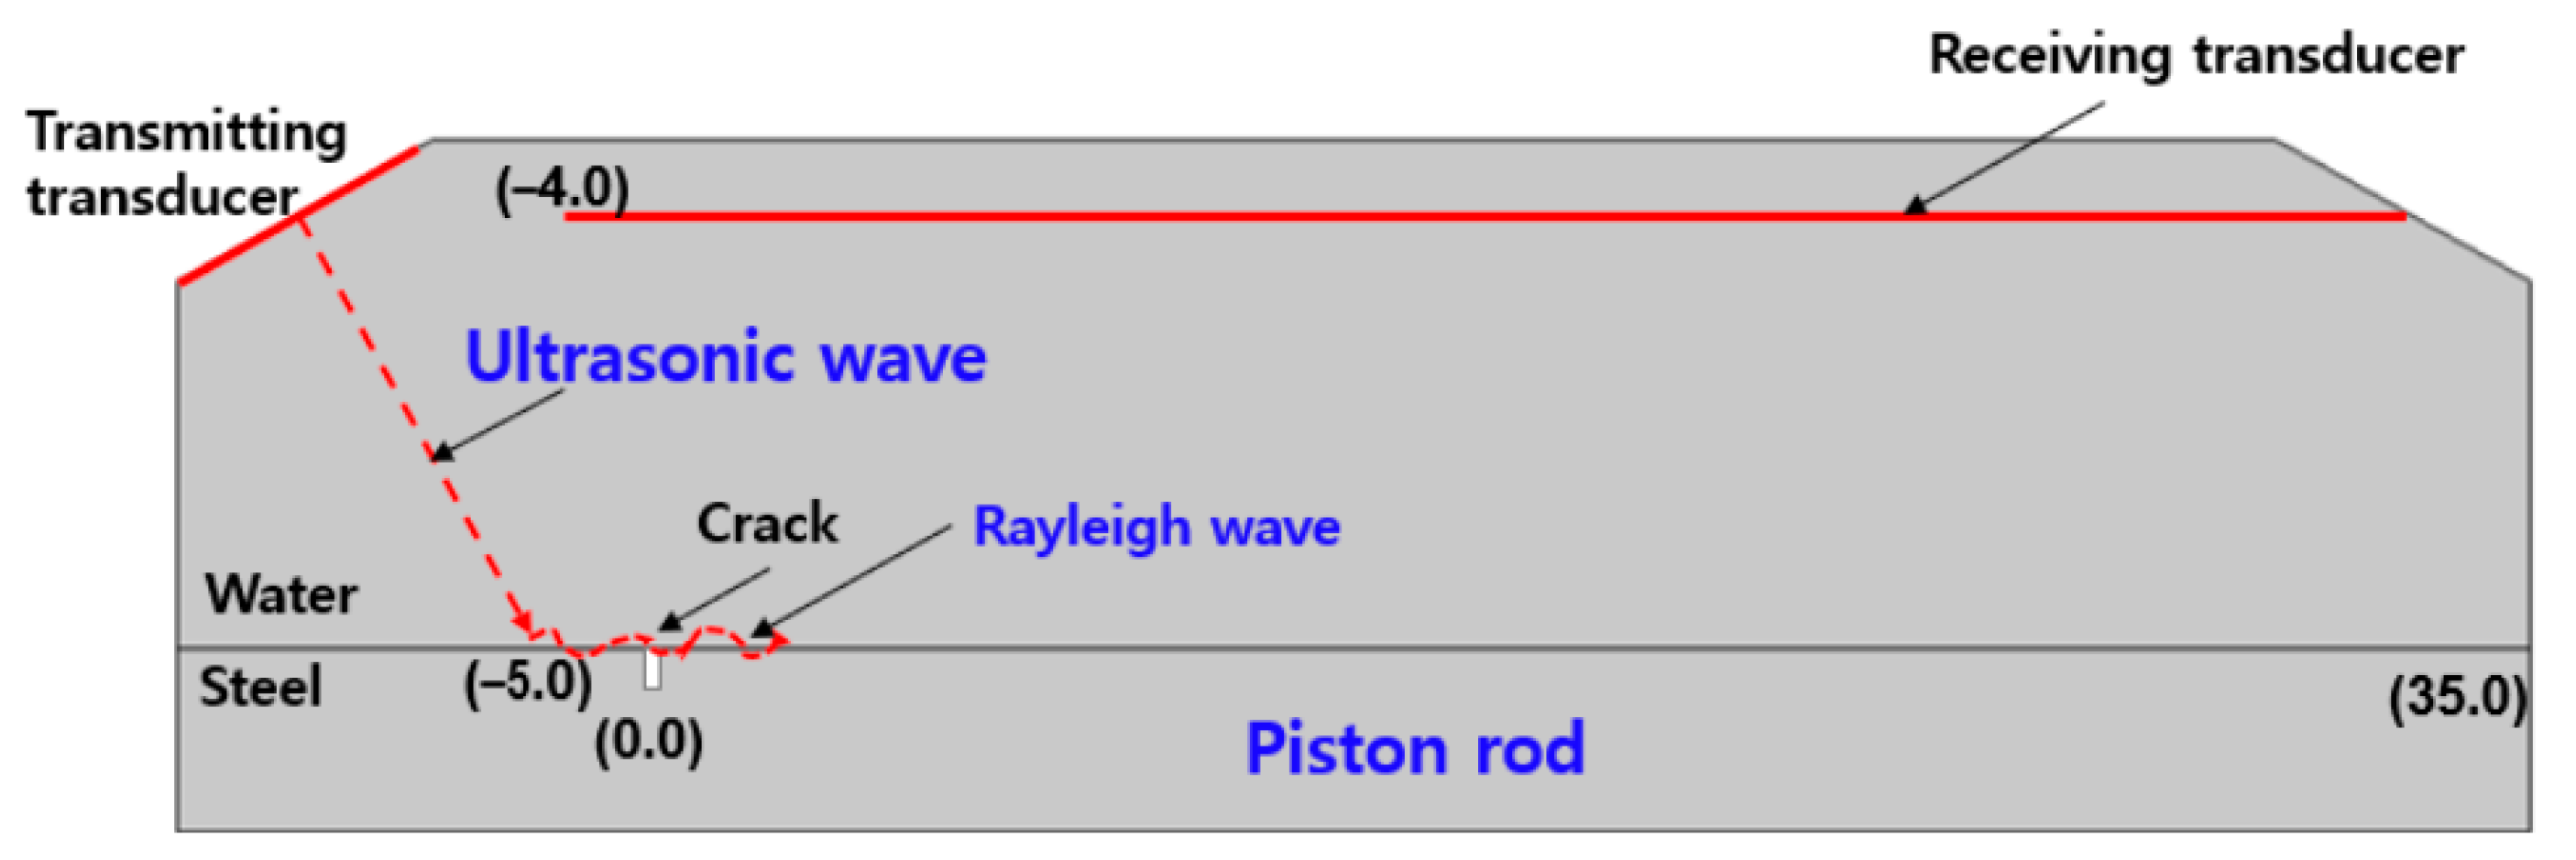
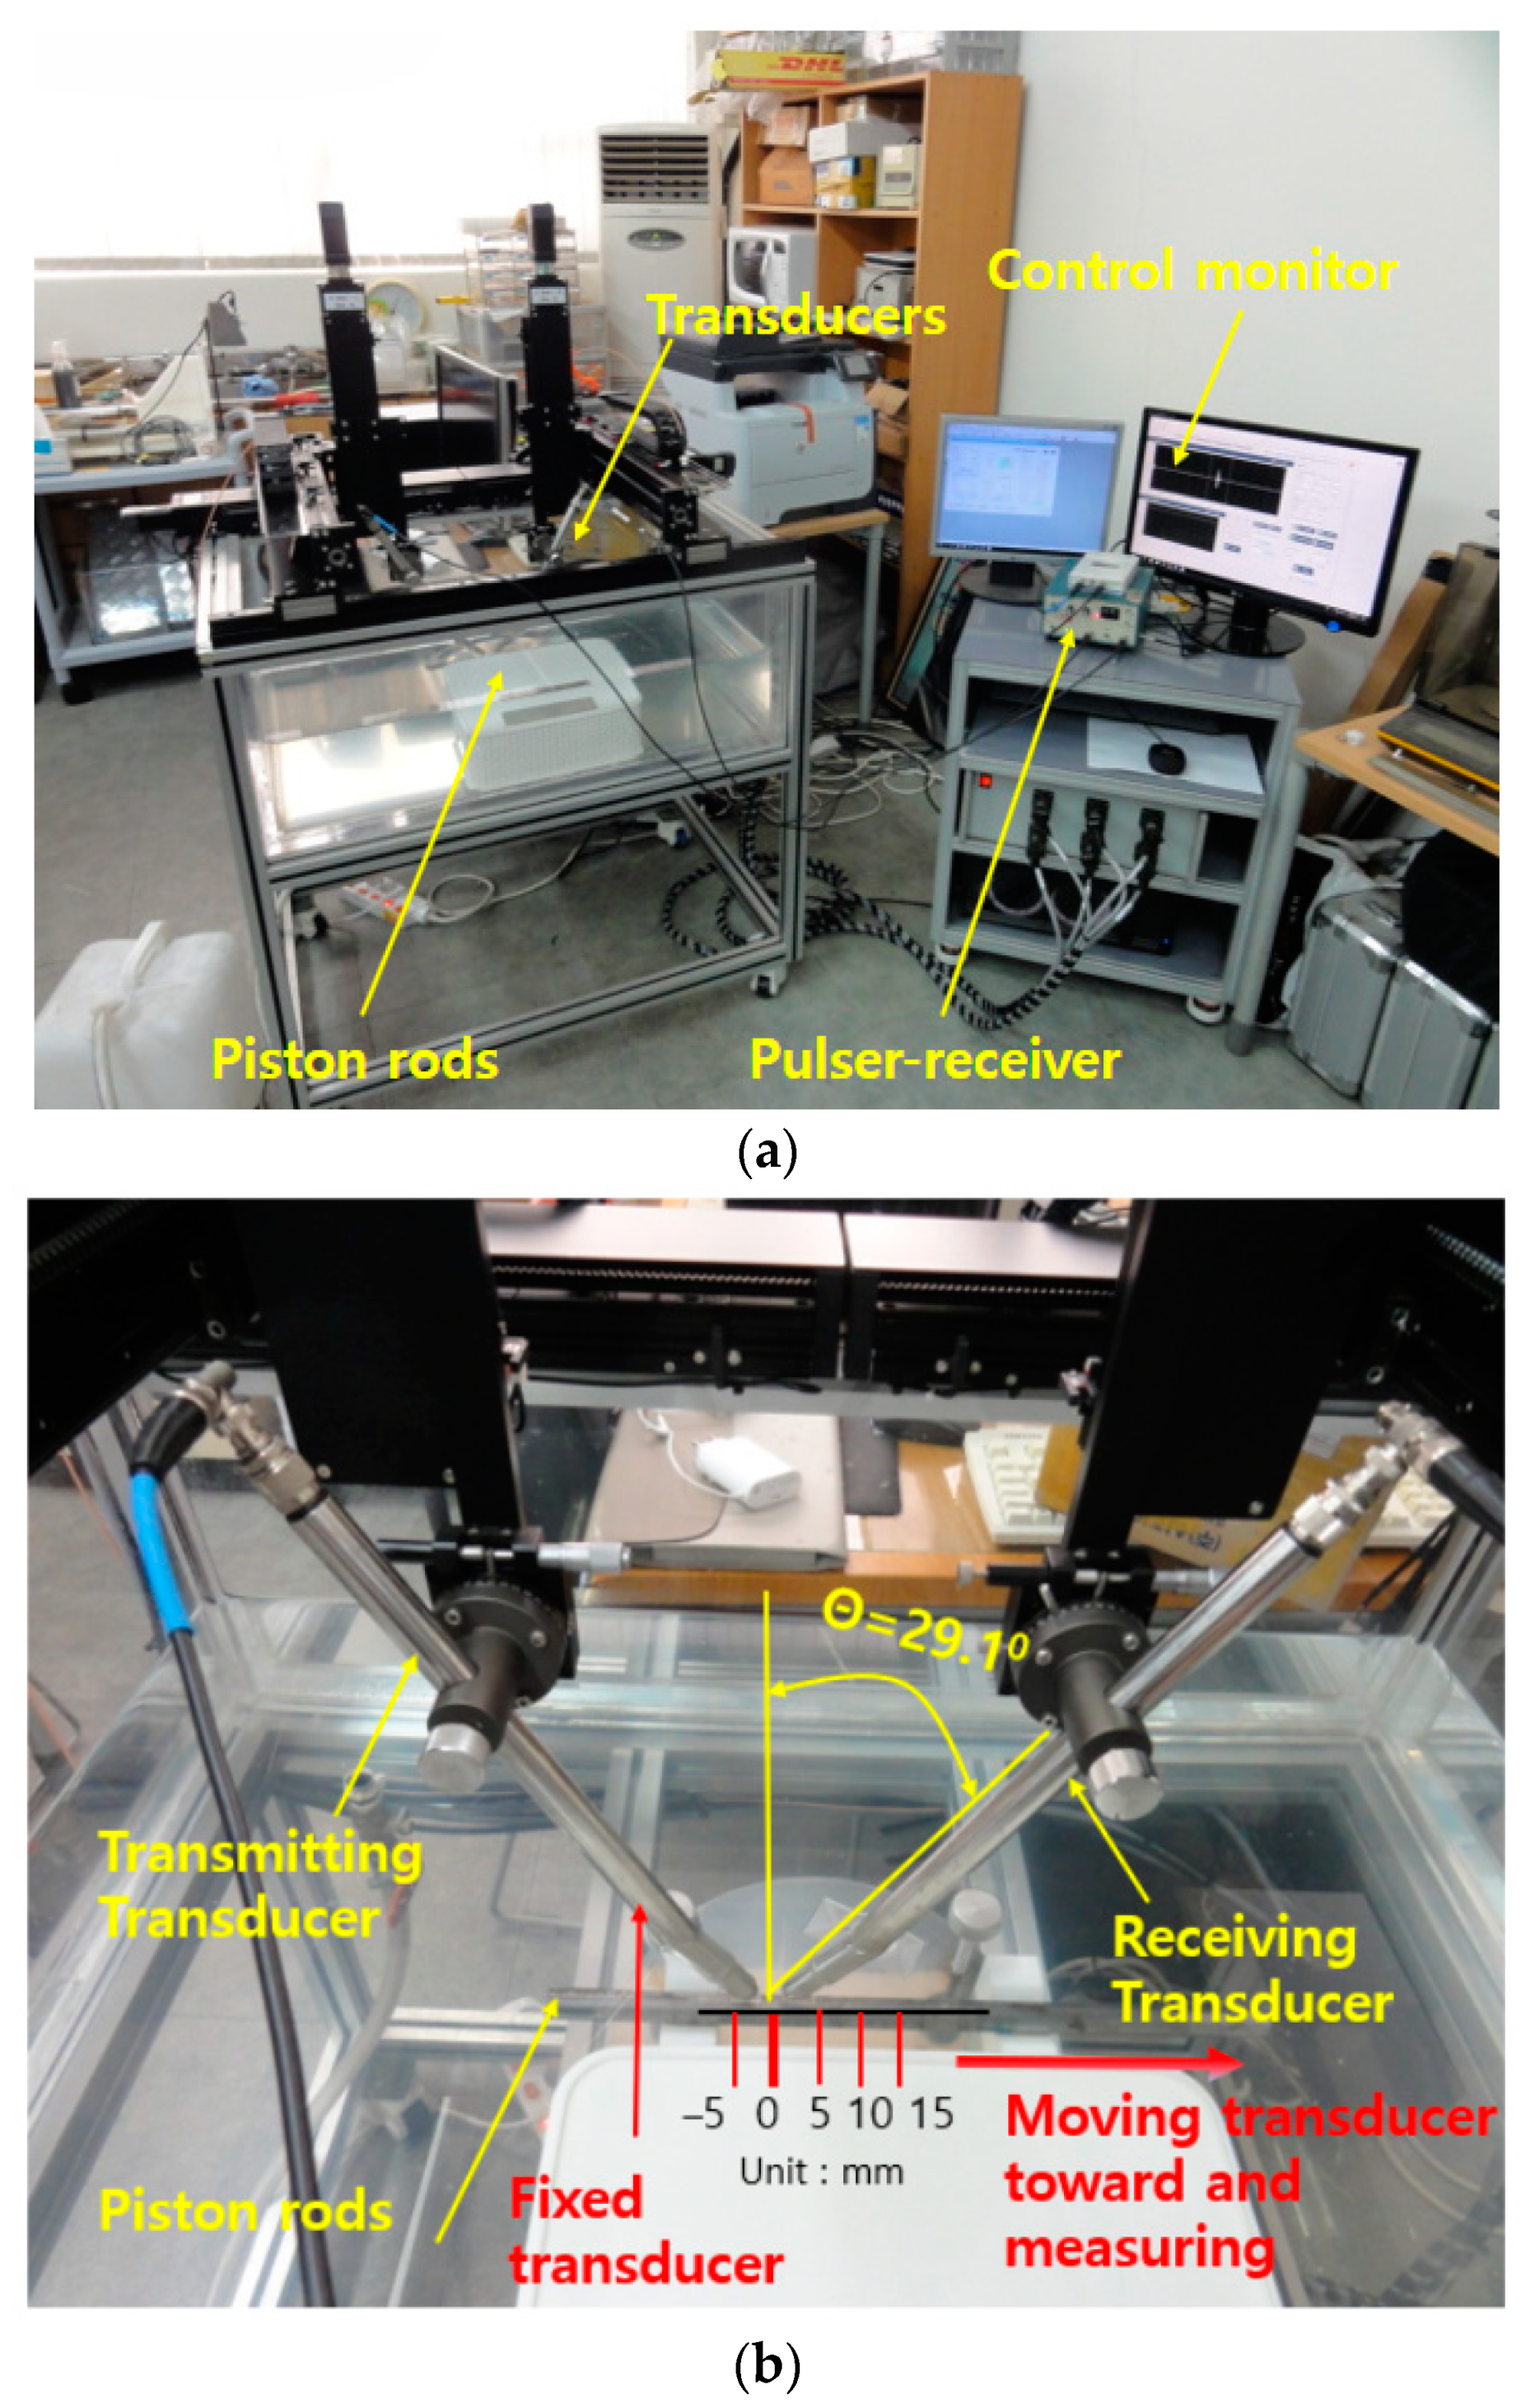
3.1. Measurement System
3.2. Measurement of Ultrasonic Testing
4. Discussion and Results
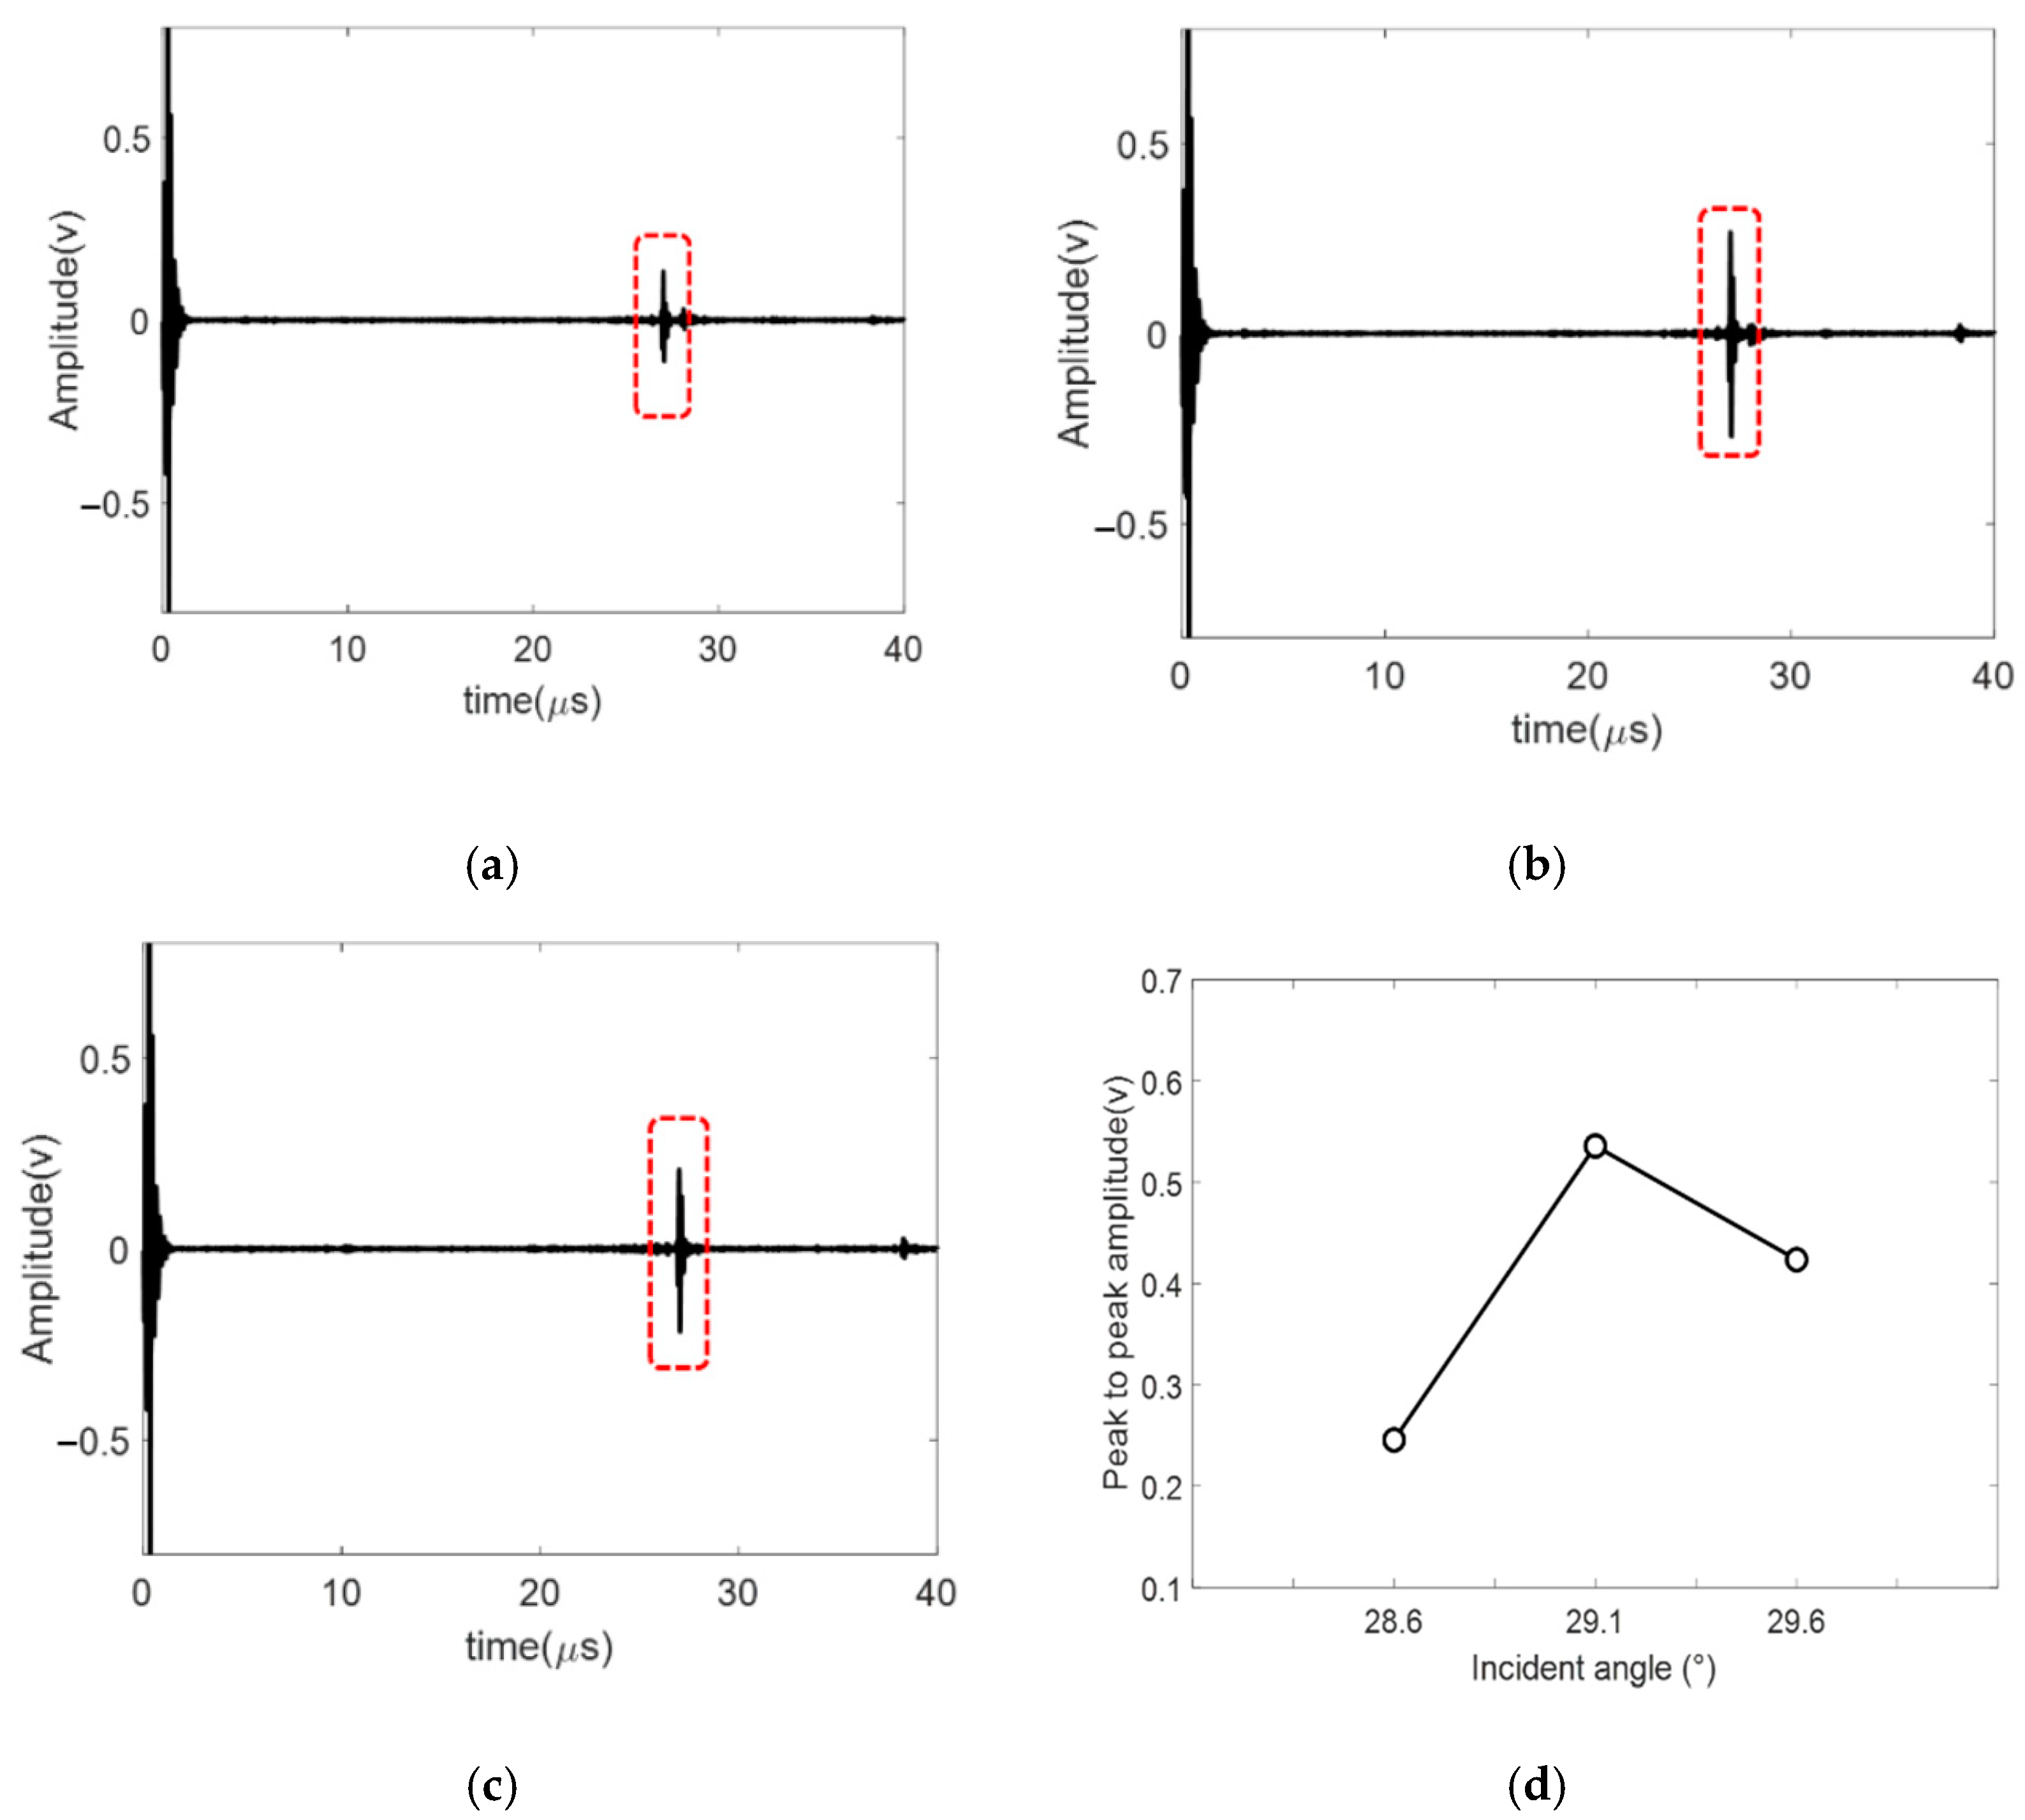
4.1. Optimization Measurement Technique of Rayleigh Angles
4.2. Evaluation of Beam Profiles on the Defect Types
5. Conclusions
- (1)
- To evaluate ultrasonic beam behavior in defects on piston rods, the Rayleigh angle was determined using the optimal peak-to-peak amplitude based on the pulse-echo technique after machining the defects on the surfaces of the piston rods.
- (2)
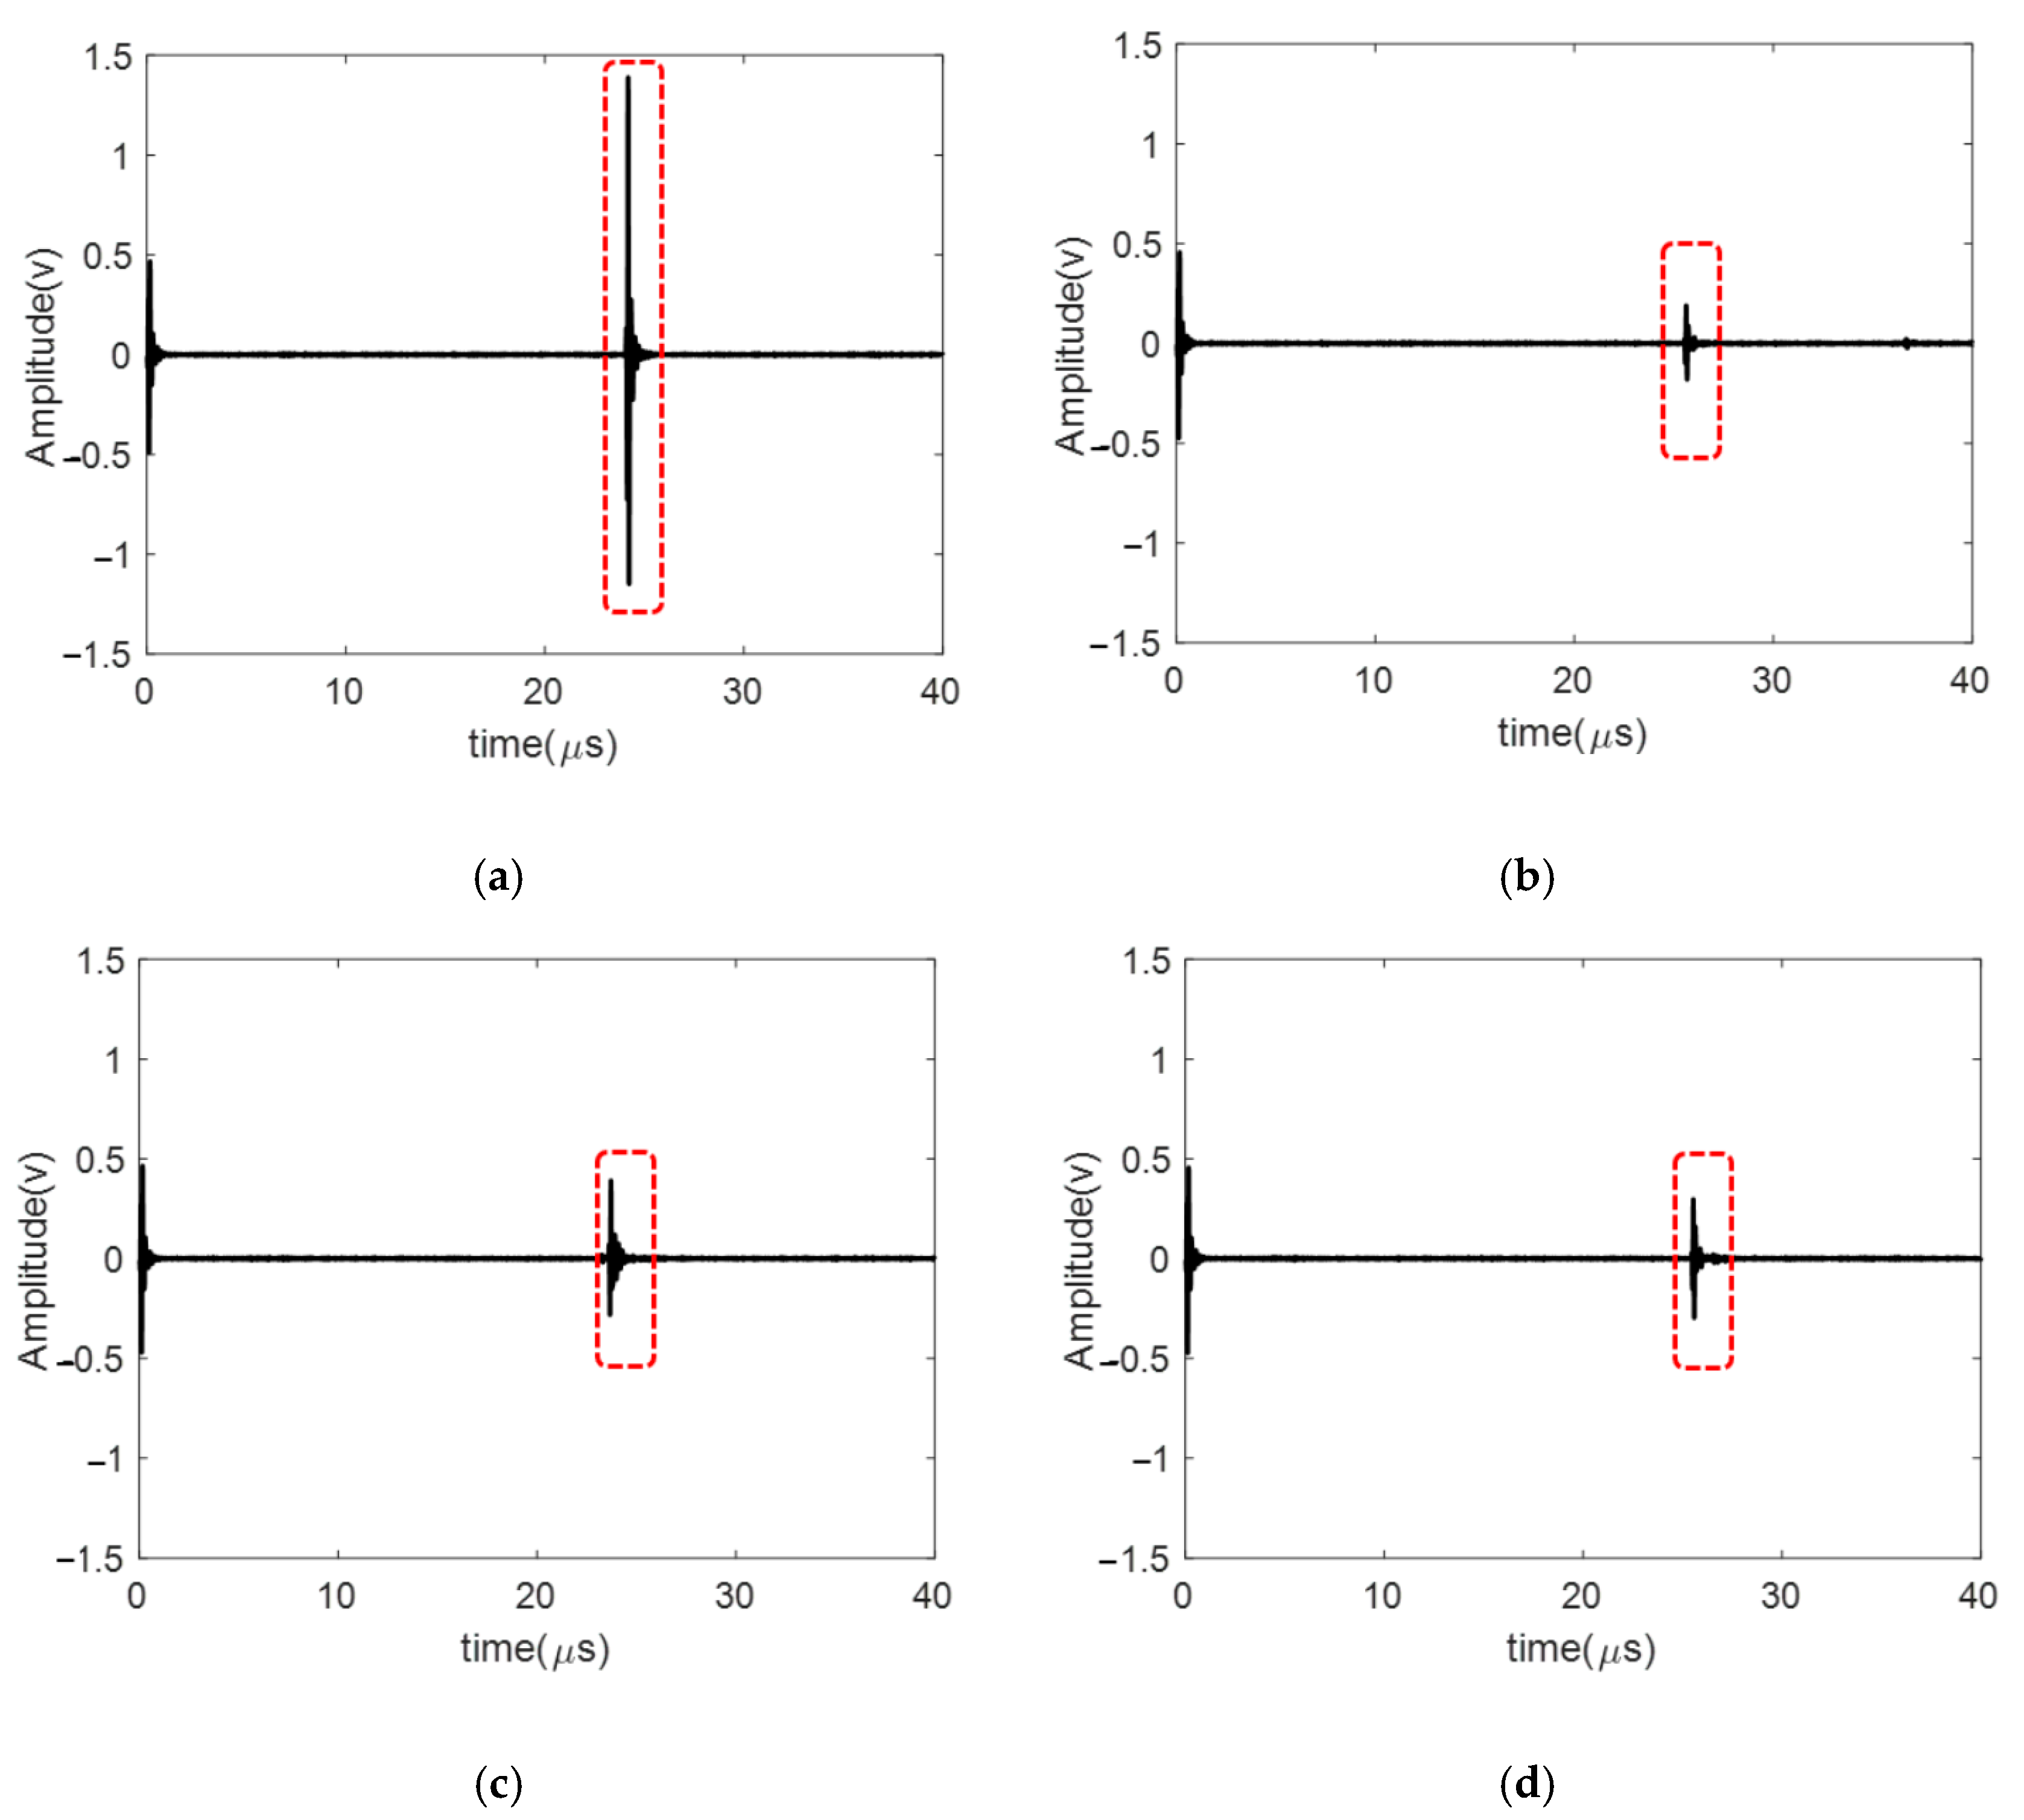
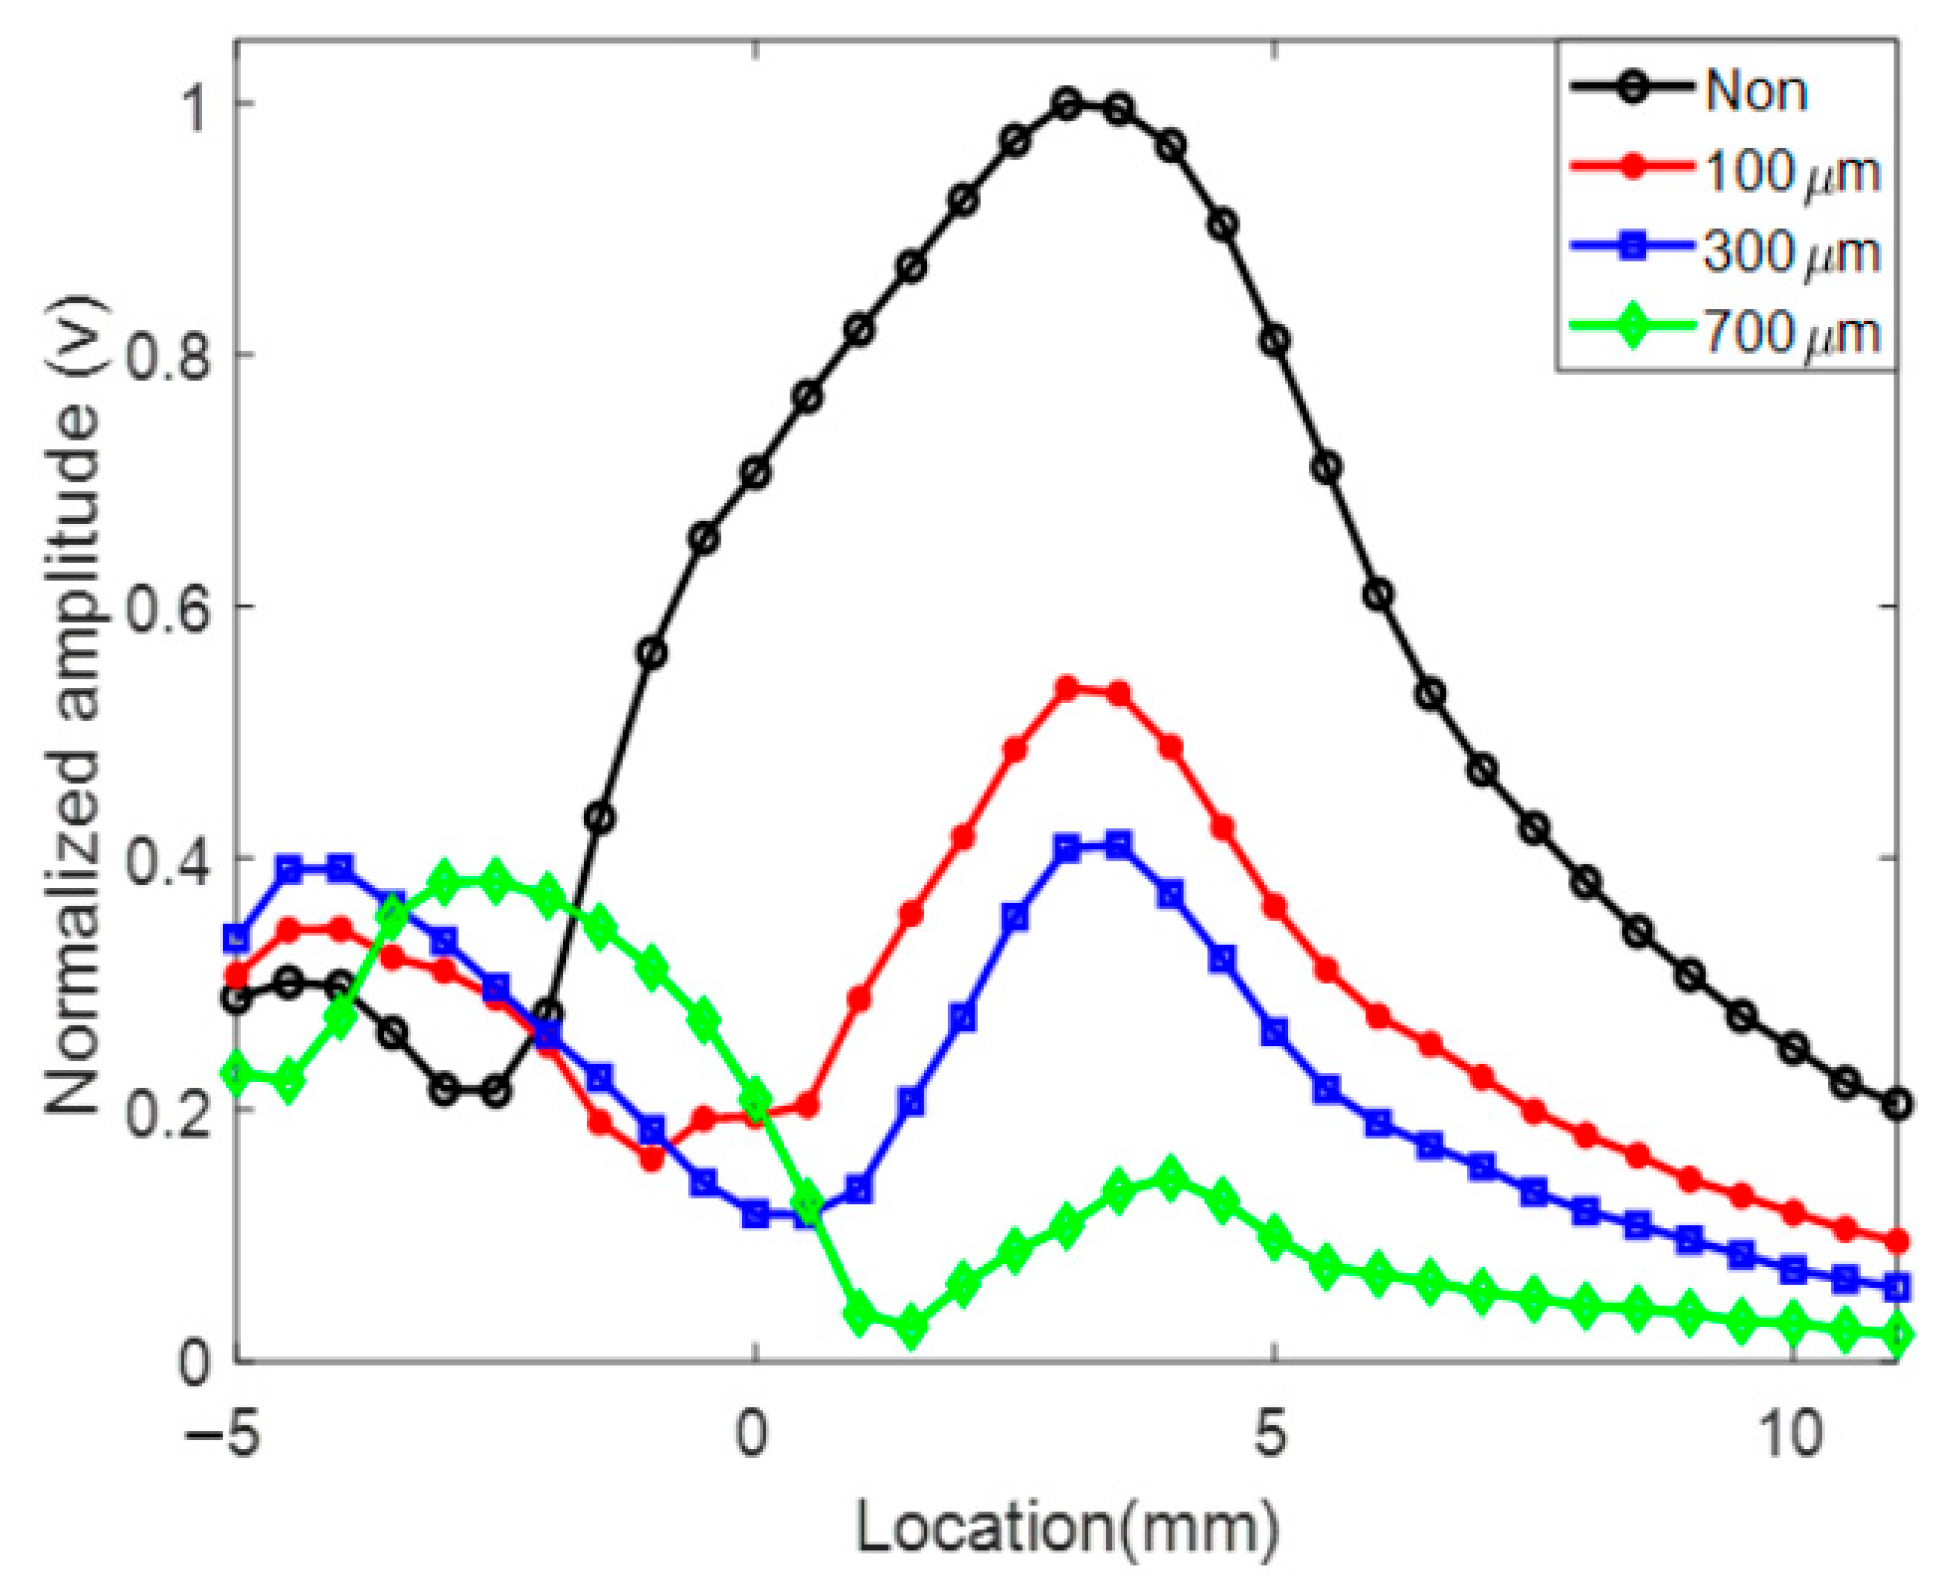
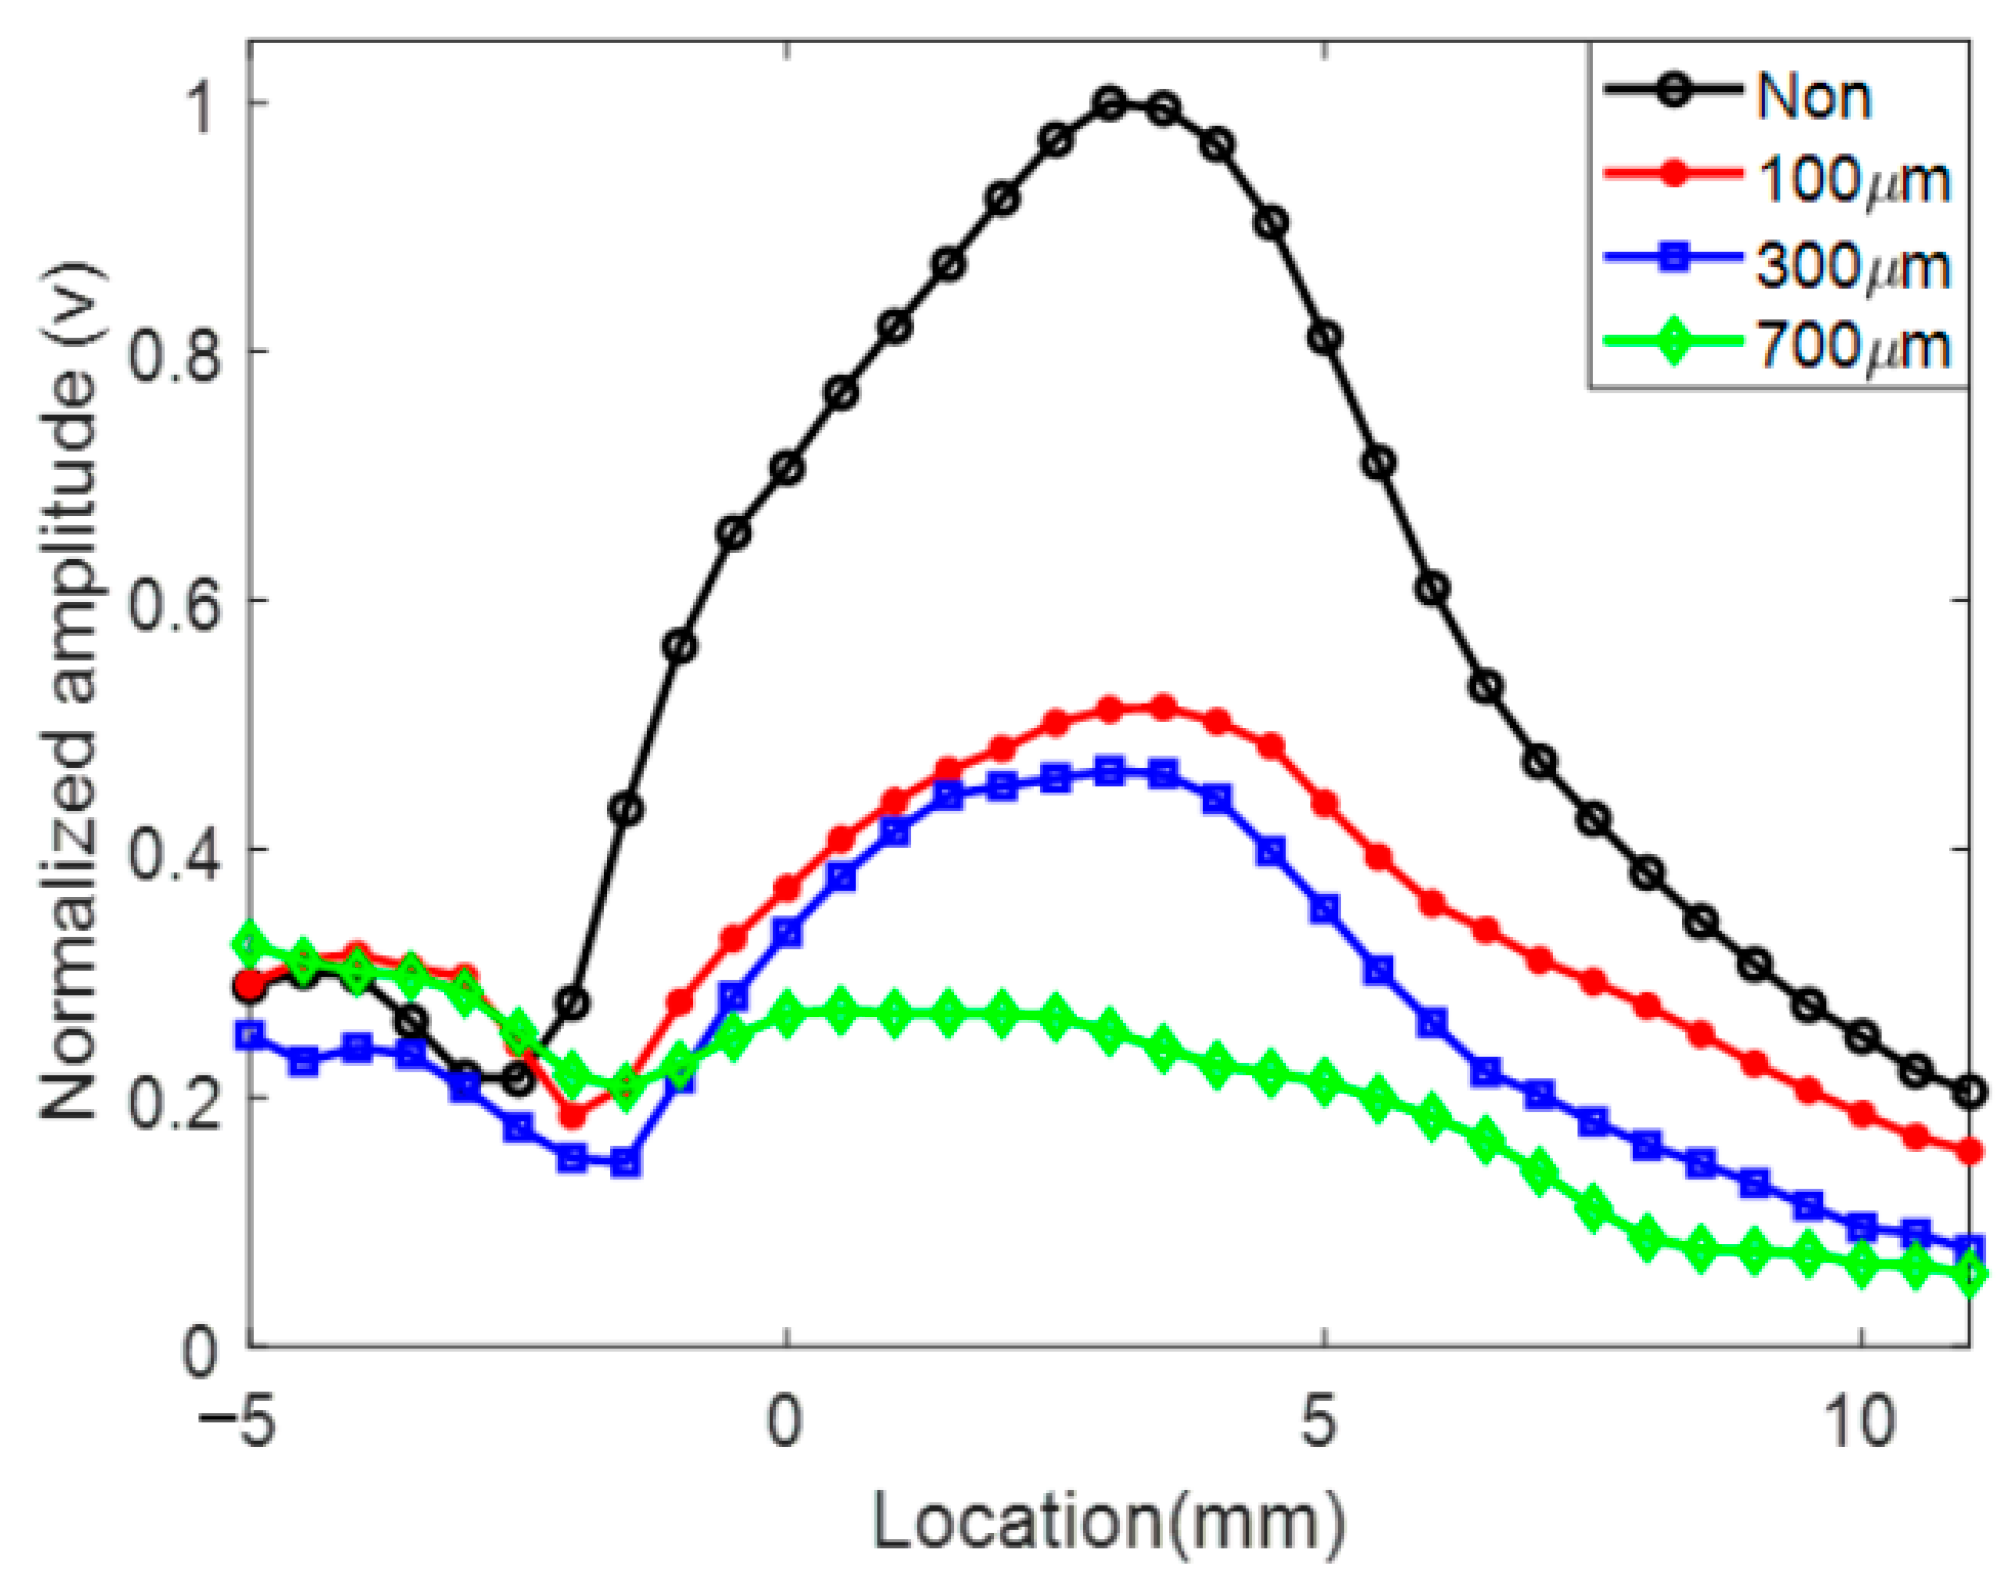
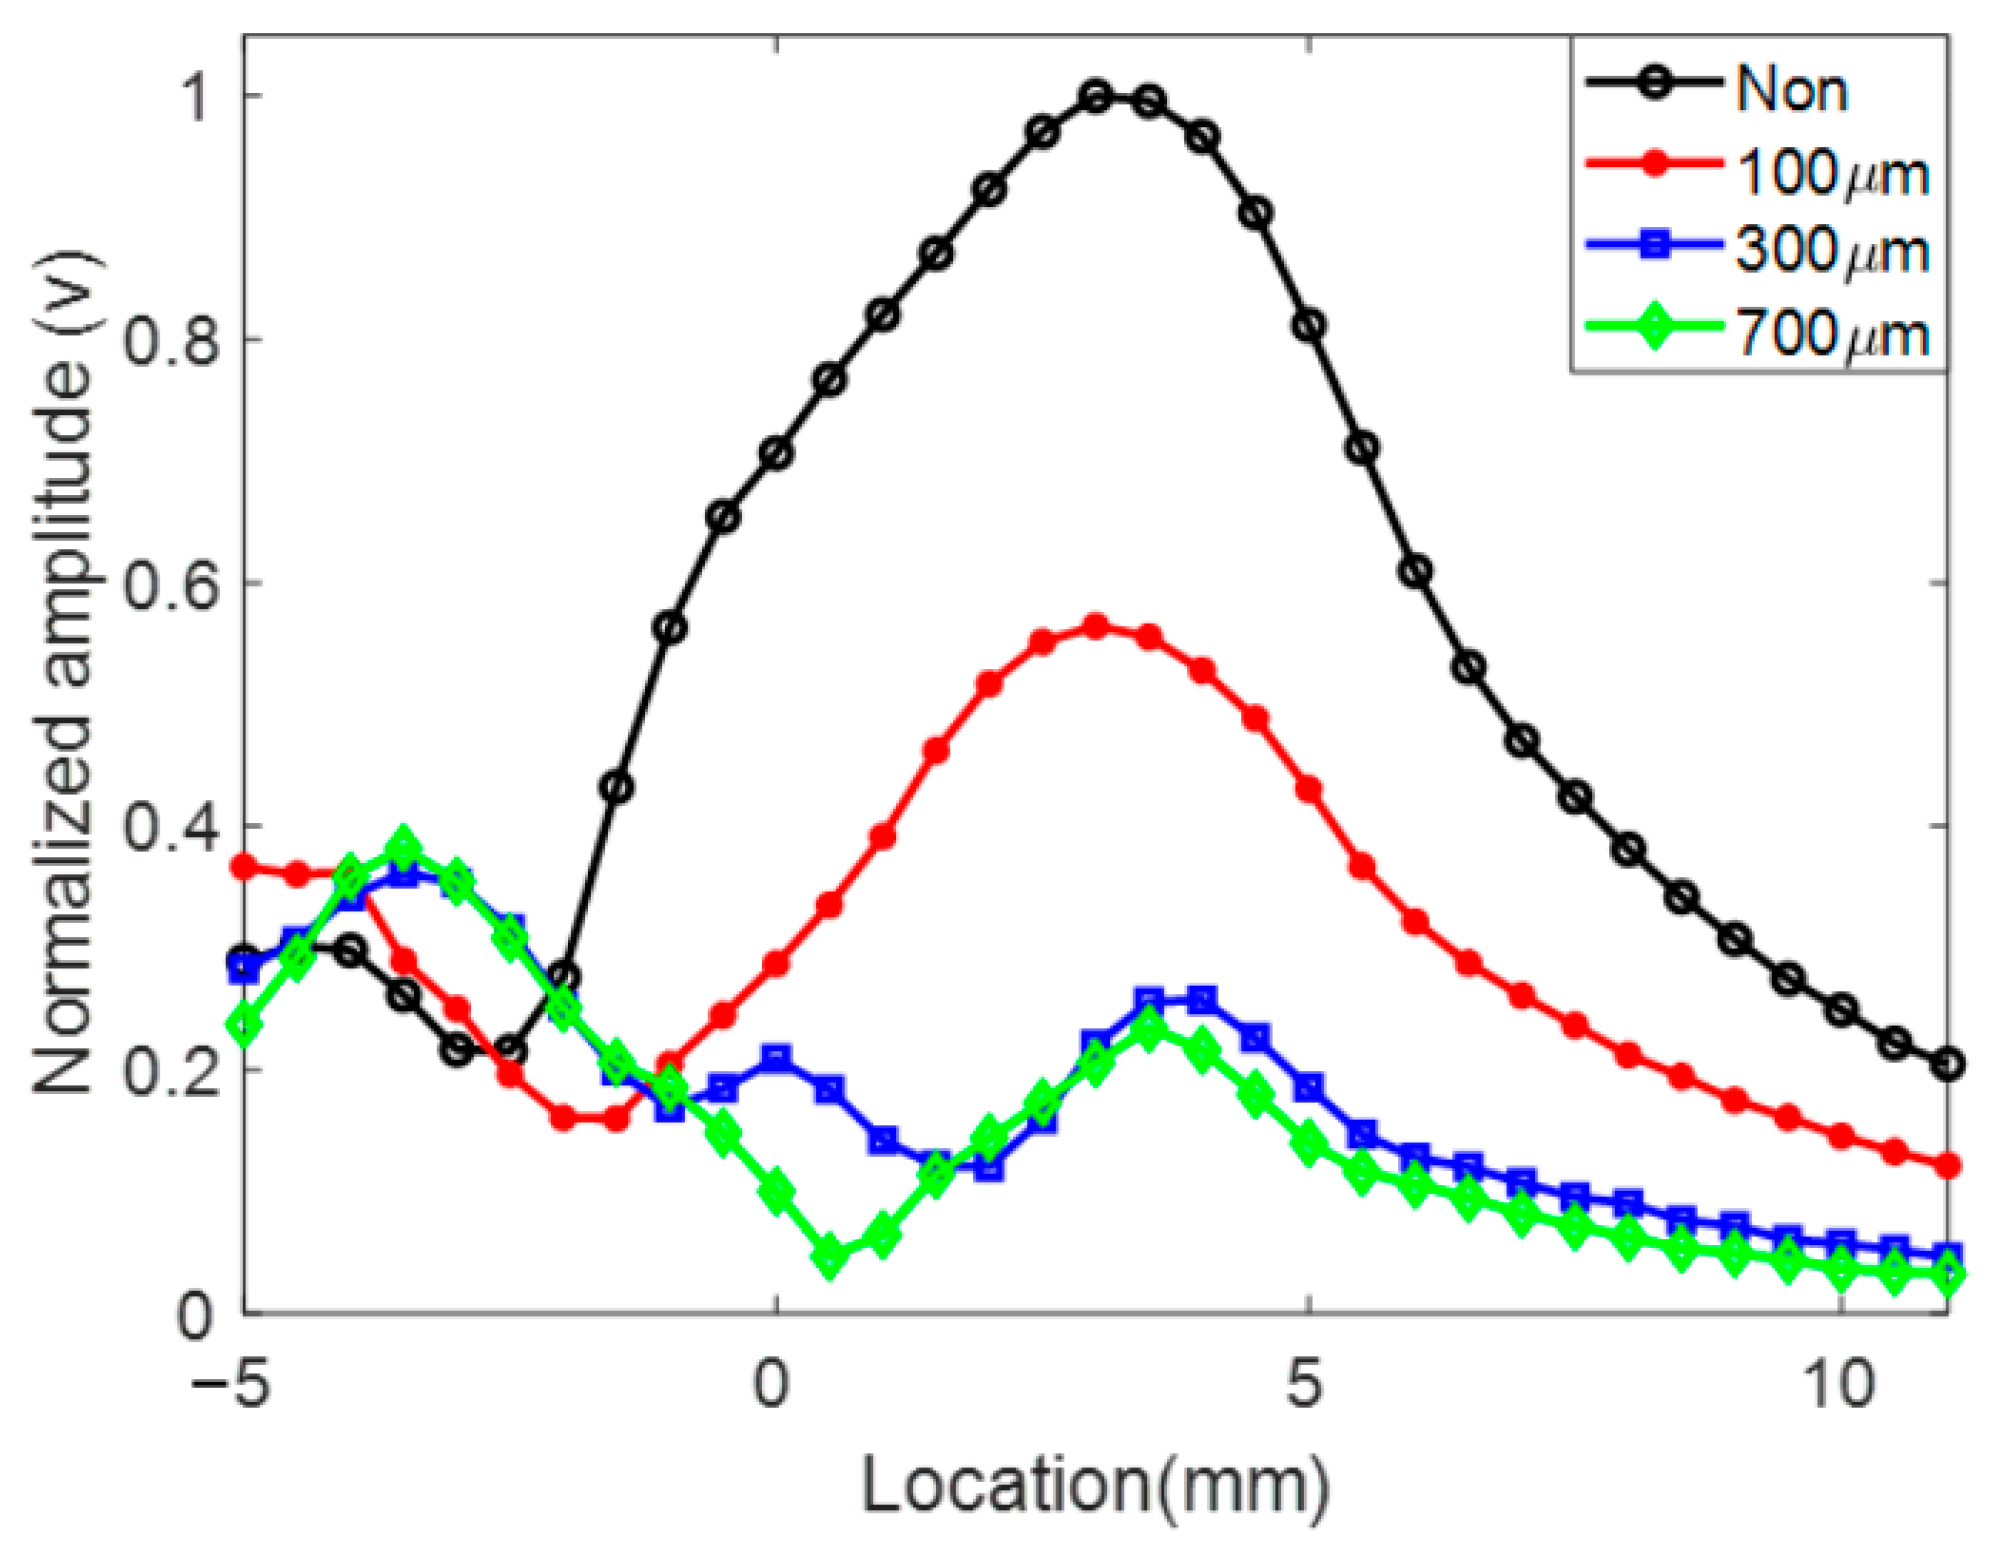
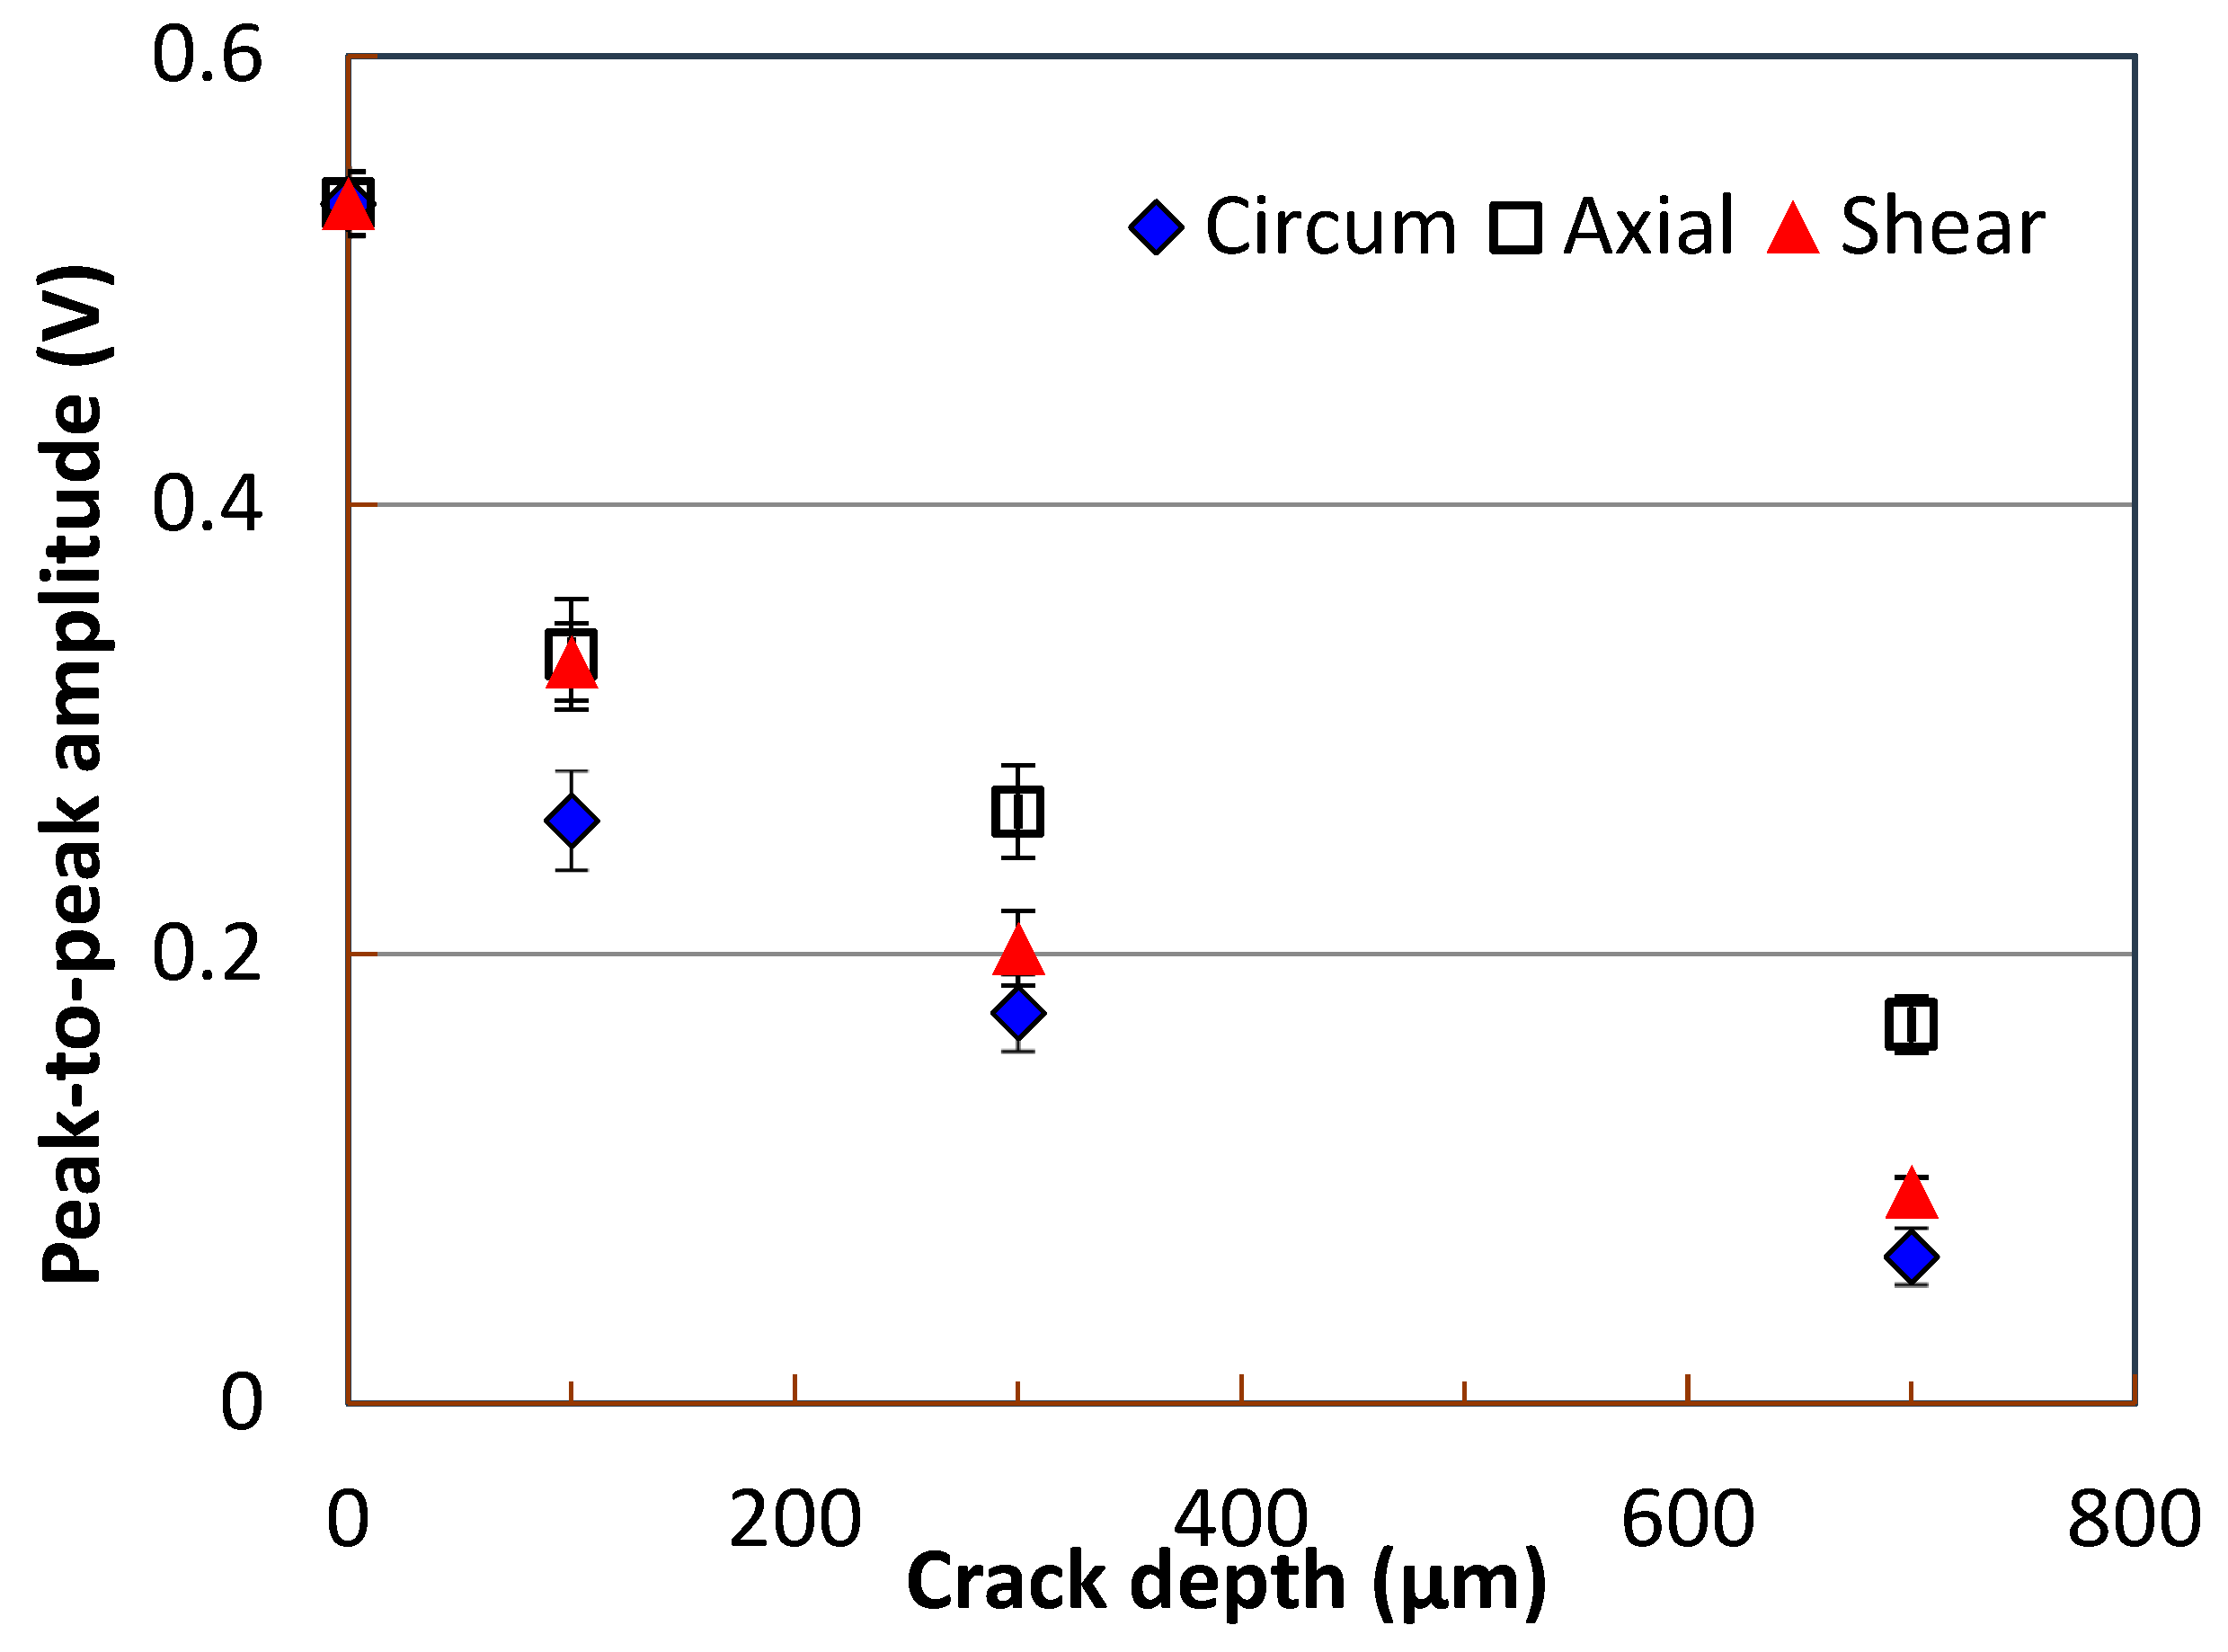
- Regardless of the types of micro-defects on the surfaces, the peak-to-peak amplitude of the transmitted ultrasonic waves decreased as the size of the defect increased. The received ultrasonic signals decreased linearly as the distance increased between the transmitting and receiving transducers. Accordingly, the optimal inspection condition could be suggested to be in the range of 5–10 mm, where ultrasonic signals with a high resolution were received.
- (3)
- When the surface defect occurred in the direction of the propagation of the Rayleigh waves, the amplitude of the Rayleigh waves was high. In contrast, the lowest number of ultrasonic waves was transmitted when the crack was perpendicular to the propagation of the Rayleigh waves. Although the defect detection resolution is proportional to the wavelength (λ) (usually λ/2) in ultrasonic inspection, a resolution of λ/3 was found despite the loss of Rayleigh waves on the curved surface as a result of using piston rod samples in this study.
- (4)
- Additional studies are required in the future to analyze the effects of different defect types and heat treatment characteristics using defects with more diverse depths in order to improve the reliability of piston rods in automobiles.
Author Contributions
Funding
Institutional Review Board Statement
Informed Consent Statement
Data Availability Statement
Conflicts of Interest
References
- Im, K.-H.; Lee, H.-H.; Kim, S.-K.; Jung, J.-A.; Cho, Y.-T.; Woo, Y.-D.; Zhang, G.-L.; Kwakg, Y.-H.; Yang, I.-Y. Development of automatic ultrasonic system for NDE characterization on the heat treatment in piston rods for a use of shock absorbers. J. Korean Soc. Mach. Tool Eng. 2019, 28, 238–245. [Google Scholar]
- Hsu, D.K.; Thompson, D.O.; Thompson, R.B. Evaluation of porosity in aluminum alloy castings by single-sided access ultrasonic backscattering. Rev. Prog. QNDE 1986, 5, 1633–1642. [Google Scholar]
- Im, S.-J.; Jeon, J.-Y.; Park, G.; Kang, T.; Han, S.-W. Crack visualization using laser-scanning based guided ultrasonic and standing waves response image. J. Korean Soc. Nondestruct. Test. 2019, 39, 351–361. [Google Scholar] [CrossRef]
- Moon, S.; Kang, T.; Han, S.; Jeon, J.-Y.; Park, G. FEA-based guided wave mode optimization for damage detection on thin-walled structures. J. Korean Soc. Nondestruct. Test. 2018, 38, 299–307. [Google Scholar] [CrossRef]
- Lissenden, C.J.; Liu, Y.; Rose, J.L. Use of non-linear ultrasonic guided waves for early damage detection. Insight-Non-Destr. Test. Cond. Monit. 2015, 57, 206–211. [Google Scholar] [CrossRef]
- Ju, T.; Achenbach, J.D.; Jacobs, L.J.; Guimaraes, M.; Qu, J. Ultrasonic nondestructive evaluation of alkali–silica reaction damage inconcrete prism samples. Mater. Struct. Constr. 2016, 50, 60. [Google Scholar] [CrossRef]
- Ju, T.; Achenbach, J.D.; Jacobs, L.J.; Qu, J. One-way mixing of collinear waves in an adhesive layer. J. Acoust. Soc. Am. 2019, 145, 110–120. [Google Scholar] [CrossRef] [PubMed]
- Im, K.-H.; Baek, C.-G.; Jung, W.-S.; Hwang, Y.-H.; Kwon, S.-H.; Kim, H.-G.; Lee, H.-H.; Woo, Y.-D.; Jang, K.-L.; Jung, J.-A. Evaluation of ultrasonic characterization of hardness after heat treatment of piston rods for use of vehicles. J. Korean Soc. Manuf. Technol. Eng. 2014, 23, 48–55. [Google Scholar]
- Ju, T.; Findikoglu, A.T. Large area detection of microstructural defects with multi-mode ultrasonic signals. Appl. Sci. 2022, 12, 2082. [Google Scholar] [CrossRef]
- Ahn, Y.-S.; Gil, D.-S.; Park, S.-G. The study on eddy current characteristic for surface defect of gas turbine rotor material. J. Korean Soc. Power Syst. Eng. 2010, 14, 63–67. [Google Scholar]
- Yeom, Y.-T.; Kim, H.-J.; Song, S.-J.; Kang, S.-S.; Kwon, S.-D. Study on an ultrasonic method for detecting micro-defects by using the leaky Rayleigh wave. New Phys. Sae Mulii 2015, 65, 199–204. [Google Scholar] [CrossRef]
- Yeom, Y.-T.; Kim, H.-J.; Song, S.-J.; Kwon, S.-D. Study on a method for detecting of surface micro-cracks in a shaft by using the Rayleigh wave. New Phys. Sae Mulli 2017, 67, 1250–1256. [Google Scholar] [CrossRef]
- Yeom, Y.-T.; Kim, M.-S.; Kim, H.-J.; Song, S.J.; Lee, H.-Y.; Kwon, S.-D.; Kang, S.-S.; Sung, D.-Y. A study on depth sizing for surface cracks in KTX brake disc using Rayleigh wave. Adv. Mater. Sci. Eng. 2019, 2019, 6041709. [Google Scholar] [CrossRef]


Publisher’s Note: MDPI stays neutral with regard to jurisdictional claims in published maps and institutional affiliations. |
© 2022 by the authors. Licensee MDPI, Basel, Switzerland. This article is an open access article distributed under the terms and conditions of the Creative Commons Attribution (CC BY) license (https://creativecommons.org/licenses/by/4.0/).
Share and Cite
Im, K.-H.; Yeom, Y.-T.; Lee, H.-H.; Kim, S.-K.; Cho, Y.-T.; Woo, Y.-D.; Zhang, P.; Zhang, G.-L.; Kwon, S.-D. NDE Characterization of Surface Defects on Piston Rods in Shock Absorbers Using Rayleigh Waves. Appl. Sci. 2022, 12, 5986. https://doi.org/10.3390/app12125986
Im K-H, Yeom Y-T, Lee H-H, Kim S-K, Cho Y-T, Woo Y-D, Zhang P, Zhang G-L, Kwon S-D. NDE Characterization of Surface Defects on Piston Rods in Shock Absorbers Using Rayleigh Waves. Applied Sciences. 2022; 12(12):5986. https://doi.org/10.3390/app12125986
Chicago/Turabian StyleIm, Kwang-Hee, Yun-Taek Yeom, Hyung-Ho Lee, Sun-Kyu Kim, Young-Tae Cho, Yong-Deuck Woo, Peng Zhang, Gui-Lin Zhang, and Sung-Duk Kwon. 2022. "NDE Characterization of Surface Defects on Piston Rods in Shock Absorbers Using Rayleigh Waves" Applied Sciences 12, no. 12: 5986. https://doi.org/10.3390/app12125986
APA StyleIm, K.-H., Yeom, Y.-T., Lee, H.-H., Kim, S.-K., Cho, Y.-T., Woo, Y.-D., Zhang, P., Zhang, G.-L., & Kwon, S.-D. (2022). NDE Characterization of Surface Defects on Piston Rods in Shock Absorbers Using Rayleigh Waves. Applied Sciences, 12(12), 5986. https://doi.org/10.3390/app12125986