Article

Analysis of Healthcare Push and Pull Task via JACK: Predicted Joint Accuracy during Full-Body Simulation

1
Biomedical Engineering, Gannon University, Erie, PA 16541, USA
2
Biology, Gannon University, Erie, PA 16541, USA
*
Author to whom correspondence should be addressed.
Appl. Sci. 2022, 12(13), 6450; https://doi.org/10.3390/app12136450
Submission received: 18 April 2022 / Revised: 23 June 2022 / Accepted: 23 June 2022 / Published: 25 June 2022
(This article belongs to the Special Issue Movement Analysis for Health and Biometrics)

Abstract

:
The posture accuracy of full-body dynamic simulation has been successfully evaluated in JACK Siemens software via analyzing two common push and pull tasks. The difference in joint angles between the actual and predicted human movement directly results in the strength of force exposed on the lumbar spine. In this study, the individual factors, such as body height, body weight, trunk and hip flexion, shoulder movement, and muscle strength between genders, have shown a strong association with the adopted postures and exposed spinal forces during task performance. To provide robust ergonomics analysis, these individual variables should be adequately considered in software design for the long-term goal of injury prevention in diverse occupational workplaces.

1. Introduction

According to the US Bureau of Labor Statistics, around 2.7 million injuries and diseases occurred at work in 2020 [1]. NIH’s National Institute of Neurological Disorders and Stroke (NINDS) recently published a report stating that [2] low back pain (LBP) is considered one of the most common leading causes of work restrictions because of injuries. About 20% of people affected by LBP present persistent symptoms for up to one year. Adults of working age are thought to be the most vulnerable to low back pain and lose an estimated 149 million days of work worldwide as the leading cause of disability [3]. A variety of factors can cause or exacerbate low back pain and injuries, including physical work, bio-mechanically stressful postures, and direct trauma to the lower back, specifically when it comes to work requiring a high frequency of lifting and pushing objects around [4]. The best way to minimize injuries and discomfort is to preclude them from happening by implementing prevention measures. This can be done by obtaining the firsthand experience of workers, proceeded by hazard identification and assessment, hazard prevention and control, education and training, and program evaluation toward constant improvement [5,6].
Today, digital human modelling (DHM) technology is becoming increasingly popular in workplace design to prevent musculoskeletal disorders (MSDs). DHM has been proven to be a useful tool for assessing work assignments and determining design options without the need for physical mock-ups [7]. A few popular commercially available DHM software packages are JACK (Siemens software, Plano, TX, USA), RAMSIS (Human Solutions, Kaiserslautern, Germany), DELMIA (Dassault Systèmes, Paris, France), SANTOS (SantosHuman Inc., Coralville, IA, USA), and SAMMIE (SAMMIE CAD Limited, Loughborough, UK). These DHM technologies provide human modelling and simulation tools to achieve better product design. As an ergonomics analysis tool, they consist of a virtual environment to simulate body postures and estimate the injury risk of work-related MSDs while performing common work duties suspected of inducing discomfort assessments. Simulating the work process helps end-users redesign workstations and their surroundings with the goal of lowering potential dangers and eliminating awkward movements [8].
Virtual ergonomic assessments can drive major engineering decisions. To provide robust ergonomics analysis, the predicted DHM postures in simulation must be precise to mimic real-world settings [9]. However, there is a lack of studies focusing on evaluating predicted postures in simulation, particularly in human continuous/dynamic simulation. Three previous studies [9,10,11] demonstrated that a minor change in joint angles during DHM manipulation could result in a large difference in the forces exposed. Although three studies have assessed the accuracy of DHM postures predicted by using JACK [12,13] and RAMSIS [14] by comparing the output of a simulation with the actual measured postures, conclusions were inconsistent. Discrepancies could be caused by the limitations of each procedure, such as the accuracy of anthropometric data used in calculations as described in [15] and the limited range of motion of the upper body joints and processing of static poses rather than continuous movements. Considering that a minor change in joint angles during DHM manipulation could result in a large difference in the spinal forces exposed for ergonomics analysis, it is essential to conduct research that focuses on this topic.
Considering that the force acting on the lumbar spine is directly affected by the relationship between multiple anatomical joints and the externally applied loads [9], it is critical to perform a full-body dynamic simulation for each task performed to fully evaluate the injury risk. The study in [9] has assessed the accuracy of DHM postures by simulating common walking and lifting tasks considering a full-body dynamic simulation. However, additional tasks must be analyzed to confirm that the results are still generalizable.
In the present study, we initially conducted laboratory measurements to determine the accuracy of predicted push and pull tasks in JACK Siemens software using the Task Simulation Builder (TSB) tool for full-body dynamic simulation. We compared actual human movement recorded via the Xsens MVN system (Xsens 3D Motion Tracking Technology, Enschede, The Netherlands). Additionally, we estimated the spinal forces and performed a sensitivity analysis, reiterating that accurate joint pose estimations are the key to providing robust ergonomics analysis. Our research noticed that the TSB tool is not accurate enough to represent the movement strategy for push and pull tasks. We suggest that software manufacturers need to continue efforts to improve their products by reconsidering the significance of independent variables, such as trunk and hip movement and the intrinsic difference in muscle strength between genders. Considering the implementation of such variables as a basis for the simulation could be conducive to the long-term goal of not recording human movement and still being able to predict the desired and accurate postures. This would eventually promote industrial productivity and eradicate workers’ injuries.

2. Materials and Methods

2.1. Participants and System Set-Up

This study has been approved by the Institutional Review Board at Gannon University. Participants were recruited through emails sent to those attending Gannon University. They may freely withdraw from this study at any time. The sample size was 17 after A Priori Power calculation, based on setting input parameters with a t-test, tails (1), effect size (0.6), an error (0.05), and power (0.8). Seventeen volunteers (nine females: body weight 73.4 ± 22.2 kg, body height 166.2 ± 8.4 cm; eight males: body weight 99.6 ± 27.8 kg, body height 180.6 ± 4.3 cm) participated in this study. None of the participants had any injury preventing them from performing normal daily work activities during the previous seven days. To capture actual full-body human movement, 17 Xsens MVN inertial sensors (Xsens 3D Motion Tracking Technology, 2000, Enschede, The Netherlands) were secured on each participant following Xsens instructions [16].

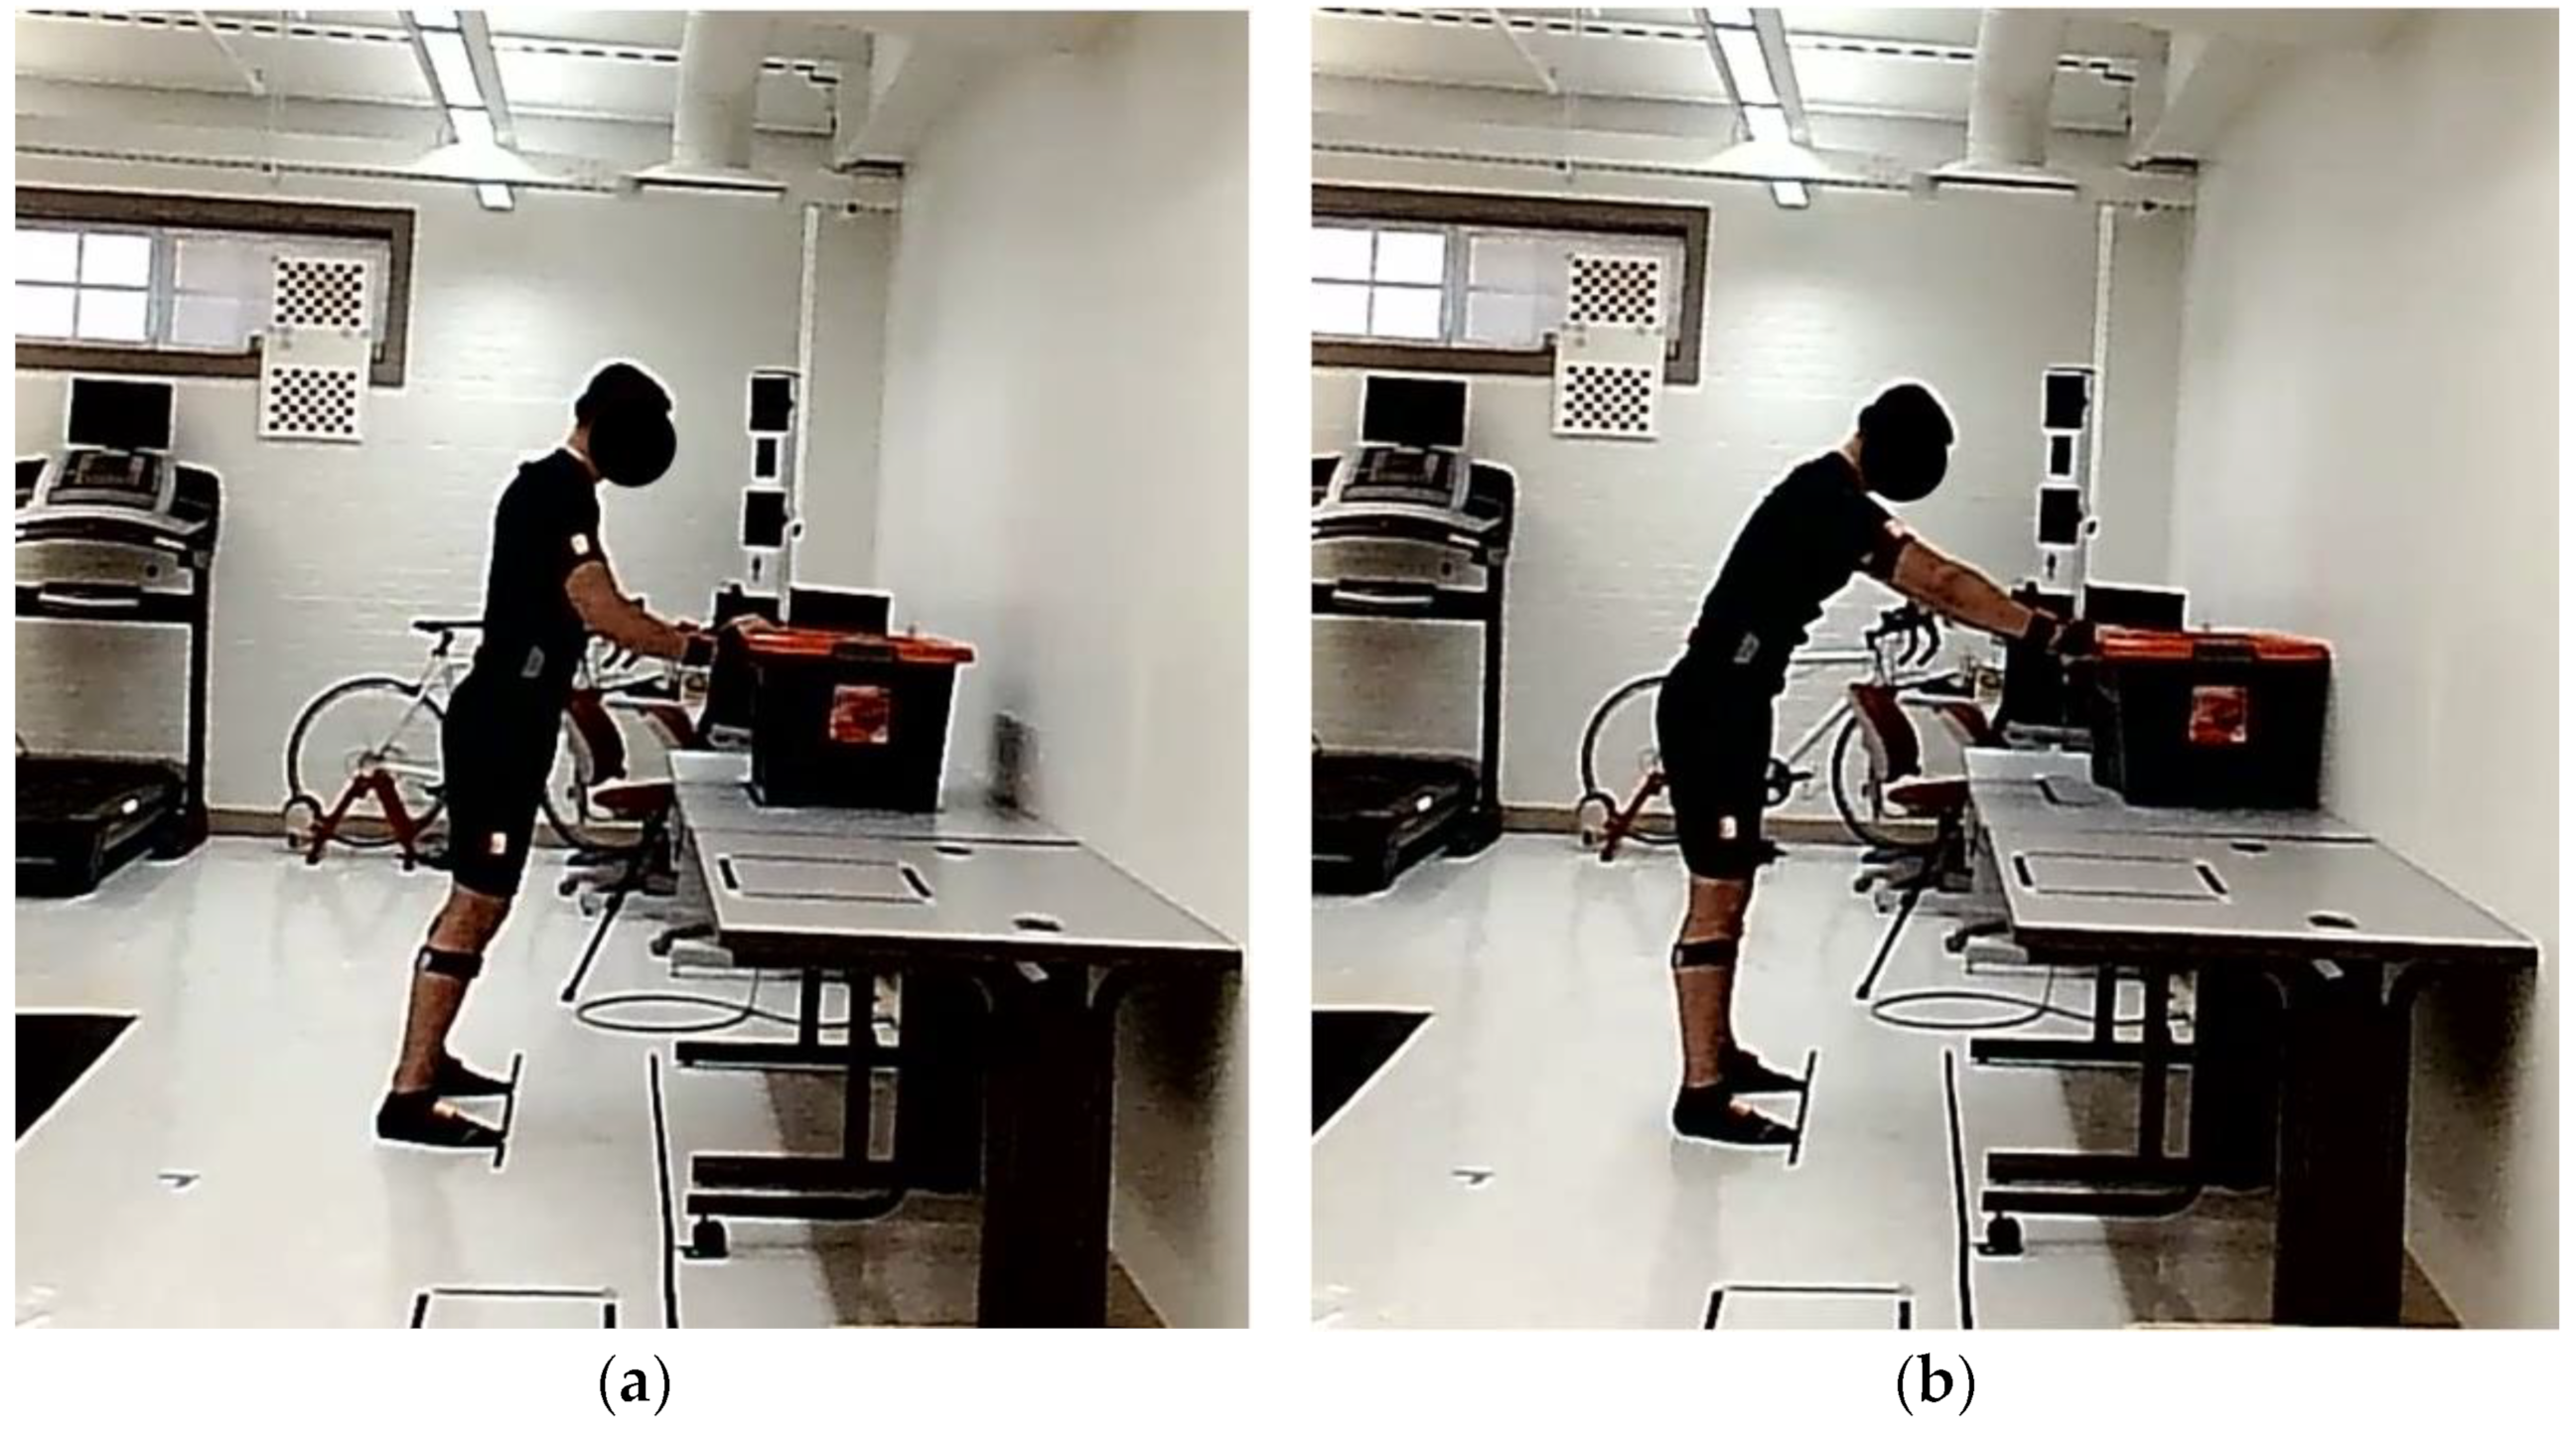
2.2. Operation Tasks

Two tasks were designed to represent common activities repeated by workers every day, which were pushing and pulling efforts, as shown in Figure 1. To avoid the effect of fatigue, each participant was required to perform each of the tasks five times. Since the slight deviation in DHM joint displacement could produce a significant difference in ergonomics outcomes, some basic positional constraints must be defined during the task execution. Following the safety requirements provided by [17], the restrictions on vertical lifting height should be less than 30 in, and the horizontal distance for placing a load should be in the range of 10 in and 25 in. Hence, in our experimental design, the table height is 75 cm (29.5 in), and the anterior-posterior distance is 50 cm (19.5 in). These positional constraints were confirmed by some participants (including females and males) during the design phase to ensure the set-up was designed appropriately for participants to complete the tasks. Additionally, the set-up was kept consistent for all participants to fully understand their performance when they are required to complete the same task in an industrial setting, where the aforementioned distances cannot be adapted to the size of each worker. The introduction of such constraints ensures that the deviation in results is mostly due to the limitations in the posture prediction algorithm of the software rather than the experimental design. The details are listed below.
Task 1: Participants needed to push a 40 kg load forward for a distance of 20 cm on a table. The table height was 75 cm. The distance between the starting position (Figure 1a) and end position (Figure 1b) was marked using tape without medial-lateral offset. The feet were placed parallel to each other and in two fixed locations. The distance on the floor between each foot in the medio/lateral direction was 45 cm, which is comparable to the average shoulder width [18]. The horizontal distance from the standing position to the initial pushing position was 50 cm in the anterior/posterior direction. Two grabbing spots were marked on the top corners of the box. These positional constraints could strongly reduce the bias between the experimental measurements and the simulation due to the experimental design.
Task 2: Participants needed to pull the aforementioned 40 kg load back from the end position to the original spot. All constraints were also applied in Task 2. Each participant was required to push and pull the load as one cycle and repeat the cycle five times.

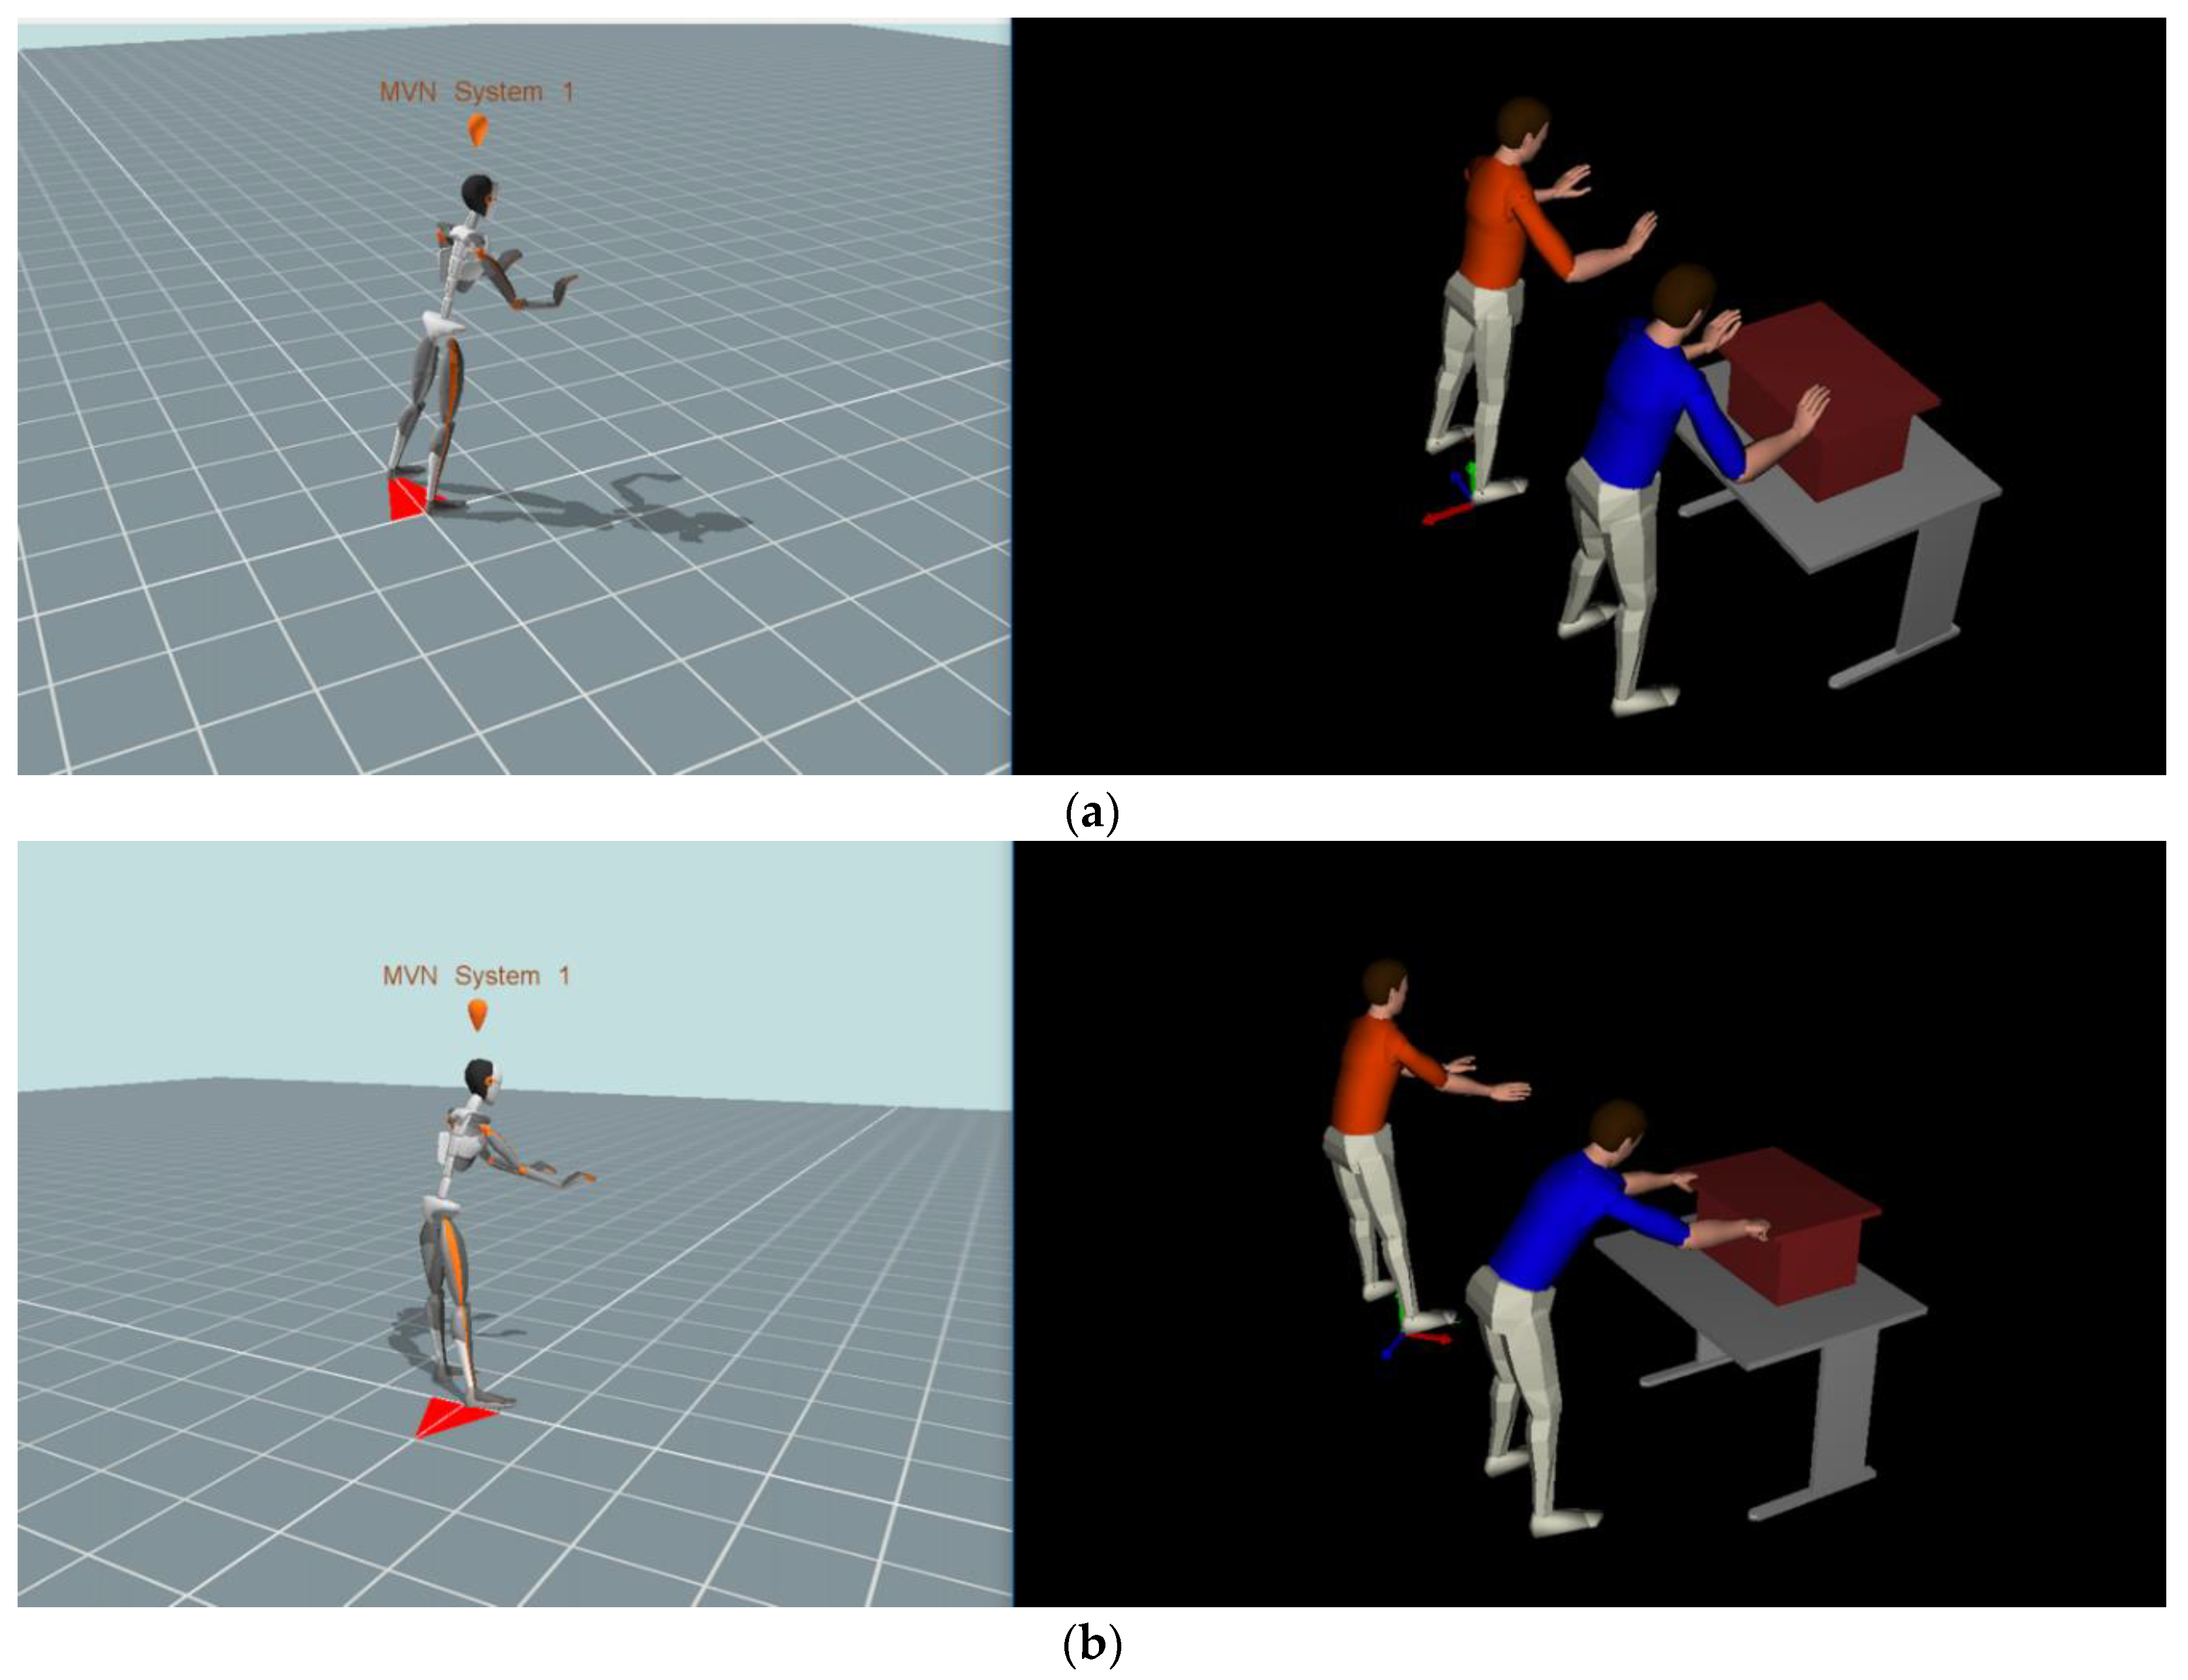
2.3. Data Collection

Each subject went through an orientation session, where the anthropometric data of each participant were collected by one trained experimenter. Each segment was measured based on the definition in [19]. We collected data on body weight, body height, shoulder width, arm span, hip width, and thigh, shank, foot, upper arm, lower arm, and hand length, respectively. For each participant, a customized DHM was created using the Xsens software (DHM_Xsens) by inputting the individual’s body height and foot length. The kinematic data of 17 sensors determine the body segment parameters. DHM_Xsens was used to record the actual movement of each participant while performing a task. Each movement was repeated five times, and the average maximum displacement of each joint was considered as a variable in our analysis.
Following data collection, a second DHM in JACK Siemens software (DHM_JACK) was created for each participant using the measured anthropometric data as references. To consistently represent each participant in both software, the joint centers of DHM_JACK have to coincide with the corresponding Xsens skeleton segments. Given the unique compatibility feature of JACK Siemens software, the motion trajectory of each DHM_Xsens was used as an input to drive the corresponding DHM_JACK to achieve realistic human movement (Real_HM) via continuous simulation. This fusion technology significantly overcomes the time-consuming issue of traditional manual joint placement.
A second dynamic simulation was created by importing the DHM_JACK of each participant into Task Simulation Builder (TSB) to define multiple tasks in sequence (called GET, PUT, POSITION, and FORCE). In this second dynamic simulation, we set the position of the joints manually for each initial position by following the constraints defined in the experimental design phase. The initial position of the subsequent task was considered as the end position of the previous task to achieve the pushing and pulling configurations. The algorithm of TBS interpolates the positions between the tasks, producing a set of data that can be exported from the TSB dynamic simulation that we considered as the predicted human movement (Predicted_HM).

2.4. Data Analysis

Due to the symmetry of the simulated tasks, there should not be a large lateral shear force on the lower back of participants. Accordingly, only the compressive and anterior/posterior (A/P) shear force at the 4th/5th (L4/L5) lumbar spine were analyzed during the entire task performance. To calculate the joint torque and forces, JACK uses a set of kinetostatic equations, where the skeletal structure is considered as an open chain, and the load at the end effector (i.e., F   at the hands) is projected to the joints q in the form of generalized loads τ via the transpose of the Jacobian, so that τ = J T q F . The forces are predominantly determined by the DHM adopted postures J T q and the direction and magnitude of the external applied forces F . As shown in Figure 2, after setting the magnitude of external force and its direction to each palm, the real-time spinal forces exposed on the L4/L5 vertebrae are calculated by the program.
In Figure 3, we studied two specific postures, considered as the very instances of poor posture. Such postures are assumed to provoke excessive forces acting on the lumbar spine of participants. We evaluated the postures by comparing the joint angles exported from the Real_HM and Predicted_HM, and calculated the force on the lumbar spine. The deviation of joint angles will directly reveal the accuracy of the TSB posture prediction algorithm within JACK software (version 9.0).

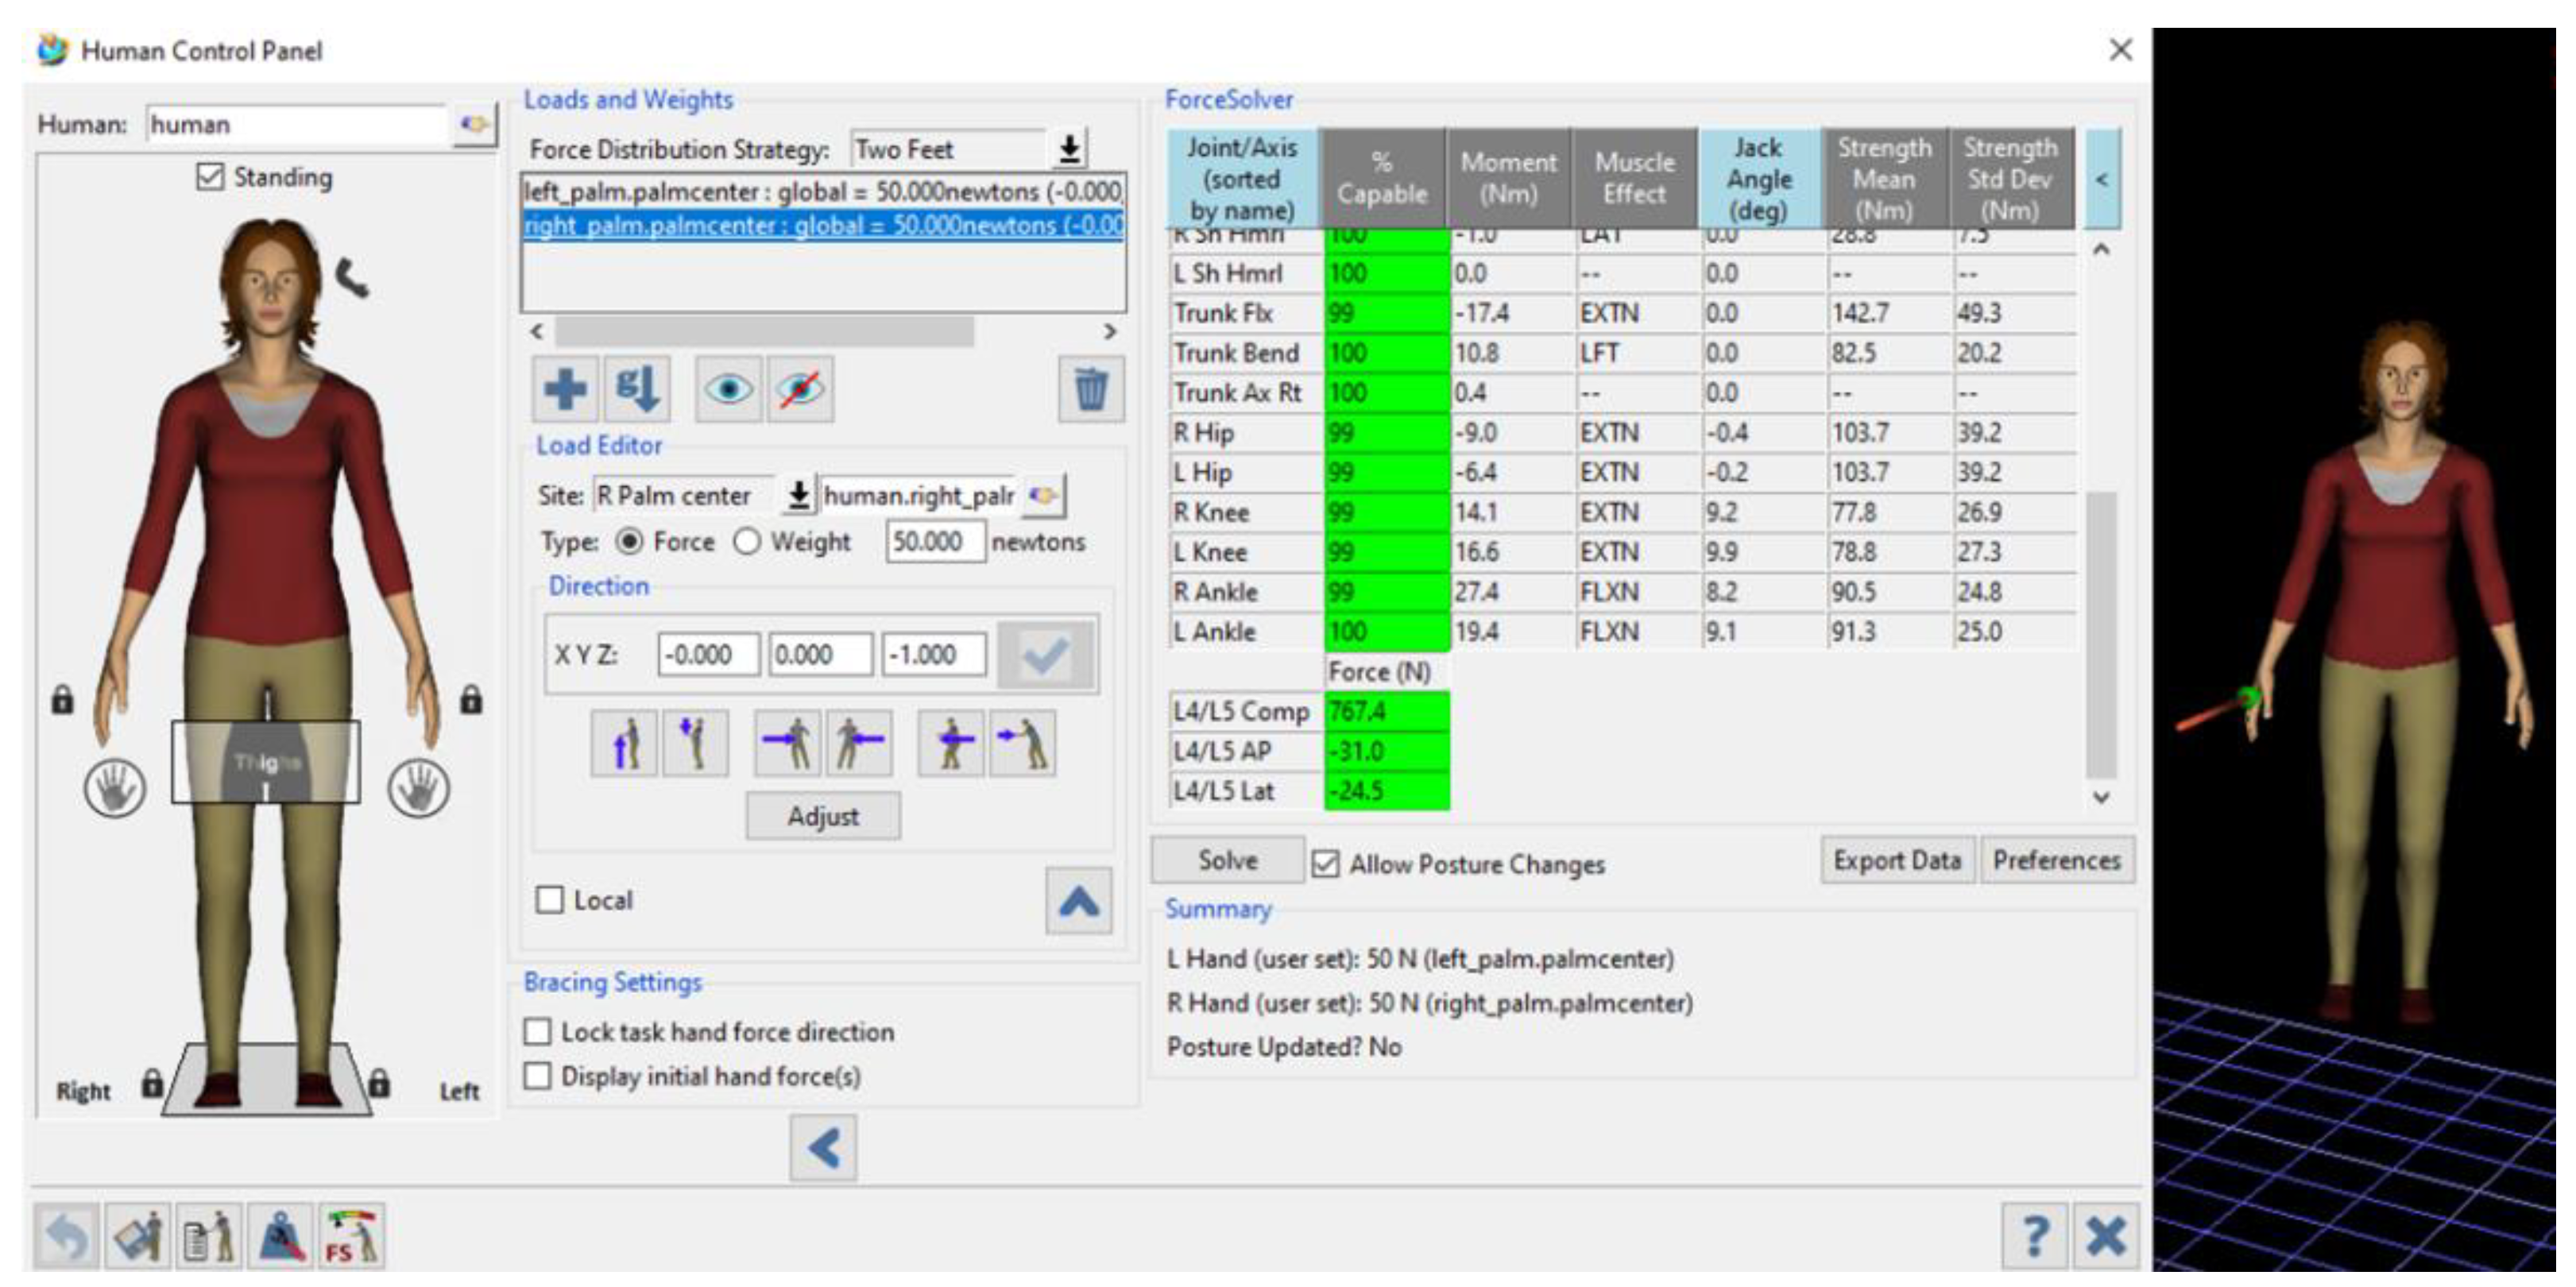
2.4.1. Force Settings in Tasks

The external load carried that the participant acted upon was measured by a digital force gauge (SF-500) as the participants applied a pushing/pulling force on the 40 kg object. The static friction force measured was approximately 100 N to move the object. Accordingly, we modelled such additional force in the simulations by inserting two 50 N horizontal forces applied to the center of each palm.

2.4.2. Lower Back Analysis

The lower back analysis tool in JACK is used to assess the forces acting on the L4/L5 lumbar spine of each DHM during operation. The outcomes are directly determined by the postures adopted by each DHM and the magnitude/direction of the applied external forces. In both Task 1 and Task 2, an excessive compressive force was estimated for the postures where the participants started to push the object forward and pull the object back.

2.4.3. Joint Angle Comparison

In this study, the common push and pull tasks were designed symmetrically. Hence, we assumed that both the left and right sides of the body provide an equal amount of force and, thus, do not induce a shearing torque. This is an optimistic assumption, as any asymmetry in muscle mass in the participant could induce such a load. Given the aforementioned assumption, we will provide results for the following anatomical joints, where their corresponding displacement was used for the evaluation of posture accuracy: (1) the right shoulder abduction/adduction (Sh_Abd/Add), (2) the right shoulder flexion/extension (Sh_F/E), (3) the right elbow flexion/extension (Elbow_F/E), (4) the trunk flexion/extension (Trunk_F/E), (5) the right hip flexion/extension (Hip_R_F/E), and (6) the right knee flexion/extension (Knee_R_F/E).

2.4.4. Statistical Analysis

A two-way analysis of variance (ANOVA) was performed in this study to determine the most likely maximum L4/L5 spinal forces (compressive and A/P shear forces) and the corresponding adopted postures between the Real_HM and Predicted_HM and between genders for each of the tasks. The variables for joints and methods were set as fixed factors. The variable of participants was set as the random factor. The variable of joint angular displacement and the spinal force was set as the dependent variable. To fully understand the difference in individual variables between males and females, a t-test was performed to analyze the compressive force, A/P shear force, and the displacement of each joint between genders in the Real_HM and Predicted_HM, respectively. The statistical program used in the study was MATLAB (MathWorks Inc., Monterey, CA, USA). The statistical significance level was set at 0.05. Moreover, to indicate individual factors, such as body height, body weight, trunk and hip flexion, and shoulder movement, which will directly affect the adopted postures and the spinal forces exposed during task performance, the cross-correlation between variables was also analyzed in this study.

3. Results

3.1. Lower Back Analysis

3.1.1. Push Task

The maximum L4/L5 compressive force and its corresponding A/P shear force were analyzed at the pose as the object began to move forward from the original position. There was no significant difference between the spinal forces, including the compressive and A/P forces, between the Real_HM and Predicted_HM (compressive: p = 0.12, F = 2.46; A/P shear: p= 0.07, F = 3.54), as shown in Figure 4a.
When comparing genders, the spinal forces estimated on male participants were significantly greater than female participants (p < 0.05). The p-values were p < 0.0001 and p < 0.03 between genders for the compressive and A/P shear forces in Real_HM and p < 0.0001 for both loads in the Predicted_HM.
For the cross-correlation analysis, there was a strong correlation between body height and maximum compressive force with R values of 0.87 and 0.91 in the Real_HM and Predicted_HM, respectively. Further, there was a relatively strong correlation between body height and maximum A/P shear force with Rs of 0.57 and 0.86, respectively.
For the correlation between body weight and spinal forces, the R values were 0.59 and 0.71 for the compressive force, and the R values were 0.40 and 0.72 for the A/P shear force in the Real_HM and Predicted_HM, respectively.

3.1.2. Pull Task

At the body pose when the object begins to move backwards from the end position (20 cm away from the original position), the spinal forces between the Real_HM and Predicted_HM were significantly different (compressive: p = 0.0002, F = 18.25; A/P shear: p < 0.0001, F = 59.04), as also shown in Figure 4b. The spinal forces estimated in the Predicted_HM were greater than the Real_HM. The p values were p < 0.03 and p < 0.0001 for the compressive and A/P shear forces, respectively.
The spinal forces exposed to male participants were significantly greater than the female participants (p < 0.05) except for the A/P shear forces in the Real_HM. The p values were 0.001 and 0.16 between genders for the compressive and A/P shear forces in Real_HM, and the p values were p < 0.0001 between genders in the Predicted_HM.
For the cross-correlation analysis, there was a strong correlation between body height and maximum compressive force with R values of 0.79 and 0.80, and a relatively strong correlation between body height and maximum A/P shear force with Rs of 0.56 and 0.79 in the Real_HM and Predicted_HM, respectively.
For the correlation between body weight and spinal forces, the R values were 0.51 and 0.59 for the compressive force and 0.36 and 0.59 for the A/P shear force in the Real_HM and Predicted_HM, respectively.

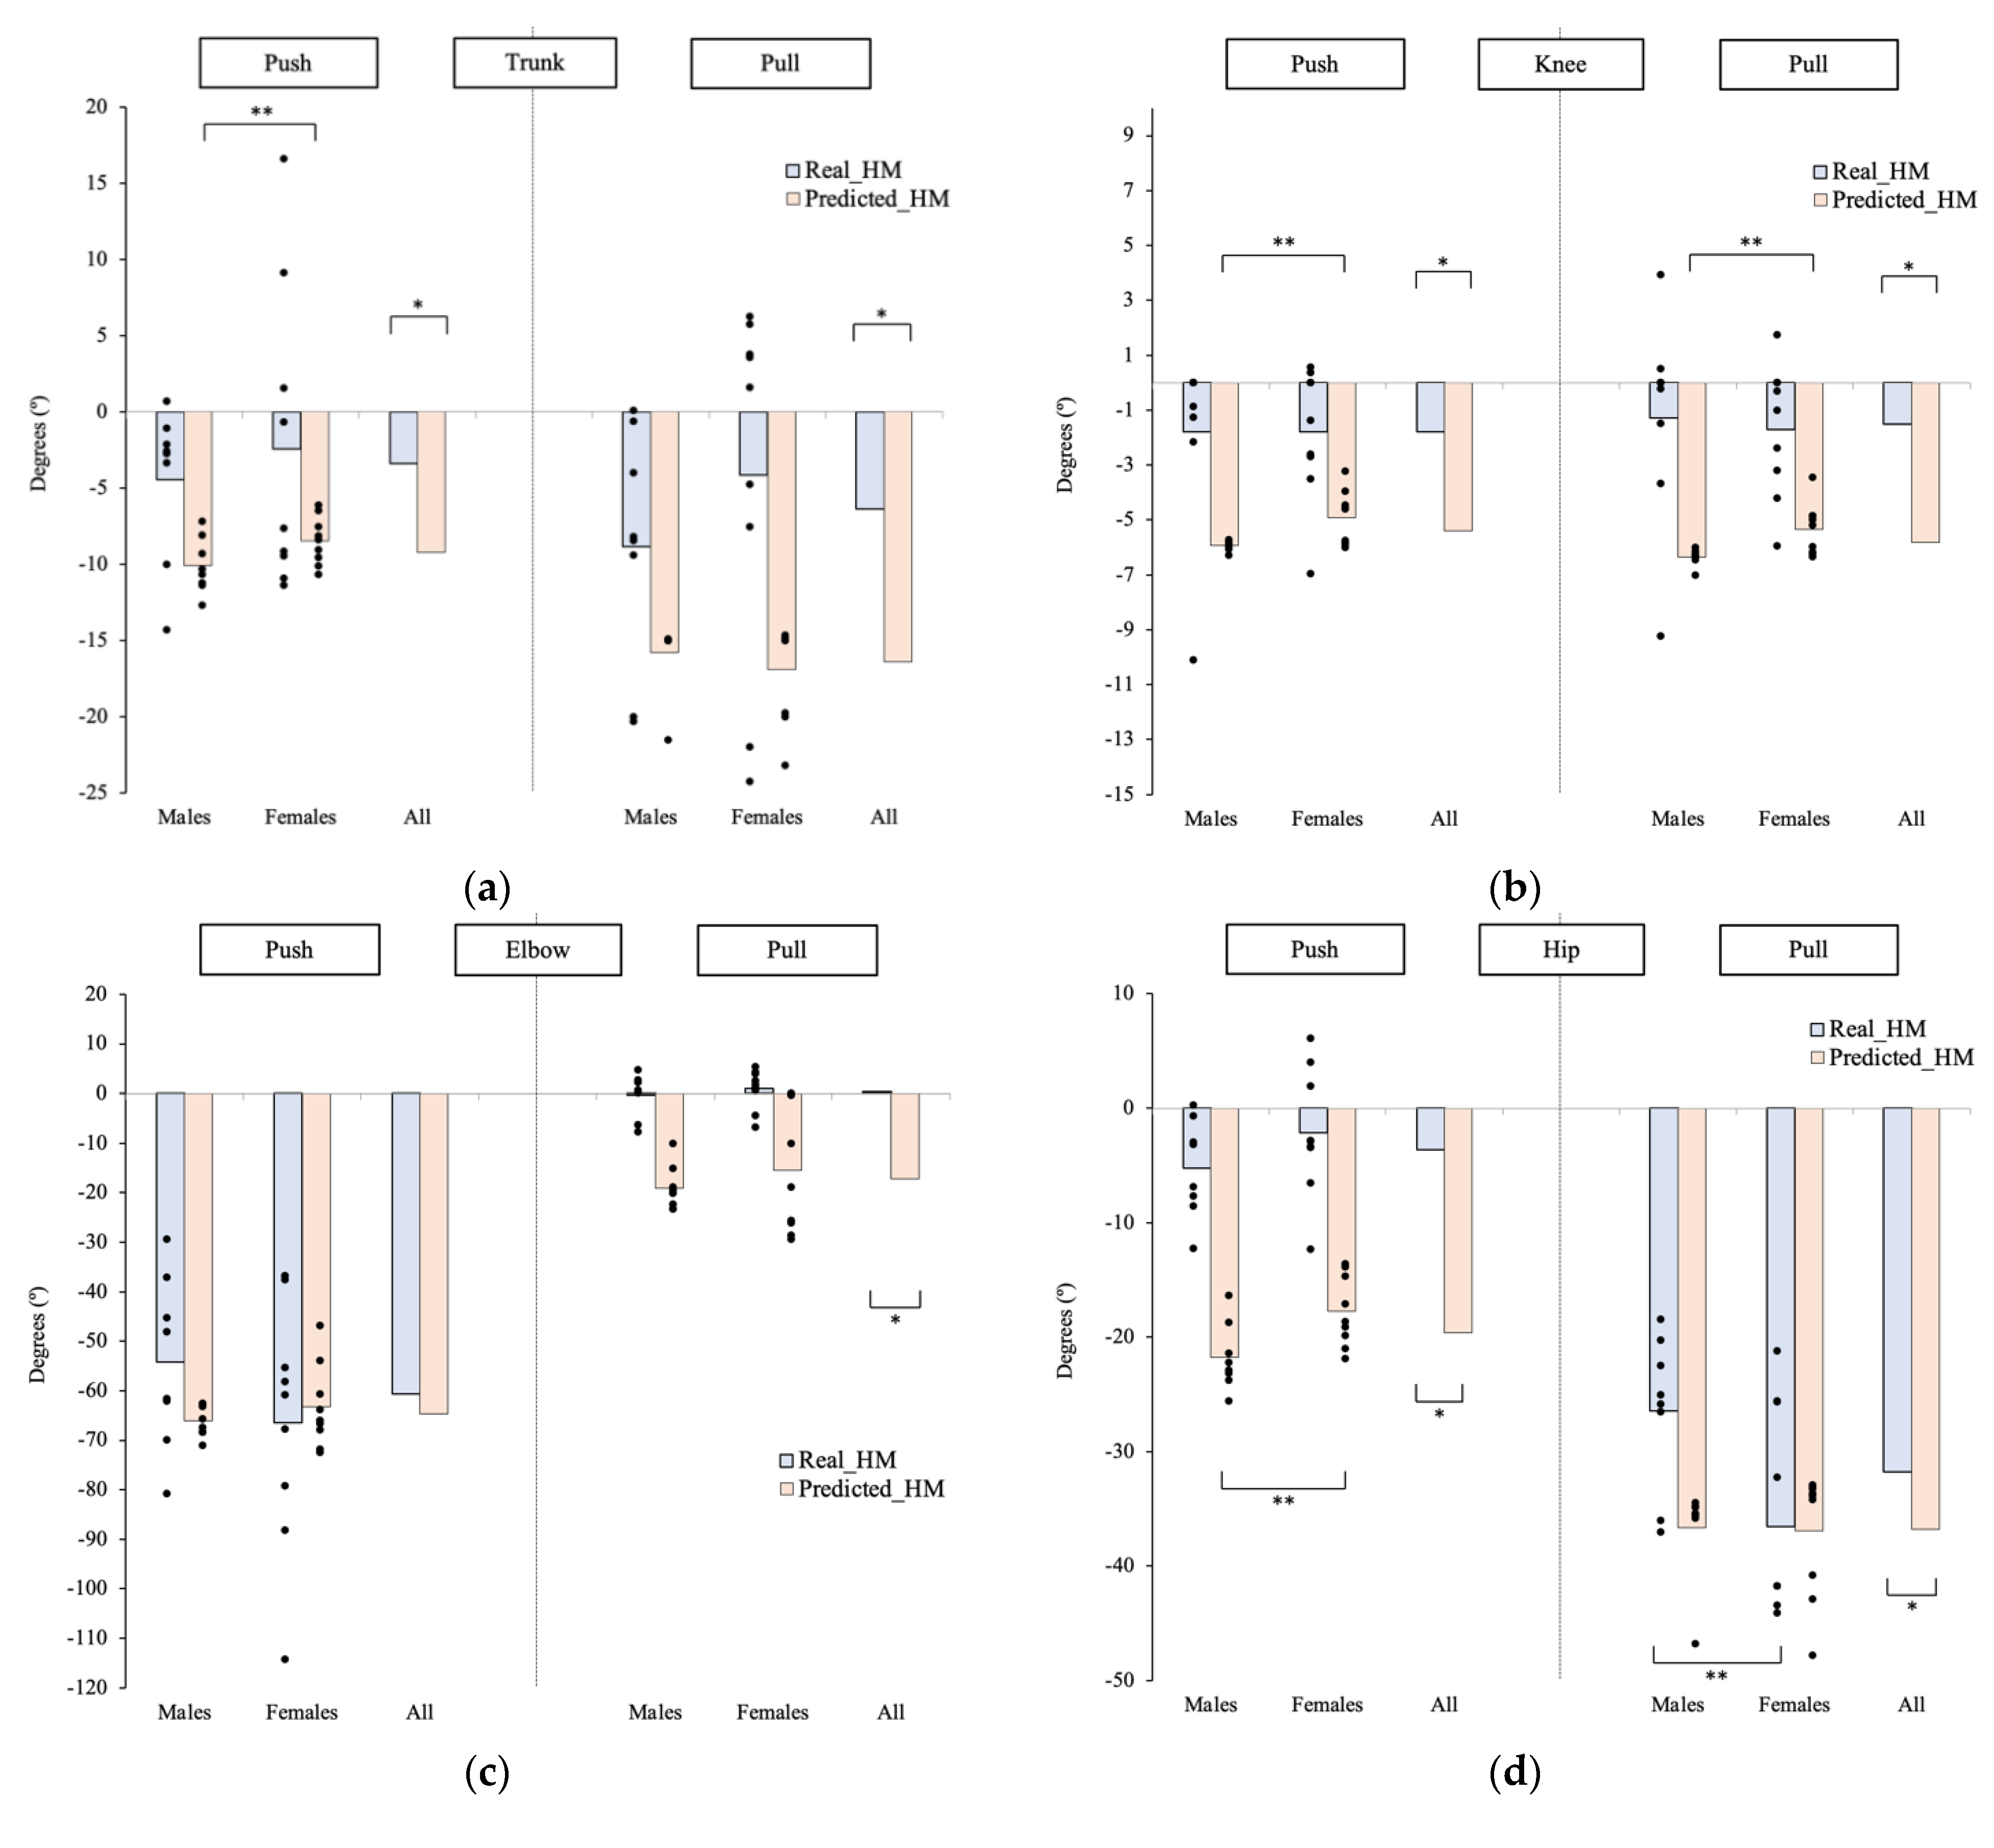
3.2. Joint Angle Analysis

The comparison of displacements among joint angles is shown in Figure 5a–f. For shoulders, a positive value of Sh_R_F/E represents flexion of the right shoulder joint, and a negative value represents extension. A positive value of Sh_R_Abd/Add represents adduction of the right shoulder joint, and a negative value represents abduction. For the other joints (Elbow_R_F/E, Knee_R_F/E, Hip_R_F/E, and Trunk_F/E), a positive value represents extension, and a negative value represents flexion.

3.2.1. Push Task

The joint angular displacements were analyzed at the pose where the object began moving forward, and participants were subjected to the maximum compressive force. Except for the Elbow_F/E (p = 0.49, F = 0.47) in Figure 5, all other joint displacements were significantly different between the Real_HM and Predicted_HM (p < 0.0001 for the four joints: Knee_F/E (F = 21.23), Hip_F/E (F = 118.09), Sh_F/E (F = 36.04), and Sh_Abd/Add (F = 87.0); p = 0.012, F = 7.21 for the Trunk_F/E). It should be noted that, although the comparison of Knee_F/E was significantly different, the average difference was only 3.6°, which represents 2.6% of the maximum joint excursion. For all the other joints with significant difference displacement, the average values in Predicted_HM were greater than the Real_HM. Interestingly, we observed that for the Sh_Abd/Add joint, while we recorded an abduction movement in the Real_HM, the Predicted_HM movement was an adduction.
When comparing genders, only the Sh_F/E was significantly different (p = 0.04) in the Real_HM. However, in the Predicted_HM, there were four joints with significantly different displacements: the Knee_F/E (p = 0.01), Trunk_F/E (p = 0.049), Hip_F/E (p = 0.01), and Sh_F/E (p = 0.02). Although the comparison of the Knee_F/E was significantly different, the average difference was only 1.0°, which represents 0.7% of the maximum joint excursion. Female subjects had significantly greater shoulder flexion than males in both Real_HM and Predicted_HM and significantly less trunk and hip flexion than males in the Predicted_HM.
For the cross-correlation analysis, there was a weak positive correlation between the Trunk_F/E and Hip_F/E for male participants with R = 0.3, but a moderate negative correlation between the trunk and hip for females with R = −0.64 in the Real_HM. In the Predicted_HM, there was a strong relationship between these two aforementioned variables for males and females with Rs of 0.97 and 0.92.

3.2.2. Pull Task

For the pull task, joint angular displacements were analyzed at the pose where the object began to move toward the participant and are presented in Figure 5a–f. All joint displacements were significantly different between the Real_HM and Predicted_HM (p < 0.0001 for the four joints: Knee_F/E (F = 26.7), Elbow_F/E (F = 33.89), Sh_F/E (F = 35.81), and Sh_Abd/Add (F = 102.81); p = 0.001, F = 12.78 for the Trunk_F/E; p = 0.03, F = 5.11 for Hip_F/E). The average values in Predicted_HM were greater than the Real_HM. Particularly, the joint Sh_Abd/Add was adducting in the Real_HM, but it was abducting in the Predicted_HM; the joint Elbow_F/E was extending in the Real_HM but flexing in the Predicted_HM.
For the joint comparison between genders, the Hip_F/E (p = 0.03) and Sh_F/E (p < 0.0001) were significantly different in the Real_HM. Only the Knee_F/E was significantly different in the Predicted_HM, but the difference was only 1.0°. Female participants had greater hip and shoulder flexion than males in the Real_HM.
When comparing the cross-correlation between angular displacements, there was a weak negative correlation between the Trunk_F/E and Hip_F/E for female participants with R = −0.2 and a moderate positive correlation between trunk and hip for males with R = 0.66 in the Real_HM. This could indicate that males tended to use more of the lumbar spine to pull the weight, ending in extending the trunk. Female participants tended, instead, to use their hamstrings by pushing their backsides back, as in a standard deadlift movement. In the Predicted_HM, there was a strong relationship between these two variables for both males and females with Rs of 0.99 and 0.99, hence failing to characterize the two different strategies.

4. Discussion

In a full-body dynamic simulation using JACK Siemens software, the posture of the participant has been evaluated by comparing it to actual human movement captured by the Xsens MVN motion tracking system. Joint angle deviations directly lead to the significant difference in compressive back force and shear force along the L4/L5 spinal segment.
As shown in Figure 4, there is no significant difference in spinal forces between the Real_HM and Predicted_HM for the push task. On the other hand, a notable difference in spinal forces was found between males and females in the Real_HM. The correlation of Trunk_F/E and Hip_F/E could be the reason for this dissimilarity in spinal forces between genders. A moderate negative correlation between trunk and hip for females was observed in the Real_HM, where a weak positive correlation for male participants was found. Hence, while pushing, females extended their trunks, whereas males tended to hunch, causing the trunk to flex and bringing the hip into flexion as well. In the most ergonomic pushing technique provided by Mount Nittany Health [20] and the University of Rochester Medical Center [21], the back should be straight, the body should lean toward the object, and the body’s weight should be used to move the object forward. The procedure just described will reduce strain on the back. While the procedure was not described during the orientation session, females naturally followed the proper pushing technique more than males. We speculate that this is the result of the load being a larger percentage of body weight for the female group, who are thus forced to use their legs to push rather than rely on the lower back. The different applied pushing techniques between genders may result in the higher spinal forces present in males in comparison to females.
In the Predicted_HM, there was also a significant difference in spinal forces between males and females. It is interesting to notice that there was a strong relationship between trunk and hip flexion for males and females. It seems that the trunk and hip flex simultaneously while performing the push task in the Predicted_HM, indicating that the motion algorithm in JACK predicts that both genders would push more by bending their backs. Moreover, for the push task, a high correlation was found in relation to the participant’s height and compressive forces. Figure 4 shows how as the height of the participant increased, the spinal forces on the participant increased in both genders and both Real_HM and Predicted_HM. Accordingly, the relatively larger body height in males will result in greater trunk and hip flexion, which will directly result in increased spinal forces for males in the Predicted_HM.
Except for the trunk movements we just analyzed, all joint displacements were significantly different between the Real_HM and Predicted_HM. An important difference found was that in the Sh_Abd/Ad, the shoulder performed an abduction in reality, which was estimated as an adduction motion in simulation. As per the aforementioned proper pushing technique provided in [20,21], the body should lean toward the object. Thus, it stands to reason that a shoulder abduction is more reasonable for pushing an object forward.
A statistically significant difference in joint angular displacement between genders only occurs in Sh_F/E, where the female group had a shoulder flexion of over 10° higher than the male group during the push movement.
For the pull task, there was a significant difference between the spinal forces calculated with the Real_HM and Predicted_HM, as well as a statistically significant difference in the spinal forces between males and females (see Figure 4). The difference was not as significant between these genders when comparing the shear forces in the Real_HM. The reason for a notable difference in forces could be caused by the statistical difference between all the joint displacements. We speculate that a greater spinal force was calculated with the Predicted_HM because all joint displacement had greater values than those measured in the Real_HM, especially in the trunk and hip. In the Predicted_HM, there was a strong relationship between these two latter variables for both males and females. On the other hand, when using the Real_HM data, this relationship only presents in the males because when performing this task, they tended to flex their hips and trunk at the same time (R = 0.66) when compared to females (R = −0.2). We can speculate that this is a consequence of males relying more on their upper body strength via flexing their trunks. One previous study [22] focused on the major muscle groups that female and male groups engaged when performing different exercises to find their major lifting capacity. It was found that females have 37–68% of the muscle strength of males in general. Specifically, the variance in muscle strength between males and females is greater in the upper body and less in the lower body. Females are stronger in their legs than in their arms and shoulders. This previous outcome can directly reflect the posture difference between males and females during pulling task performance, in which females prefer to use whole-body strength to pull the object via flexing their hips and shoulders more than males to keep the trunk straight. It seems that females followed a classical deadlift motion.
During the pull task, another significant difference in joint angle comparison between the Real_HM and Predicted_HM is Sh_Abd/Add. In the Real_HM, the participants went into shoulder adduction when performing the pull task, but the Predicted_HM estimated a shoulder abduction. Furthermore, in the Real_HM, the participants extended their elbows to perform the task, while in the Predicted_HM, the outcome was flexion of the elbow. Referencing the proper pulling technique provided in [20,21], the trunk should lean back, and arms should be kept straight to let bodyweight pull the load. Obviously, the posture prediction by the algorithm in TSB lacks consideration of proper pulling technique, where pulling is done by the arms rather than by the whole weight of the body. The greater shoulder abduction, elbow flexion, trunk flexion, and hip flexion will concentrate the strain forces on the back, which will directly increase the back injury rate, unlike when using bodyweight to pull the load backward.
Except for the correlation between body height and spinal forces that we discussed, body weight and spinal forces also had a moderate relationship in both the Real_HM and Predicted_HM. This finding is in line with the results in [23] that analyzed the variation of lumbar spinal loads in relation to body height and weight using the Anybody Modelling System. In their findings, the resulting forces and moments increased approximately linearly with the increasing body height and weight. Furthermore, our statistical analysis highlights that the flexion of both the trunk and hips would affect the spinal forces on a participant. Our conclusion supports the finding in [24], where the trunk muscle forces for flexion and extension were estimated via a finite element model of the lumbar spine and measured on vivo data. The results in [24] showed an almost linear relationship between the increase of the flexion angle with the intradiscal pressure and the bending moment resultant force.

5. Conclusions

This study has successfully evaluated the accuracy of full-body dynamic simulation with the use of TSB within JACK Siemens software. We uncovered how posture could have an effect on spinal forces when performing push and pull tasks. Individual factors, such as body height, body weight, trunk and hip flexion, shoulder movement, and muscle strength between genders, will directly affect the adopted postures during task performance. These variables should be adequately considered in software design for robust ergonomics analysis to reduce injury risks in diverse occupational workplaces. To fully assess the accuracy of predicted postures in a full-body dynamic simulation, it will be better to include different load levels in the experimental set-up. Additionally, recruiting more volunteers with a wide age range will help in identifying the effect of muscle strength on their adopted postures during task performance.

Author Contributions

Conceptualization, X.J. and D.P.; methodology, X.J. and D.P.; software, X.J.; validation, H.L.; formal analysis, X.J.; investigation, X.J.; resources, X.J.; data curation, X.J.; writing—original draft preparation, X.J. and M.A.; writing—review and editing, D.P. and H.L. All authors have read and agreed to the published version of the manuscript.

Funding

This research received no external funding.

Institutional Review Board Statement

The study was conducted in accordance with the Declaration of Helsinki, and approved by the Institutional Review Board of Gannon University (protocol code: GUIRB-2020-2-1502 and date of approval: April 2020).” for studies involving humans.

Informed Consent Statement

Informed consent was obtained from all subjects involved in the study.

Conflicts of Interest

The authors declare no conflict of interest.

References

  1. Bureal of Labour Statistics, U.S. Department of Labor. Employer-Reported Workplace Injuries and Illnesses—2020. Available online: https://www.bls.gov/news.release/pdf/osh.pdf (accessed on 3 November 2021).
  2. National Institute of Neurological Disorders and Stroke (NIH). Low Back Pain. Available online: https://www.ninds.nih.gov/health-information/disorders/back-pain (accessed on 3 May 2022).
  3. Freburger, J.K.; Holmes, G.M.; Agans, R.P.; Jackman, A.M.; Darter, J.D.; Wallace, A.S.; Castel, L.D.; Kalsbeek, W.D.; Carey, T.S. The rising prevalence of chronic low back pain. Arch. Intern. Med. 2009, 169, 251–258. [Google Scholar] [CrossRef] [PubMed] [Green Version]
  4. Michigan Municipal Workers’ Compensation Fund Safety and Health Resource Manual (MML). Michigan Municipal League: A Basic Plan for Preventing Back Injuries. Available online: https://www.mml.org/insurance/risk_resources/publications/s_and_h_manual/13A.PDF (accessed on 18 April 2022).
  5. Insurance Information Institute (III). Steps to Reduce Workplace Injuries. Available online: https://www.iii.org/article/steps-to-reduce-workplace-injuries (accessed on 2 March 2022).
  6. Occupational Safety and Health Administration (OSHA); United States Department of Labor. Training Requirements in OSHA Standards. Available online: https://www.osha.gov/sites/default/files/publications/osha2254.pdf (accessed on 26 May 2022).
  7. Schall, M.C., Jr.; Fethke, N.B.; Roemig, V. Digital human modeling in the occupational safety and health process: An application in manufacturing. IISE Trans. Occup. Ergon. Hum. Factors 2018, 6, 64–75. [Google Scholar] [CrossRef] [PubMed]
  8. Grobelny, J.; Michalski, R. Preventing work-related musculoskeletal disorders in manufacturing by digital human modeling. Int. J. Environ. Res. Public Health 2020, 17, 8676. [Google Scholar] [CrossRef] [PubMed]
  9. Ji, X.; Hernandez, J.; Schweitzer, E.; Littman, A. The Accuracy of Dynamic Simulation with the Use of TSB within JACK Siemens PLM software. In Proceedings of the 6th North American International Conference on Industrial Engineering and Operations Management, Monterrey, Mexico, 3–5 November 2021. [Google Scholar]
  10. Chaffin, D.B. Improving digital human modelling for proactive ergonomics in design. Ergonomics 2005, 48, 478–491. [Google Scholar] [CrossRef] [PubMed]
  11. Ji, X.; Piovesan, D.; Conley, K. The Effect of Pulling Effort on Lumbar Spine via Applying Digital Human Modeling Technology. In Proceedings of the Institute of Industrial and Systems Engineers (IISE) Annual Conference, Seattle, WA, USA, 21–24 May 2022. [Google Scholar]
  12. Kajaks, T.; Stephens, A.; Potvin, J.R. The effect of manikin anthropometrics and posturing guidelines on proactive ergonomic assessments using digital human models. Int. J. Hum. Factors Model. Simul. 2011, 2, 236–253. [Google Scholar] [CrossRef]
  13. Zhao, W.; Madhavan, V.; Fernandez, J. Study of the Accuracy of Postures Obtained by Immersive Virtual Reality for Use in Ergonomic Analysis. In Proceedings of the 13th Annual International Conference on Industrial Engineering Theory, Applications and Practice, Las Vegas, NV, USA, 7–10 September 2008. [Google Scholar]
  14. Park, J.; Jung, K.; Chang, J.; Kwon, J.; You, H. Evaluation of driving posture prediction in digital human simulation using RAMSIS®. In Proceedings of the Human Factors and Ergonomics Society Annual Meeting; Sage: Los Angeles, CA, USA, 2011; pp. 1711–1715. [Google Scholar]
  15. Piovesan, D.; Pierobon, A.; DiZio, P.; Lackner, J.R. Comparative analysis of methods for estimating arm segment parameters and joint torques from inverse dynamics. J. Biomech. Eng. 2011, 133, 031003. [Google Scholar] [CrossRef] [PubMed]
  16. Xsens. Xsens 3D Motion Tracking. Available online: https://tutorial.xsens.com/?_ga=2.191254569.2072040727.1649269985-1839686643.1648751945 (accessed on 9 June 2022).
  17. Waters, T.R.; Putz-Anderson, V.; Garg, A. Applications Manual for the Revised NIOSH Lifting Equation; U.S. Department of Health and Human Services: Cincinnati, OH, USA, 1994.
  18. Watson, K. What’s an Average Shoulder Width? Available online: https://www.healthline.com/health/average-shoulder-width (accessed on 26 October 2018).
  19. Dempster, L. Patterns of Human Motion; Prentice-Hall, Inc.: Englewood Cliffs, NJ, USA, 1971. [Google Scholar]
  20. Mount Nittany Health (MNH). Back Safety: Pushing and Pulling. Available online: https://www.mountnittany.org/wellness-article/pushing-and-pulling-back-safety (accessed on 7 May 2021).
  21. University of Rochester Medical Center (UoRMC). The Right Way to Push and Pull. Available online: https://www.urmc.rochester.edu/encyclopedia/content.aspx?contenttypeid=1&contentid=4458 (accessed on 25 February 2022).
  22. Chen, G.; Liu, L.; Yu, J. A comparative study on strength between American college male and female students in Caucasian and Asian populations. Sport Sci. Rev. 2012, 21, 153. [Google Scholar] [CrossRef]
  23. Han, K.-S.; Rohlmann, A.; Zander, T.; Taylor, W.R. Lumbar spinal loads vary with body height and weight. Med. Eng. Phys. 2013, 35, 969–977. [Google Scholar] [CrossRef] [PubMed]
  24. Rohlmann, A.; Bauer, L.; Zander, T.; Bergmann, G.; Wilke, H.-J. Determination of trunk muscle forces for flexion and extension by using a validated finite element model of the lumbar spine and measured in vivo data. J. Biomech. 2006, 39, 981–989. [Google Scholar] [CrossRef] [PubMed]
Figure 1. The workstation was set up in the laboratory to simulate the common activities repeated by workers every day. (a) Task 1: push; (b) Task 2: pull.
Applsci 12 06450 g001
Figure 2. An example of calculating the spinal forces exposed on the L4/L5 vertebrae in JACK.
Applsci 12 06450 g002
Figure 3. Two specific postures as the participants applied pushing and pulling efforts on the object. (a) Task 1: push; (b) Task 2: pull. The DHM with the orange shirt is the Real_HM. The DHM with the blue shirt is the Predicted_HM.
Applsci 12 06450 g003
Figure 4. The comparison of spinal forces between the Real_HM and Predicted_HM was plotted. (a) push task; (b) pull task. The black dots indicate the forces exposed by each individuals. * indicates a significant difference in forces between the real and the predicted movement. ** indicates a significant difference in forces between genders.
Applsci 12 06450 g004
Figure 5. The comparison of joint angles between the Real_HM and Predicted_HM in both push and pull tasks. (a) Trunk; (b) Knee; (c) Elbow; (d) Hip; (e) Shoulder_F/E; (f) Shoulder_Abd/Add. The black dots indicate the joint displacement adopted by each individuals. * indicates a significant difference in forces between the real and the predicted movement. ** indicates a significant difference in forces between genders.
Applsci 12 06450 g005aApplsci 12 06450 g005b
Publisher’s Note: MDPI stays neutral with regard to jurisdictional claims in published maps and institutional affiliations.

