
A Novel Method for Survival Prediction of Hepatocellular Carcinoma Using Feature-Selection Techniques

 , , ,
, , ,  and
and
Abstract
1. Introduction
- Examine the impact of missing-value replacement using mean and mode approaches.
- Utilize the feature-selection methods to select the relevant features causing HCC.
- Assess the impact of different machine-learning algorithms in HCC classification.
2. Related Works
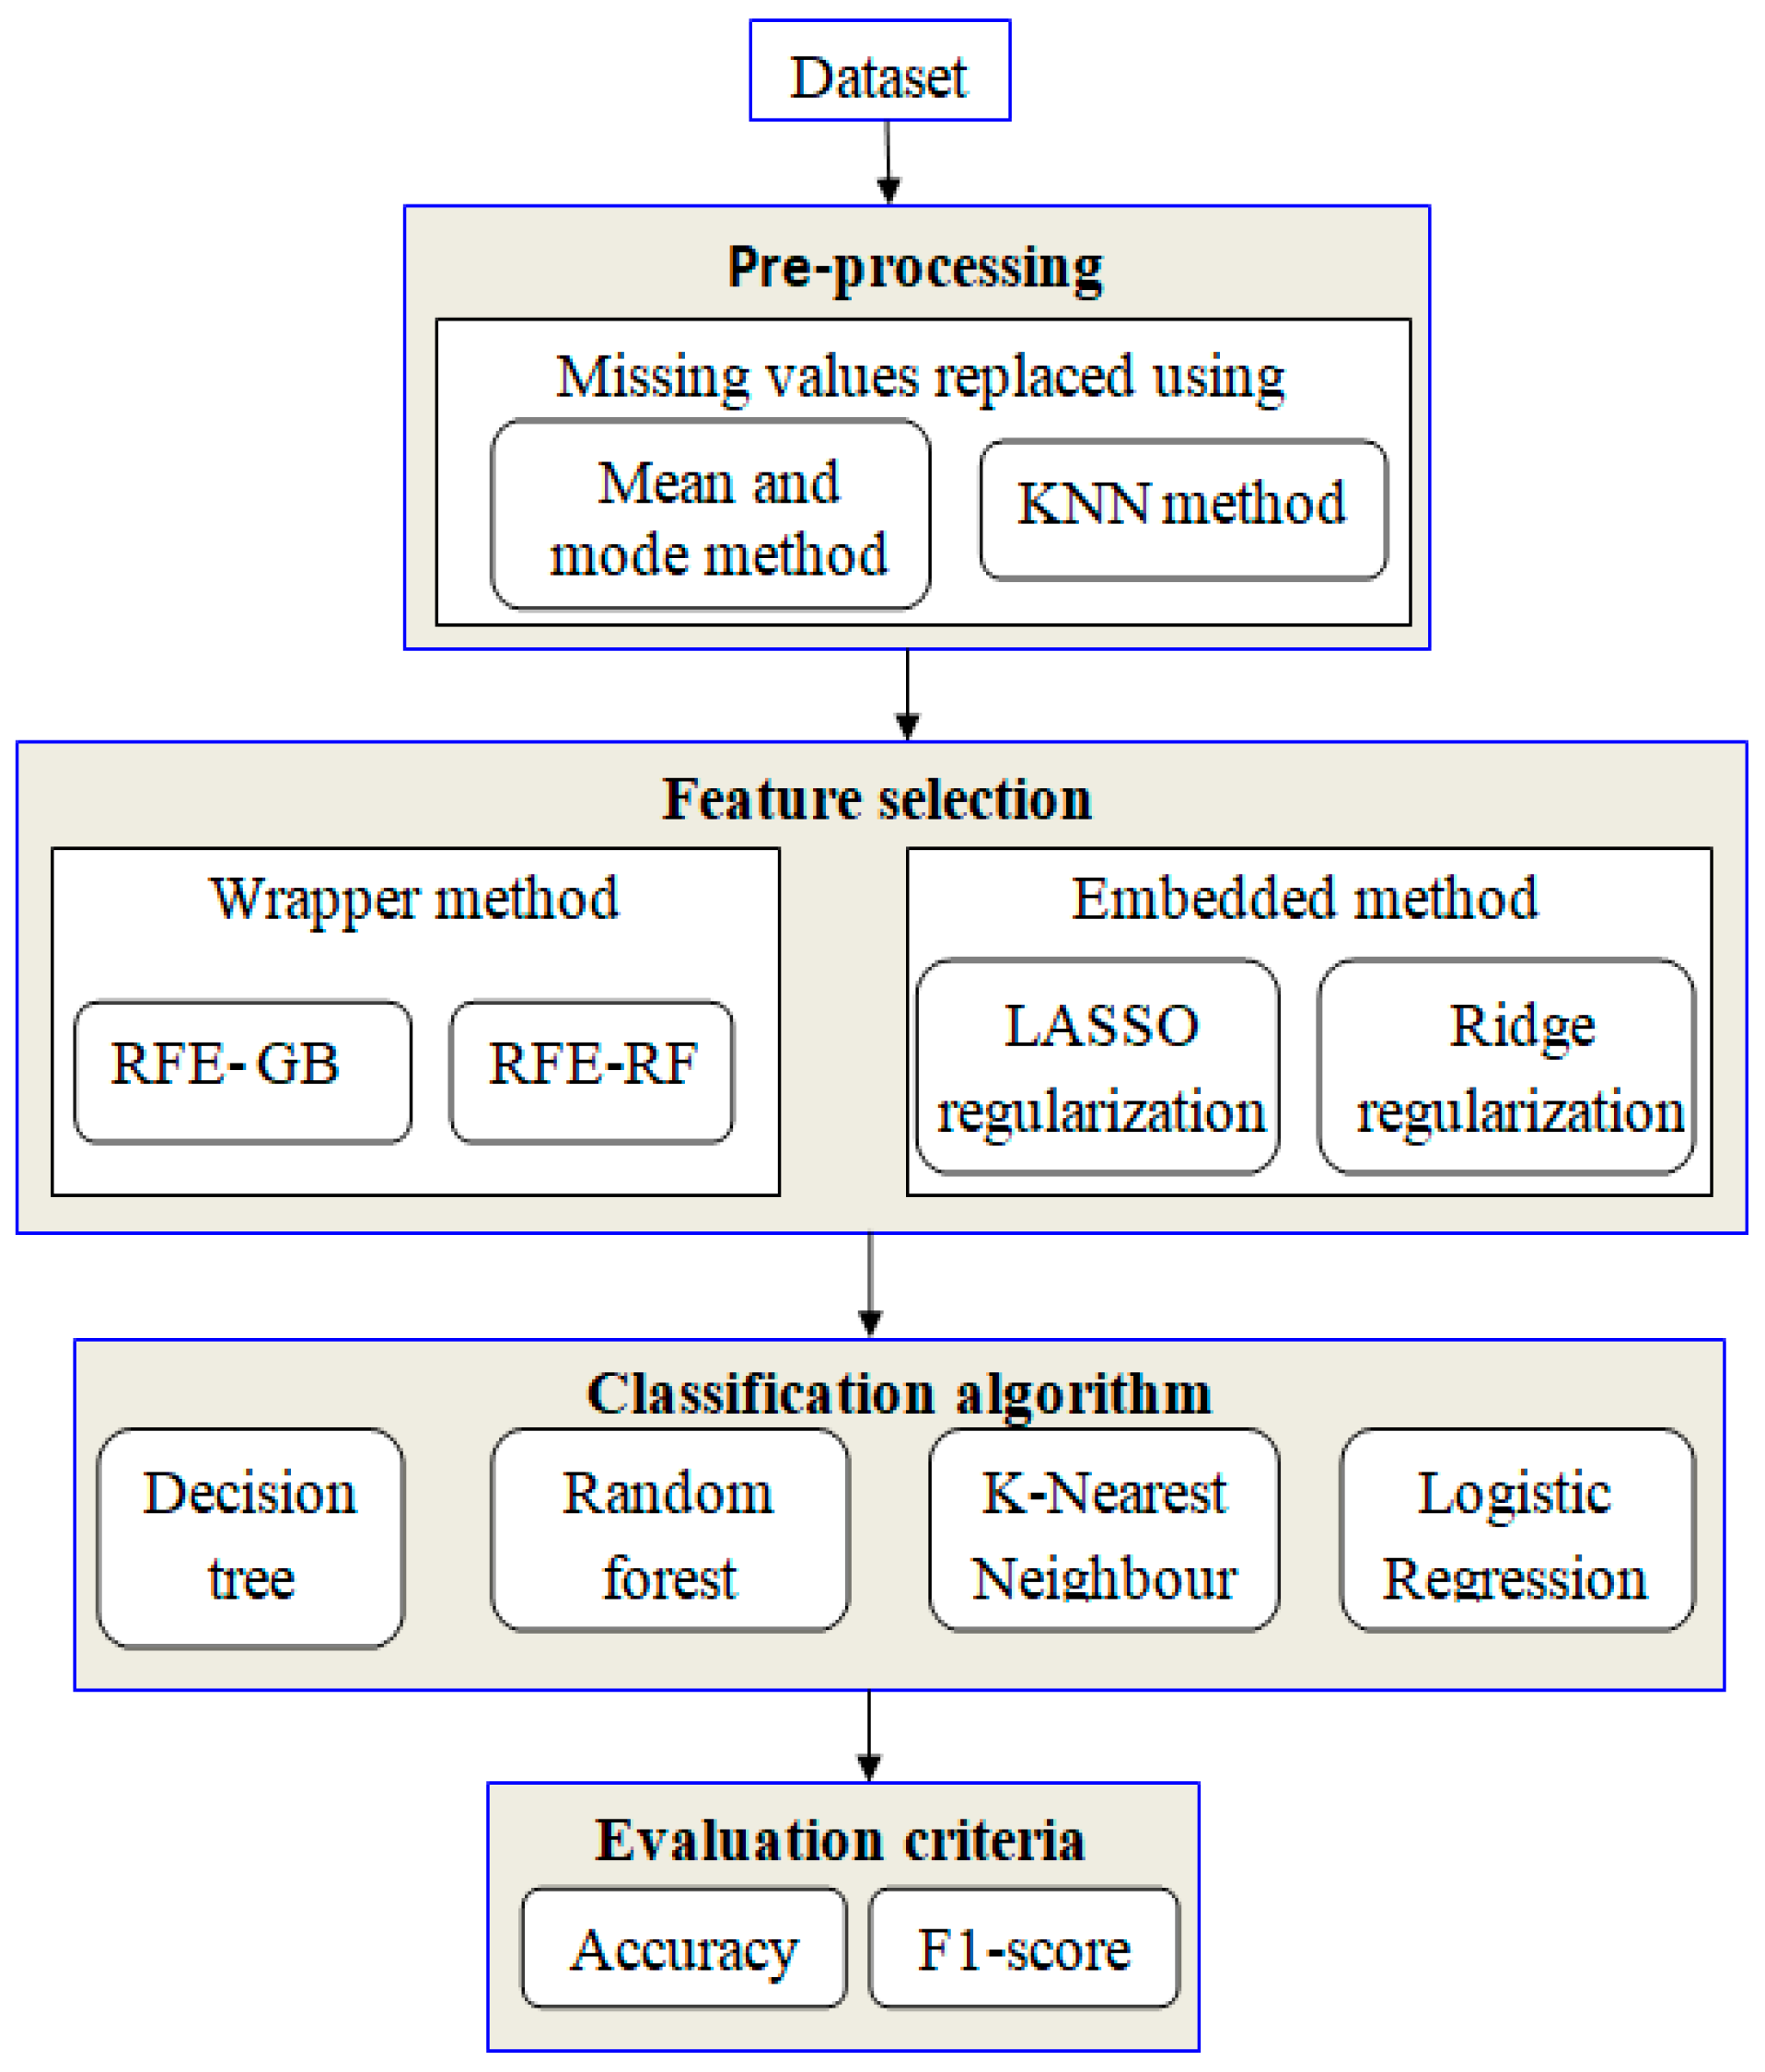
3. Proposed Framework
3.1. Data Preprocessing
3.2. Handling Missing Values
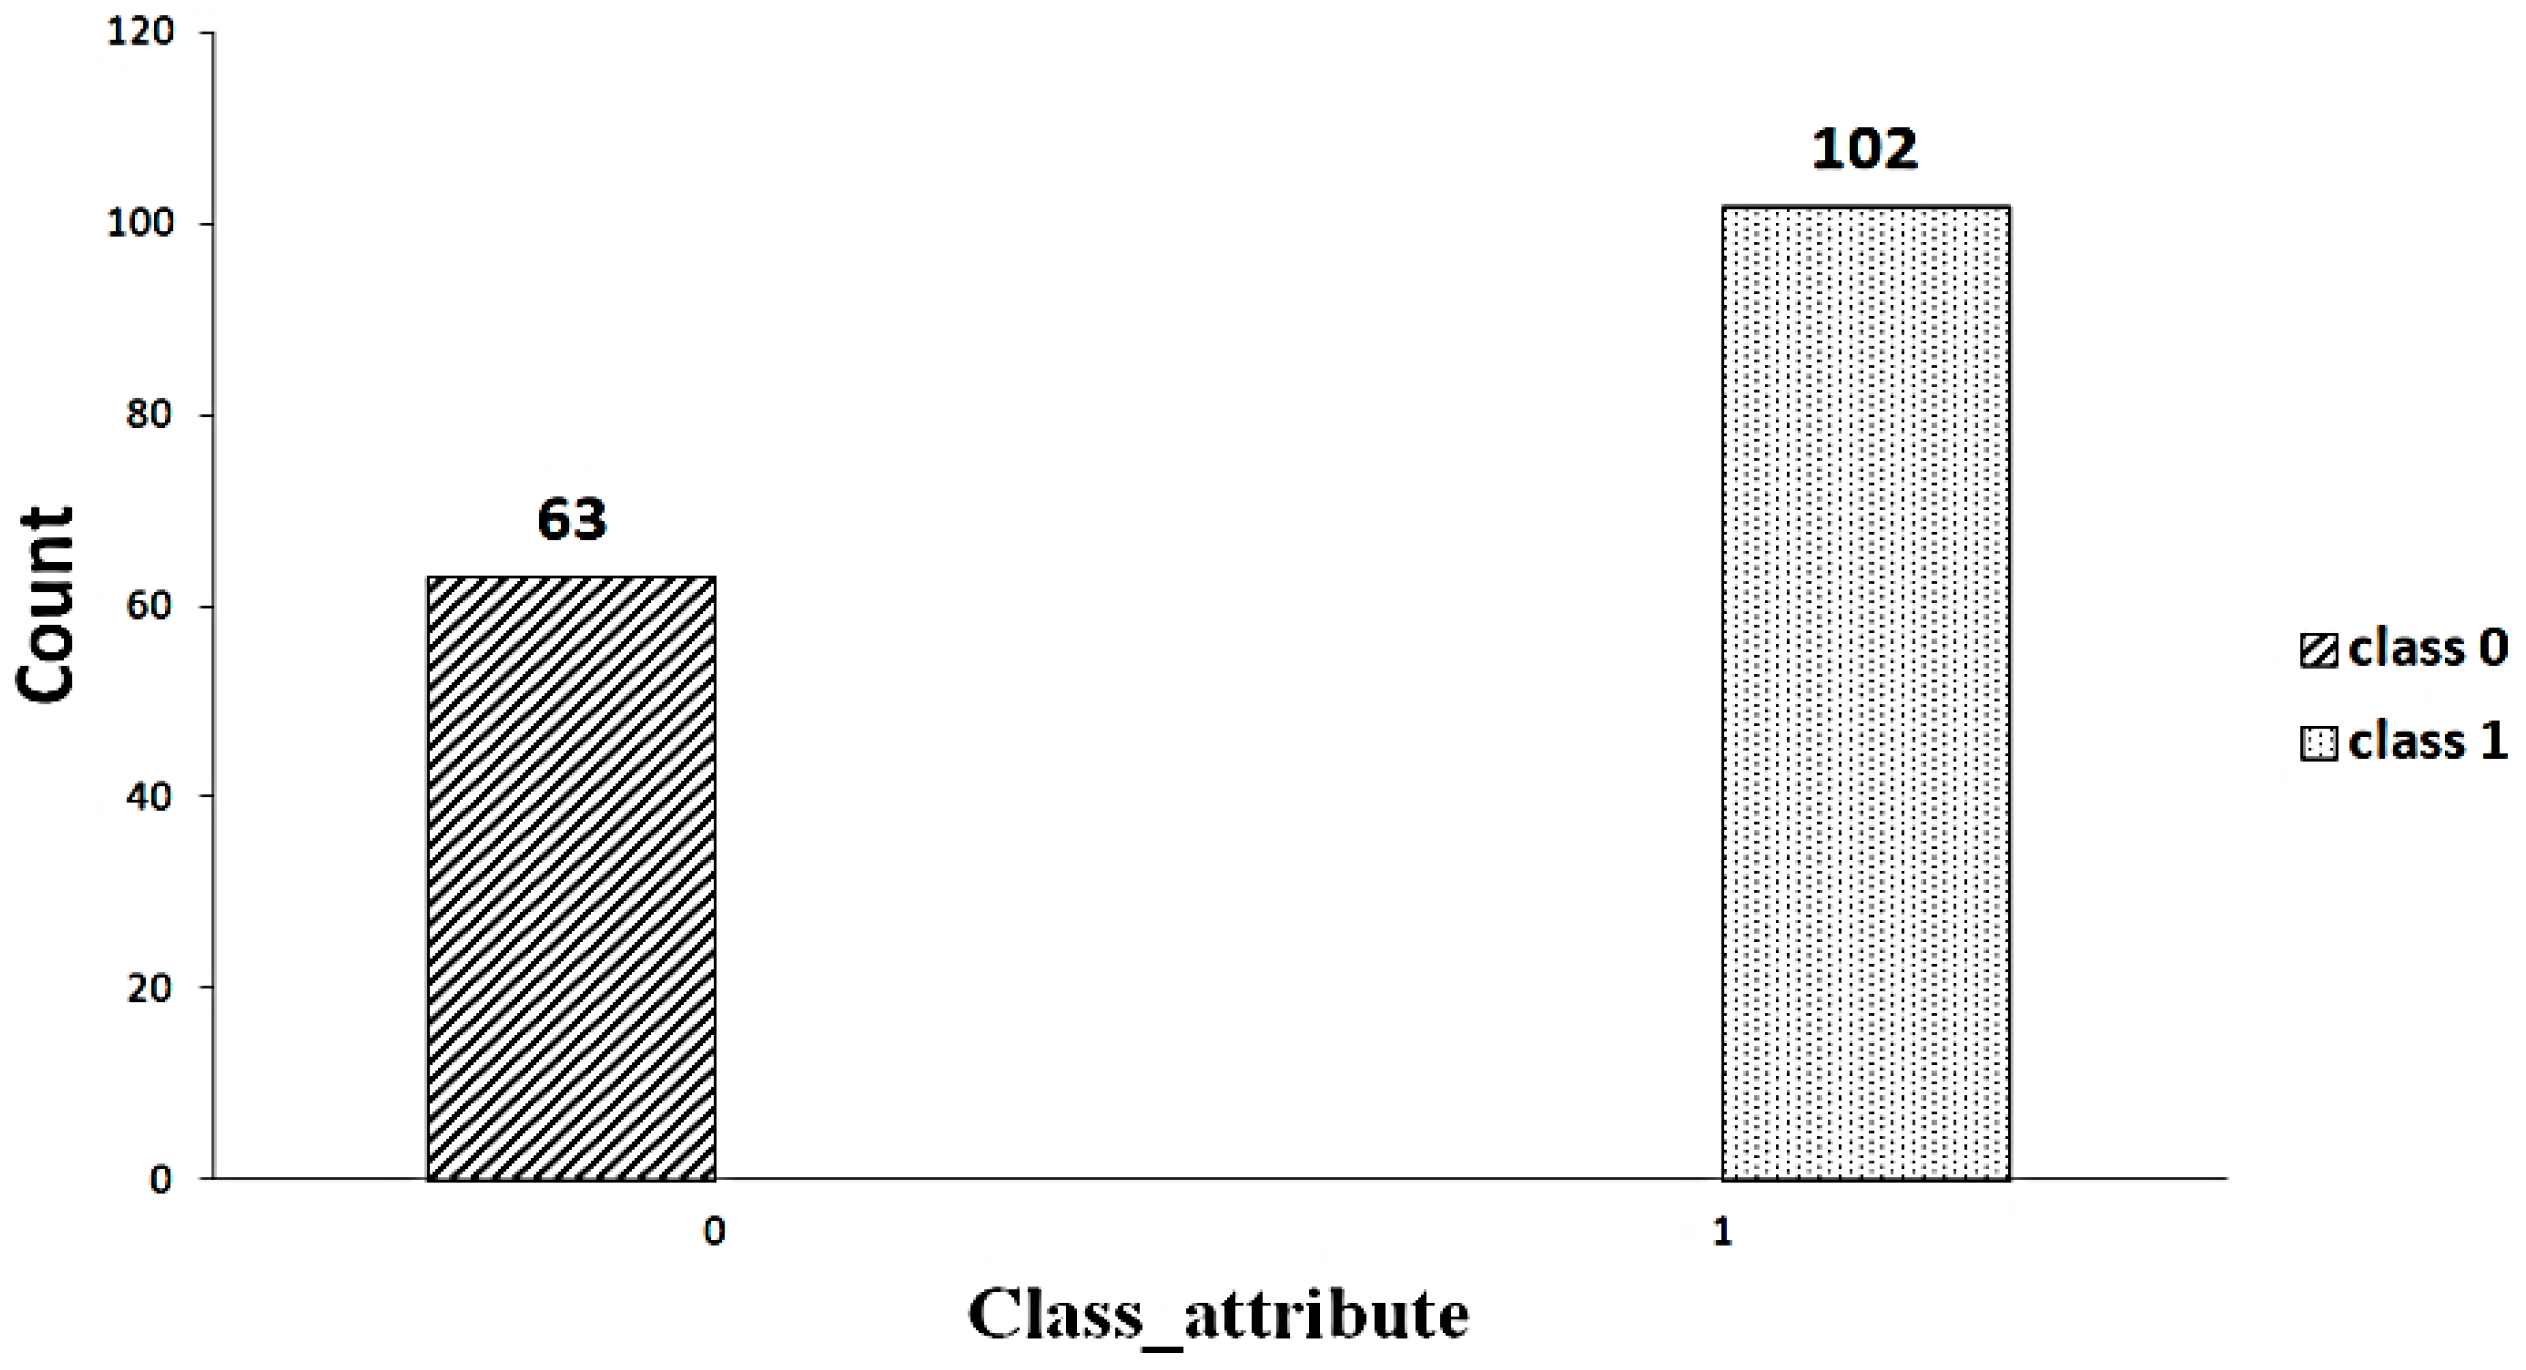
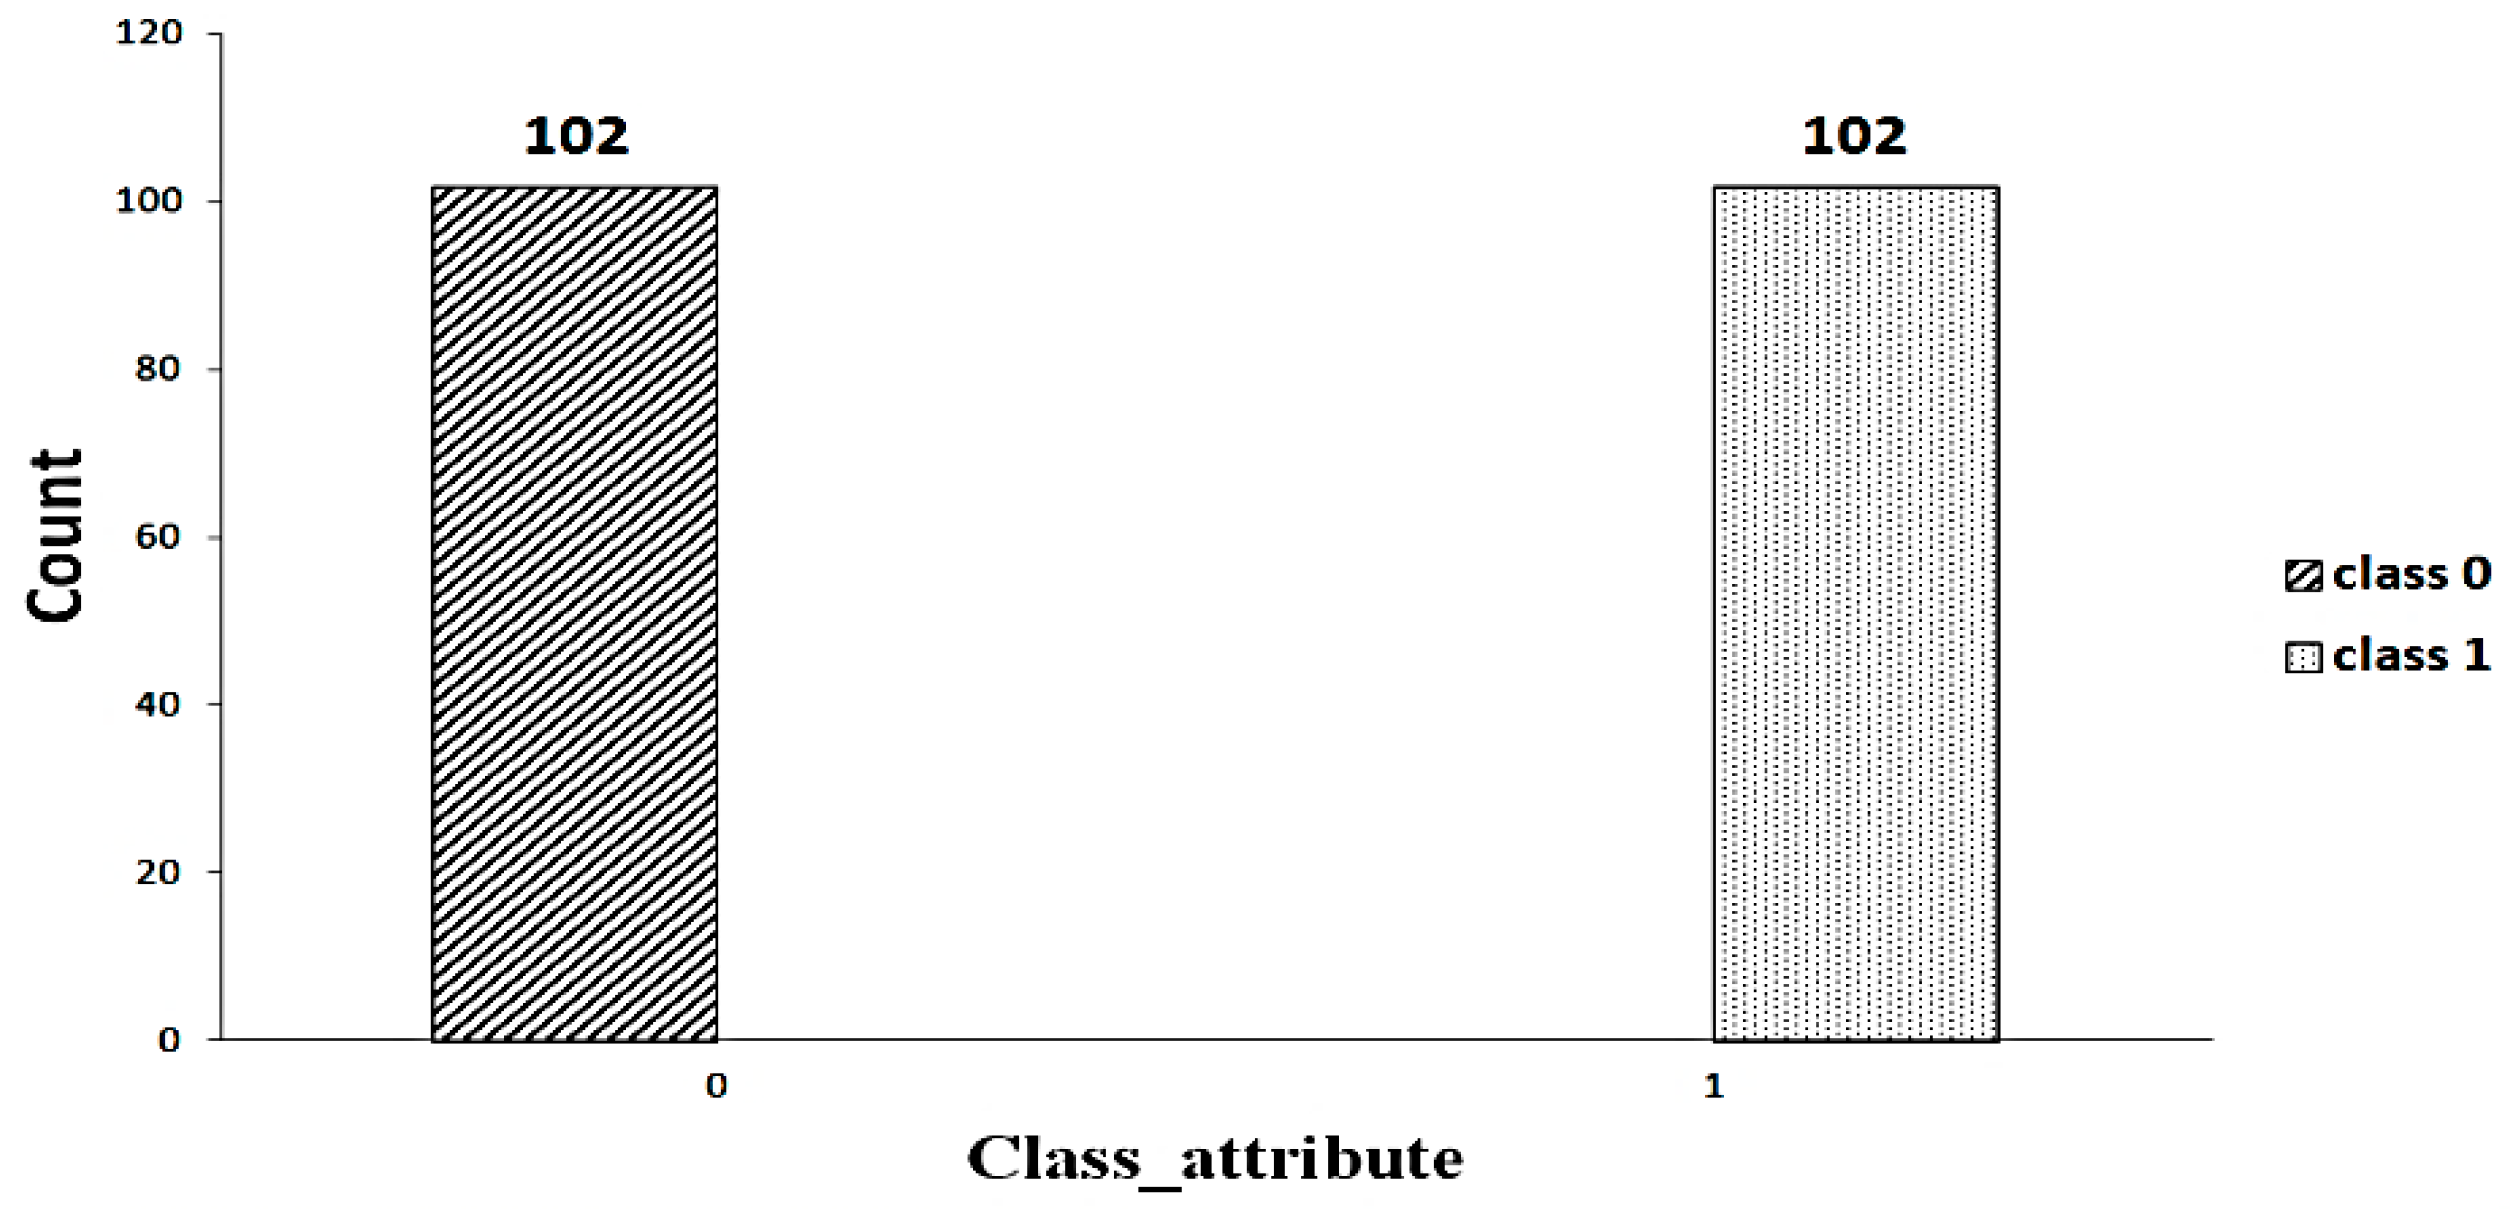
3.3. Random Oversampling/Undersampling
3.4. Feature Selection
3.4.1. Wrapper Method
3.4.2. Embedded Method
3.5. Classification Algorithms
3.5.1. Decision Tree
3.5.2. Random Forest
3.5.3. k-Nearest Neighbors
3.5.4. Logistic Regression
3.6. Cross-Validation Method
3.7. Evaluation Metrics
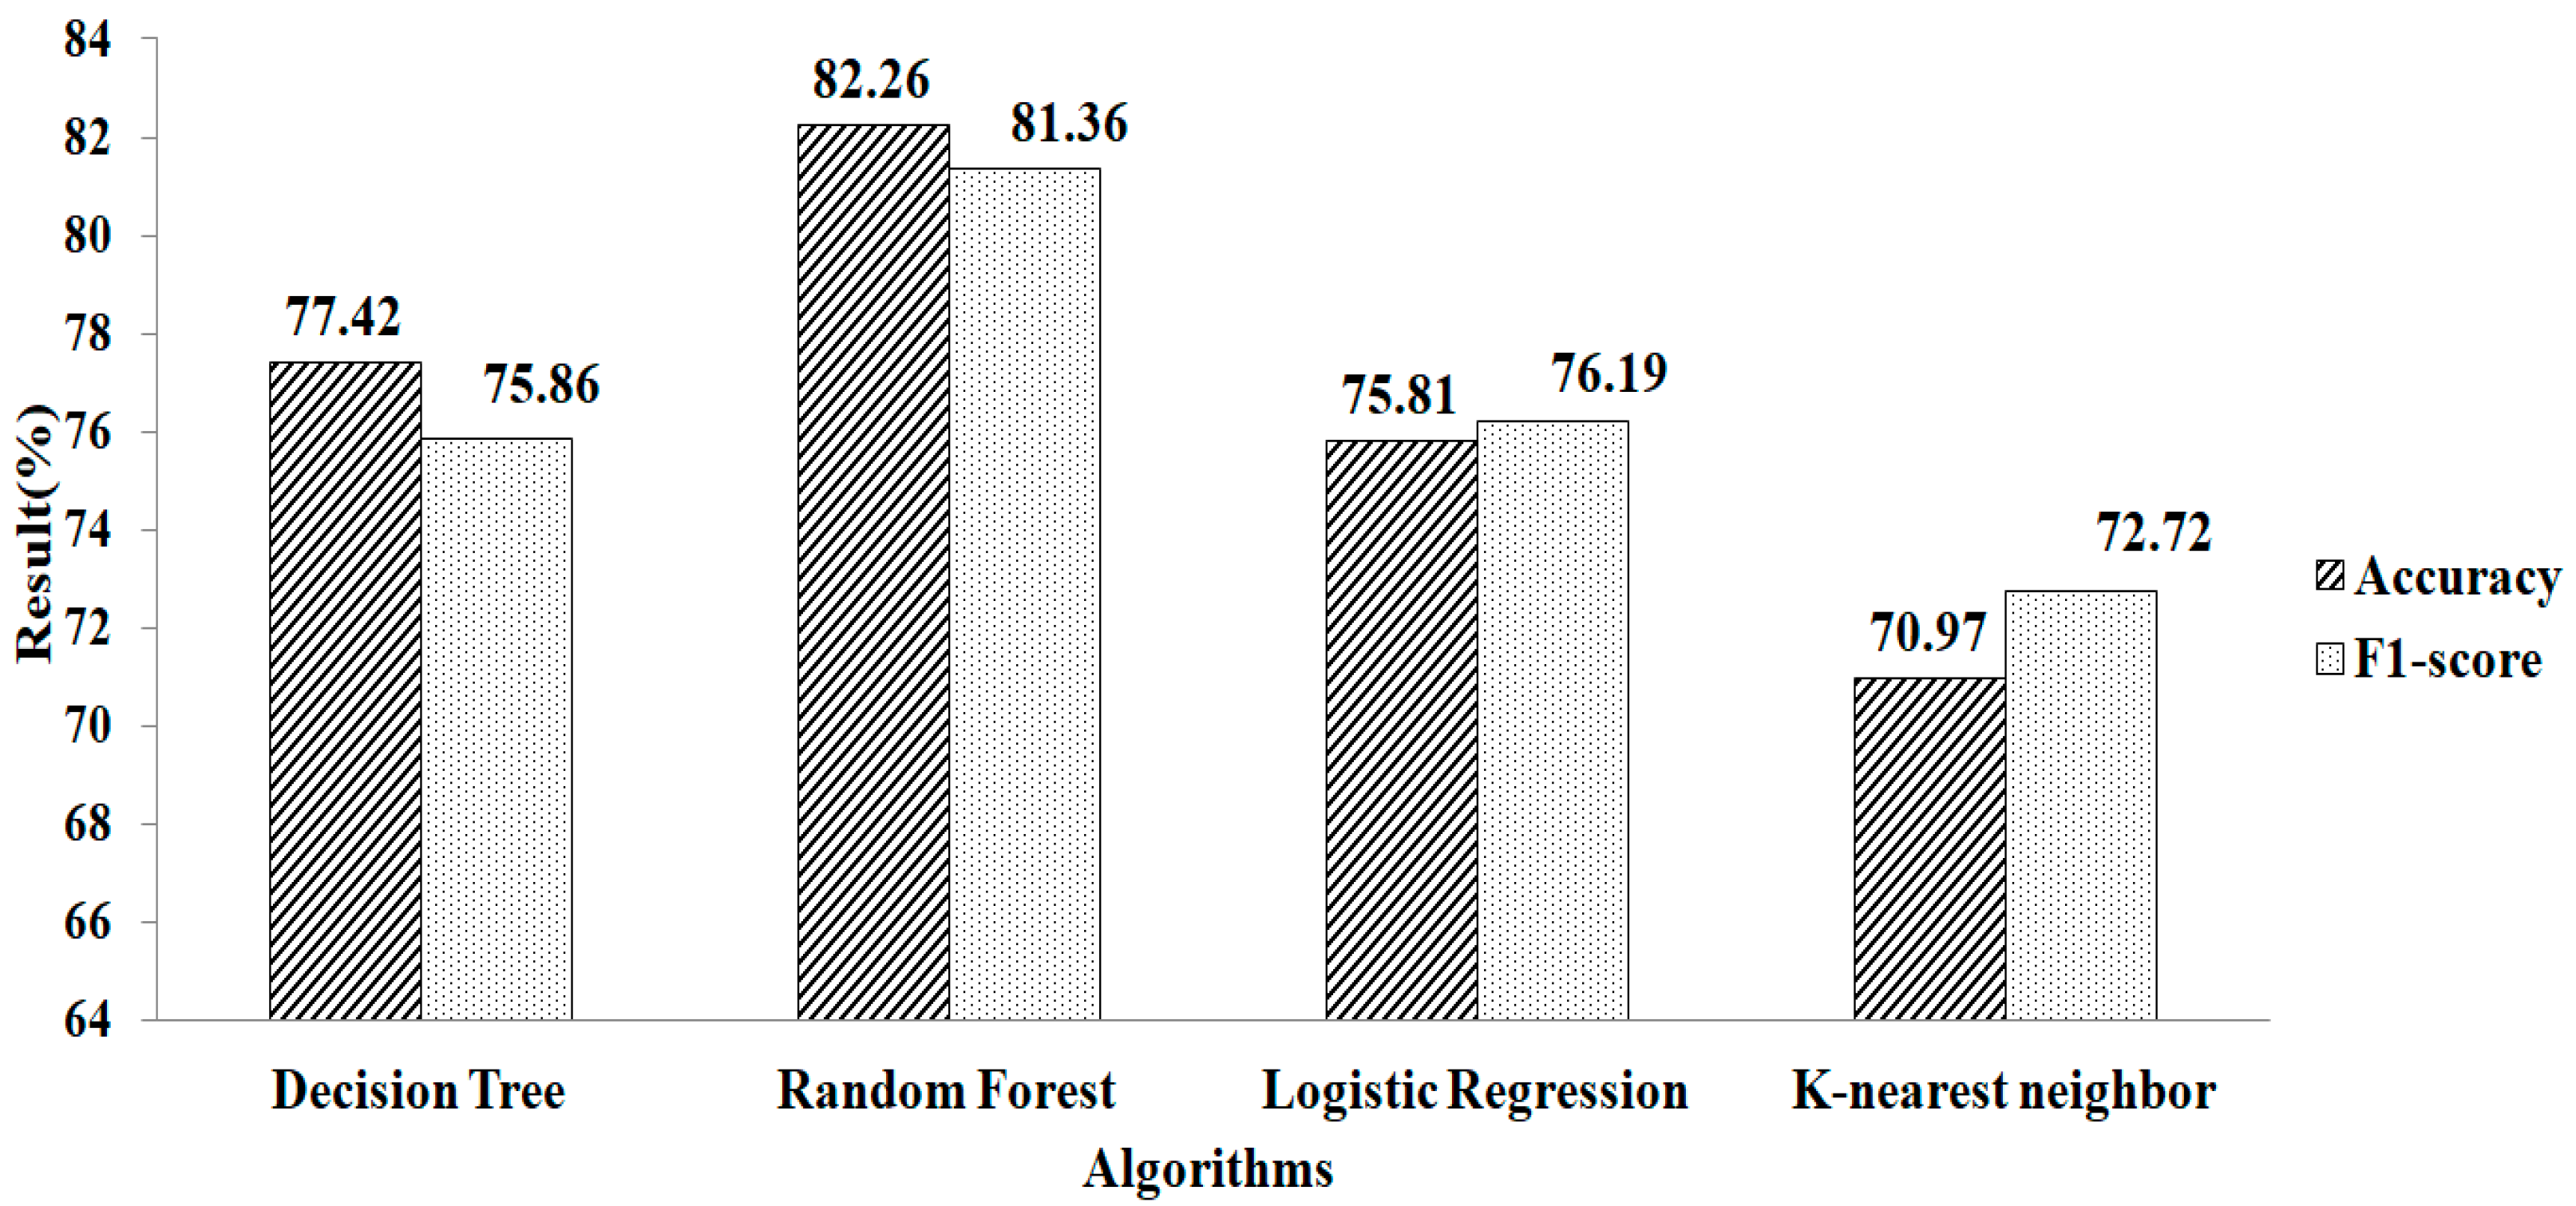
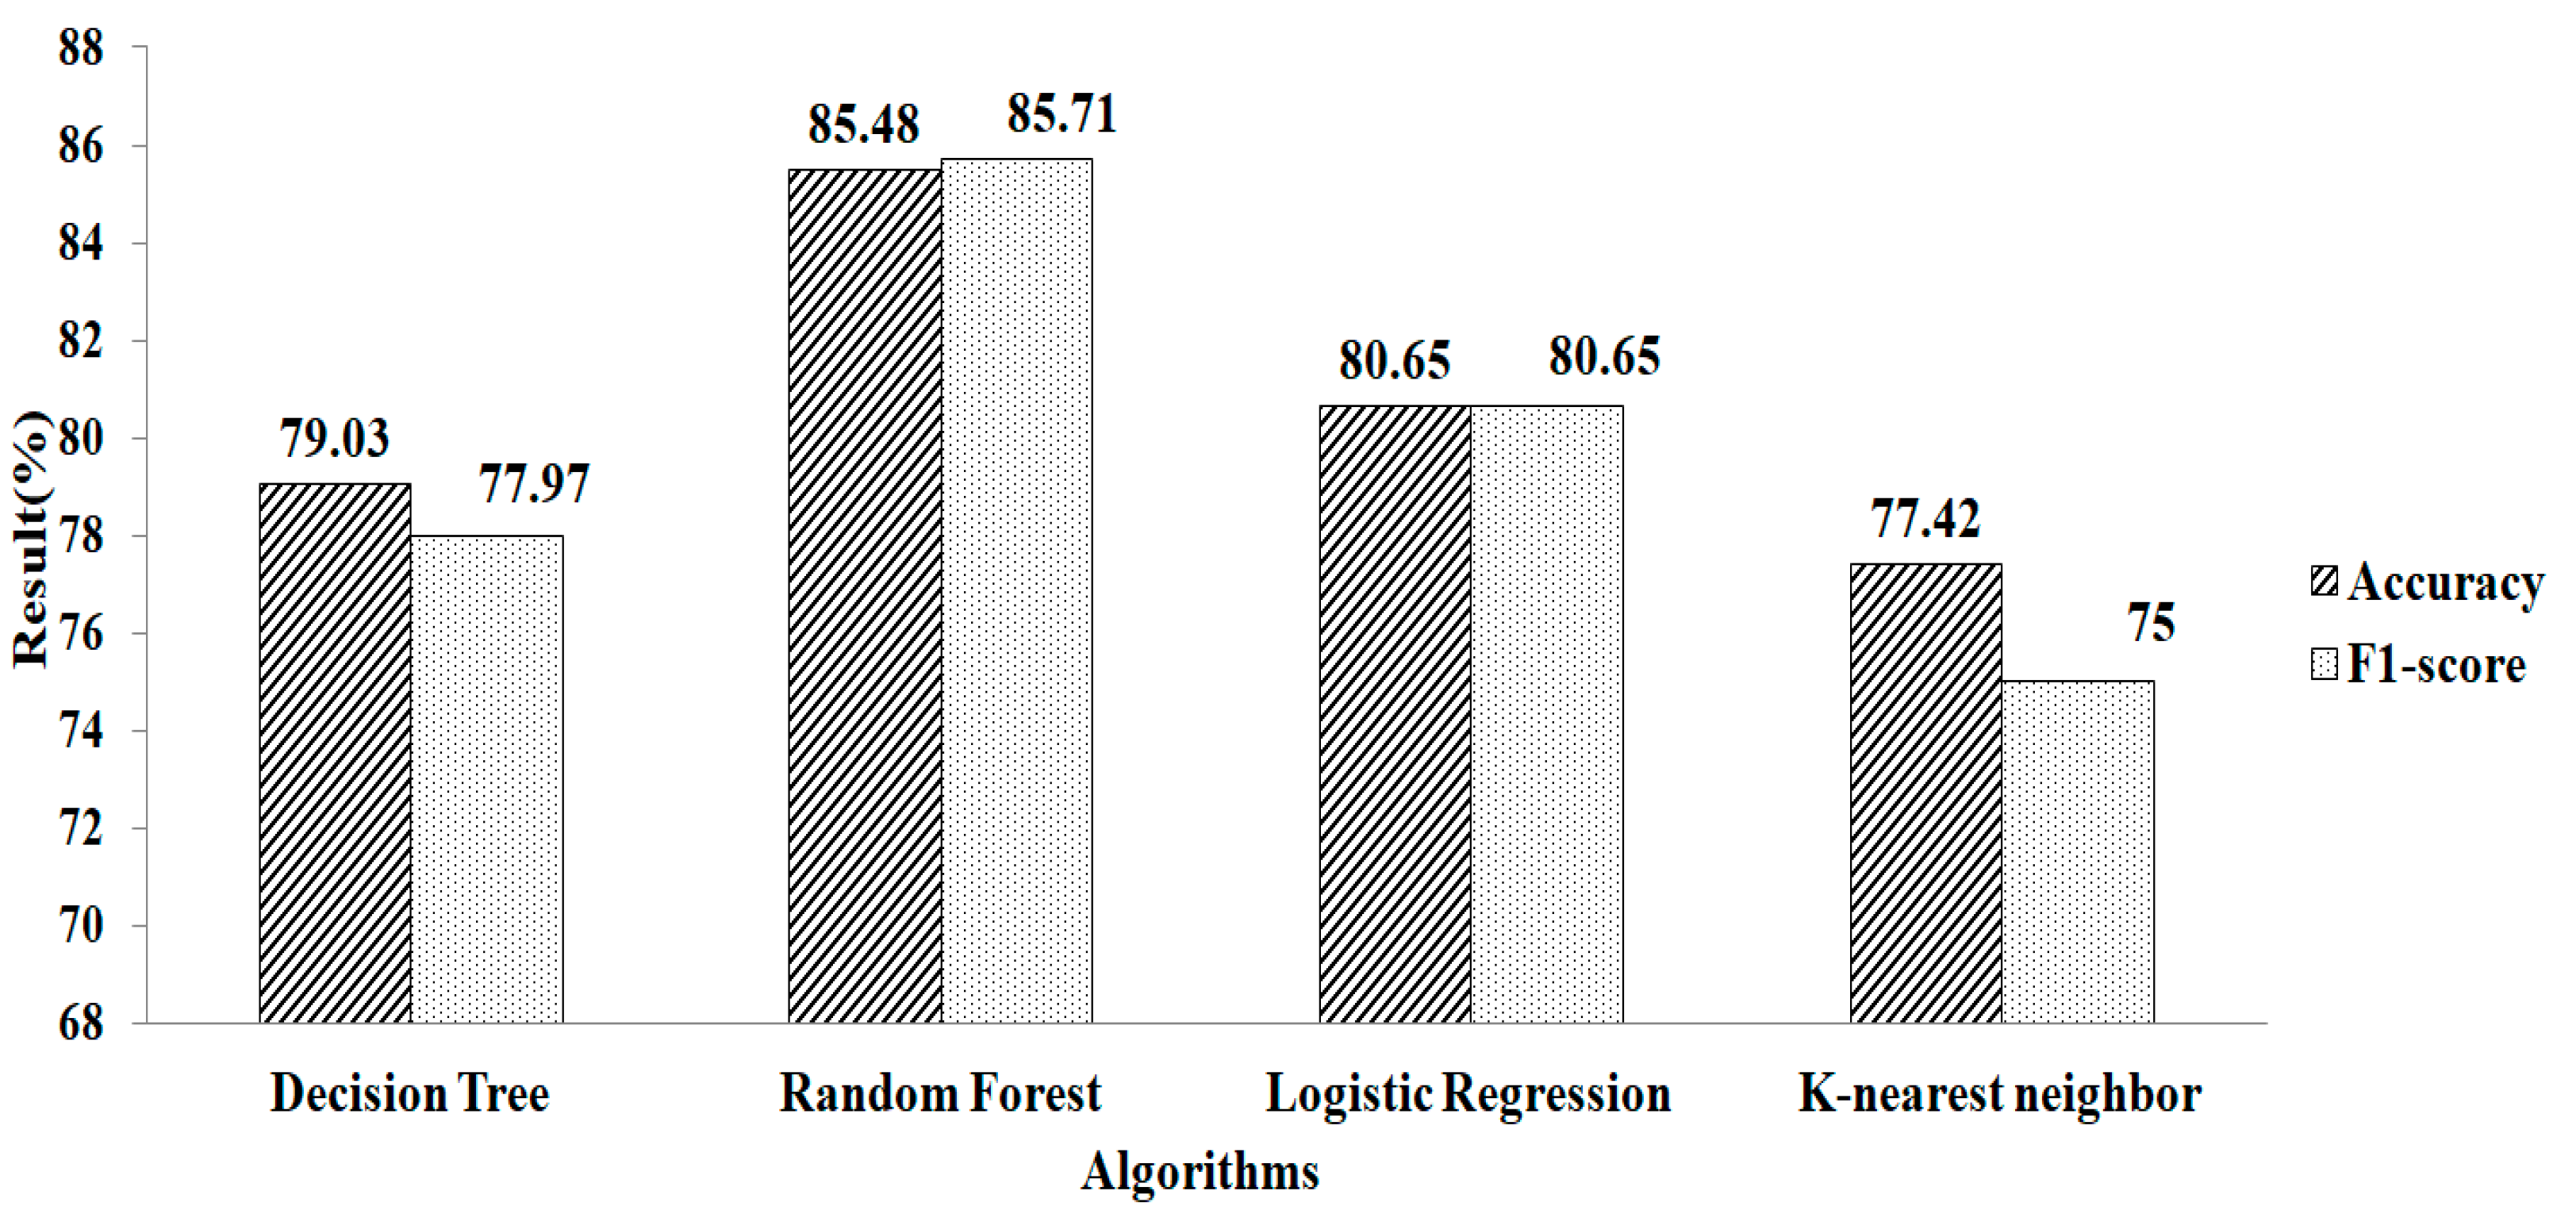
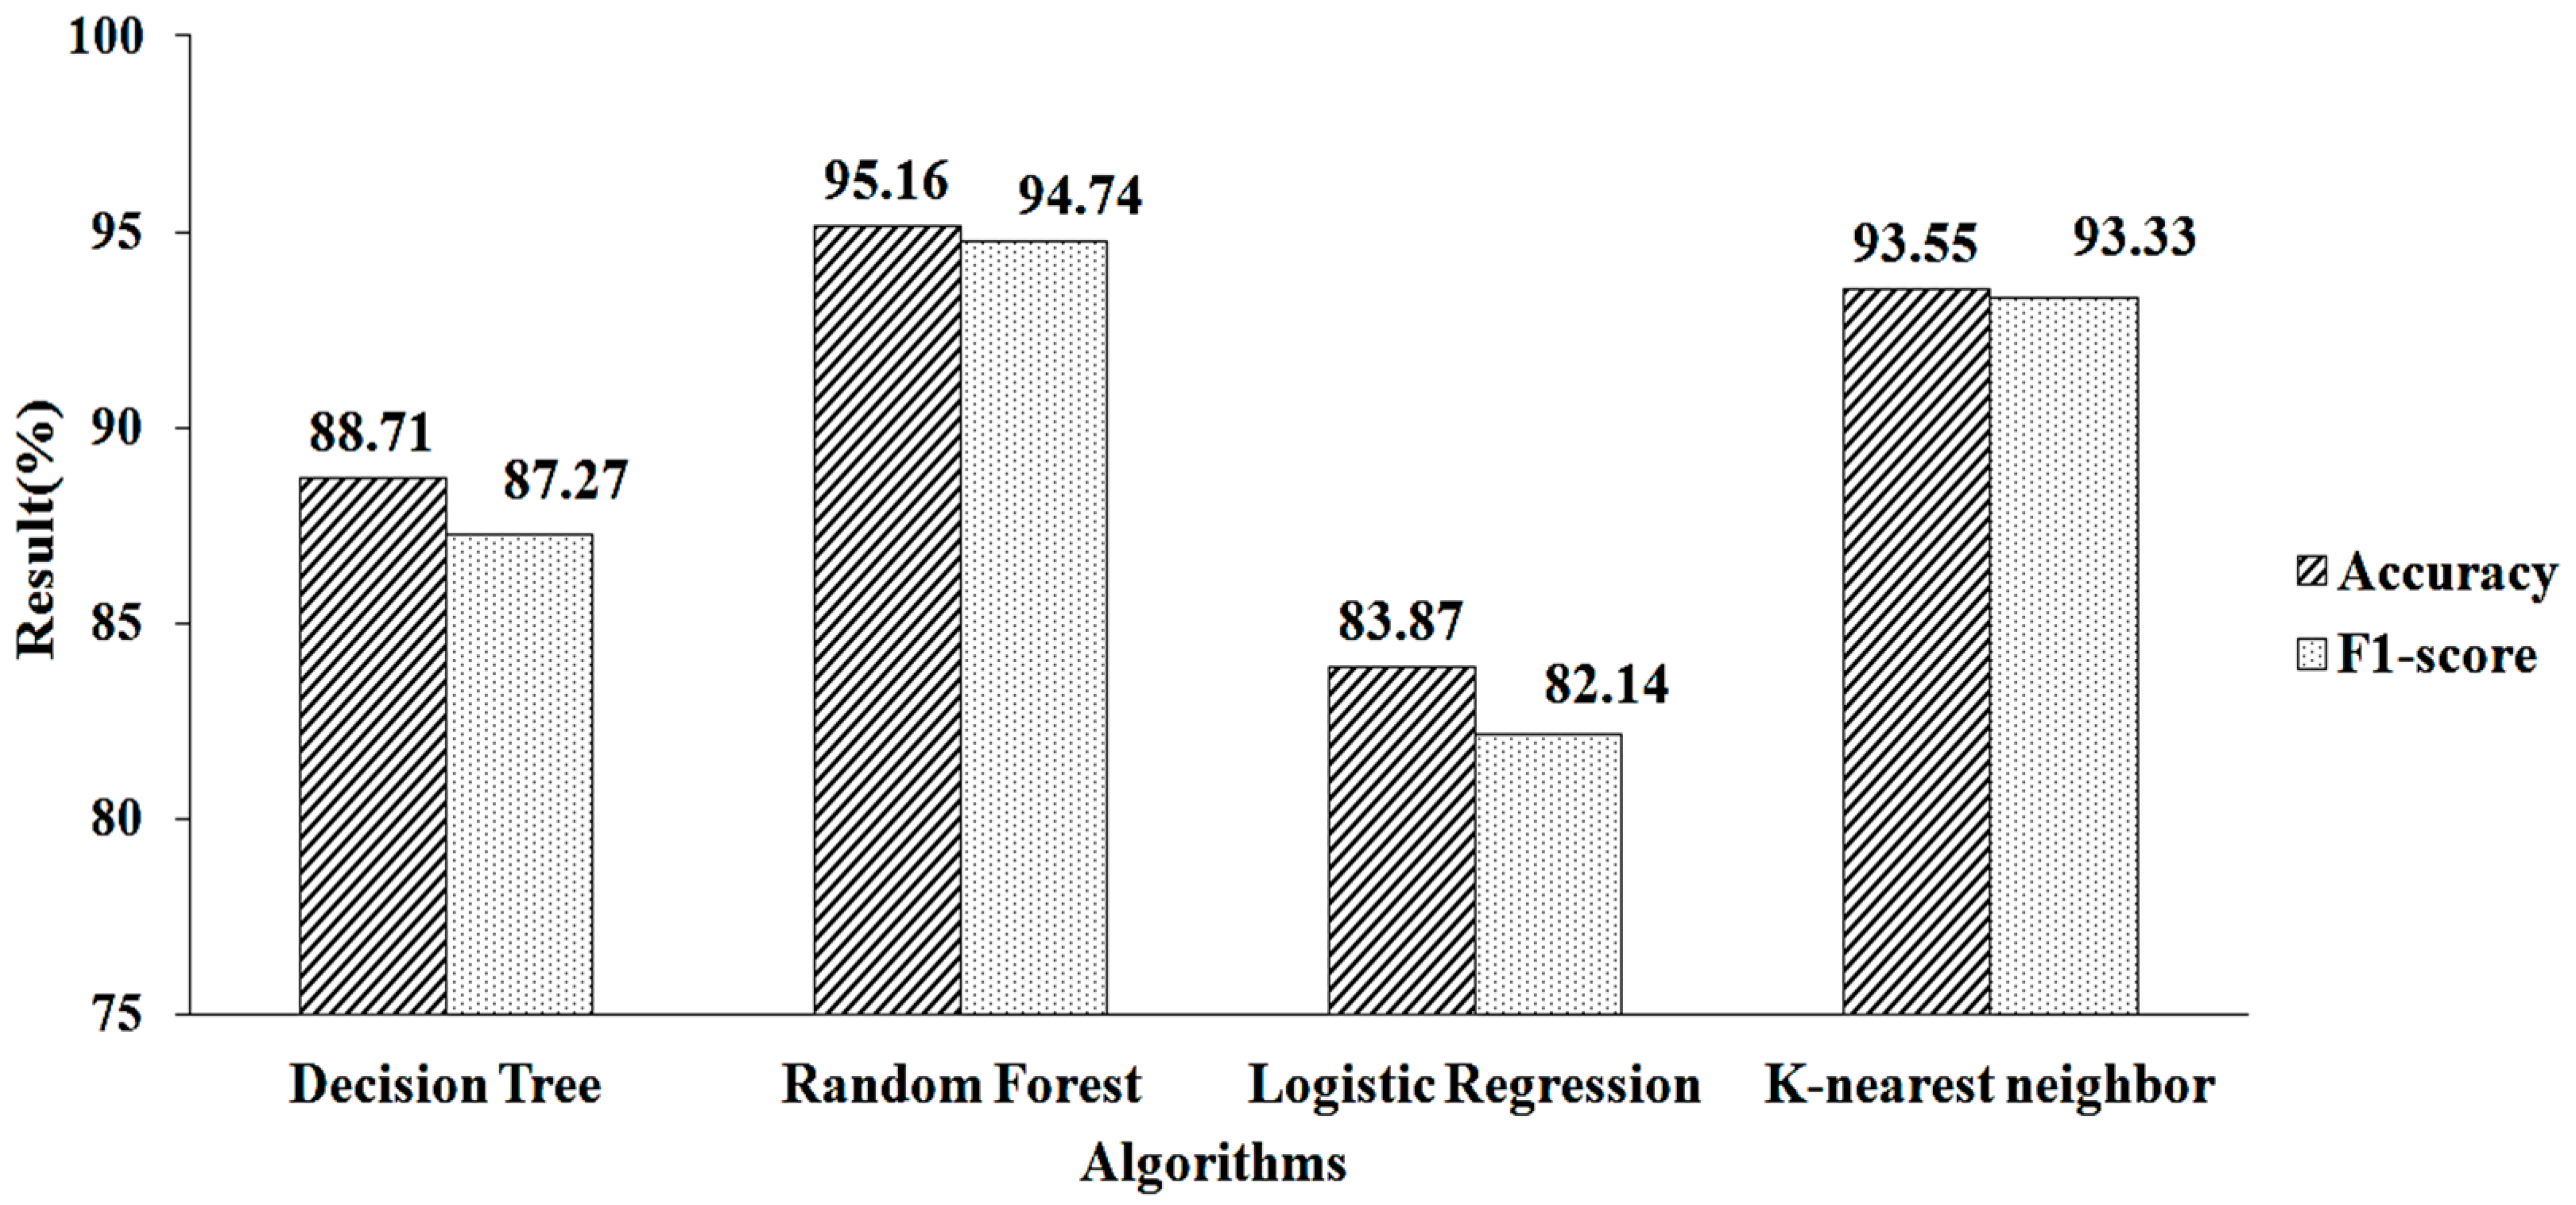
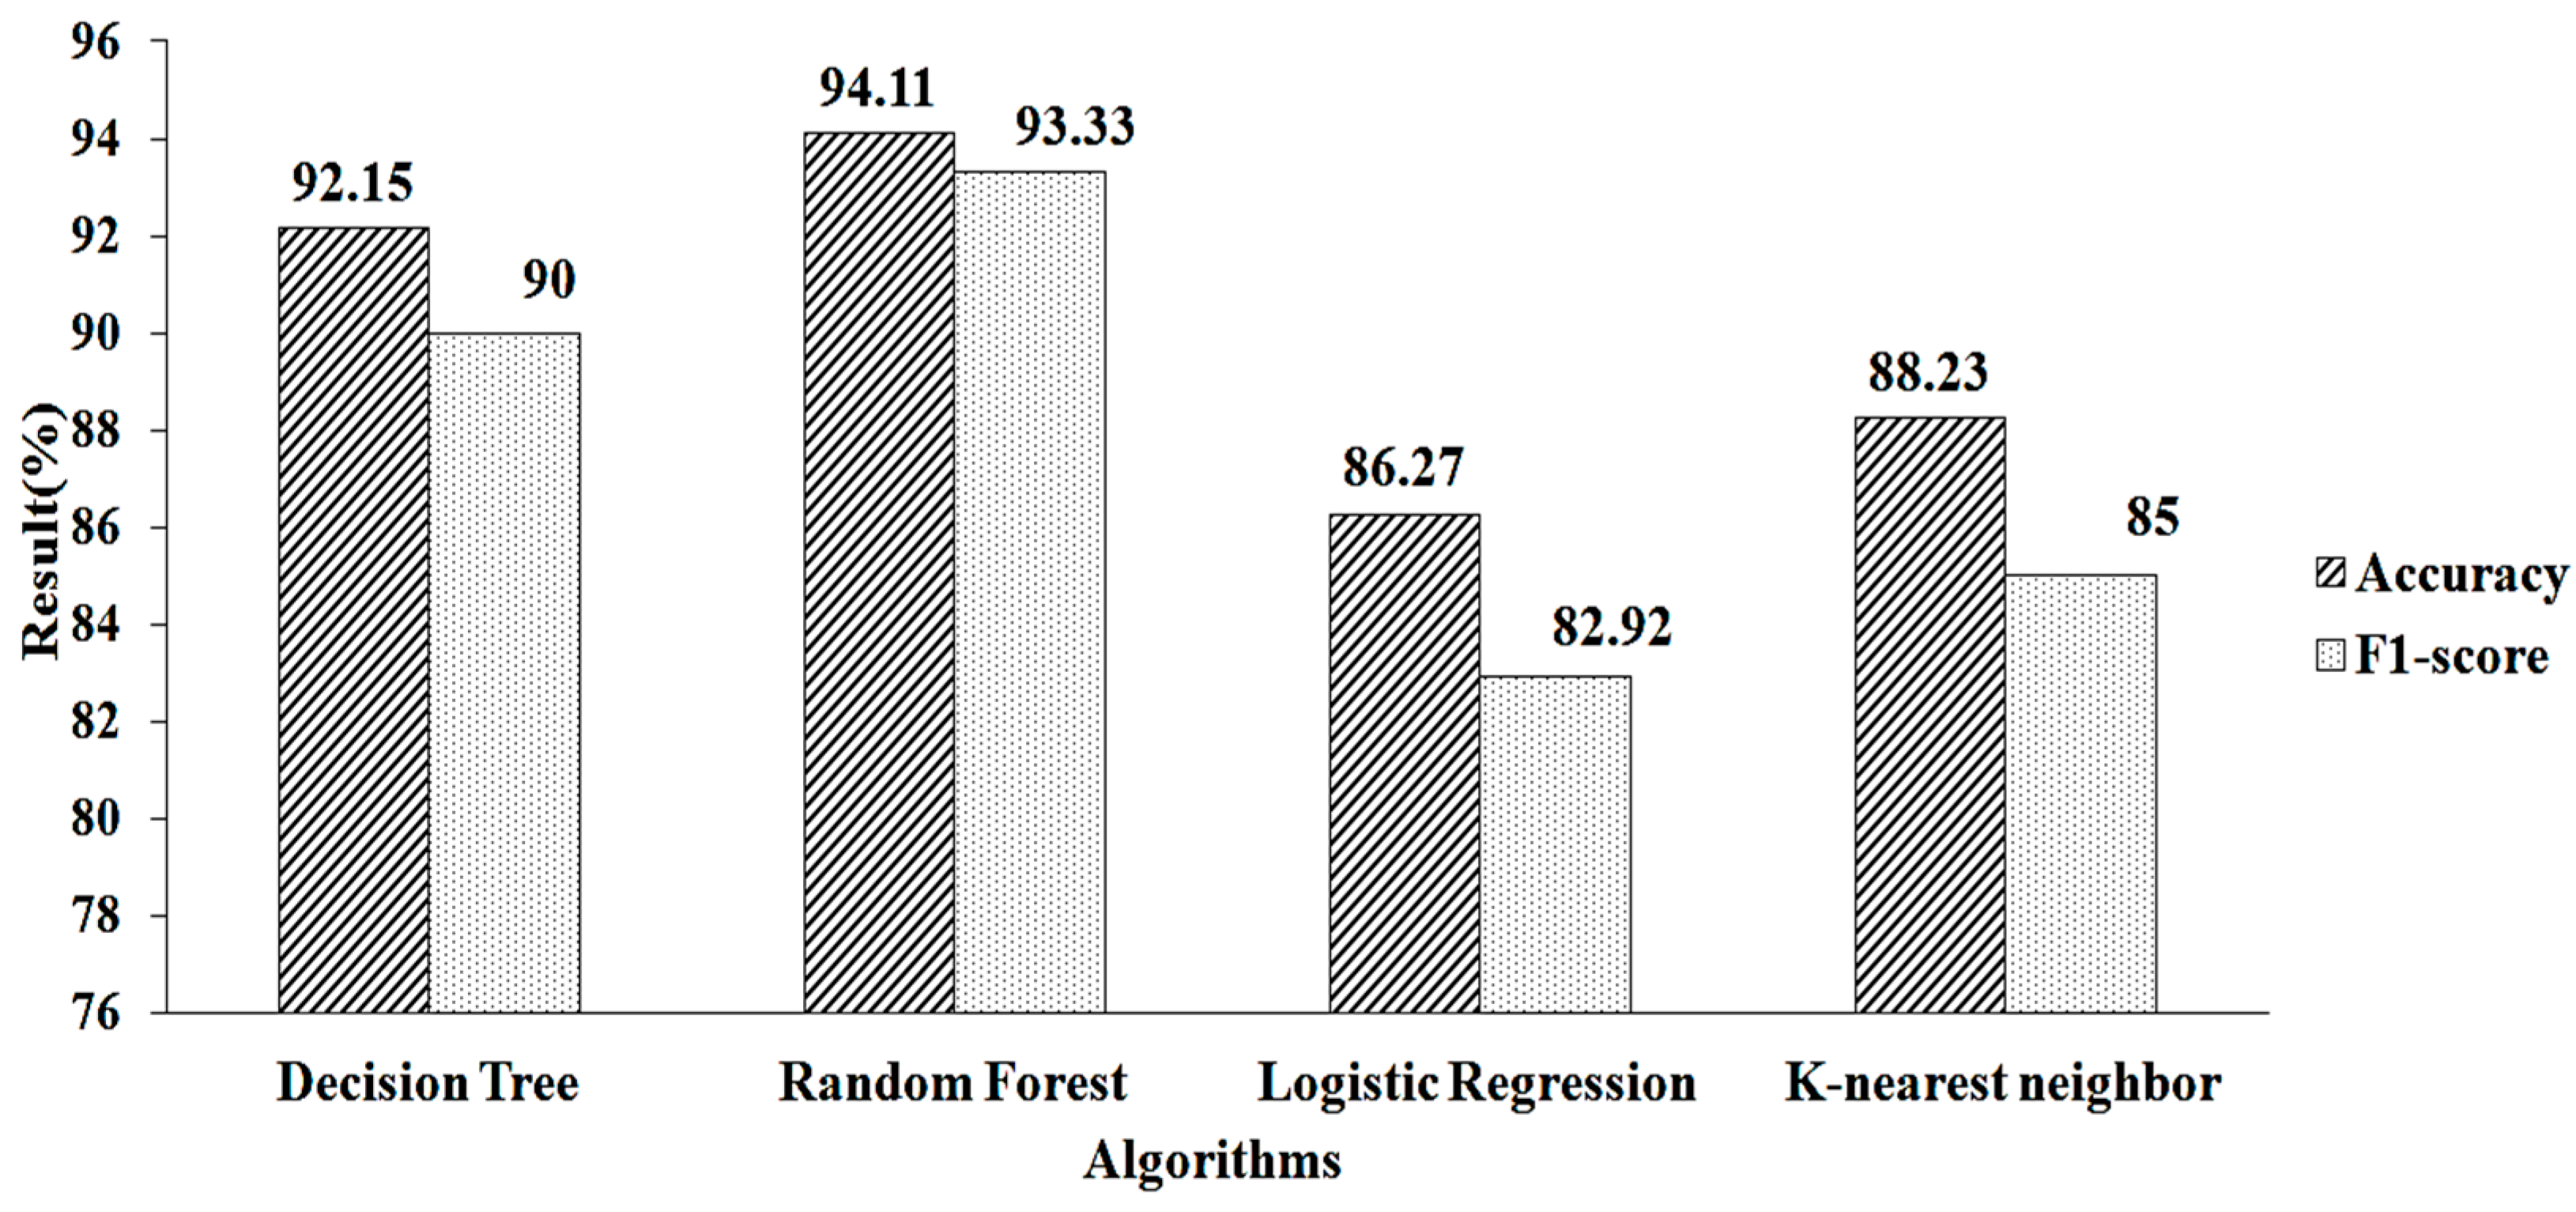
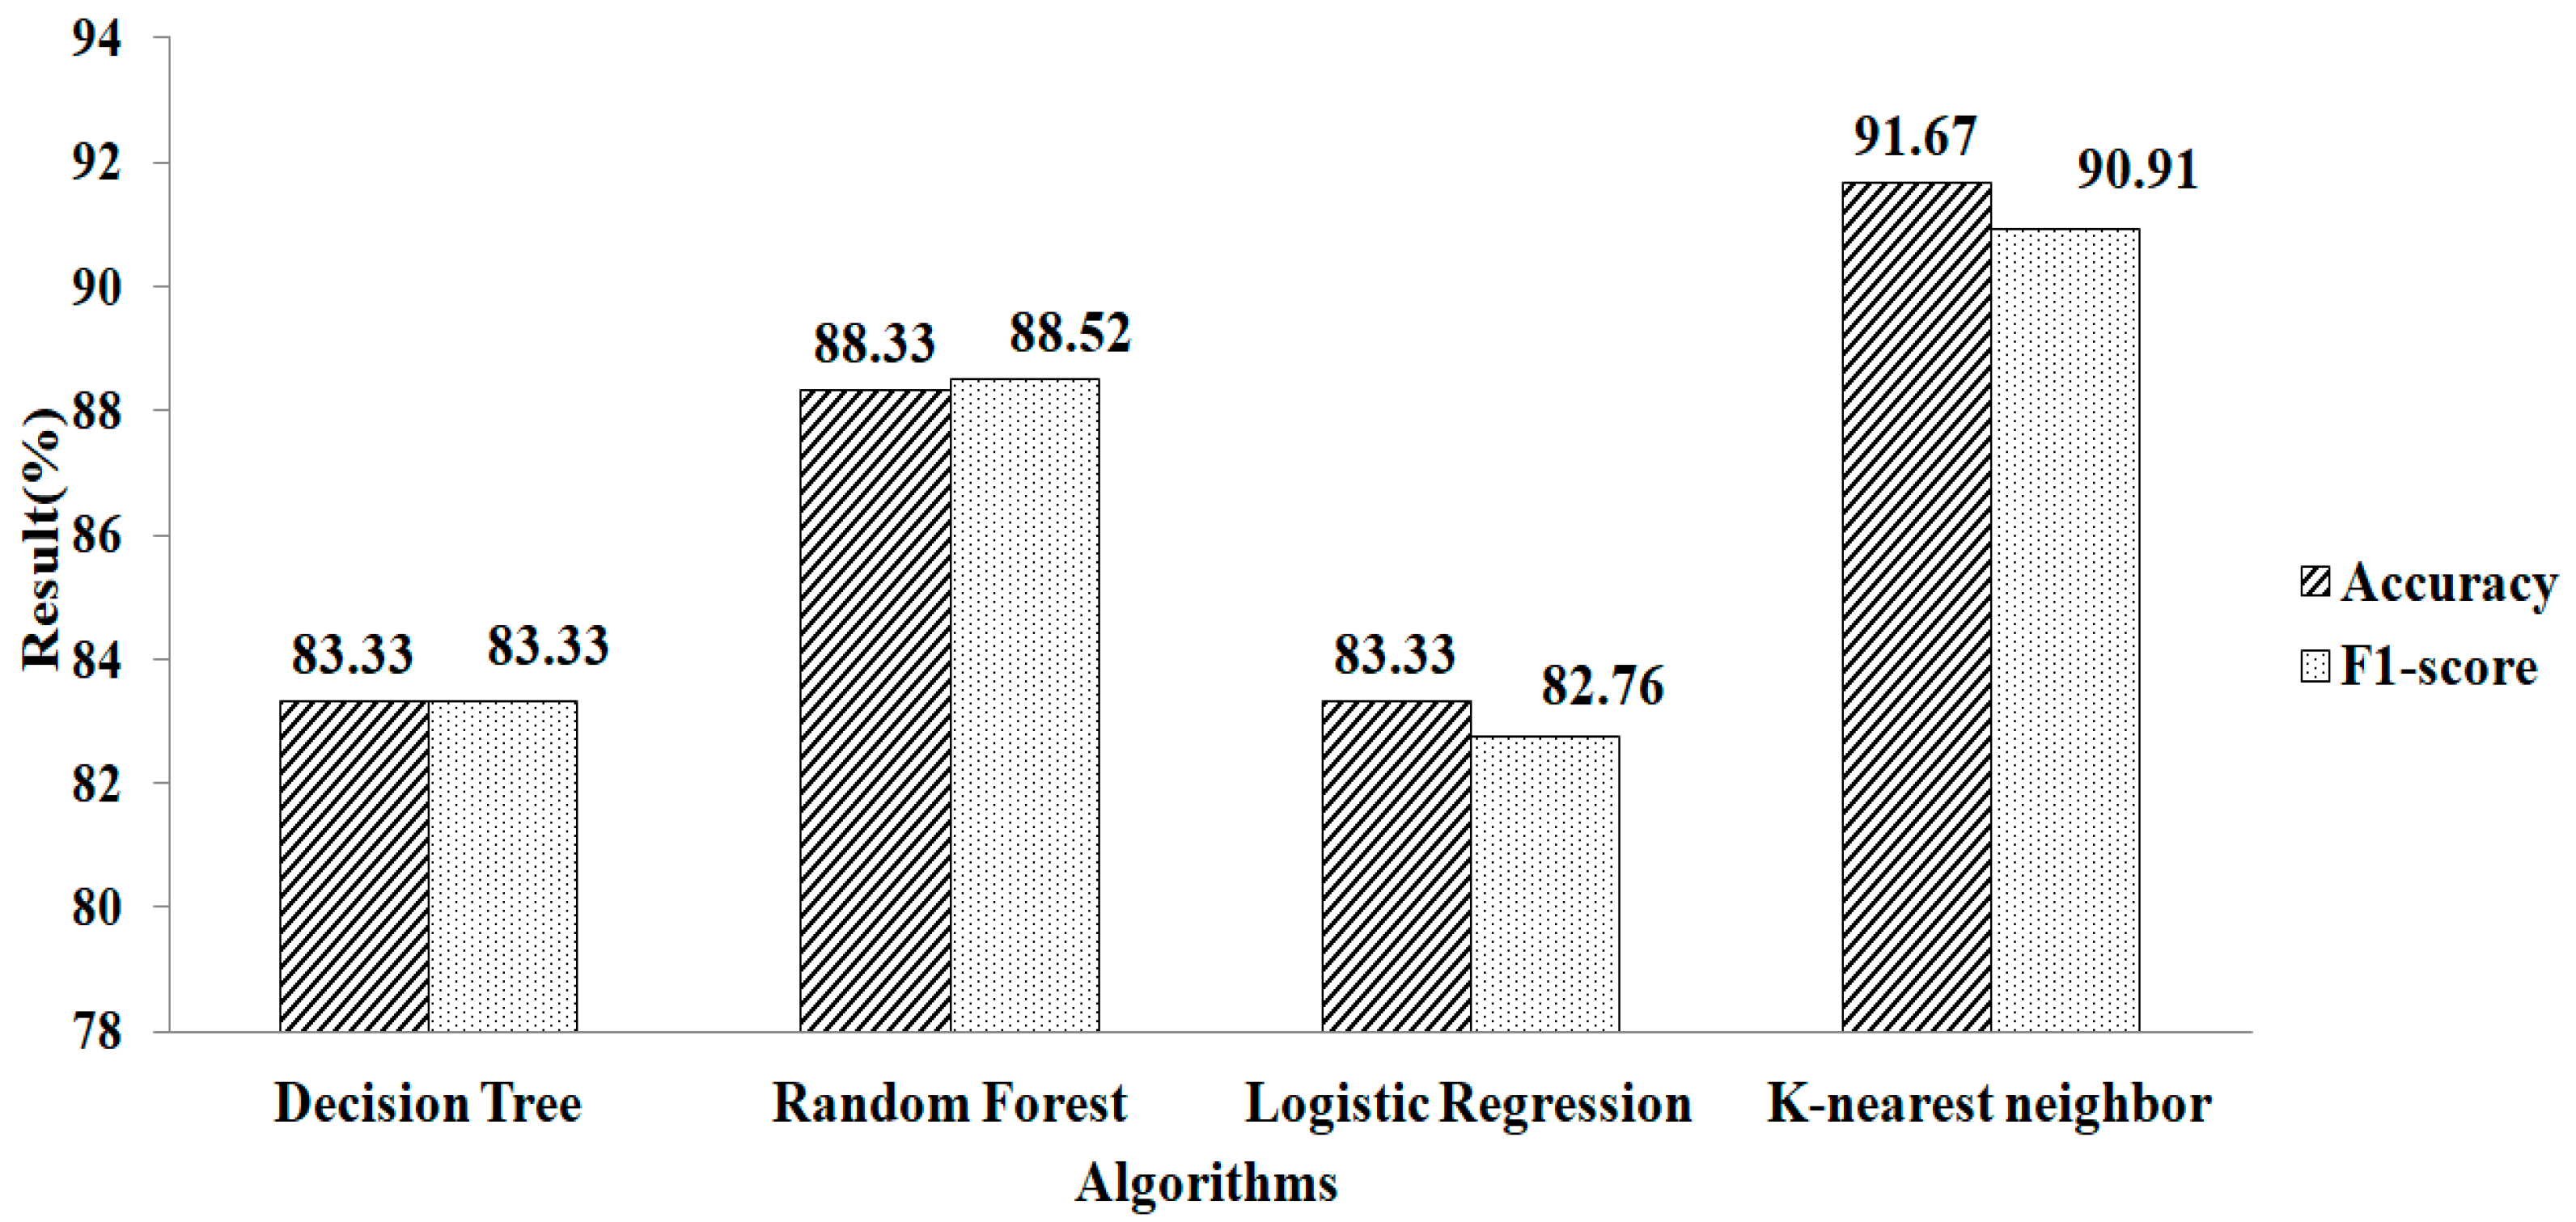
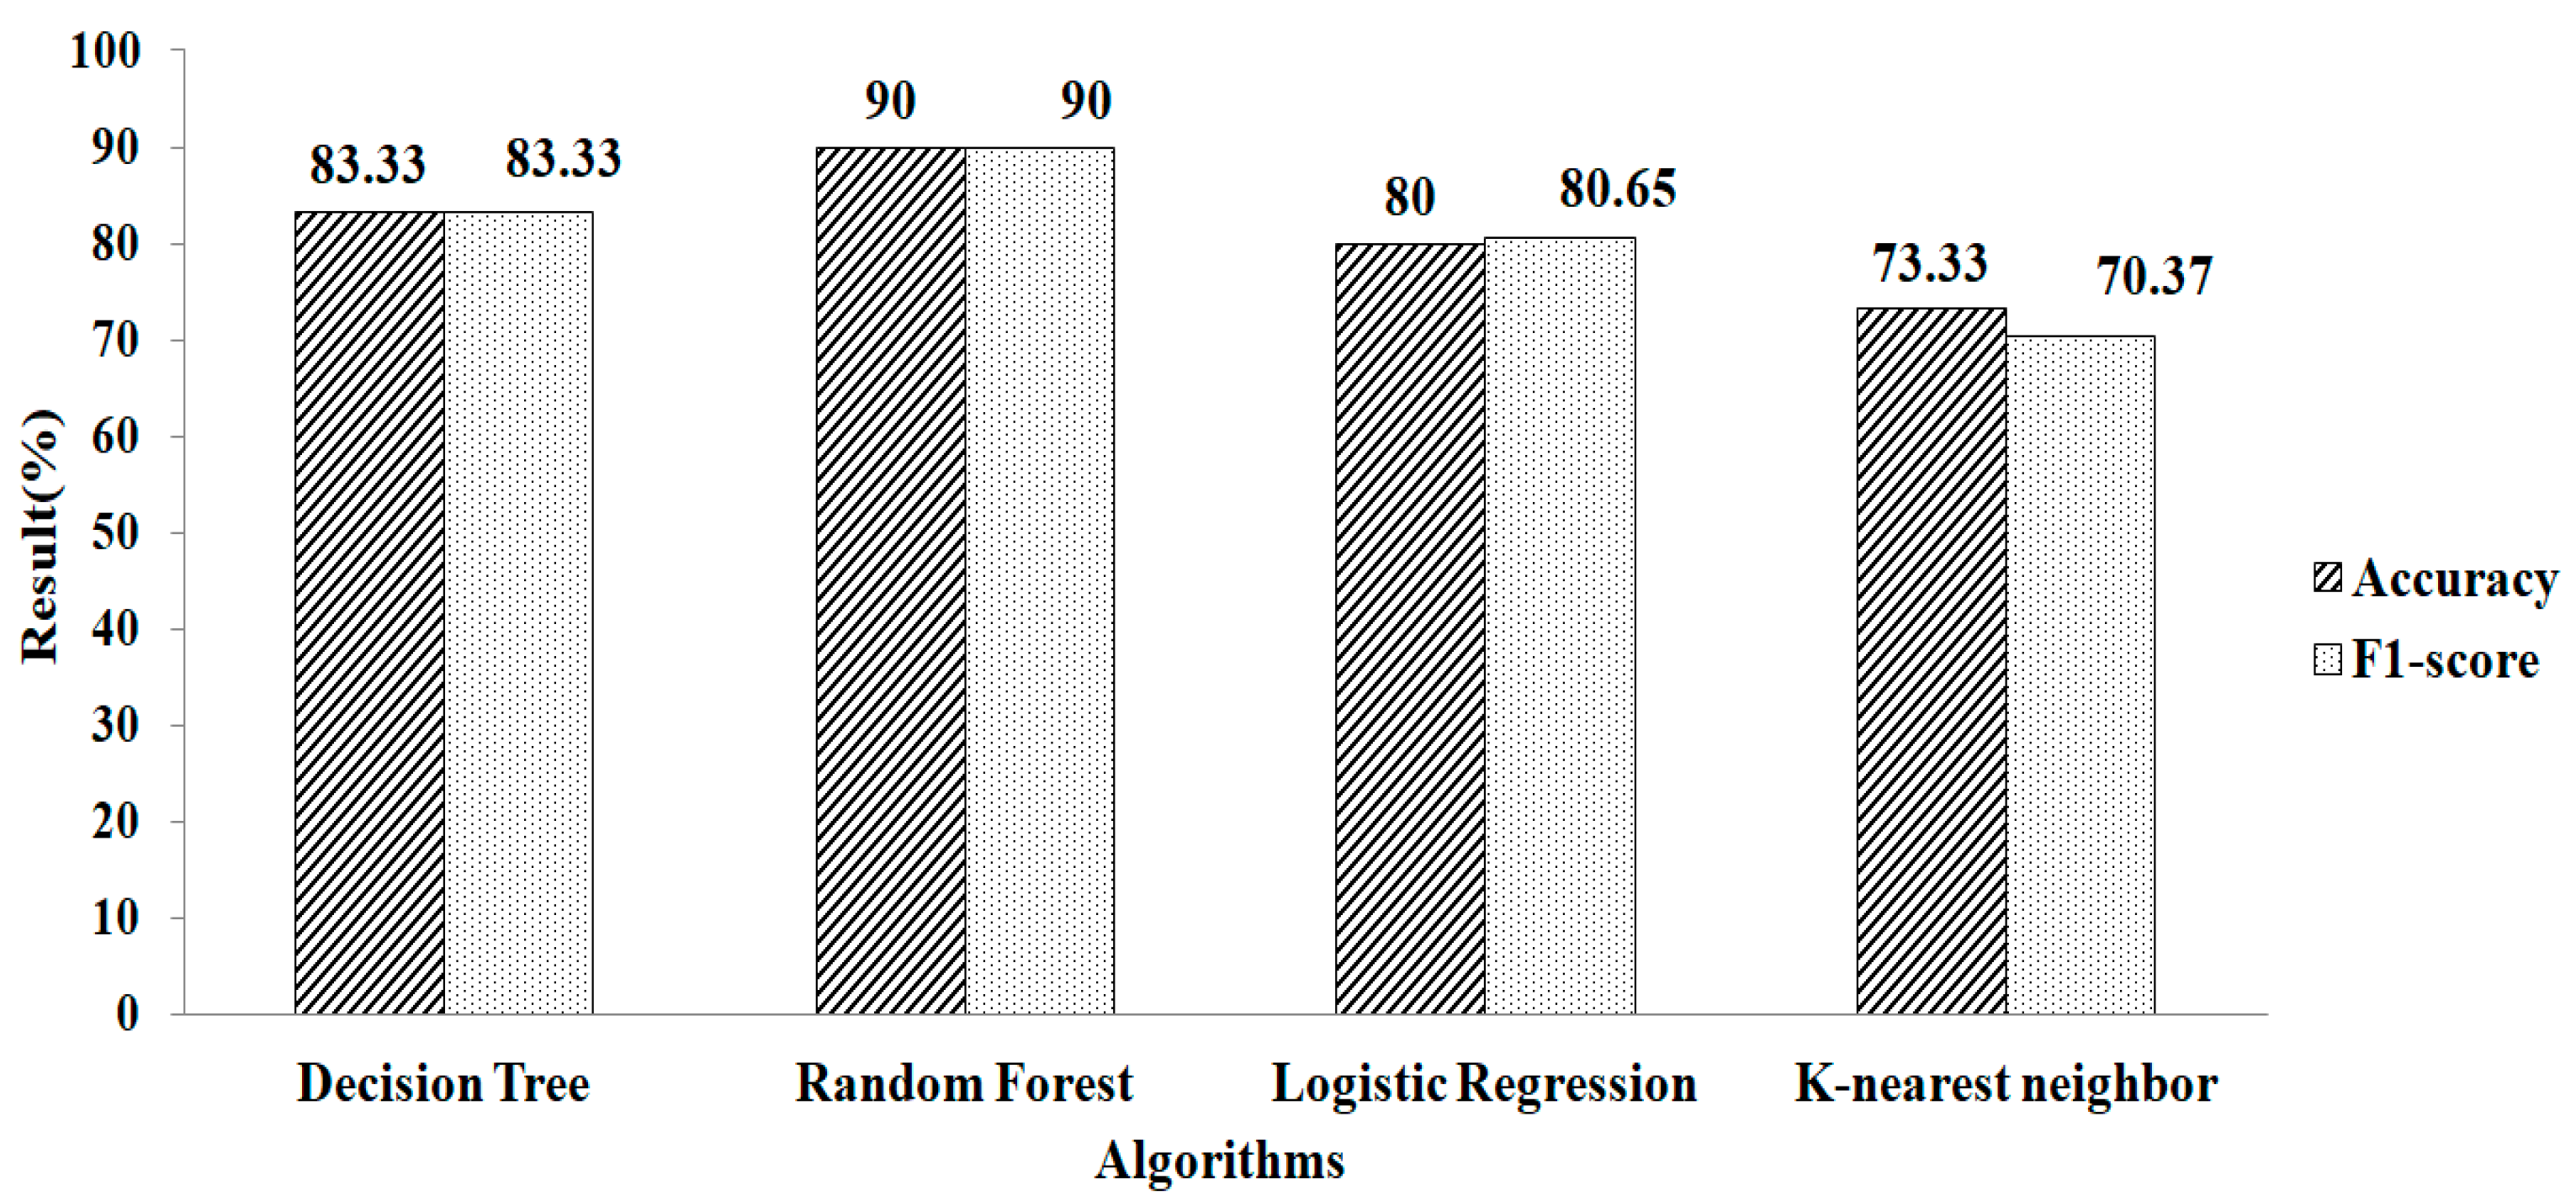
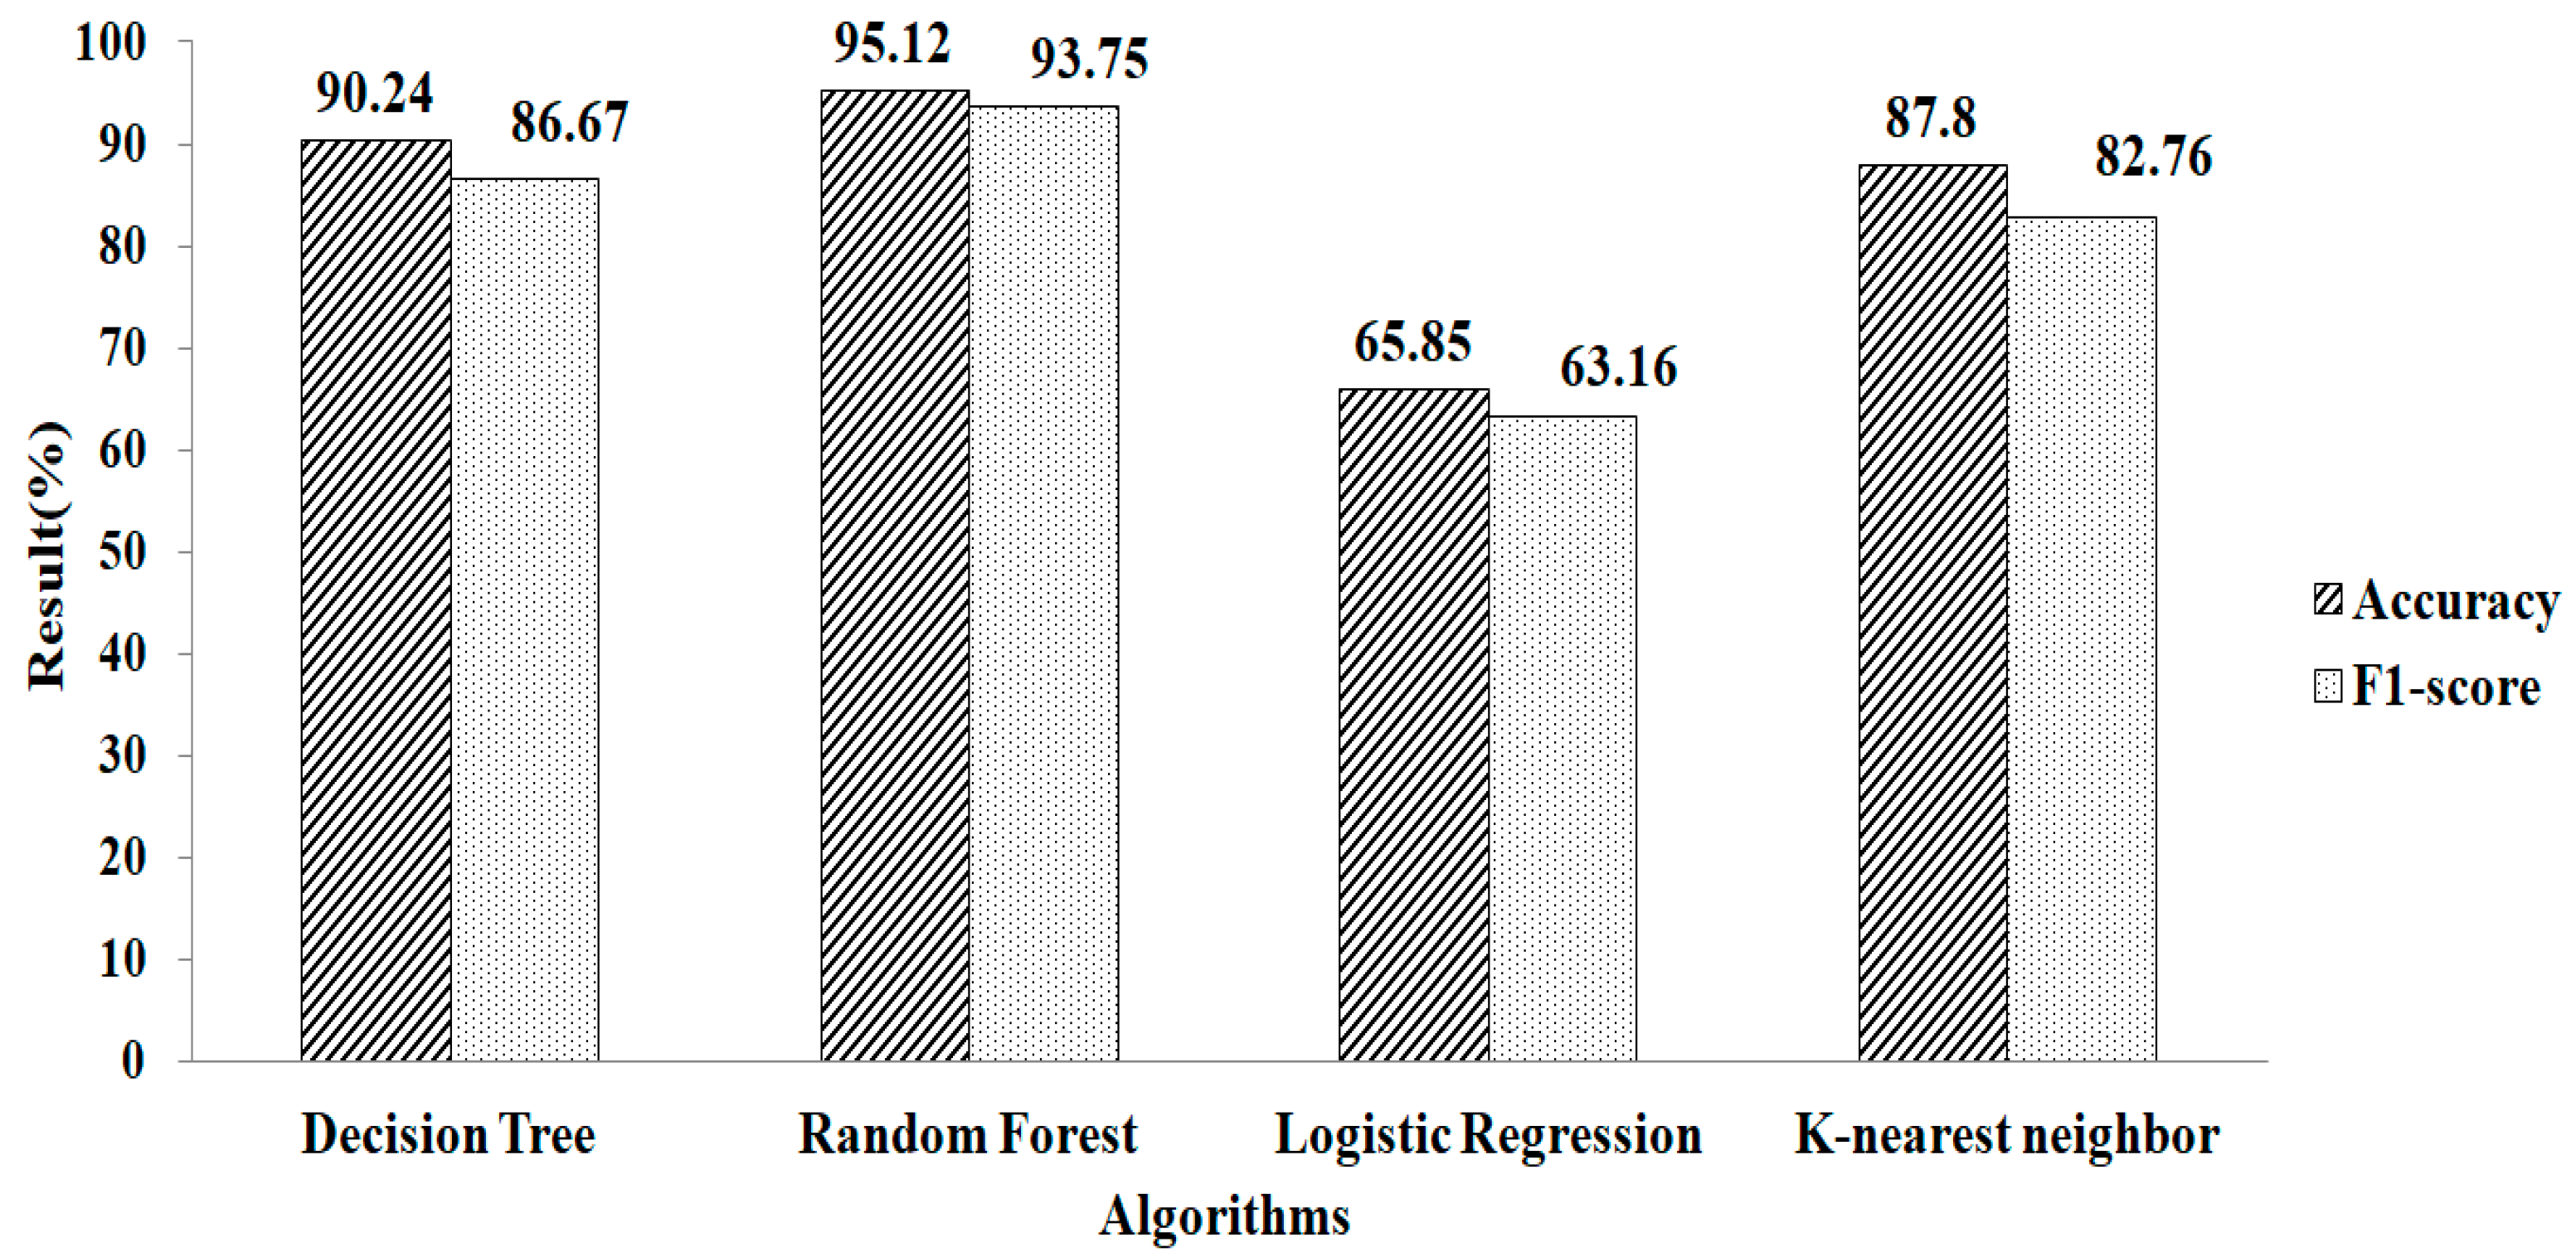
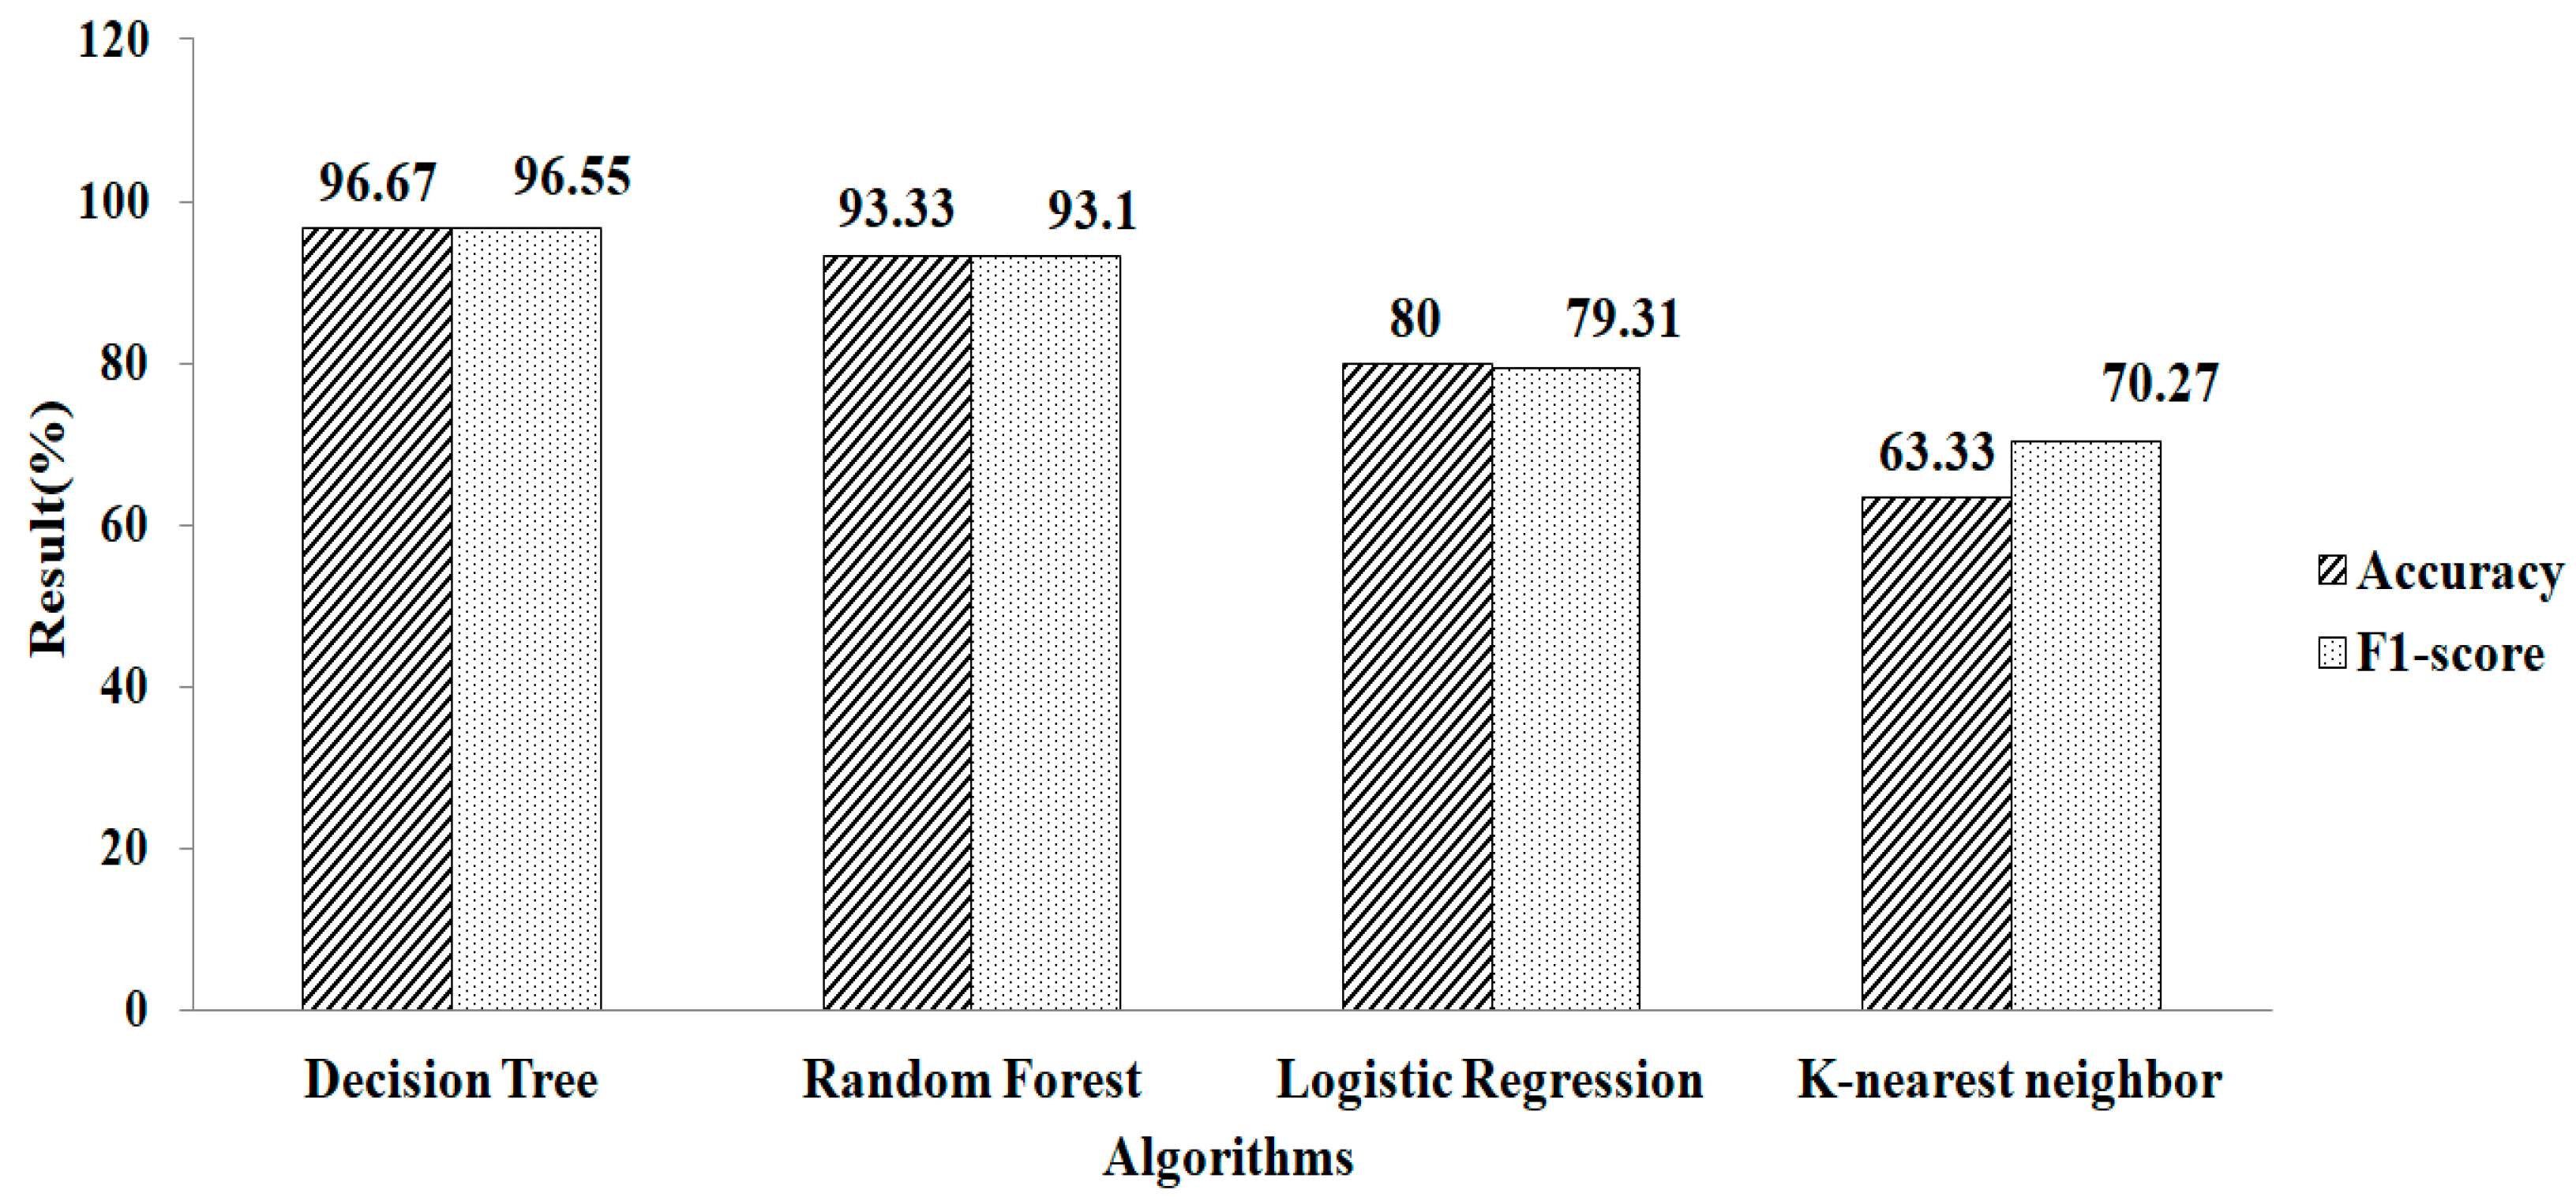
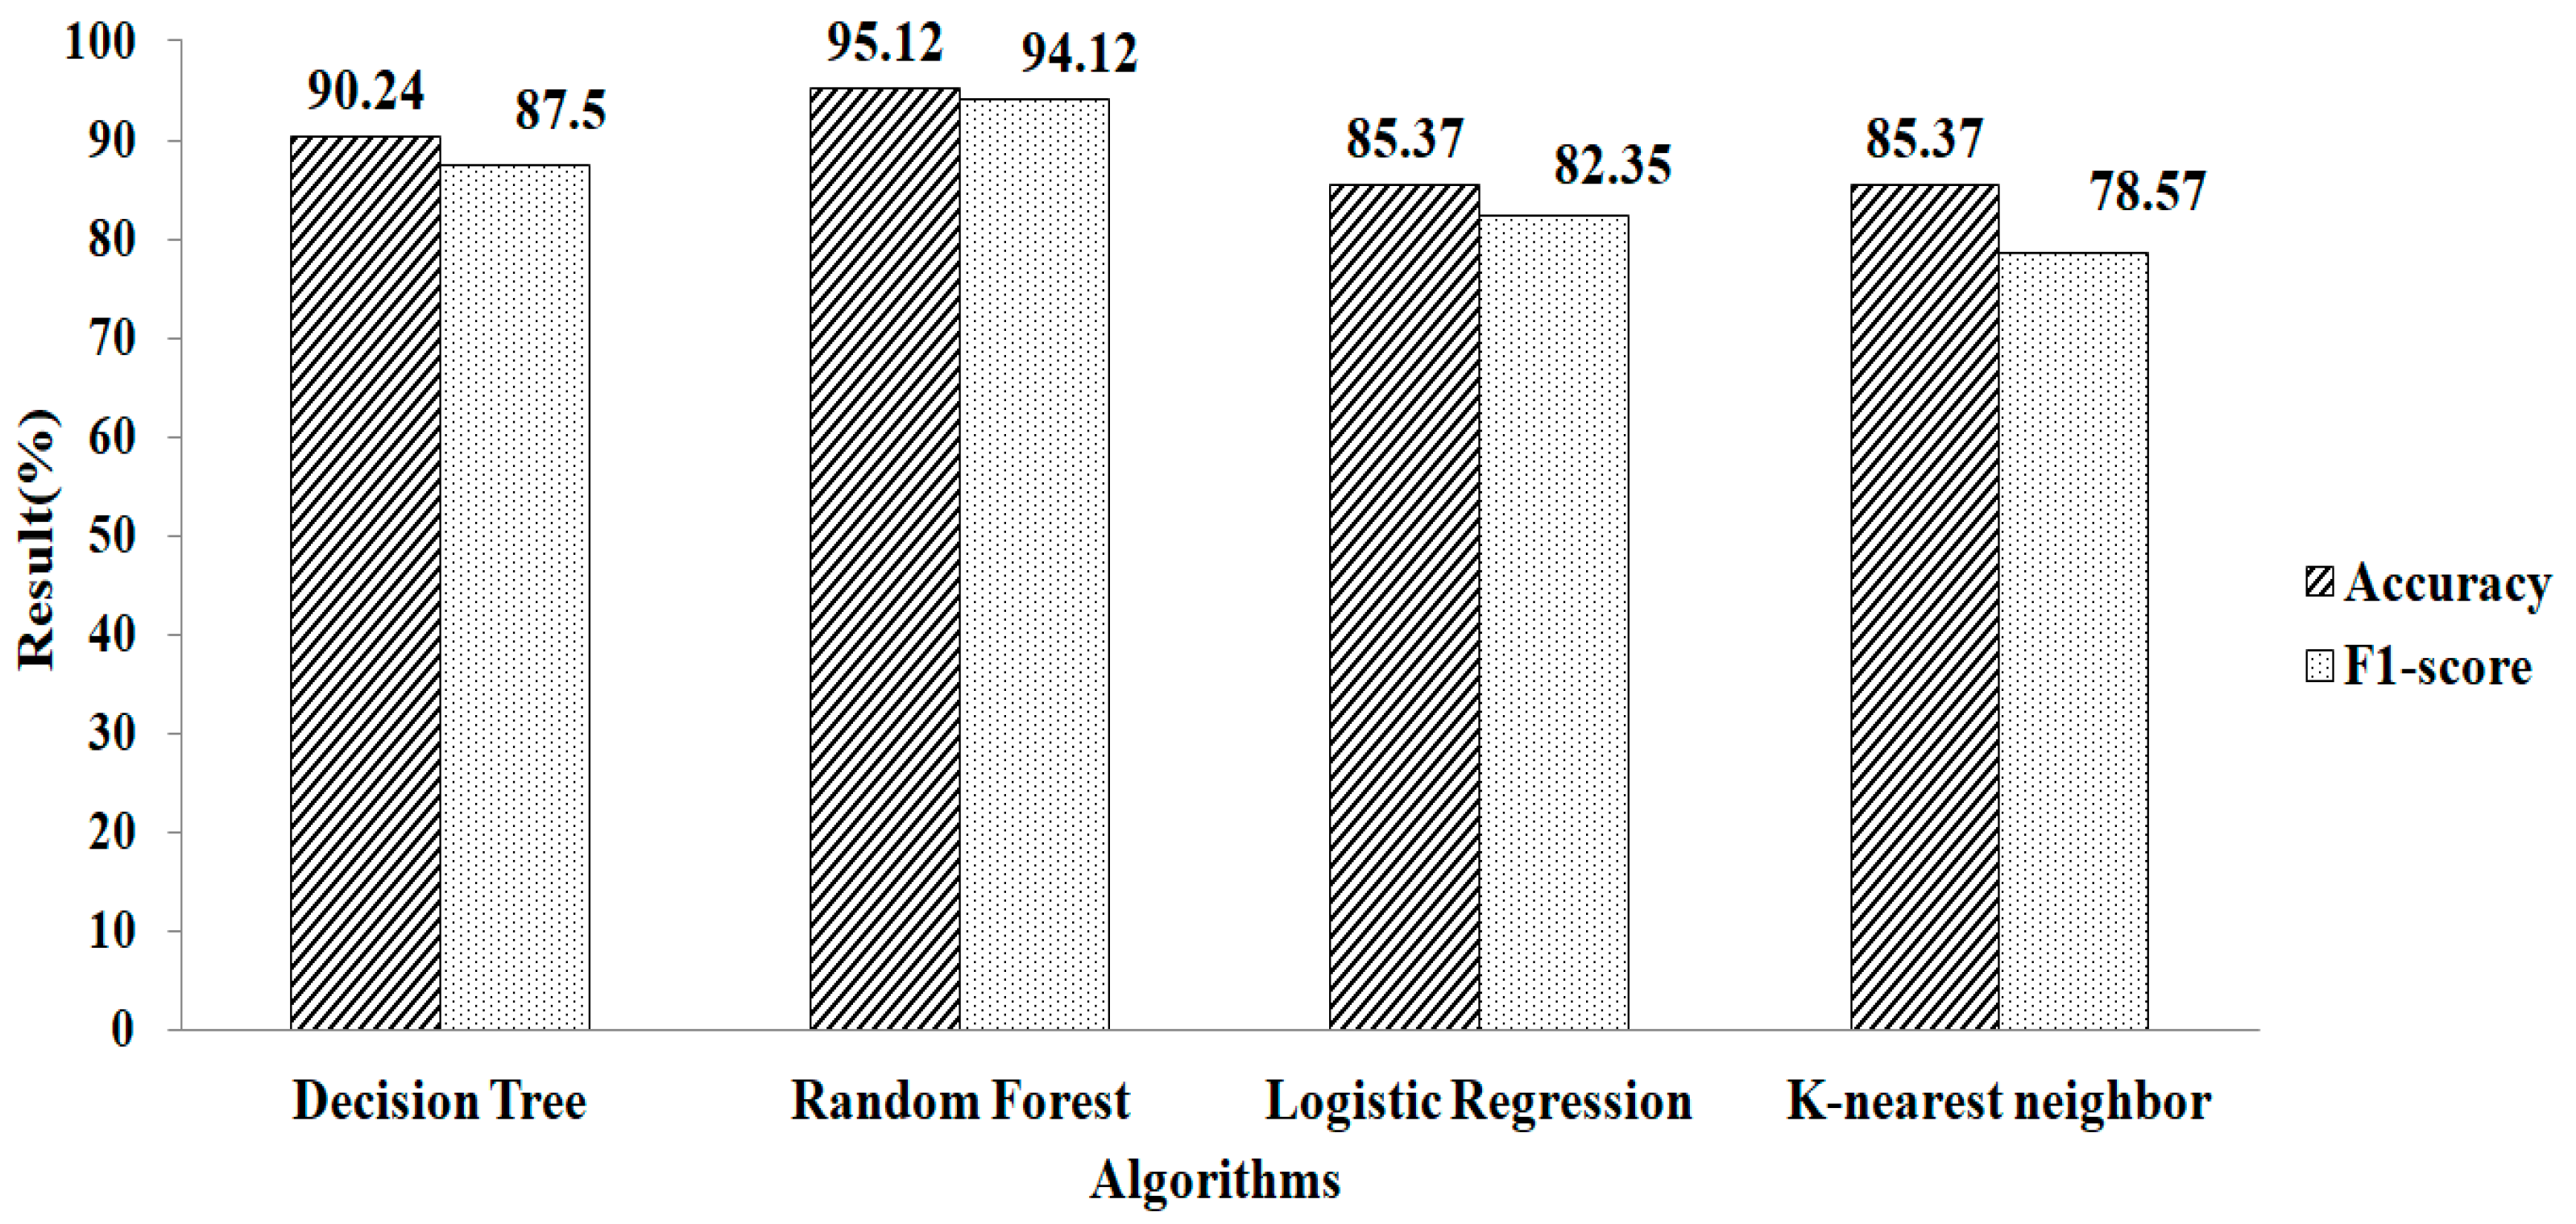
4. Result and Discussion
5. Comparison with Other Methods
6. Statistical Analysis
7. Conclusions
Author Contributions
Funding
Informed Consent Statement
Acknowledgments
Conflicts of Interest
Abbreviations
| DT | Decision Tree |
| FCNN | Fuzzy Convolutional Neural Network (FCNN) |
| GA | Genetic Algorithm |
| GAO | Genetic Algorithm Optimization |
| HCC | Hepatocellular Carcinoma |
| k-NN | k-Nearest Neighbor |
| LASSO | Least Absolute Shrinkage and Selection Operator |
| NCA | Neighborhood Components Analysis |
| RF | Random Forest |
| RFE | Recursive Feature Elimination |
| RFE-GB | Recursive Feature Elimination with Gradient Boosting |
| SMOTE | Synthetic Minority Over-sampling Technique |
References
- Abdar, M.; Zomorodi-Moghadam, M.; Das, R.; Ting, I.-H. Performance analysis of classification algorithms on early detection of liver disease. Expert Syst. Appl. 2017, 67, 239–251. [Google Scholar] [CrossRef]
- Akter, L.; Islam, M.M. Hepatocellular Carcinoma Patient’s Survival Prediction Using Oversampling and Machine Learning Techniques. In Proceedings of the 2021 2nd International Conference on Robotics, Electrical and Signal Processing Techniques (ICREST), Dhaka, Bangladesh, 5–7 January 2021; IEEE: New York, NY, USA, 2021. [Google Scholar] [CrossRef]
- Ali, L.; Khelil, K.; Wajid, S.K.; Hussain, Z.U.; Shah, M.A.; Howard, A.; Adeel, A.; Shah, A.A.; Sudhakar, U.; Howard, N. Machine learning based computer-aided diagnosis of liver tumours. In Proceedings of the 2017 IEEE 16th International Conference on Cognitive Informatics & Cognitive Computing (ICCI* CC), Oxford, UK, 26–28 July 2017; IEEE: New York, NY, USA, 2017. [Google Scholar] [CrossRef]
- Amutha, M.J.; Soundar, K.R.; Piramu, M.; Murugesan, K. A Survey on Machine Learning Algorithms for Cardiovascular Diseases Predic-tion. IJIRMPS 2021, 9, 45–48. [Google Scholar] [CrossRef]
- Bralet, M.-P.; Regimbeau, J.-M.; Pineau, P.; Dubois, S.; Loas, G.; Degos, F.; Valla, D.; Belghiti, J.; Degott, C.; Terris, B. Hepatocellular carcinoma occurring in nonfibrotic liver: Epidemiologic and histopathologic analysis of 80 French cases. Hepatology 2000, 32, 200–204. [Google Scholar] [CrossRef] [PubMed]
- Cawley, G.C. Causal & non-causal feature selection for ridge regression. In Proceedings of the Workshop on the Causation and Prediction Challenge at WCCI, Hong Kong, China, 1–6 June 2008; PMLR: Bristol, UK, 2008. [Google Scholar]
- Chandrakar, P.; Shrivas, A.; Sahu, N. Design of a Novel Ensemble Model of Classification Technique for Gene-Expression Data of Lung Cancer with Modified Genetic Algorithm. EAI Endorsed Trans. Pervasive Health Technol. 2021, 7, e2. [Google Scholar] [CrossRef]
- Chaturvedi, A.; Gupta, A.; Rajpoot, V. Parameterized Comparison of Regularized Regression Models to Develop Models for Real Estate. In IOP Conference Series: Materials Science and Engineering; IOP Publishing: Bristol, UK, 2021. [Google Scholar] [CrossRef]
- Ding, Y.; Wilkins, D. Improving the Performance of SVM-RFE to Select Genes in Microarray Data. In BMC Bioinformatics; Springer: Berlin/Heidelberg, Germany, 2006. [Google Scholar] [CrossRef]
- Dong, R.; Yang, X.; Zhang, X.; Gao, P.; Ke, A.; Sun, H.-C.; Zhou, J.; Fan, J.; Cai, J.; Shi, G. Predicting overall survival of patients with hepatocellular carcinoma using a three-category method based on DNA methylation and machine learning. J. Cell. Mol. Med. 2019, 23, 3369–3374. [Google Scholar] [CrossRef]
- Duan, K.-B.; Rajapakse, J.C.; Nguyen, M.N. One-Versus-One and One-Versus-All Multiclass SVM-RFE for Gene Selection in Cancer Classification. In European Conference on Evolutionary Computation, Machine Learning and Data Mining in Bioinformatics; Springer: Berlin/Heidelberg, Germany, 2007. [Google Scholar] [CrossRef]
- Etzioni, R.; Urban, N.; Ramsey, S.D.; McIntosh, M.W.; Schwartz, S.M.; Reid, B.J.; Radich, J.P.; Anderson, G.; Hartwell, L. The case for early detection. Nat. Cancer 2003, 3, 243–252. [Google Scholar] [CrossRef]
- Ghazikhani, A.; Yazdi, H.S.; Monsefi, R. Class imbalance handling using wrapper-based random oversampling. In Proceedings of the 20th Iranian Conference on Electrical Engineering (ICEE2012), Tehran, Iran, 15–17 May 2012; IEEE: New York, NY, USA, 2012. [Google Scholar] [CrossRef]
- Grando-Lemaire, V.; Guettier, C.; Chevret, S.; Beaugrand, M.; Trinchet, J.-C. Hepatocellular carcinoma without cirrhosis in the West: Epidemiological factors and histopathology of the non-tumorous liver. J. Hepatol. 1999, 31, 508–513. [Google Scholar] [CrossRef]
- Granitto, P.; Furlanello, C.; Biasioli, F.; Gasperi, F. Recursive feature elimination with random forest for PTR-MS analysis of agroindustrial products. Chemom. Intell. Lab. Syst. 2006, 83, 83–90. [Google Scholar] [CrossRef]
- Guo, Y.; Chung, F.-L.; Li, G.; Zhang, L. Multi-Label Bioinformatics Data Classification with Ensemble Embedded Feature Selection. IEEE Access 2019, 7, 103863–103875. [Google Scholar] [CrossRef]
- Hashem, S.; ElHefnawi, M.; Habashy, S.; El-Adawy, M.; Esmat, G.; El-Akel, W.; Abdelazziz, A.O.; Nabeel, M.M.; Abdelmaksoud, A.H.; Elbaz, T.M.; et al. Machine Learning Prediction Models for Diagnosing Hepatocellular Carcinoma with HCV-related Chronic Liver Disease. Comput. Methods Programs Biomed. 2020, 196, 105551. [Google Scholar] [CrossRef]
- Hjerpe, A. Computing Random Forests Variable Importance Measures (Vim) on Mixed Numerical and Categorical Data; DiVA: Umeå, Sweden, 2016. [Google Scholar]
- Jeyalakshmi, K. Weighted Synthetic Minority Over-Sampling Technique (WSMOTE) Algorithm and Ensemble Classifier for Hepatocellular Carcinoma (HCC) In Liver Disease System. Turk. J. Comput. Math. Educ. 2021, 12, 7473–7487. [Google Scholar] [CrossRef]
- Jeyalakshmi, R.R. Intelligence Ensemble-Based Feature Selection (Iefs) Algorithm and Fuzzy Convolutional Neural Network (Fcnn) for Hepatocellular Carcinoma (Hcc) in Liver Disease System. Ann. Rom. Soc. Cell Biol. 2021, 25, 4759–4782. [Google Scholar]
- Joshi, J.; Doshi, R.; Patel, J. Diagnosis and prognosis breast cancer using classification rules. Int. J. Eng. Res. Gen. Sci. 2014, 2, 315–323. [Google Scholar]
- Karegowda, A.G.; Manjunath, A.S.; Jayaram, M.A. Feature Subset Selection Problem using Wrapper Approach in Supervised Learning. Int. J. Comput. Appl. 2010, 1, 13–17. [Google Scholar] [CrossRef]
- Khan, I.U.; Aslam, N.; Alshehri, R.; Alzahrani, S.; Alghamdi, M.; Almalki, A.; Balabeed, M. Cervical Cancer Diagnosis Model Using Extreme Gradient Boosting and Bioinspired Firefly Optimization. Sci. Program. 2021, 2021, 5540024. [Google Scholar] [CrossRef]
- Kim, W.R. Epidemiology of hepatitis B in the United States. Hepatology 2009, 49, S28–S34. [Google Scholar] [CrossRef] [PubMed]
- Koh, K.; Kim, S.-J.; Boyd, S. An interior-point method for large-scale l1-regularized logistic regression. J. Mach. Learn. Res. 2007, 8, 1519–1555. [Google Scholar]
- Ali, M.A.; Balasubramanian, K.; Krishnamoorthy, G.D.; Muthusamy, S.; Pandiyan, S.; Panchal, H.; Mann, S.; Thangaraj, K.; El-Attar, N.E.; Abualigah, L.; et al. Classification of Glaucoma Based on Elephant-Herding Optimization Algorithm and Deep Belief Network. Electronics 2022, 11, 1763. [Google Scholar] [CrossRef]
- Houssein, E.H.; Abdelminaam, D.S.; Ibrahim, I.E.; Hassaballah, M.; Wazery, Y.M. A hybrid heartbeats classification approach based on marine predators algorithm and convolution neural networks. IEEE Access 2021, 9, 86194–86206. [Google Scholar] [CrossRef]
- Liu, Y.-X.; Liu, X.; Cen, C.; Li, X.; Liu, J.-M.; Ming, Z.-Y.; Yu, S.-F.; Tang, X.-F.; Zhou, L.; Yu, J.; et al. Comparison and development of advanced machine learning tools to predict nonalcoholic fatty liver disease: An extended study. Hepatobiliary Pancreat. Dis. Int. 2021, 20, 409–415. [Google Scholar] [CrossRef]
- Marinho, R.T.; Giria, J.; Moura, M.C. Rising costs and hospital admissions for hepatocellular carcinoma in Portugal (1993-2005). World J. Gastroenterol. WJG 2007, 13, 1522–1527. [Google Scholar] [CrossRef] [PubMed][Green Version]
- Muthukrishnan, R.; Rohini, R. LASSO: A feature selection technique in predictive modeling for machine learning. In Proceedings of the 2016 IEEE International Conference on Advances in Computer Applications (ICACA), Coimbatore, India, 24 October 2016; IEEE: New York, NY, USA, 2016. [Google Scholar] [CrossRef]
- Venkatachalam, K.; Prabhu, P.; Balaji, B.S.; Abouhawwash, M.; Rajadev, R. Recursive Feature Elimination with Ridge Regression (L2) Machine Learning Hybrid Feature Selection Algorithm for Diabetic Prediction Using Random Forest Classifer. 2021. Available online: https://www.researchsquare.com/article/rs-742641/v1 (accessed on 17 May 2022).
- Pan, R.; Yang, T.; Cao, J.; Lu, K.; Zhang, Z. Missing data imputation by K nearest neighbours based on grey relational structure and mutual information. Appl. Intell. 2015, 43, 614–632. [Google Scholar] [CrossRef]
- Ren, S.; Qi, Q.; Liu, S.; Duan, S.; Mao, B.; Chang, Z.; Zhang, Y.; Wang, S.; Zhang, L. Preoperative prediction of pathological grading of hepatocellular carcinoma using machine learning-based ultrasomics: A multicenter study. Eur. J. Radiol. 2021, 143, 109891. [Google Scholar] [CrossRef] [PubMed]
- Santos, M.S.; Abreu, P.H.; García-Laencina, P.J.; Simão, A.; Carvalho, A. A new cluster-based oversampling method for improving survival prediction of hepatocellular carcinoma patients. J. Biomed. Inform. 2015, 58, 49–59. [Google Scholar] [CrossRef] [PubMed]
- Sawhney, R.; Mathur, P.; Shankar, R. A Firefly Algorithm Based Wrapper-Penalty Feature Selection Method for Cancer Diagnosis. In International Conference on Computational Science and Its Applications; Springer: Berlin/Heidelberg, Germany, 2018. [Google Scholar] [CrossRef]
- Książek, W.; Abdar, M.; Acharya, U.R.; Pławiak, P. A novel machine learning approach for early detection of hepatocellular carcinoma patients. Cogn. Syst. Res. 2019, 54, 116–127. [Google Scholar] [CrossRef]
- Ali, L.; Wajahat, I.; Golilarz, N.A.; Keshtkar, F.; Bukhari, S.A.C. LDA–GA–SVM: Improved hepatocellular carcinoma prediction through dimensionality reduction and genetically optimized support vector machine. Neural Comput. Appl. 2021, 33, 2783–2792. [Google Scholar] [CrossRef]
- Dessie, E.Y.; Tu, S.-J.; Chiang, H.-S.; Tsai, J.J.; Chang, Y.-S.; Chang, J.-G.; Ng, K.-L. Construction and Validation of a Prognostic Gene-Based Model for Overall Survival Prediction in Hepatocellular Carcinoma Using an Integrated Statistical and Bioinformatic Approach. Int. J. Mol. Sci. 2021, 22, 1632. [Google Scholar] [CrossRef]
- Kim, D.H.; Kim, B.; Youn, S.Y.; Kim, H.; Choi, J.-I. Diagnostic Performance of KLCA-NCC 2018 Criteria for Hepatocellular Carcinoma Using Magnetic Resonance Imaging: A Systematic Review and Meta-Analysis. Diagnostics 2021, 11, 1763. [Google Scholar] [CrossRef]
- Książek, W.; Hammad, M.; Pławiak, P.; Acharya, U.R.; Tadeusiewicz, R. Development of novel ensemble model using stacking learning and evolutionary computation techniques for automated hepatocellular carcinoma detection. Biocybern. Biomed. Eng. 2020, 40, 1512–1524. [Google Scholar] [CrossRef]
- Hattab, M.; Maalel, A.; Ben Ghezala, H.H. Towards an Oversampling Method to Improve Hepatocellular Carcinoma Early Prediction. In Digital Health in Focus of Predictive, Preventive and Personalised Medicine; Springer: Berlin/Heidelberg, Germany, 2020; pp. 139–148. [Google Scholar] [CrossRef]
- Tuncer, T.; Ertam, F. Neighborhood component analysis and reliefF based survival recognition methods for Hepatocellular carcinoma. Phys. A Stat. Mech. Its Appl. 2020, 540, 123143. [Google Scholar] [CrossRef]
- Książek, W.; Gandor, M.; Pławiak, P. Comparison of various approaches to combine logistic regression with genetic algorithms in survival prediction of hepatocellular carcinoma. Comput. Biol. Med. 2021, 134, 104431. [Google Scholar] [CrossRef] [PubMed]
- Książek, W.; Turza, F.; Pławiak, P. NCA-GA-SVM: A new two-level feature selection method based on neighborhood component analysis and genetic algorithm in hepatocellular carcinoma (HCC) fatality prognosis. Int. J. Numer. Methods Biomed. Eng. 2022, 38, e3599. [Google Scholar] [CrossRef] [PubMed]
- Akter, L.; Islam, M.; Al-Rakhami, M.S.; Haque, M. Prediction of cervical cancer from behavior risk using machine learning techniques. SN Comput. Sci. 2021, 2, 1–10. [Google Scholar]
- Mroweh, M.; Decaens, T.; Marche, P.N.; Jilkova, Z.M.; Clément, F. Modulating the Crosstalk between the Tumor and Its Microenvironment Using RNA Interference: A Treatment Strategy for Hepatocellular Carcinoma. Int. J. Mol. Sci. 2020, 21, 5250. [Google Scholar] [CrossRef]
- Liu, Z.; Thapa, N.; Shaver, A.; Roy, K.; Siddula, M.; Yuan, X.; Yu, A. Using Embedded Feature Selection and CNN for Classification on CCD-INID-V1—A New IoT Dataset. Sensors 2021, 21, 4834. [Google Scholar] [CrossRef]


| Features | Range | Missing |
|---|---|---|
| 1.gender | 0 and 1 | 0 |
| 2.symptom | 0 and 1 | 18 |
| 3.alcohol | 0 and 1 | 0 |
| 4.hepatitis_ b _surf _ antigen | 0 and 1 | 17 |
| 5.hepatitis _ b _ e _ antigen | 0 and 1 | 39 |
| 6.hepatitis _ b _ core _ antibody | 0 and 1 | 24 |
| 7.hepatitis _ c _ virus _ antibody | 0 and 1 | 9 |
| 8.cirhosis | 0 and 1 | 0 |
| 9.endemic _ country | 0 and 1 | 39 |
| 10.smoking | 0 and 1 | 41 |
| 11.diabetes | 0 and 1 | 3 |
| 12.obesity | 0 and 1 | 10 |
| 13.hemochromotosis | 0 and 1 | 23 |
| 14.arterial _ hyper_tension | 0 and 1 | 3 |
| 15.chronic _ renal _ insufficiency | 0 and 1 | 2 |
| 16.human _ idv | 0 and 1 | 14 |
| 17.nonalcoholic _ hepatitis | 0 and 1 | 22 |
| 18.esopageal _ varices | 0 and 1 | 52 |
| 19.splenomegly | 0 and 1 | 15 |
| 20.portal _ hyper-tension | 0 and 1 | 11 |
| 21.portal _ vein _ thrombos | 0 and 1 | 3 |
| 22.liver _ metastasiss | 0 and 1 | 4 |
| 23.radio-logical _ hallmark | 0 and 1 | 2 |
| 24.age | 20–93 | 0 |
| 25.gms _ of _ alcohol/ day | 0–500 | 48 |
| 26.pack _ of _cigarette/year | 0–510 | 53 |
| 27.perform_ status | 0, 1, 2, 3, 4 | 0 |
| 28.encephlopathy_ deg | 0, 1, 2, 3 | 1 |
| 29.asites_ deg | 0, 1, 2, 3 | 2 |
| 30.intl _ normal _ ratio | 0.84–4.82 | 4 |
| 31.α_ feto-protein | 1.2–1,810,348 | 8 |
| 32.haemoglobin | 5–18.7 | 3 |
| 33.avg _ corpuscular _ vol | 69.5–119.6 | 3 |
| 34.leukocyte | 2.2–13,000 | 3 |
| 35.platelet | 1.71–459,000 | 3 |
| 36.albumin | 1.9–4.9 | 6 |
| 37.tot _ bilirubin | 0.3–40.5 | 5 |
| 38.alanine _ trans | 11–420 | 4 |
| 39.aspartate _ trans | 17–553 | 3 |
| 40.γ _ glutamyl _ trans | 23–1575 | 3 |
| 41.alkaline _ phosphat (u/l) | 1.28–980 | 3 |
| 42.total _ protein | 3.9–102 | 11 |
| 43.creatinine | 0.2–7.6 | 7 |
| 44.num _ of _ nodule | 0–5 | 2 |
| 45.maj _ dim _ of _ nodule | 1.5–22 | 20 |
| 46.direct _ bilirubin | 0.1–29.3 | 44 |
| 47.iron | 0–224 | 79 |
| 48.oxy _ sat | 0–126 | 80 |
| 49.feritin | 0–2230 | 80 |
| 50.class | 0 and 1 | 0 |
| Missing-Value Replacement | Classification Algorithm | Methods | Selected Features |
|---|---|---|---|
| Mean and mode | Logistic Regression | Lasso Regression | 2, 4, 8, 7, 11, 15, 14, 17,16, 21, 20, 23, 22, 24, 27, 30, 29, 31, 34, 36, 39, 42, 43, 41, 45, 47,46, 49 |
| Ridge Regression | 7, 10, 11, 16, 23, 24, 26, 29, 30, 32, 38, 39, 41, 43, 46, 47, 49 | ||
| Recursive Feature Elimination | Gradient Boosting | 26, 31, 41 | |
| Random Forest | 27, 29, 30,32,31, 34, 36, 35,37, 40, 39, 41,46, 42, 47,48,49 | ||
| k-NN | Logistic Regression | Lasso Regression | 2, 4, 7, 8, 10,11,12,13, 14, 15, 18, 21, 24, 26, 28, 29, 31, 34, 36, 39, 41, 42, 43, 46 |
| Ridge Regression | 2, 7, 10, 11, 16, 23, 24, 26, 29, 30, 35, 38, 39, 41, 43, 44, 47, 49 | ||
| Recursive Feature Elimination | Gradient Boosting | 2, 24, 31, 32, 39, 47,49 | |
| Random Forest | 24, 27, 31, 32, 40, 45, 41, 48,49 |
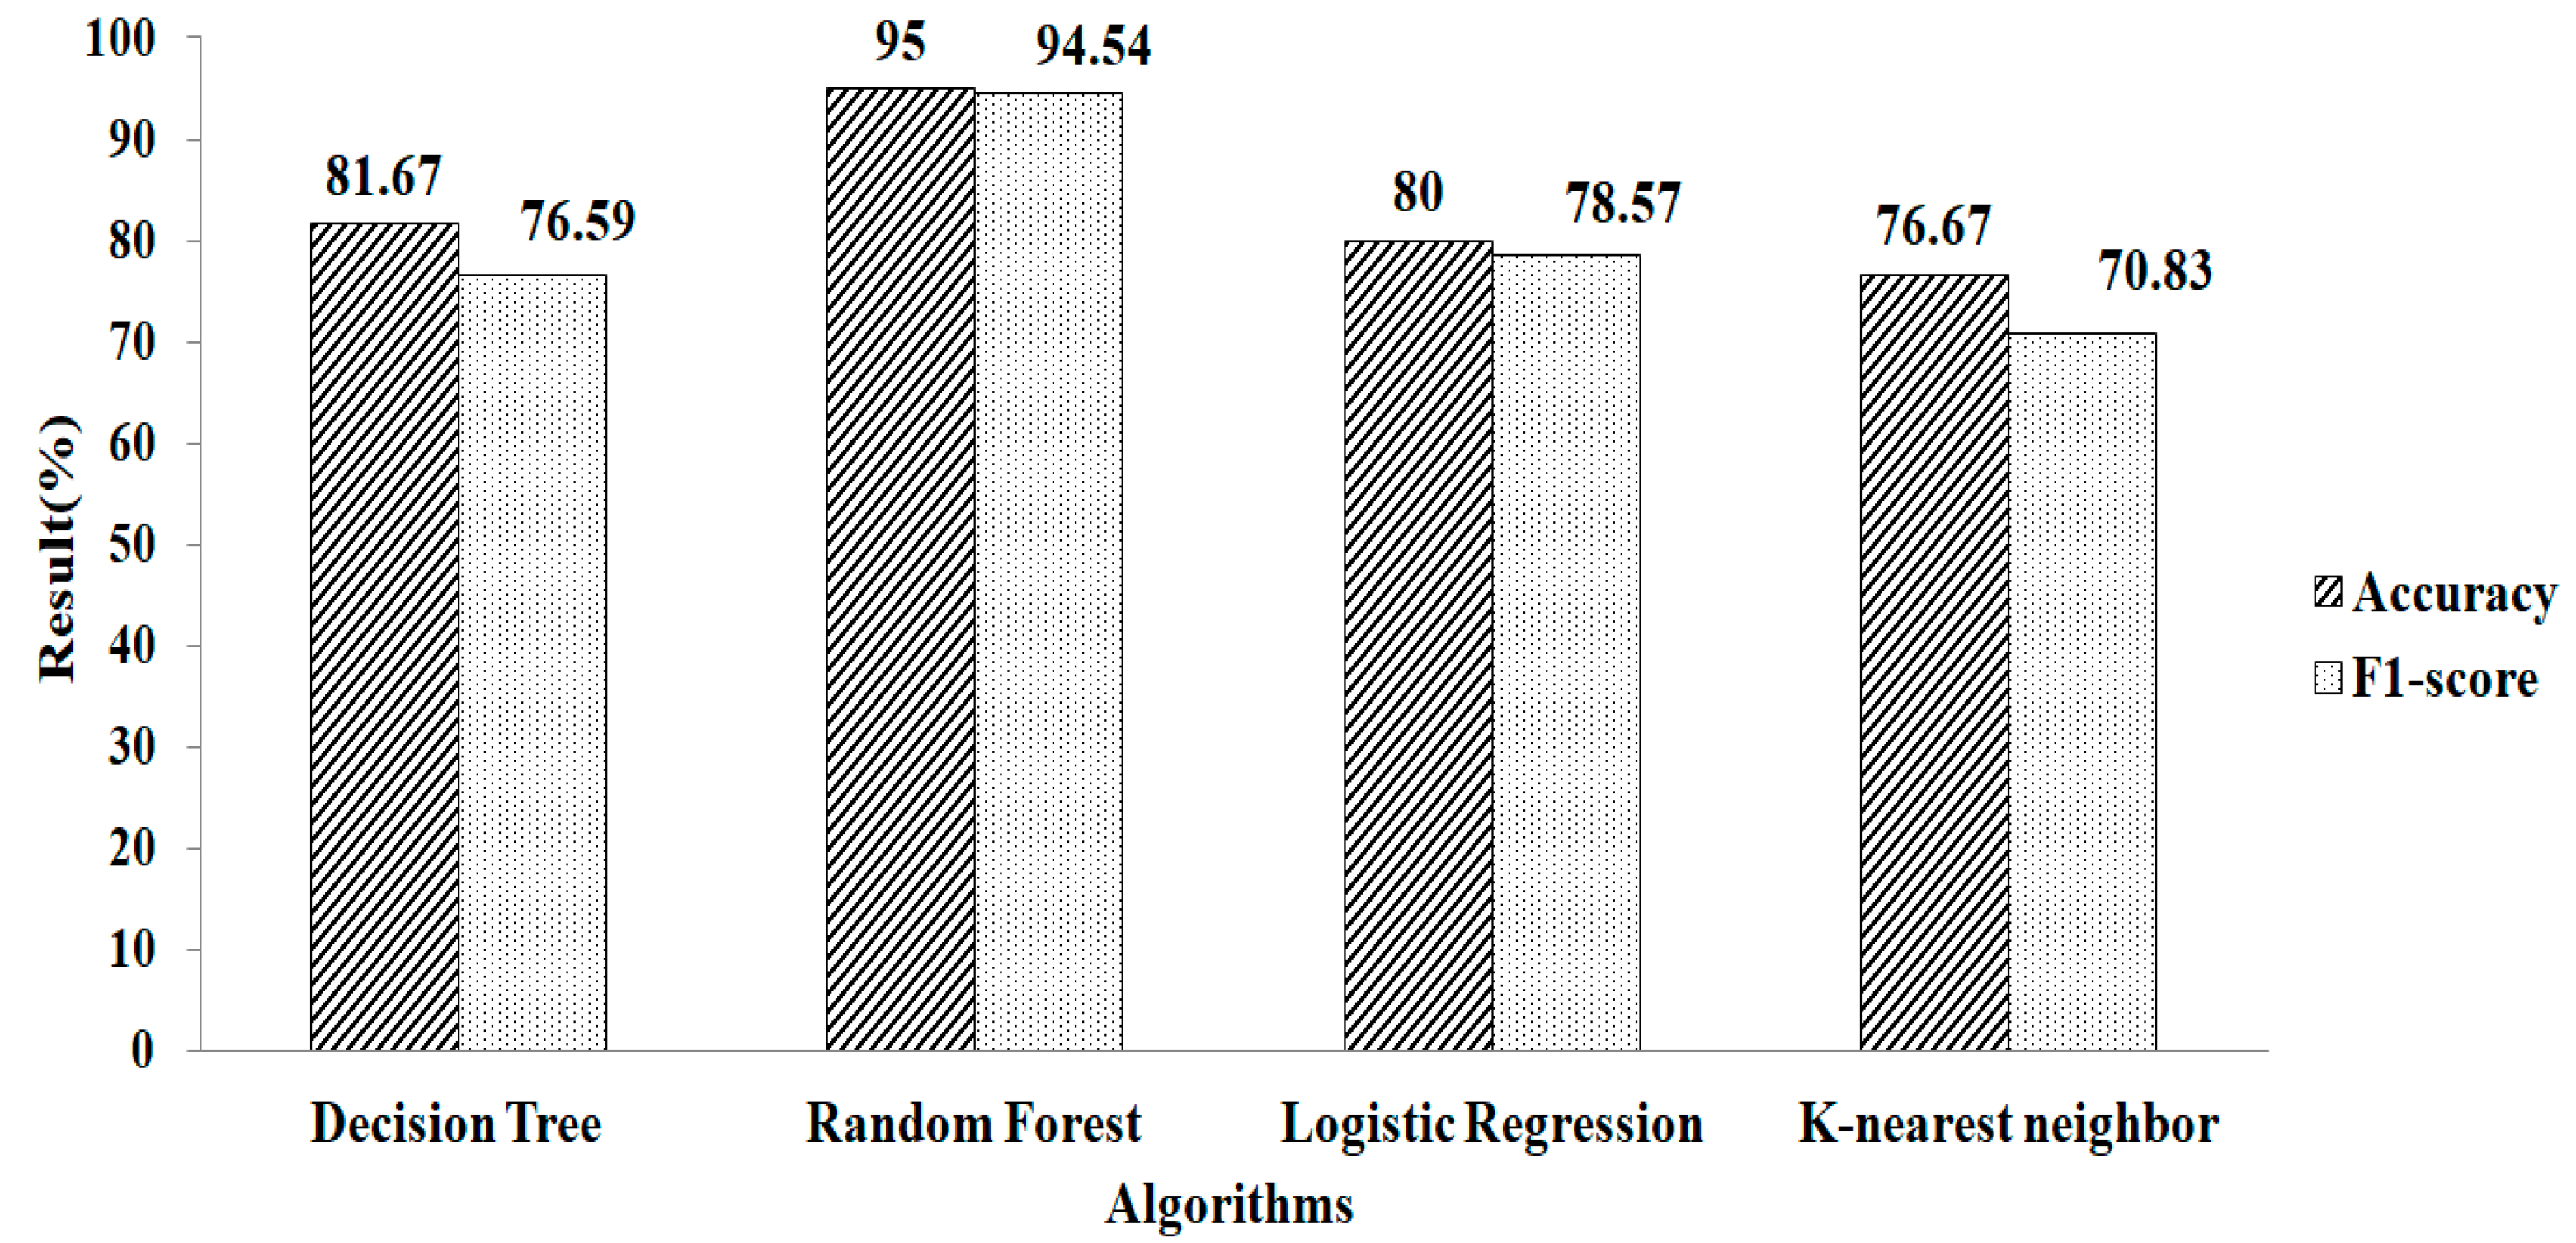
| Missing-Value Replacement | Classification Algorithm | Methods | # Selected Features | Accuracy | F1-Score |
|---|---|---|---|---|---|
| Mean and Mode | Logistic Regression | Lasso Regularization | 28 | 95.16 | 94.71 |
| Ridge Regularization | 17 | 91.66 | 90.91 | ||
| Recursive-Feature Elimination | Gradient Boosting | 3 | 95.12 | 93.75 | |
| Random Forest | 17 | 95.12 | 94.11 | ||
| k-NN | Logistic Regression | Lasso Regularization | 25 | 94.11 | 93.33 |
| Ridge Regularization | 18 | 90 | 90.01 | ||
| Recursive Feature Elimination | Gradient Boosting | 7 | 96.66 | 96.55 | |
| Random Forest | 9 | 95 | 94.54 |
| S.No | Method | Accuracy | F1-Score | Reference | Year of Publication |
|---|---|---|---|---|---|
| 1 | NN + augmented set approach | 75.19% | 66.50% | Santos et al. [36] | 2017 |
| 2 | BFA + RF | 83.5% | - | Sawhney et al. [37] | 2018 |
| 3 | SVC with GA optimizer | 88.49% | 87.62% | Ksiazek [40] | 2019 |
| 4 | LDA-GA-SVM | 90.30% | - | Ali et al. [41] | 2019 |
| 5 | GA | 90.30% | 88.57% | Ksiaz˙ek et al. [42] | 2020 |
| 6 | LASSO + SVM RFE + LASSO + SVM | 89.18% | - | Panyanat Aonpong et al. [40] | 2019 |
| 7 | K-means + SMOTE + SVM | 84.90% | - | Hattab et al. [43] | 2020 |
| 8 | Relief + LDA NCA + FGSVM | 92.12% | 91.61% | Al-Islam [44] | 2020 |
| 9 | SMOTE + XGBOOST | 87% | - | Ferdib-Al-Islam et al. [45] | 2021 |
| 10 | GA-LR | 94.55% | 93.56% | Książek, Gandor et al. [46] | 2021 |
| 11 | NCA + GA + SVM | 87.4% | - | Wojciech Książek [47] | 2022 |
| 12 | RFE-GB-RF | 96.66% | 95.66% | This study | 2022 |
| Data Imputation | LR-L1 | LR-L2 | RFE-RF |
|---|---|---|---|
| Mean and Mode | 0.008 | 0.018 | 0.013 |
| k-NN | 0.006 | 0.014 | 0.010 |
Publisher’s Note: MDPI stays neutral with regard to jurisdictional claims in published maps and institutional affiliations. |
© 2022 by the authors. Licensee MDPI, Basel, Switzerland. This article is an open access article distributed under the terms and conditions of the Creative Commons Attribution (CC BY) license (https://creativecommons.org/licenses/by/4.0/).
Share and Cite
Ali, M.A.S.; Orban, R.; Rajammal Ramasamy, R.; Muthusamy, S.; Subramani, S.; Sekar, K.; Rajeena P. P., F.; Gomaa, I.A.E.; Abulaigh, L.; Elminaam, D.S.A. A Novel Method for Survival Prediction of Hepatocellular Carcinoma Using Feature-Selection Techniques. Appl. Sci. 2022, 12, 6427. https://doi.org/10.3390/app12136427
Ali MAS, Orban R, Rajammal Ramasamy R, Muthusamy S, Subramani S, Sekar K, Rajeena P. P. F, Gomaa IAE, Abulaigh L, Elminaam DSA. A Novel Method for Survival Prediction of Hepatocellular Carcinoma Using Feature-Selection Techniques. Applied Sciences. 2022; 12(13):6427. https://doi.org/10.3390/app12136427
Chicago/Turabian StyleAli, Mona A. S., Rasha Orban, Rajalaxmi Rajammal Ramasamy, Suresh Muthusamy, Saanthoshkumar Subramani, Kavithra Sekar, Fathimathul Rajeena P. P., Ibrahim Abd Elatif Gomaa, Laith Abulaigh, and Diaa Salam Abd Elminaam. 2022. "A Novel Method for Survival Prediction of Hepatocellular Carcinoma Using Feature-Selection Techniques" Applied Sciences 12, no. 13: 6427. https://doi.org/10.3390/app12136427
APA StyleAli, M. A. S., Orban, R., Rajammal Ramasamy, R., Muthusamy, S., Subramani, S., Sekar, K., Rajeena P. P., F., Gomaa, I. A. E., Abulaigh, L., & Elminaam, D. S. A. (2022). A Novel Method for Survival Prediction of Hepatocellular Carcinoma Using Feature-Selection Techniques. Applied Sciences, 12(13), 6427. https://doi.org/10.3390/app12136427