
Facial Expressions Based Automatic Pain Assessment System

Abstract
:1. Introduction
- AU4 is the intensity of lowering the eyebrows on a scale from 0 to 5 (0 = not lowered, 5 = maximally lowered).
- AU6 is the intensity of raising the cheeks on a scale from 0 to 5 (0 = not raised, 5 = maximally raised).
- AU7 is the intensity of tightening the eyelid on a scale from 0 to 5 (0 = not tight, 5 = very tight).
- AU9 is the intensity of wrinkling the nose on a scale from 0 to 5 (0 = not wrinkled, 5 = very wrinkled).
- AU10 is the intensity of rising the upper lip on a scale from 0 to 5 (0 = not raised, 5 = very raised).
- AU43 is whether the eyes are closed; represented as a binary value (0 = opened, 1 = closed)
2. Background
3. Related Work
4. Methodology
4.1. Dataset
4.2. Data Preprocessing
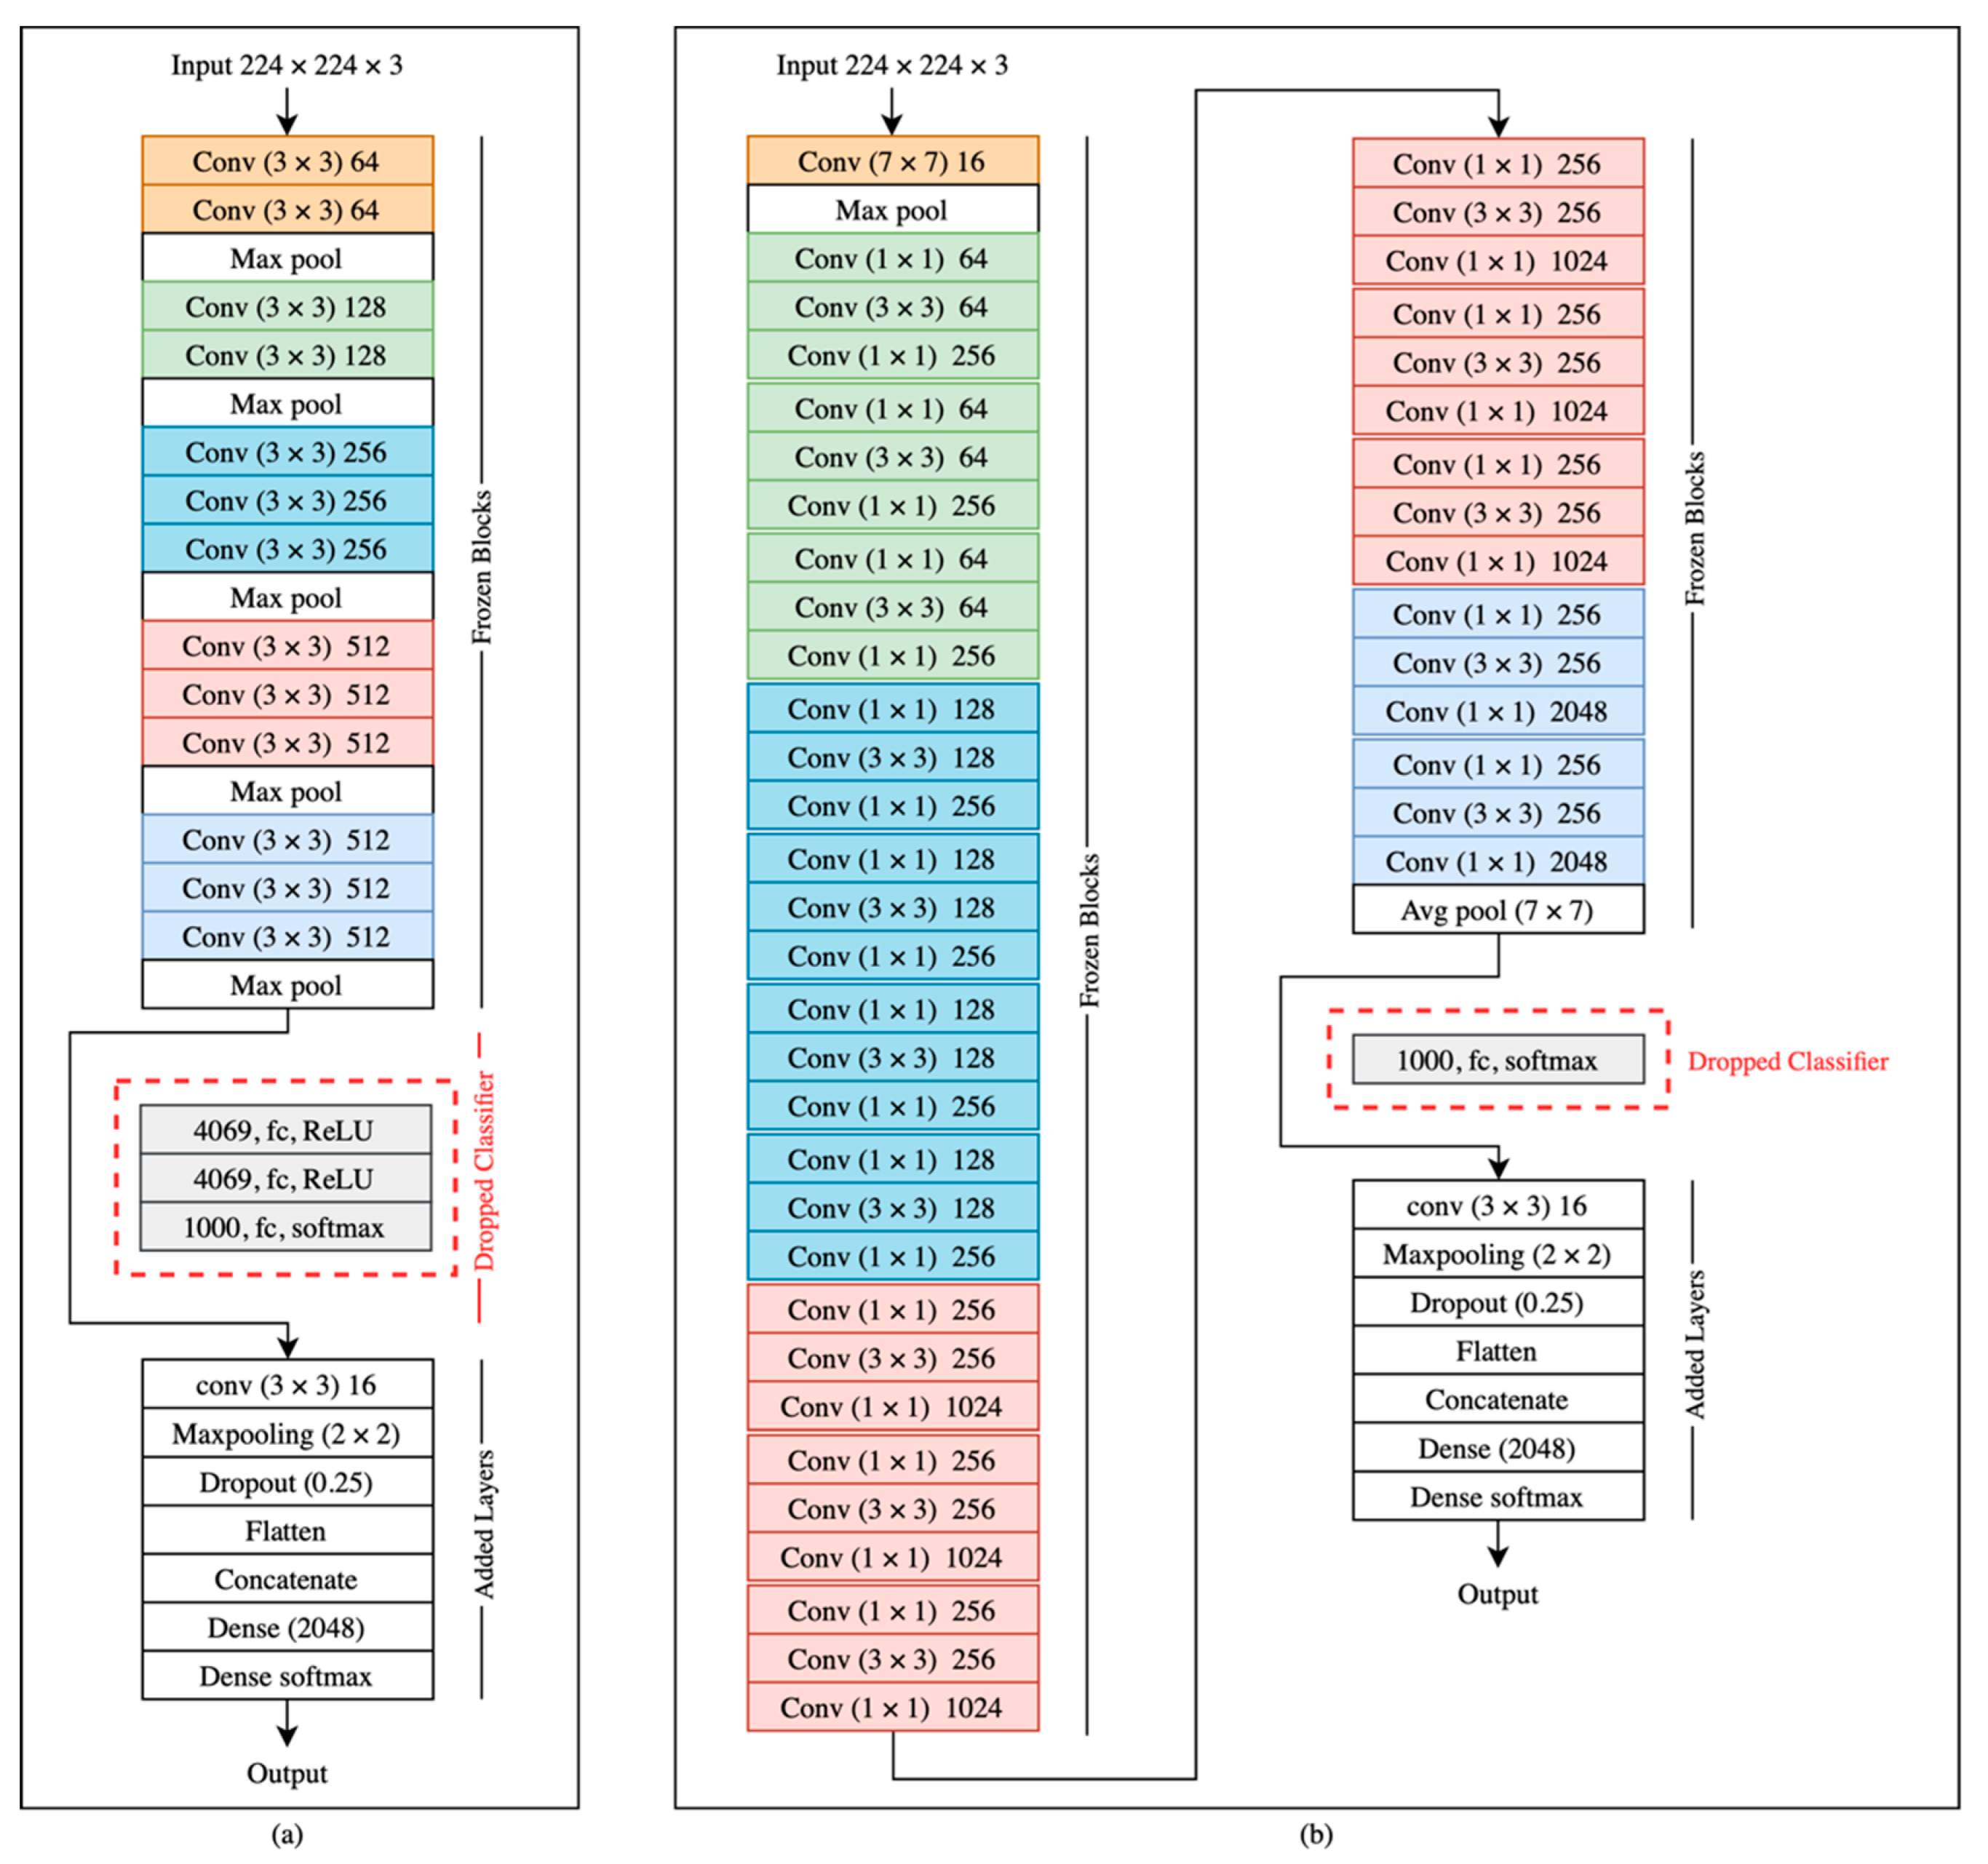
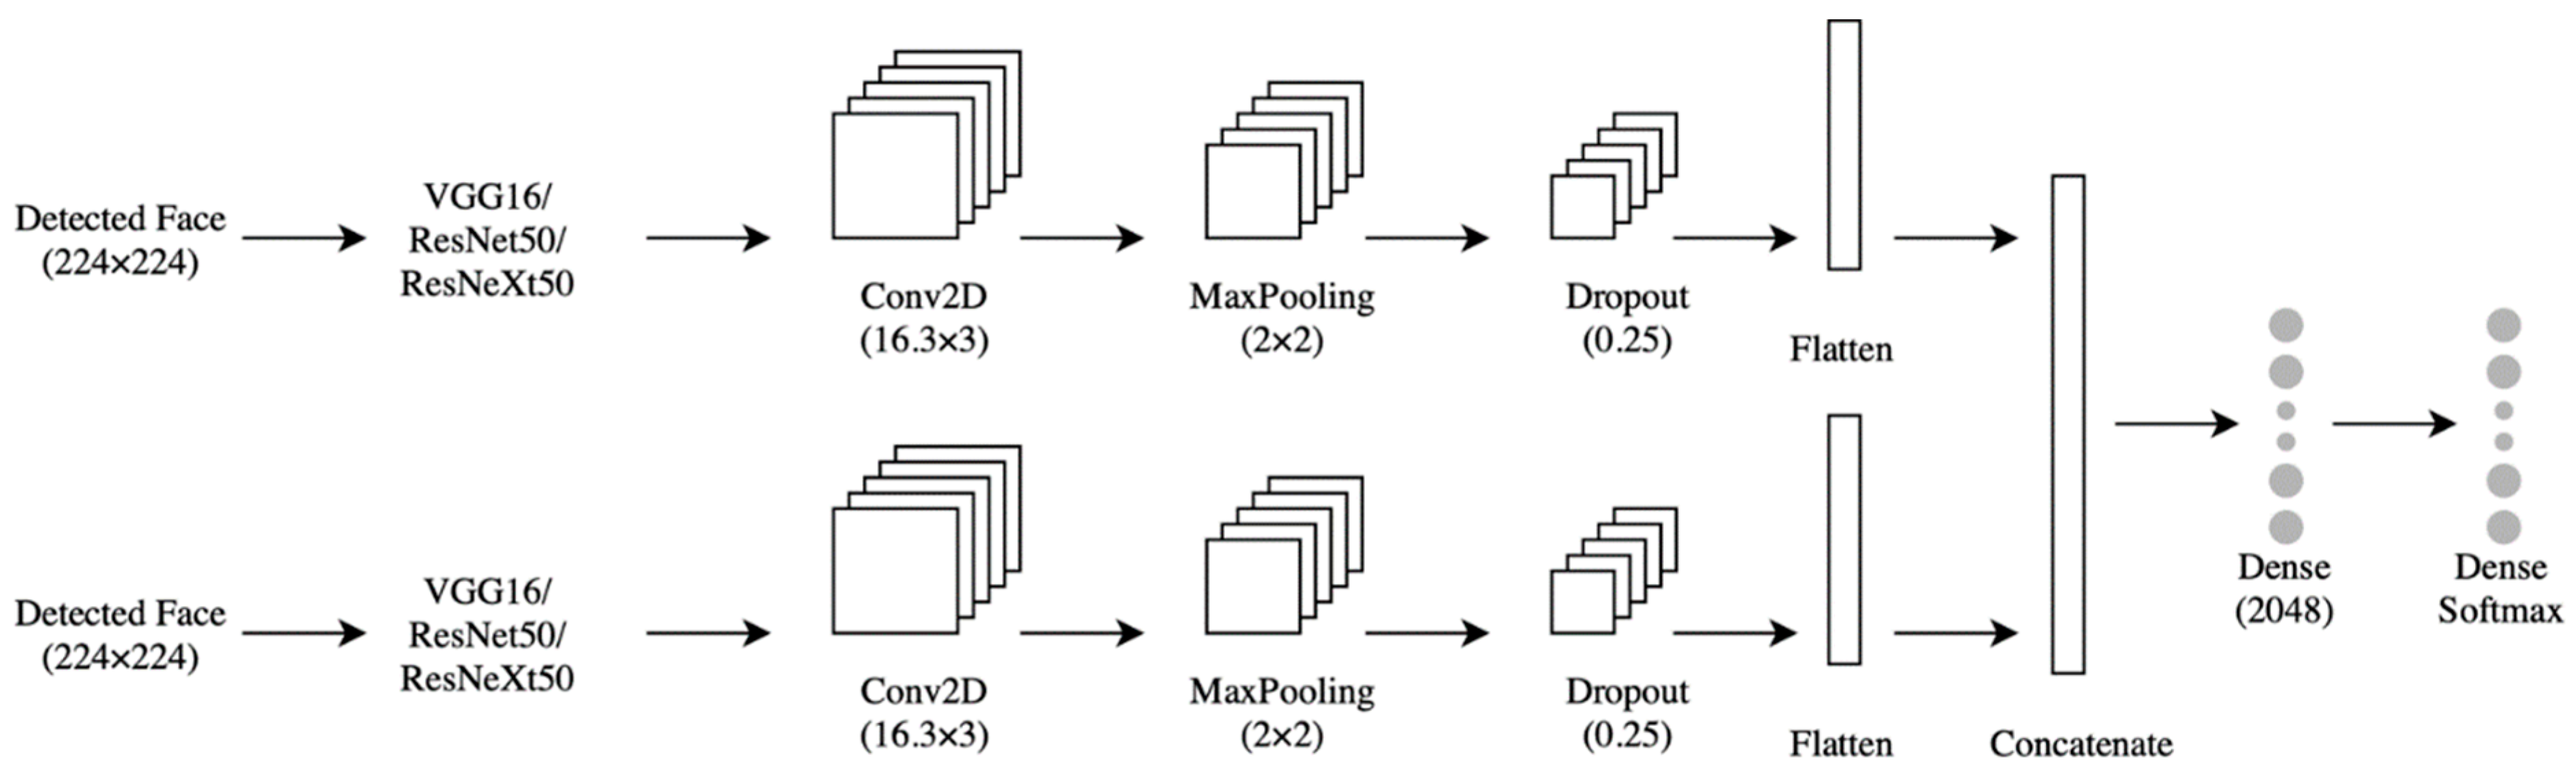
4.3. The Model
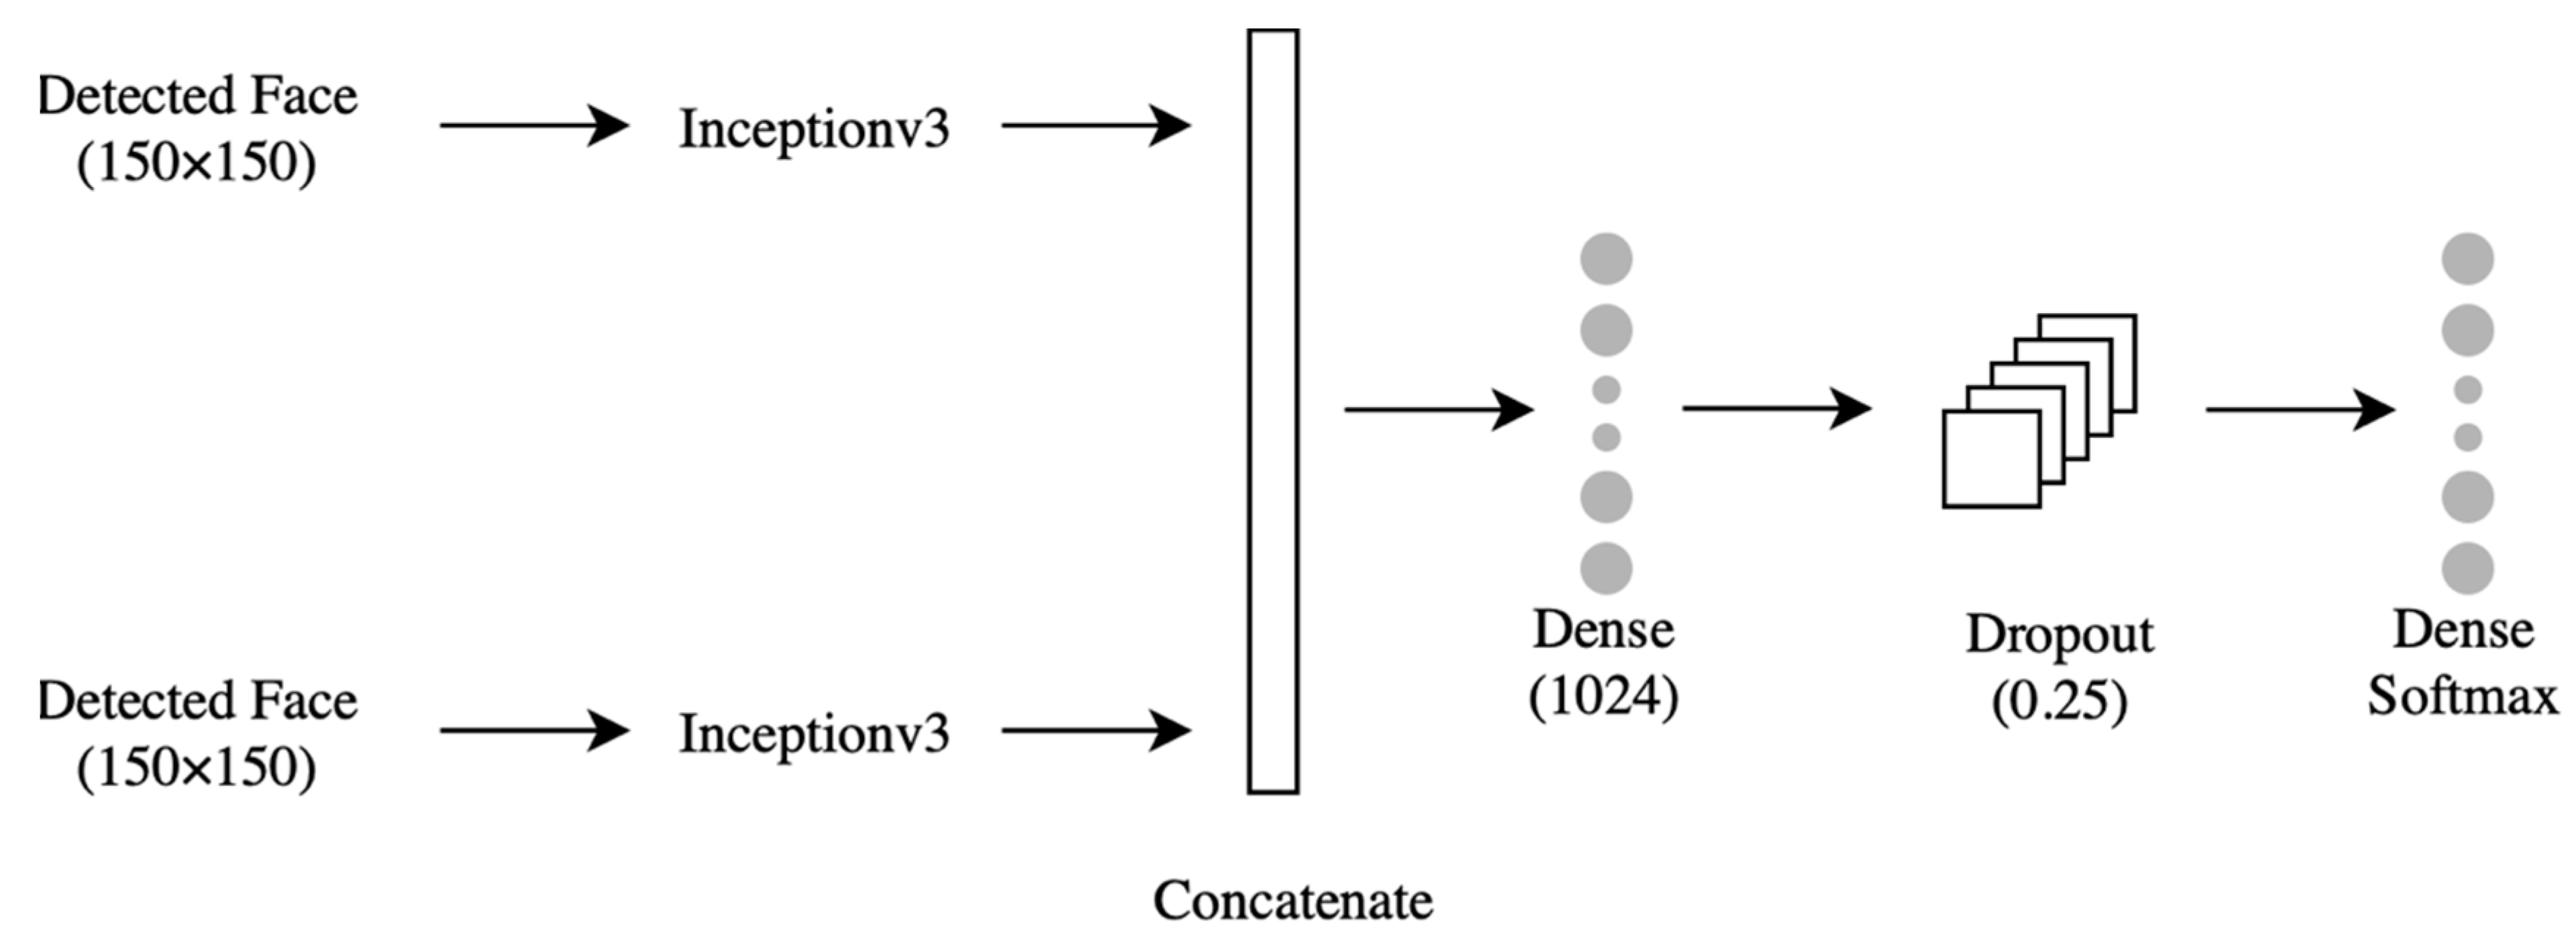
4.3.1. Classifier
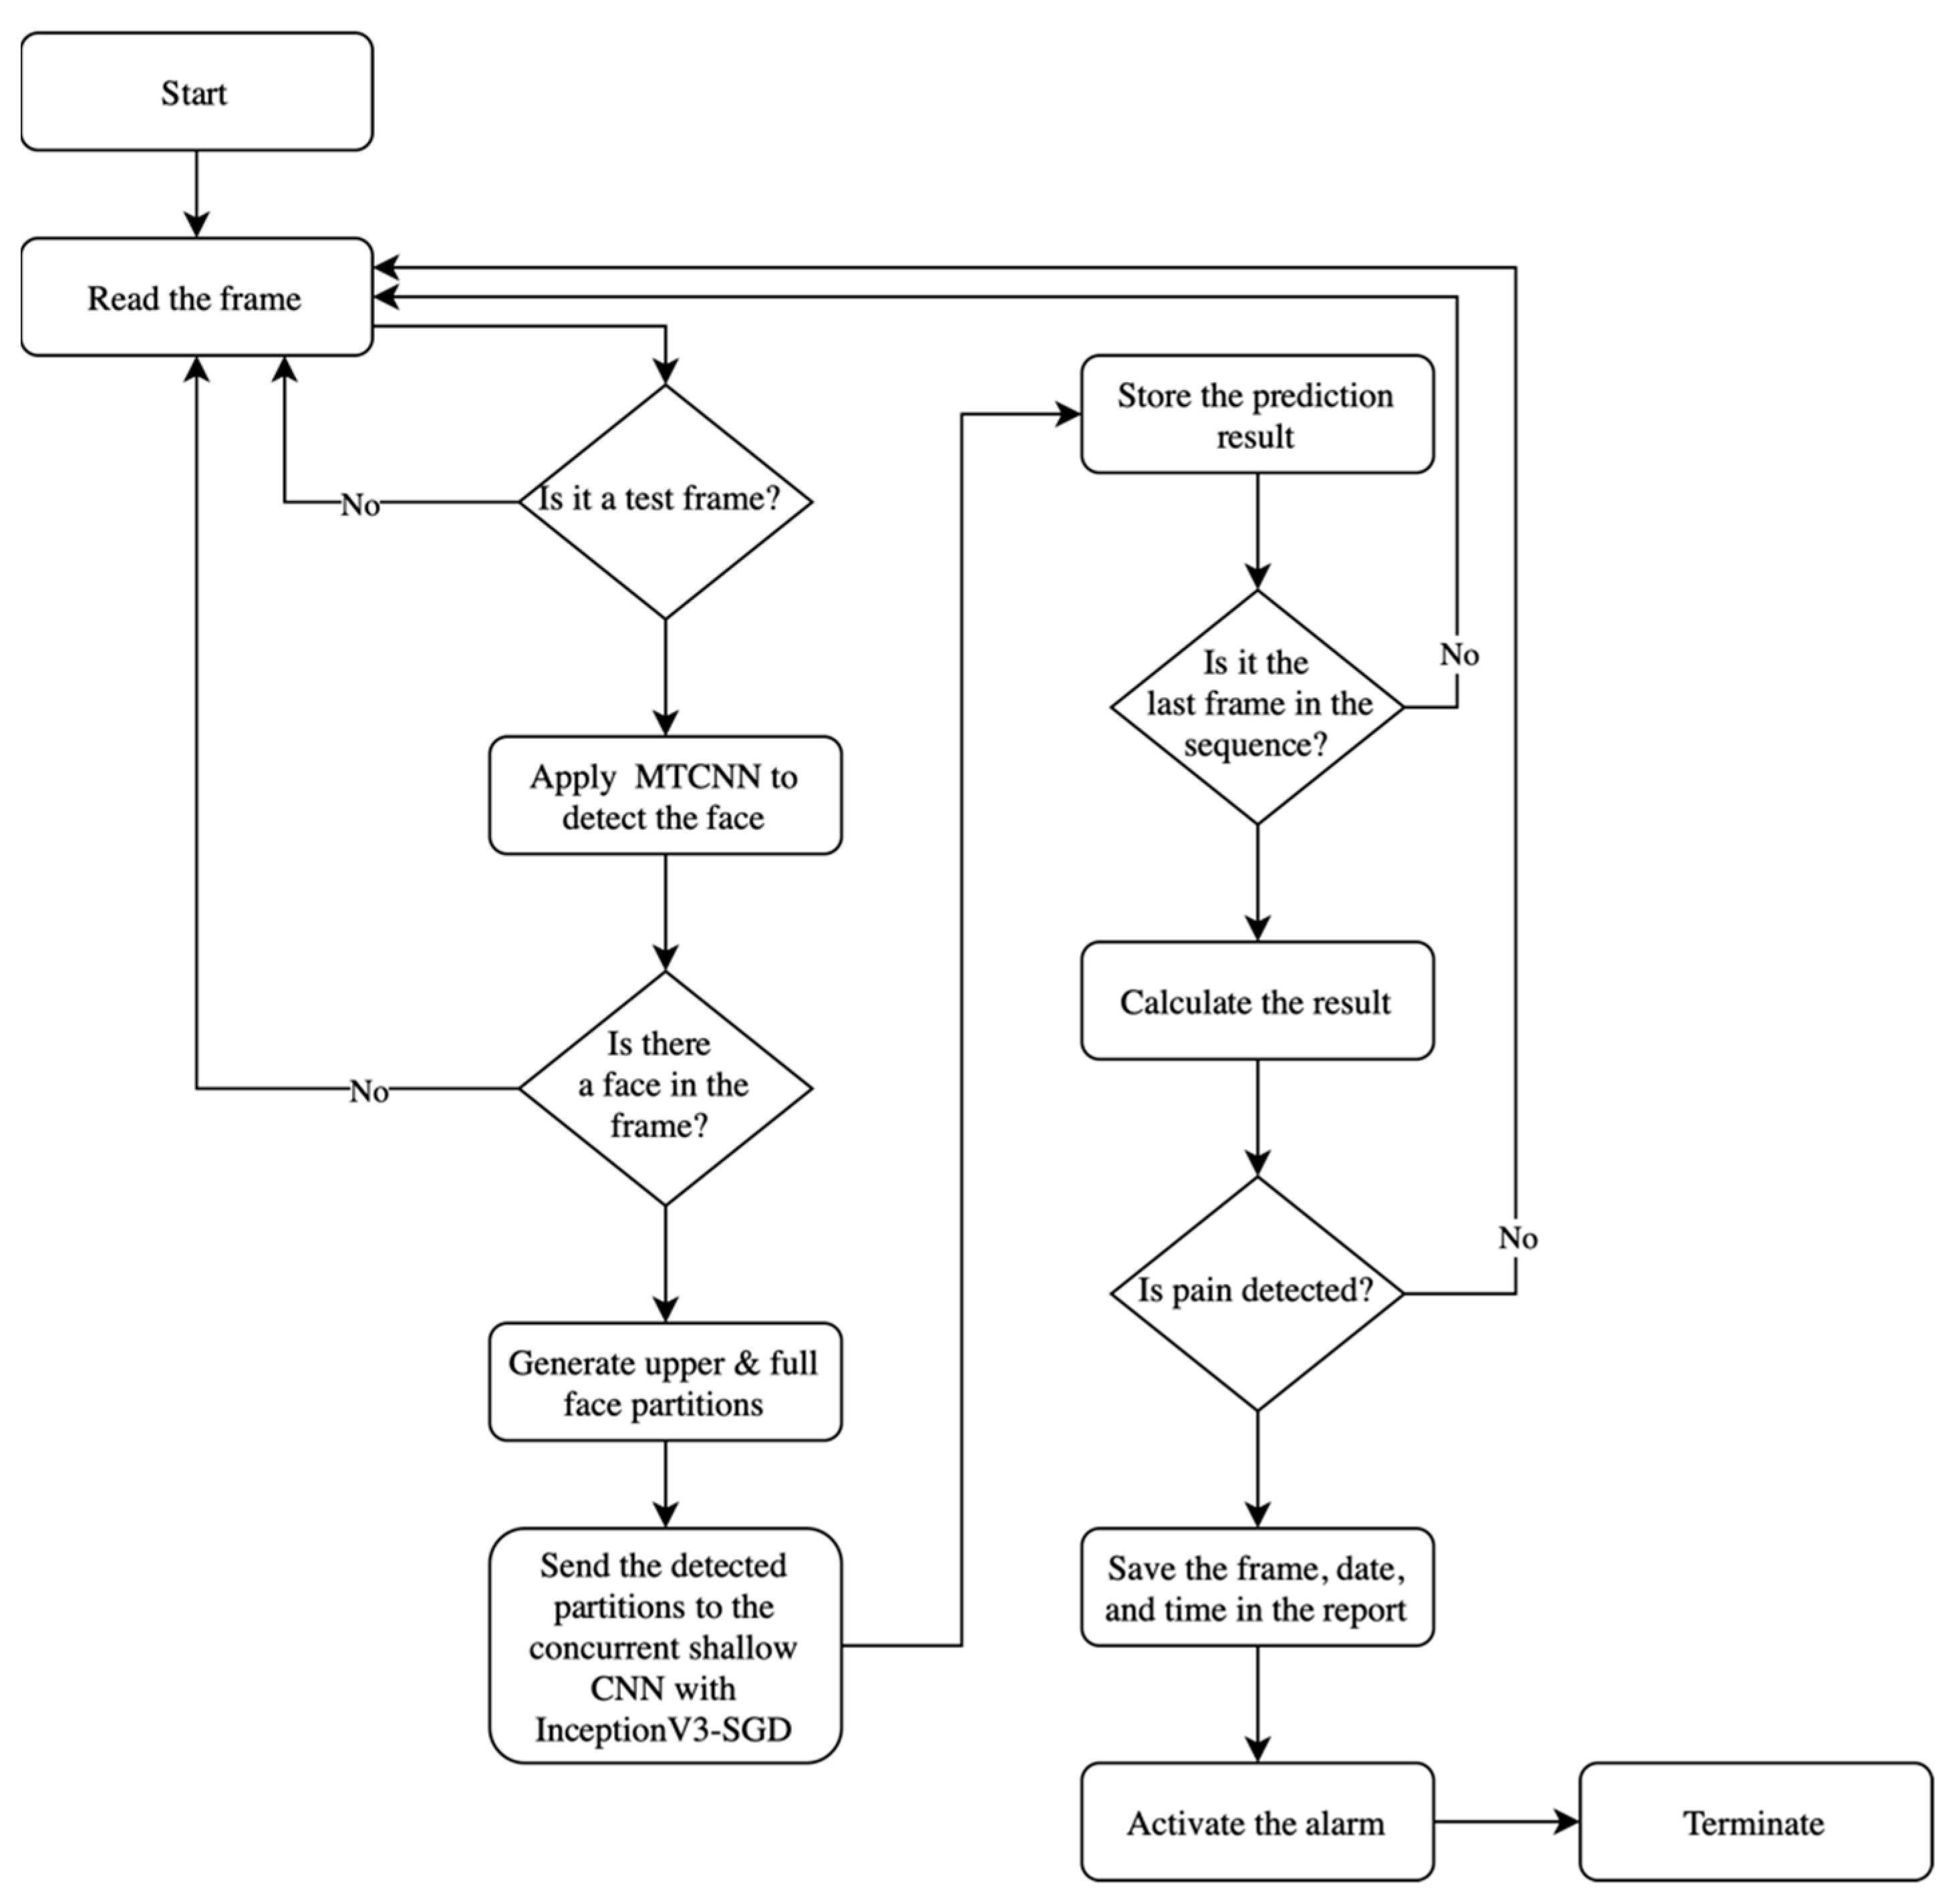
4.3.2. Facial Expression-Based Automatic Pain Assessment System FEAPAS
5. Results
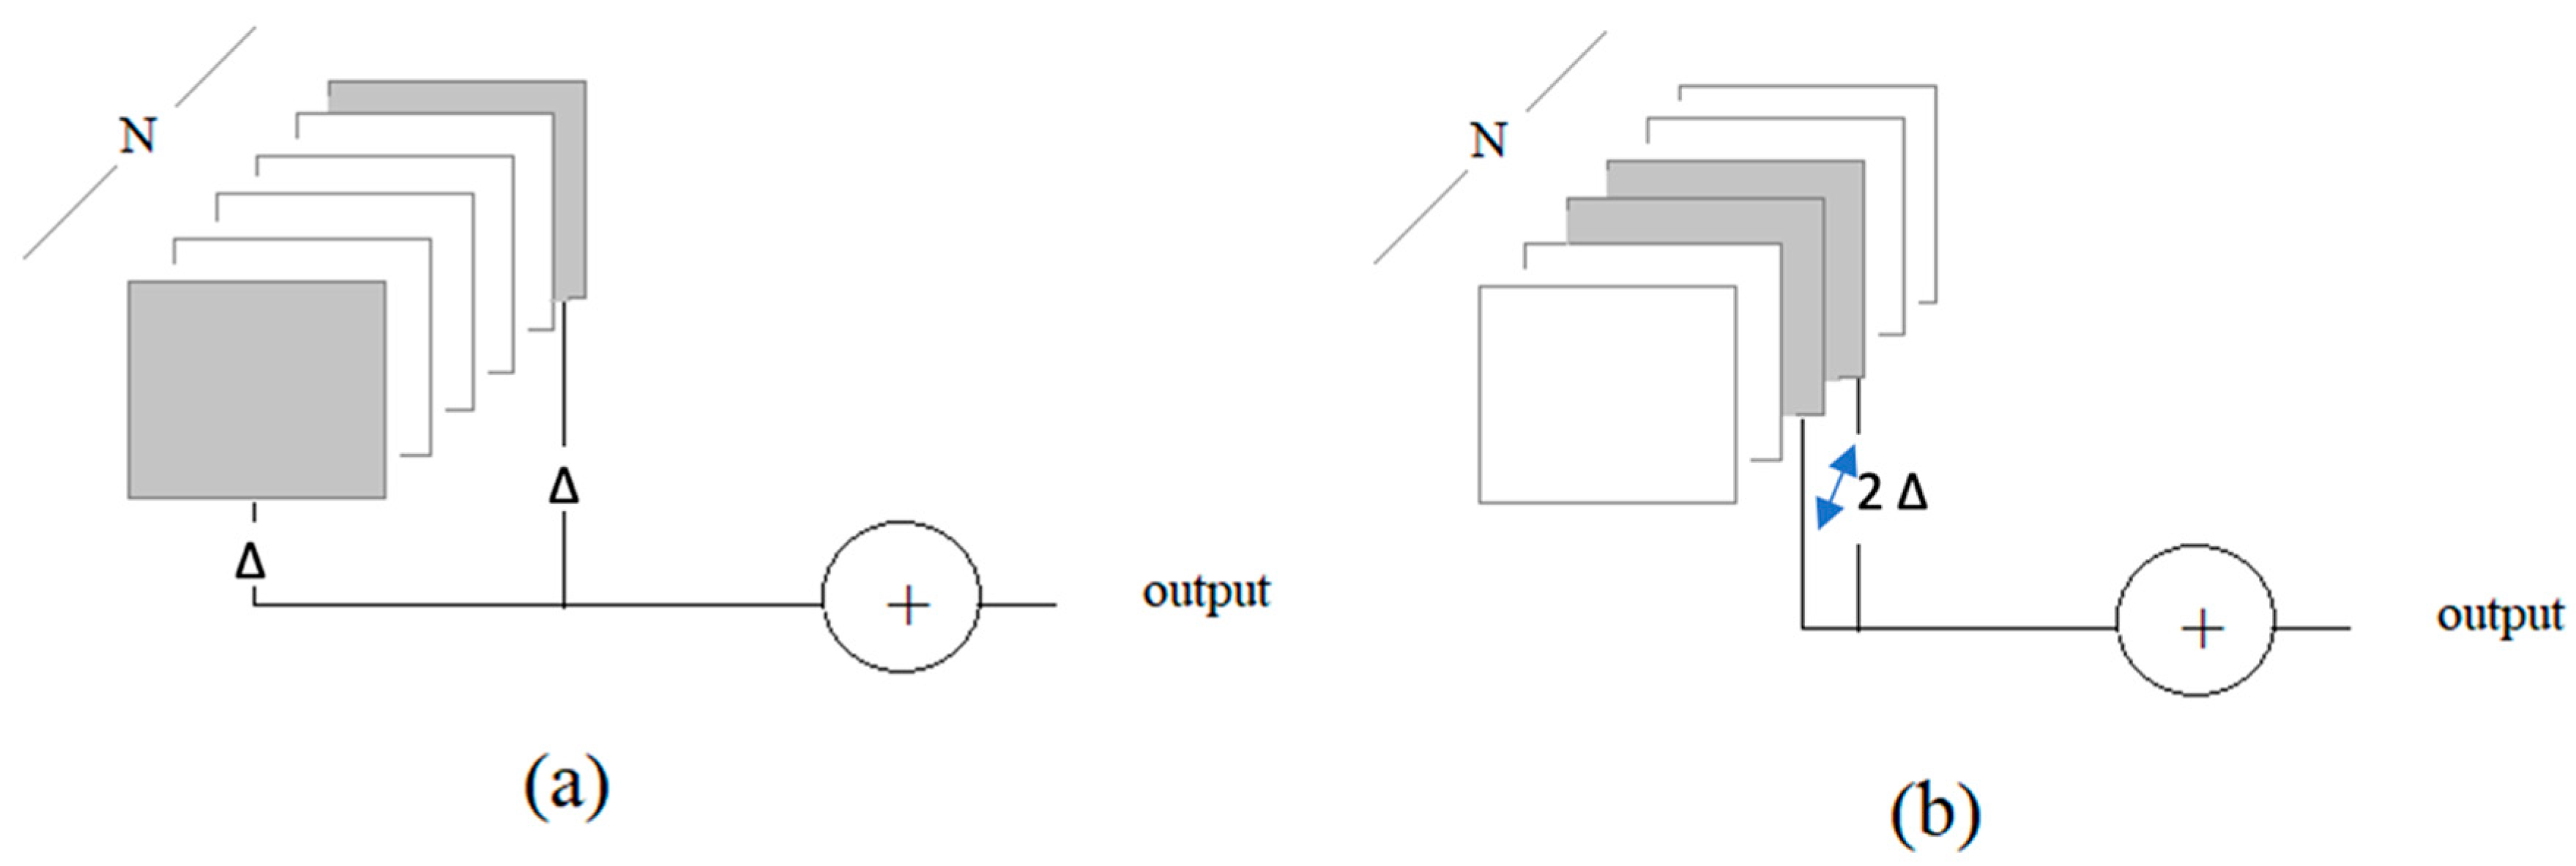
- One frame at each end of the sequence: two-boundary test frames: 2-B, Δ = 1
- Two frames at the middle of the sequence: two-middle test frames: 2-M, Δ = 1
- Two frames at each end of the sequence: four-boundary test frames: 4-B, Δ = 2
- Four frames at the middle of the sequence: four-middle test frames: 4-M, Δ = 2
6. Conclusions
Author Contributions
Funding
Institutional Review Board Statement
Informed Consent Statement
Data Availability Statement
Conflicts of Interest
References
- Taggart, S.; Skylas, K.; Brannelly, A.; Fairbrother, G.; Knapp, M.; Gullick, J. Using a Clinical Judgement Model to Understand the Impact of Validated Pain Assessment Tools for Burn Clinicians and Adult Patients in the ICU: A Multi-Methods Study. Burns 2021, 47, 110–126. [Google Scholar] [CrossRef]
- Lalloo, C.; Kumbhare, D.; Stinson, J.N.; Henry, J.L. Pain-QuILT: Clinical Feasibility of a Web-Based Visual Pain Assessment Tool in Adults with Chronic Pain. J. Med. Internet Res. 2014, 16, e3292. [Google Scholar] [CrossRef]
- Semwal, A.; Londhe, N.D. ECCNet: An Ensemble of Compact Convolution Neural Network for Pain Severity Assessment from Face Images. In Proceedings of the 2021 11th International Conference on Cloud Computing, Data Science & Engineering (Confluence), Noida, India, 28–29 January 2021. [Google Scholar] [CrossRef]
- Lints-Martindale, A.; Hadjistavropoulos, T.; Lix, L.M.; Thorpe, L. A Comparative Investigation of Observational Pain Assessment Tools for Older Adults with Dementia. Clin. J. Pain 2012, 28, 226–237. [Google Scholar] [CrossRef]
- Natavio, T.; McQuillen, E.; Dietrich, M.S.; Wells, N.; Rhoten, B.A.; Vallerand, A.H.; Monroe, T.B. A Comparison of the Pain Assessment Checklist for Seniors with Limited Ability to Communicate (PACSLAC) and Pain Assessment in Advanced Dementia Scale (PAINAD). Pain Manag. Nurs. 2020, 21, 502–509. [Google Scholar] [CrossRef]
- Salekin, S.; Zamzmi, G.; Goldgof, D.; Kasturi, R.; Ho, T.; Sun, Y. Multimodal Spatio-Temporal Deep Learning Approach for Neonatal Postoperative Pain Assessment. Comput. Biol. Med. 2021, 129, 104150. [Google Scholar] [CrossRef]
- Othman, E.; Werner, P.; Saxen, F.; Al-Hamadi, A.; Gruss, S.; Walter, S. Automatic Vs. Human Recognition of Pain Intensity from Facial Expression on the X-ITE Pain Database. Sensors 2021, 21, 3273. [Google Scholar] [CrossRef]
- Rudovic, O.; Pavlovic, V.; Pantic, M. Automatic Pain Intensity Estimation with Heteroscedastic Conditional Ordinal Random Fields. In Advances in Visual Computing; Springer: Berlin/Heidelberg, Germany, 2013. [Google Scholar]
- Semwal, A.; Londhe, N.D. Computer aided pain detection and intensity estimation using compact CNN based fusion network. Appl. Soft Comput. 2021, 112, 107780. [Google Scholar] [CrossRef]
- Lucey, P.; Cohn, J.F.; Prkachin, K.M.; Solomon, P.E.; Matthews, I. Painful data: The UNBC-McMaster shoulder pain expression archive database. In Proceedings of the 2011 IEEE International Conference on Automatic Face & Gesture Recognition (FG), Santa Barbara, CA, USA, 21–25 March 2011; pp. 57–64. [Google Scholar]
- Yu, Y.; Hao, K.; Ding, Y. A New Image Classification Model Based on Brain Parallel Interaction Mechanism. Neurocomputing 2018, 315, 190–197. [Google Scholar] [CrossRef]
- Dubey, A.K.; Jain, V. Automatic facial recognition using VGG16 based transfer learning model. J. Inf. Optim. Sci. 2020, 41, 1589–1596. [Google Scholar] [CrossRef]
- Yang, Q. An introduction to transfer learning. In Advanced Data Mining and Applications; Tang, C., Ling, C.X., Zhou, X., Cercone, N.J., Li, X., Eds.; Lecture Notes in Computer Science; Springer: Berlin/Heidelberg, Germany, 2008; Volume 5139, p. 1. [Google Scholar]
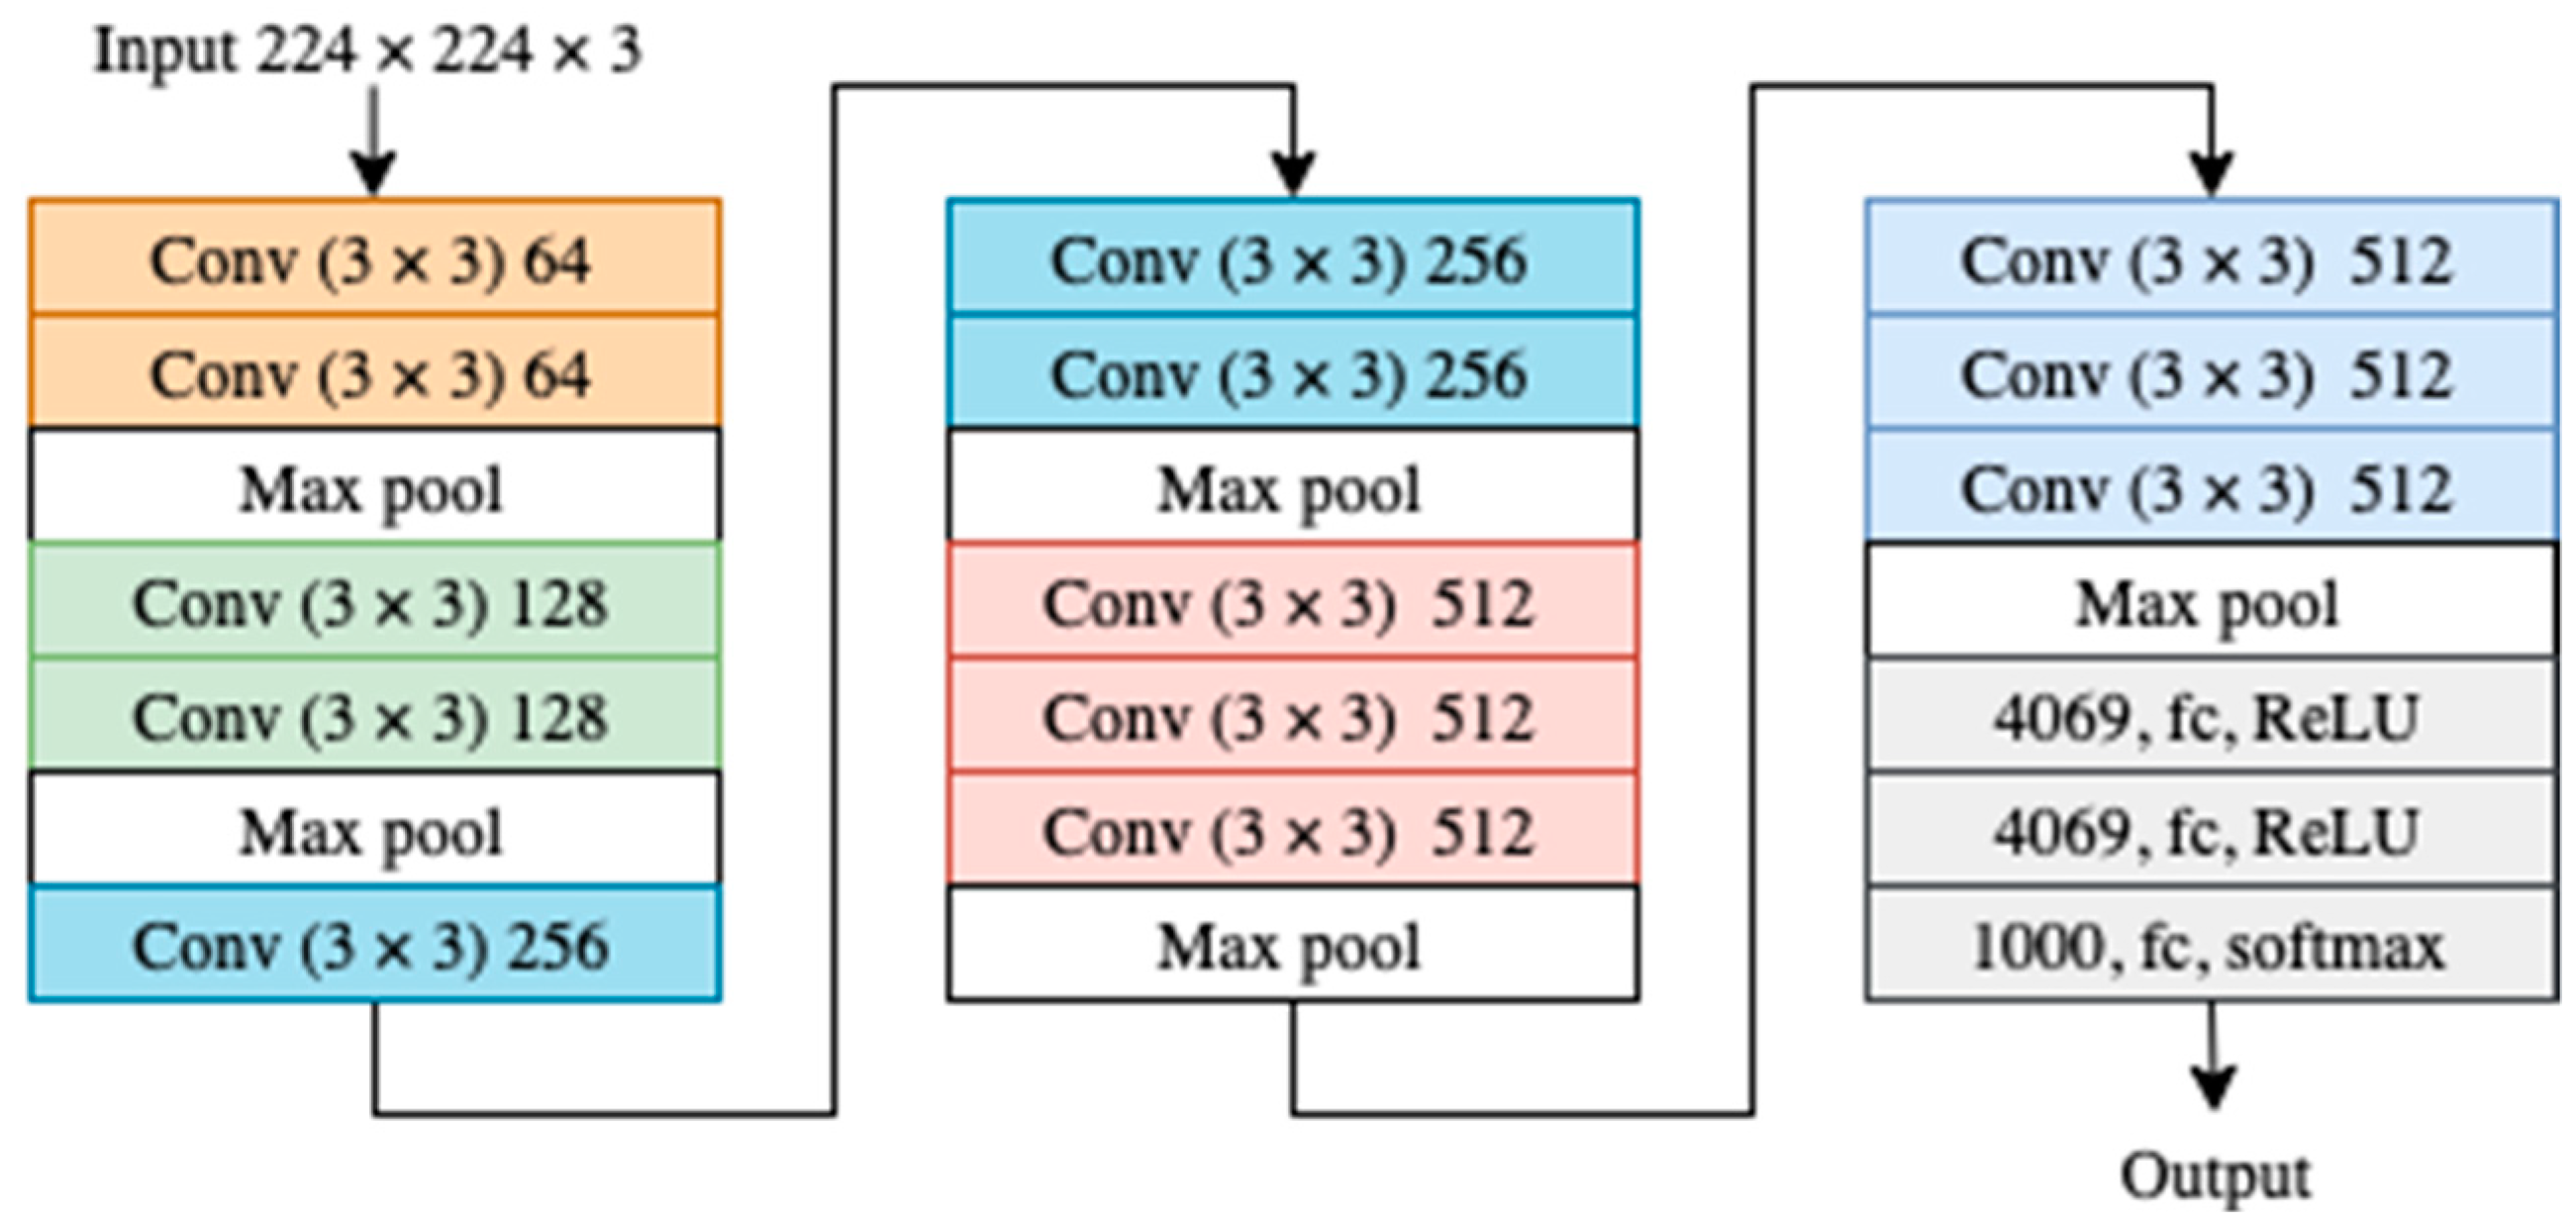
- Simonyan, K.; Zisserman, A. Very Deep Convolutional Networks for Large-Scale Image Recognition. arXiv 2014, arXiv:1409.1556. [Google Scholar]
- Szegedy, C.; Liu, W.; Jia, Y.; Sermanet, P.; Reed, S.; Anguelov, D.; Erhan, D.; Vanhoucke, V.; Rabinovich, A. Going Deeper with Convolutions. In Proceedings of the IEEE Conference on Computer Vision and Pattern Recognition (CVPR), Boston, MA, USA, 7–12 June 2014; pp. 1–9. [Google Scholar]
- Szegedy, C.; Vanhoucke, V.; Ioffe, S.; Shlens, J.; Wojna, Z. Rethinking the Inception Architecture for Computer Vision. In Proceedings of the IEEE Conference on Computer Vision and Pattern Recognition (CVPR), Las Vegas, NV, USA, 27–30 June 2016; pp. 2818–2826. [Google Scholar] [CrossRef] [Green Version]
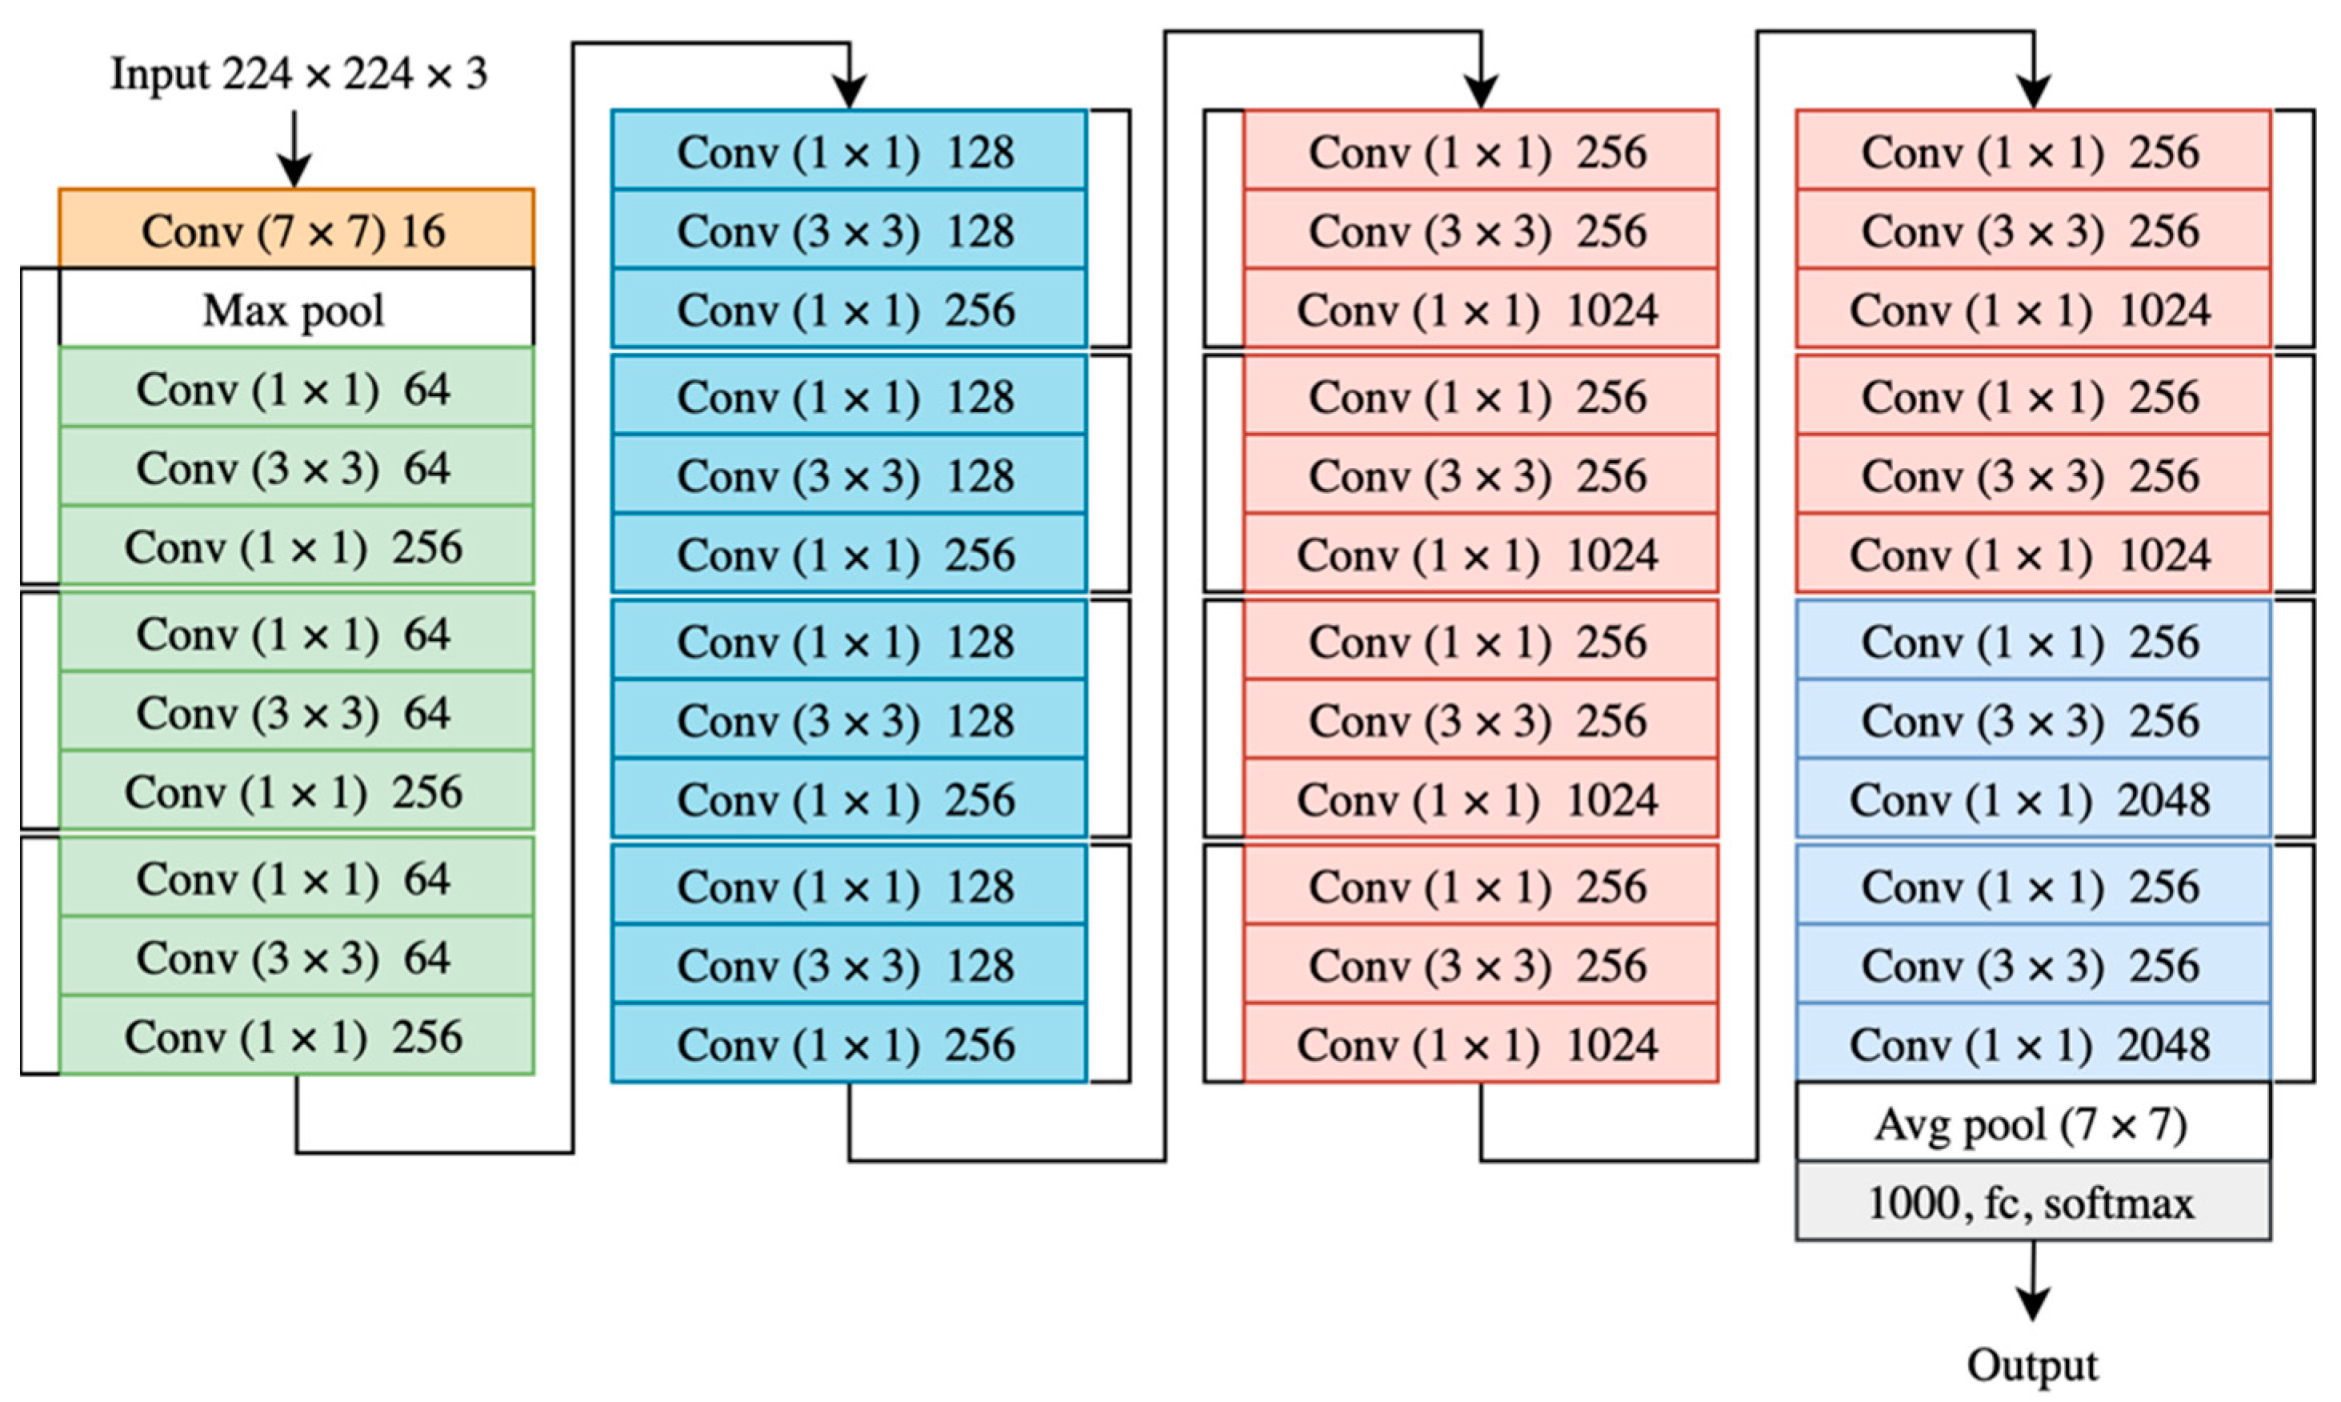
- He, K.; Zhang, X.; Ren, S.; Sun, J. Deep Residual Learning for Image Recognition. In Proceedings of the 2016 IEEE Conference on Computer Vision and Pattern Recognition (CVPR), Las Vegas, NV, USA, 27–30 June 2016; pp. 770–778. [Google Scholar] [CrossRef] [Green Version]
- Veit, A.; Wilber, M.J.; Belongie, S. Residual Networks Behave Like Ensembles of Relatively Shallow Networks. arXiv 2016, arXiv:1605.06431v2. [Google Scholar]
- Zagoruyko, S.; Komodakis, N. Wide Residual Networks. arXiv 2016, arXiv:1605.07146. [Google Scholar]
- Wu, Z.; Shen, C.; Van Den Hengel, A. Wider or Deeper: Revisiting the ResNet Model for Visual Recognition. Pattern Recognit. 2019, 90, 119–133. [Google Scholar] [CrossRef] [Green Version]
- Xie, S.; Girshick, R.; Dollár, P.; Tu, Z.; He, K. Aggregated Residual Transformations for Deep Neural Networks. In Proceedings of the IEEE Conference on Computer Vision and Pattern Recognition (CVPR), Honolulu, HI, USA, 21–26 July 2016; pp. 5987–5995. [Google Scholar]
- Li, L.; Ma, H. RDCTrans U-Net: A Hybrid Variable Architecture for Liver CT Image Segmentation. Sensors 2022, 22, 2452. [Google Scholar] [CrossRef] [PubMed]
- Landro, N.; Gallo, I.; La Grassa, R. Mixing ADAM and SGD: A Combined Optimization Method. arXiv 2020, arXiv:2011.08042. [Google Scholar]
- Jiang, X.; Hu, B.; Satapathy, S.C.; Wang, S.-H.; Zhang, Y.-D. Fingerspelling Identification for Chinese Sign Language via AlexNet-Based Transfer Learning and Adam Optimizer. Sci. Program. 2020, 2020, 3291426. [Google Scholar] [CrossRef]
- Jiang, S.; Chen, Y. Hand Gesture Recognition by Using 3DCNN and LSTM with Adam Optimizer. In Advances in Multimedia Information Processing—PCM 2017; Zeng, B., Huang, Q., El Saddik, A., Li, H., Jiang, S., Fan, X., Eds.; PCM 2017. Lecture Notes in Computer Science; Springer: Cham, Switzerland, 2018; Volume 10735. [Google Scholar] [CrossRef]
- Liu, L.; Jiang, H.; He, P.; Chen, W.; Liu, X.; Gao, J.; Han, J. On the Variance of the Adaptive Learning Rate and Beyond. arXiv 2019, arXiv:1908.03265. [Google Scholar]
- Cui, K.; Zhan, Z.; Pan, C. Applying Radam Method to Improve Treatment of Convolutional Neural Network on Banknote Identification. In Proceedings of the 2020 International Conference on Computer Engineering and Application (ICCEA), Guangzhou, China, 18–20 March 2020. [Google Scholar] [CrossRef]
- Ashraf, A.B.; Lucey, S.; Cohn, J.F.; Chen, T.; Ambadar, Z.; Prkachin, K.; Solomon, P.; Theobald, B.J. The Painful Face: Pain Expression Recognition using Active Appearance Models. In Proceedings of the 9th International Conference on Multimodal Interfaces, ACM, Nagoya, Aichi, Japan, 12–15 November 2007; pp. 9–14. [Google Scholar] [CrossRef]
- Lucey, P.; Cohn, J.F.; Prkachin, K.M.; Solomon, P.E.; Chew, S.; Matthews, I. Painful Monitoring: Automatic Pain Monitoring using the UNBC-McMaster Shoulder Pain Expression Archive Database. Image Vis. Comput. 2012, 30, 197–205. [Google Scholar] [CrossRef]
- Khan, R.A.; Meyer, A.; Konik, H.; Bouakaz, S. Pain Detection through Shape and Appearance Features. In Proceedings of the 2013 IEEE International Conference on Multimedia and Expo (ICME), San Jose, CA, USA, 15–19 July 2013. [Google Scholar] [CrossRef]
- Zhou, J.; Hong, X.; Su, F.; Zhao, G. Recurrent Convolutional Neural Network Regression for Continuous Pain Intensity Estimation in Video. In Proceedings of the IEEE Conference on Computer Vision and Pattern Recognition (CVPR) Workshops, Las Vegas, NV, USA, 27–30 June 2016; pp. 84–92. [Google Scholar]
- Rodriguez, P.; Cucurull, G.; Gonzalez, J.; Gonfaus, J.M.; Nasrollahi, K.; Moeslund, T.B.; Roca, F.X. Deep Pain: Exploiting Long Short-Term Memory Networks for Facial Expression Classification. IEEE Trans. Cybern. 2017, 52, 3314–3324. [Google Scholar] [CrossRef] [Green Version]
- Semwal, A.; Londhe, N.D. MVFNet: A multi-view fusion network for pain intensity assessment in unconstrained environment. Biomed. Signal Processing Control. 2021, 67, 102537. Available online: https://www.sciencedirect.com/science/article/pii/S1746809421001348 (accessed on 10 March 2022). [CrossRef]
- Vaish, A.; Gupta, S. A Novel Approach for Pain Intensity Detection by KAZE Features. In Proceedings of the Third International Conference on Microelectronics, Computing and Communication Systems; Springer: Singapore, 2019. [Google Scholar]
- Viola, P.; Jones, M. Rapid Object Detection using a Boosted Cascade of Simple Features. In Proceedings of the 2001 IEEE Computer Society Conference on Computer Vision and Pattern Recognition. CVPR 2001, Kauai, HI, USA, 8–14 December 2001; Volume 1. [Google Scholar] [CrossRef]
- Zhang, K.; Zhang, Z.; Li, Z.; Qiao, Y. Joint Face Detection and Alignment using Multitask Cascaded Convolutional Networks. IEEE Signal Processing Lett. 2016, 23, 1499–1503. [Google Scholar] [CrossRef] [Green Version]
- Parallel Distributed Systems Lab—PDS Lab. Available online: http://pds.ucdenver.edu/ (accessed on 8 April 2022).
- Anaconda|The World’s Most Popular Data Science Platform. Available online: https://www.anaconda.com (accessed on 8 April 2022).
- Keras. The Python Deep Learning API. Available online: https://keras.io/ (accessed on 8 April 2022).
- OpenCV 4.4.0—OpenCV. Available online: https://opencv.org/opencv-4-4-0/ (accessed on 8 April 2022).


| The Class | Label | PISP Code | Number of Images |
|---|---|---|---|
| 1 | No Pain | 0 | 1500 |
| 2 | Low Pain | 1 | 1500 |
| 3 | Moderate Pain | 2 | 1500 |
| 4 | Severe Pain | 3+ | 1500 |
| The Video | Label | Number of Merged Frames | Duration in Second |
|---|---|---|---|
| Video 1 | Sever pain | 397 | 99 |
| Video 2 | Sever pain | 308 | 77 |
| Video 3 | Sever pain | 337 | 84 |
| Video 4 | No pain | 142 | 35 |
| Video 5 | Sever pain | 263 | 65 |
| Video 6 | No pain | 165 | 41 |
| The Model | The Optimizer | Precision | Recall | F1-Score |
|---|---|---|---|---|
| VGG16 | SGD | 98.42 | 98.58 | 98.47 |
| ADAM | 99.84 | 99.81 | 99.83 | |
| RMSprop | 99.12 | 99.17 | 99.14 | |
| RAdam | 99.30 | 99.84 | 99.81 | |
| InceptionV3 | SGD | 99.84 | 99.81 | 99.83 |
| ADAM | 97.33 | 96.94 | 97.05 | |
| RMSprop | 99.94 | 99.93 | 99.96 | |
| RAdam | 99.51 | 99.48 | 99.49 | |
| ResNet50 | SGD | 99.84 | 99.81 | 99.83 |
| ADAM | 99.84 | 99.81 | 99.83 | |
| RMSprop | 99.84 | 99.81 | 99.83 | |
| RAdam | 99.84 | 99.81 | 99.83 | |
| ResNeXt50 | SGD | 96.99 | 96.89 | 96.90 |
| ADAM | 99.68 | 99.65 | 99.67 | |
| RMSprop | 99.84 | 99.81 | 99.83 | |
| RAdam | 99.69 | 99.63 | 99.66 |
| The Model | The Optimizer | 10-Fold Cross Validation Accuracy (%) | Accuracy of Unseen Person (%) | Average Accuracy (%) |
|---|---|---|---|---|
| VGG16 | SGD | 97.41 | 82.06 | 89.74 |
| VGG16 | ADAM | 99.12 | 78.15 | 88.64 |
| VGG16 | RMSprop | 97.90 | 66.05 | 81.98 |
| VGG16 | RAdam | 99.30 | 65.80 | 82.55 |
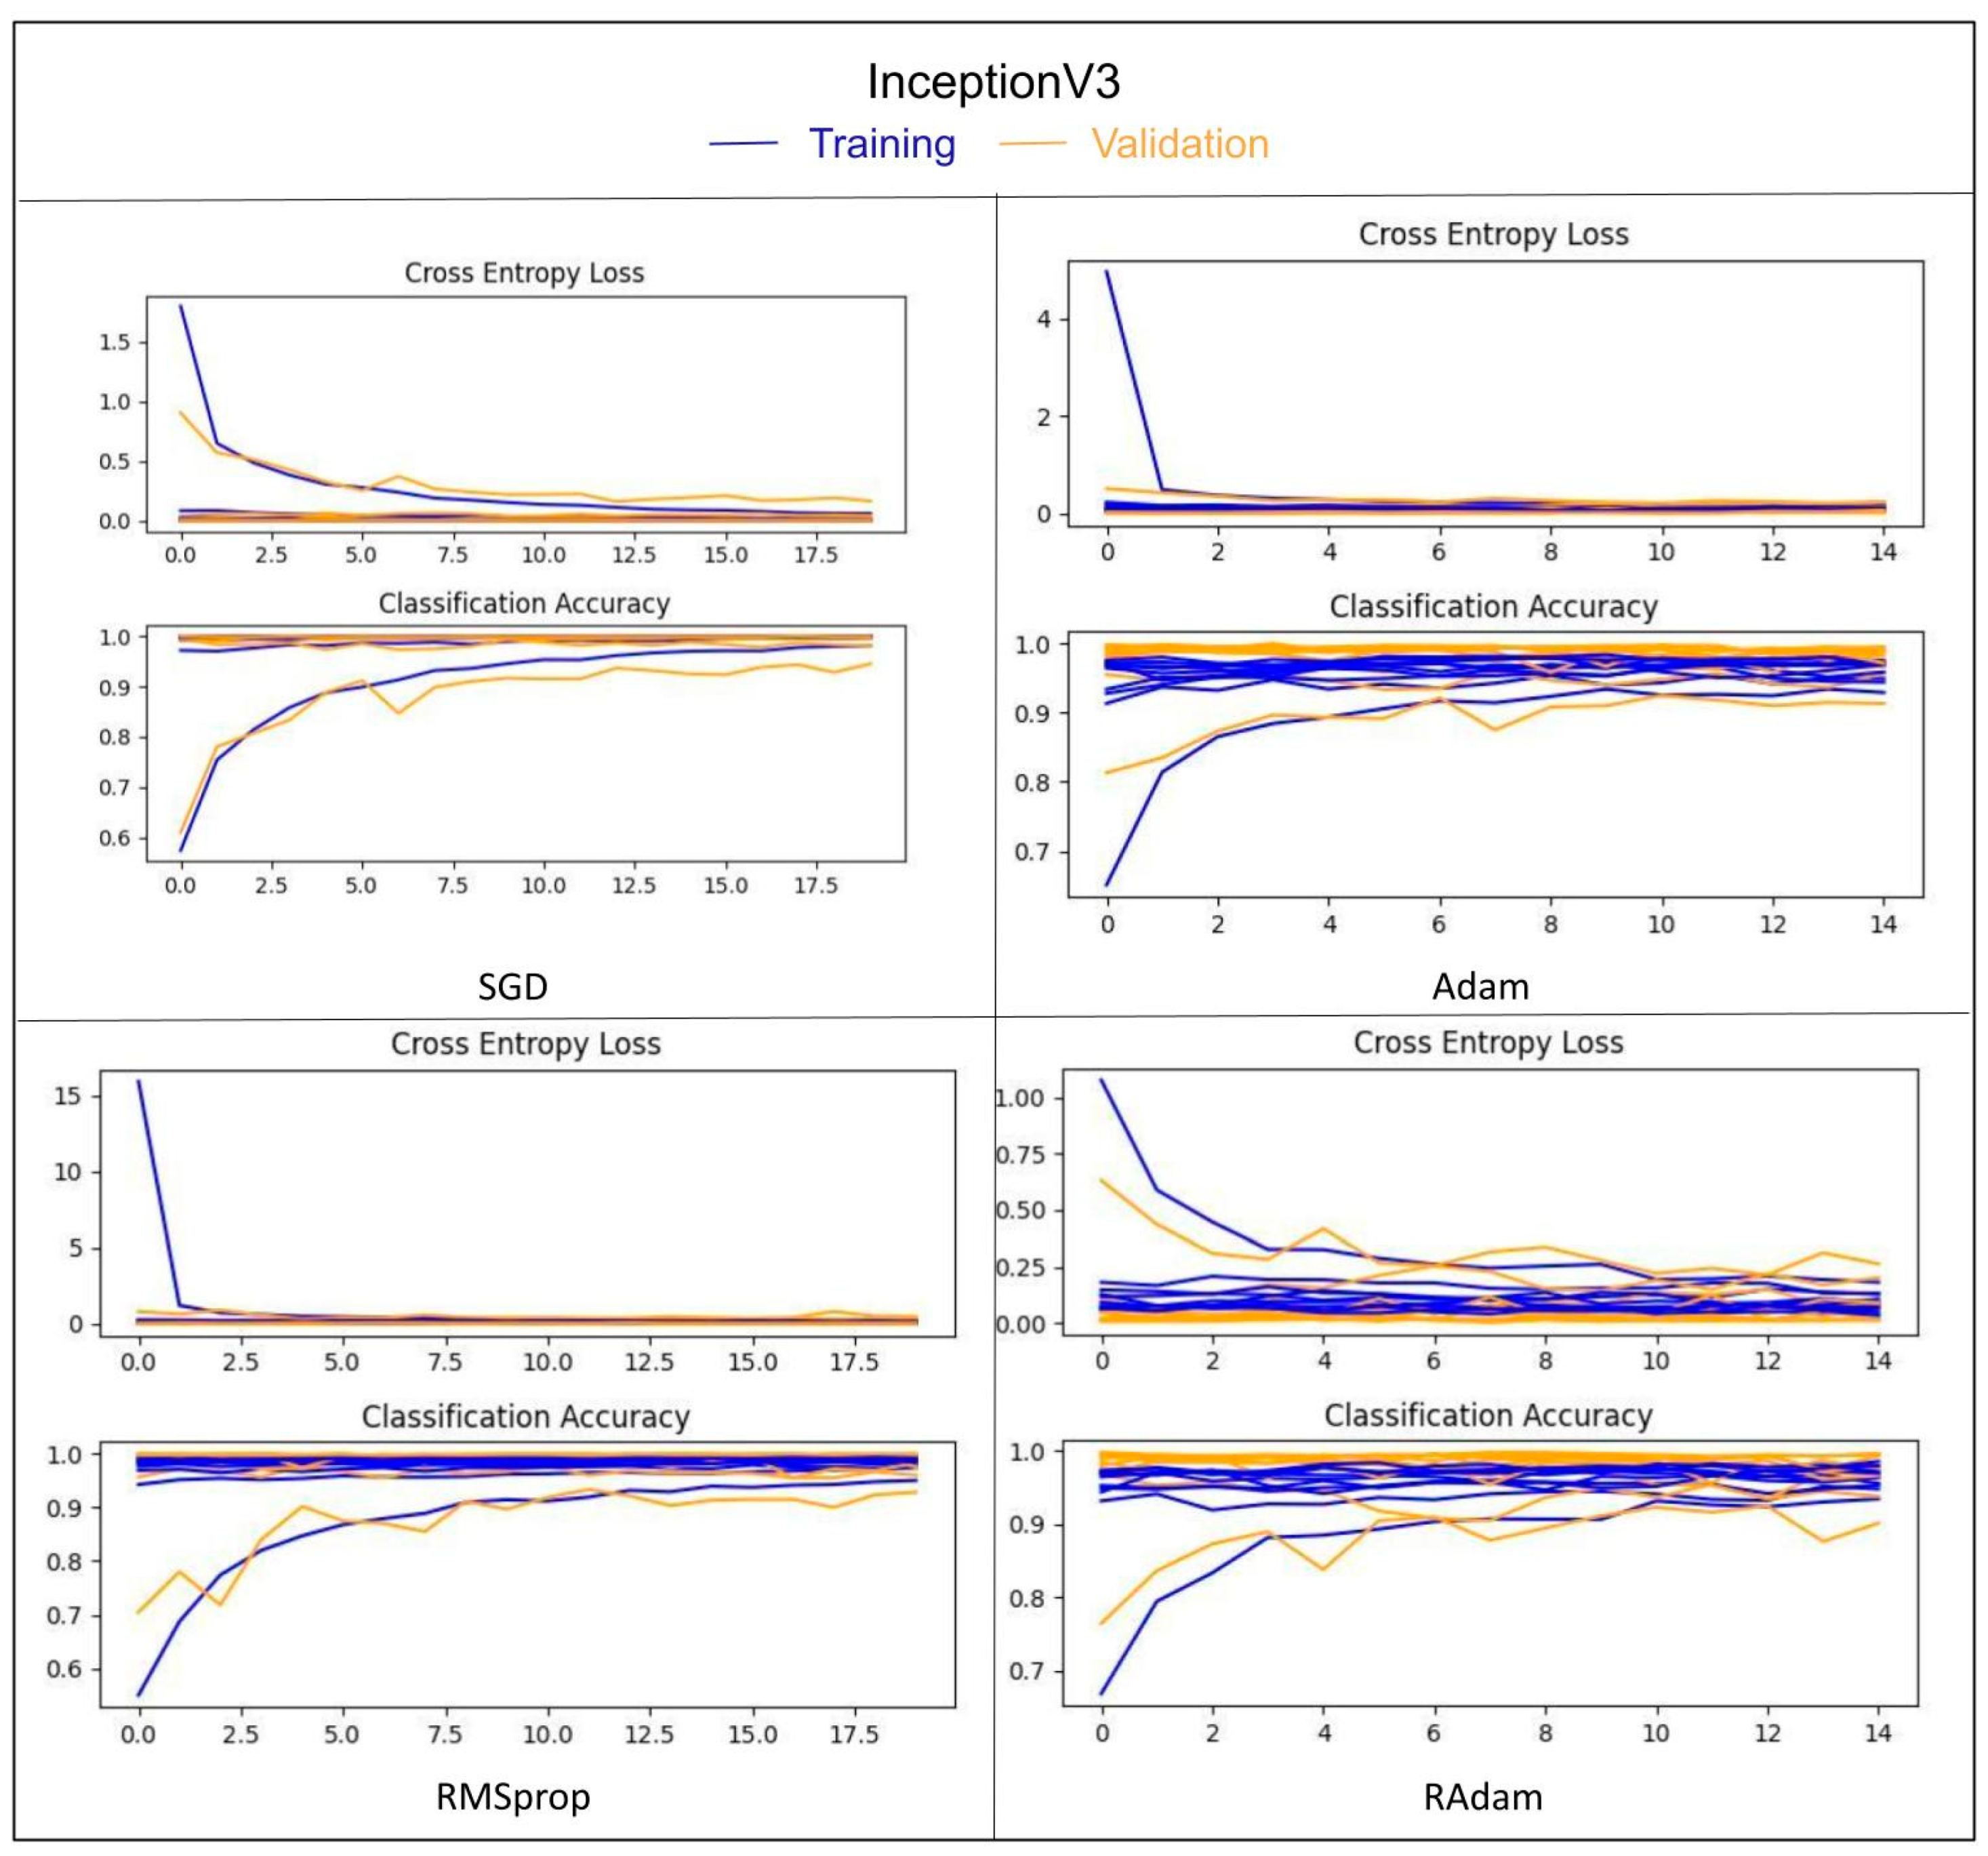
| InceptionV3 | SGD | 99.10 | 90.56 | 94.83 |
| InceptionV3 | ADAM | 97.45 | 84.48 | 90.97 |
| InceptionV3 | RMSprop | 98.27 | 82.37 | 90.32 |
| InceptionV3 | RAdam | 96.93 | 86.10 | 91.52 |
| ResNet50 | SGD | 96.58 | 76.10 | 86.34 |
| ResNet50 | ADAM | 99.23 | 88.21 | 93.72 |
| ResNet50 | RMSprop | 99.28 | 83.86 | 91.57 |
| ResNet50 | RAdam | 99.27 | 83.61 | 91.44 |
| ResNeXt50 | SGD | 89.85 | 90.19 | 90.02 |
| ResNeXt50 | ADAM | 97.98 | 74.98 | 86.48 |
| ResNeXt50 | RMSprop | 98.18 | 71.14 | 84.96 |
| ResNeXt50 | RAdam | 98.40 | 80.76 | 89.58 |
| Approach | Use All Images in Dataset | Number of Used Images | Number of Classes | k-Fold Cross Validation Accuracy (%) | Accuracy of Unseen Subject (%) |
|---|---|---|---|---|---|
| Khan et al. [30] | Yes | 40,029 No pain 8369 Pain | 2 | 96.40 | |
| P. Rodriguez et al. [32] | No | - | 2 | 83.00 | |
| Semwal and Londhe [9] | No | 16,000 | 4 [0,1,(2 + 3),(4 + 5+)] | 94.00 | |
| Semwal and Londhe [33] | No + collected data of 10 patients suffering from pain in a clinic | 16,000 from UNBC-McMaster + 16,460 from the collected data | 4 | 96.00 | |
| Vaish and Sagar [34] | No | - | 4 | 91.87 | |
| Proposed approach | No | 6000 | 4 [0,1,2,3+] | 99.10 | 90.65 |
| Dataset | Accuracy (%) | Performance (%) |
|---|---|---|
| The brightened images | 89.75 | −00.81 |
| The dimmed images | 91.56 | +00.91 |
| The images with a slight rotation. | 91.17 | +00.52 |
| 2-B-30 | 2-M-30 | 4-B-30 | 4-M-30 | |
|---|---|---|---|---|
| Video 1 | 32.97 | 12.34 | 40.38 | 15.93 |
| Video 2 | 03.33 | 02.95 | 06.70 | 12.45 |
| Video 3 | 07.05 | 06.09 | 07.76 | 06.11 |
| Video 4 | No alarm | No alarm | No alarm | No alarm |
| Video 5 | 48.31 | 06.89 | 51.96 | 07.11 |
| Video 6 | No alarm | No alarm | No alarm | No alarm |
| The average | 27.68 | 6.49 | 29.86 | 6.61 |
Publisher’s Note: MDPI stays neutral with regard to jurisdictional claims in published maps and institutional affiliations. |
© 2022 by the authors. Licensee MDPI, Basel, Switzerland. This article is an open access article distributed under the terms and conditions of the Creative Commons Attribution (CC BY) license (https://creativecommons.org/licenses/by/4.0/).
Share and Cite
Alghamdi, T.; Alaghband, G. Facial Expressions Based Automatic Pain Assessment System. Appl. Sci. 2022, 12, 6423. https://doi.org/10.3390/app12136423
Alghamdi T, Alaghband G. Facial Expressions Based Automatic Pain Assessment System. Applied Sciences. 2022; 12(13):6423. https://doi.org/10.3390/app12136423
Chicago/Turabian StyleAlghamdi, Thoria, and Gita Alaghband. 2022. "Facial Expressions Based Automatic Pain Assessment System" Applied Sciences 12, no. 13: 6423. https://doi.org/10.3390/app12136423
APA StyleAlghamdi, T., & Alaghband, G. (2022). Facial Expressions Based Automatic Pain Assessment System. Applied Sciences, 12(13), 6423. https://doi.org/10.3390/app12136423