Article

The Analysis of Pneumatic Wheel Rim Deformation While Hitting an Obstacle

1
Faculty of Mechanical Engineering, Lublin University of Technology, 20-618 Lublin, Poland
2
Department of Transport Means and Diagnostics, Faculty of Transport Engineering, University of Pardubice, 532 10 Pardubice, Czech Republic
*
Author to whom correspondence should be addressed.
Appl. Sci. 2022, 12(13), 6371; https://doi.org/10.3390/app12136371
Submission received: 1 June 2022 / Revised: 17 June 2022 / Accepted: 21 June 2022 / Published: 23 June 2022

Abstract

:
The article presents the results of simulations using the finite element method (FEM) aimed at examining the extent of damage to the wheel rim as a result of hitting an obstacle. The obtained results can be used as comparative data during the performance of expert opinions to give an answer as to how the damage occurred. The data obtained from the FEM simulation can also be used in the process of geometric optimization of the rim, which aims to obtain a rim resistant to this type of damage.

1. Introduction

Road wheels of vehicles should be treated as a fundamental factor influencing the level of active safety. They transfer not only the torque generated by the propulsion system, but also all the forces that result in a reduction in speed and maintenance of directional stability. Along with the suspension system, the wheels are also the first element reacting to the forces caused by moving on the surface and damping vibrations related to its unevenness. It often happens that the wheels are one of the first elements transmitting destructive forces—during collisions and road accidents. Many studies on vehicle traffic safety have shown that the tire road friction coefficient (TRFC) is correlated with the accident probability [1,2,3,4]. According to the report on road safety in Poland [5], in 2020 the share of road accidents due to technical reasons was 17.1%. However, excessive speed of vehicles is still the main cause of road accidents. This factor is also widely discussed in the literature [6,7,8], examples of studies from the Czech Republic are presented in [9] and from Hungary in [10]. The issues of road transport safety are widely discussed in the literature, for example in [11,12,13,14,15,16]. Many authors pay attention to vehicle safety systems: braking systems, including Anti-lock Braking System (ABS) and Electronic Stability Program (ESP) [17,18,19,20,21,22], vehicle suspension systems [23,24,25,26], tires [27,28,29,30], tire pressure monitoring systems (TPMS) [31,32], and other systems [33,34,35,36]. In [37], tests mapping the damage to the wheel of a tire on a vehicle on a special test stand are described.
The problem of studying the phenomena occurring between the elements of road wheels and the ground is complex. Due to this fact, the analysis of damage to these elements is not used to recreate the course and assess the causes of incidents, collisions, and road accidents. Damage to road wheels—rims in particular—is a common phenomenon that experts in this field deal with. It occurs as a result of driving into a hole in the road surface, hitting an obstacle, or as a result of a collision with another vehicle. One of the key problems in the analysis of this type of event is determining the speed value—regardless of whether the problem concerns “only” the payment of compensation for damage (e.g., resulting from the road condition) or determining the details of the course of a road accident and determining its cause. In recent times, experts dealing with this subject have less and less possibilities in terms of the methods of analysis used. This is due to the use of more and more modern technological solutions in vehicles, which make the known and used so far “tools” useless. Attempts to use traces in the form of damage to wheel elements—despite the fact that the description of the phenomena may be problematic—should be considered a justified and necessary direction.
Due to road safety, the wheels are subjected to endurance tests [38]. The scope of the tests includes the measurements of stresses during the simultaneous action of bending and torsional moments as well as fatigue tests [39,40,41]. The next laboratory tests that the wheels are subjected to are impact tests. Their methodology is described by international standards or by standardized test procedures directly defined by vehicle manufacturers. Impact tests are mandatory for newly designed car rims and their assigned tires. The tests are designed to simulate a collision with an obstacle hitting the side surface of the wheel [42,43] and in the radial direction [44]. The test results are intended to identify the stresses arising in the tire and rim, and to measure the energy at which the internal structure of the tire is broken. During the impact tests, the wheel is attached to the supporting structure and the beater hits the side of the wheel or the tire tread. The weight of the hammer and the height of the fall depend on the size of the wheel. Cracks and deformations of the wheels are measured after the tests and their values must be within the specified permissible ranges [37]. Currently, there are many combinations of rim and tire selection for a given car model. Applying a different type of tire to a given rim, e.g., a low-profile tire, will significantly change the stress distribution during hitting an obstacle or a collision. For this reason, the results of laboratory tests, which determine the strength of the wheel rims, are not useful for the analysis of the course of real road incidents. Numerical simulation of wheel impact tests can reduce the risk of test failure and be a valuable tool for the designer to obtain more efficient and light wheels [45].

2. Materials and Methods

The main and basic scientific assumption adopted by the authors was to develop a tire wheel model and to conduct a study aimed at analyzing the distribution of stresses and strains. The road wheel system, due to its complexity in terms of energy consumption and the ability to suppress excitations from objects with which it interacts, is highly complicated. The tire is a complex structure, made of numerous layers of materials, e.g., steel, nylon, with different strength properties. In addition, these layers have different spatial orientation, and their bonding with the rubber results in an element with a heterogeneous structure. For this reason, the tire is an element whose structure is difficult to model. The methodology of numerical tests of tires has been described, among others, in [38,46,47,48,49,50]. The research conducted by the authors was divided into stages. This study presents and discusses the results of the first stage. It takes into account the wheel model in which a simplified (general) tire model was adopted. The work was mainly focused on the analysis of the phenomena occurring in the wheel rim with the “simplified” tire model. The conducted numerical tests were related to the simulation of a car wheel hitting an obstacle when driving perpendicularly against an obstacle such as a curb. The distribution of stresses and deformations of the wheel rim was analyzed in detail. The image of the deformation of the wheel rim is a derivative of the static pressure, air pressure in the tire, and the speed of hitting an obstacle. The obtained test results can be used in the process of reconstruction of road events, collisions, and accidents. The next stages of the research assume the use of an extensive tire model (taking into account its structure and structure differentiation, as well as validation of the developed numerical model based on experimental tests).

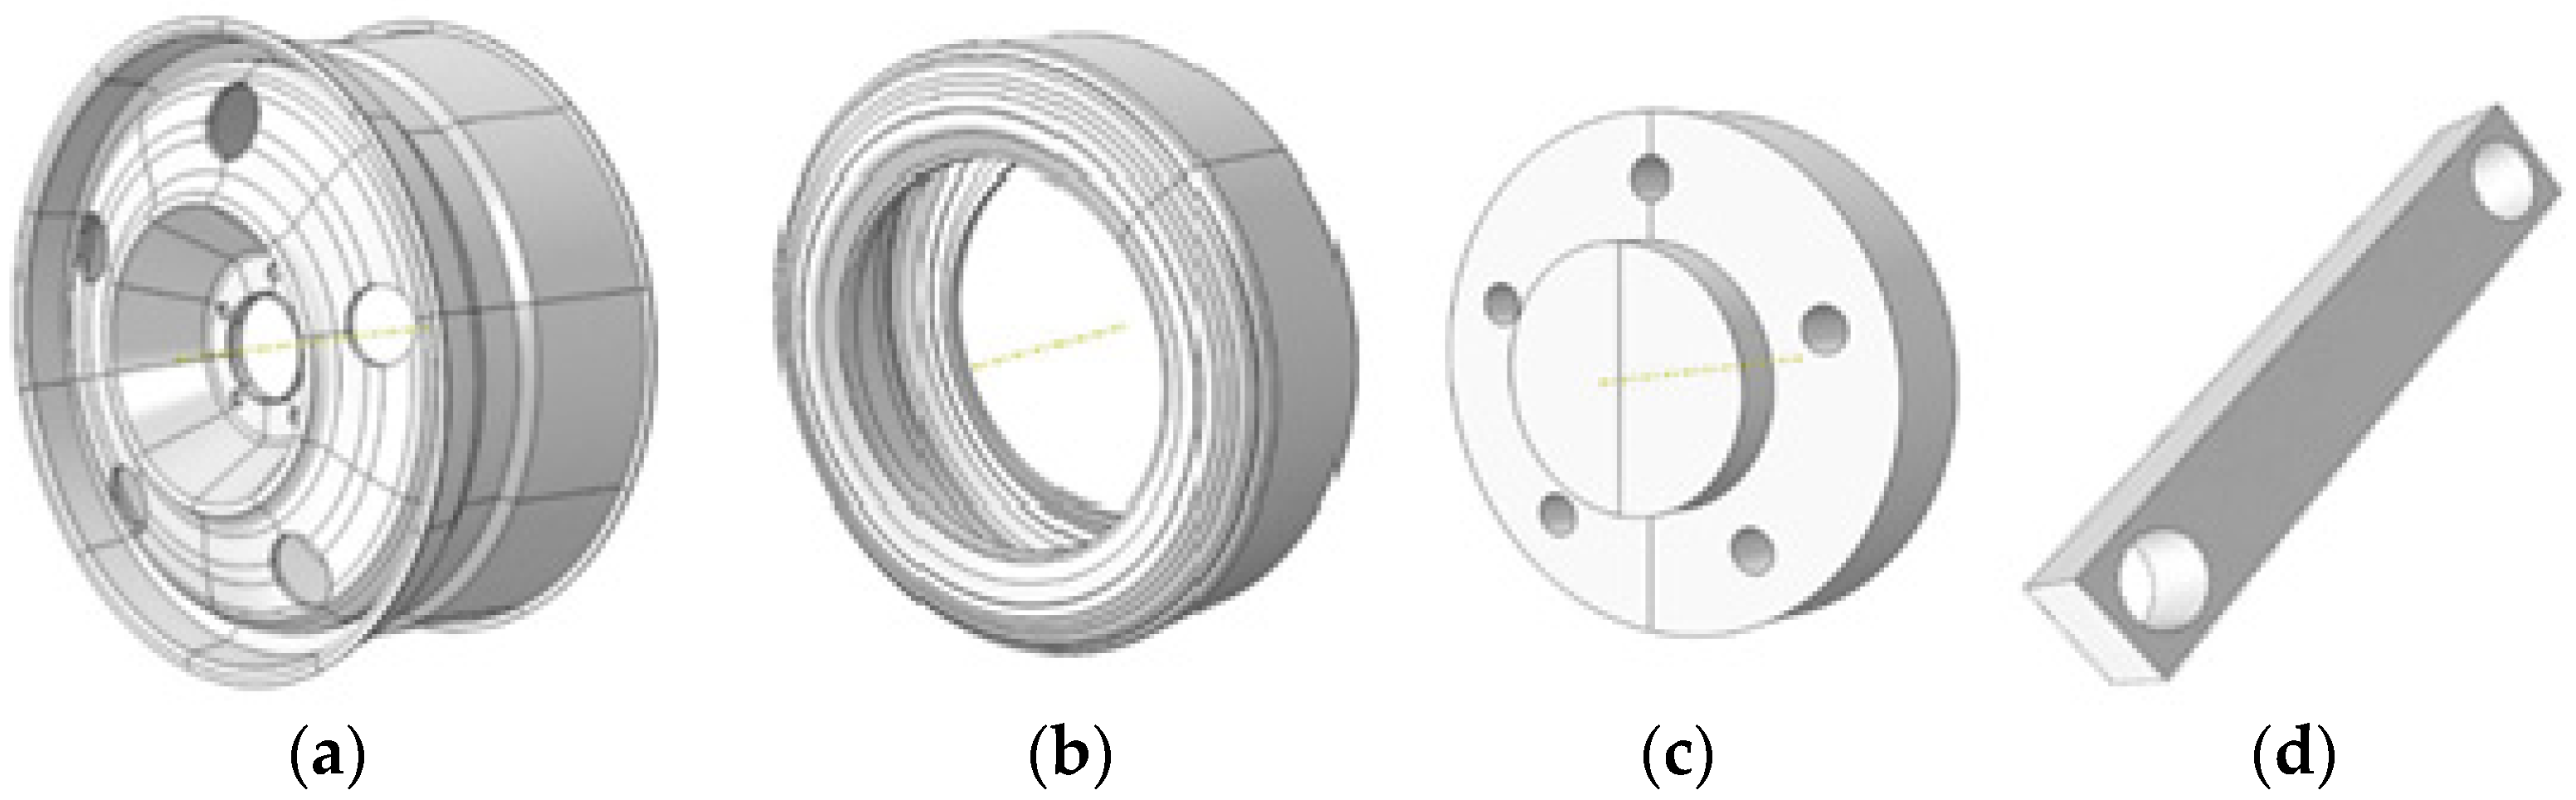
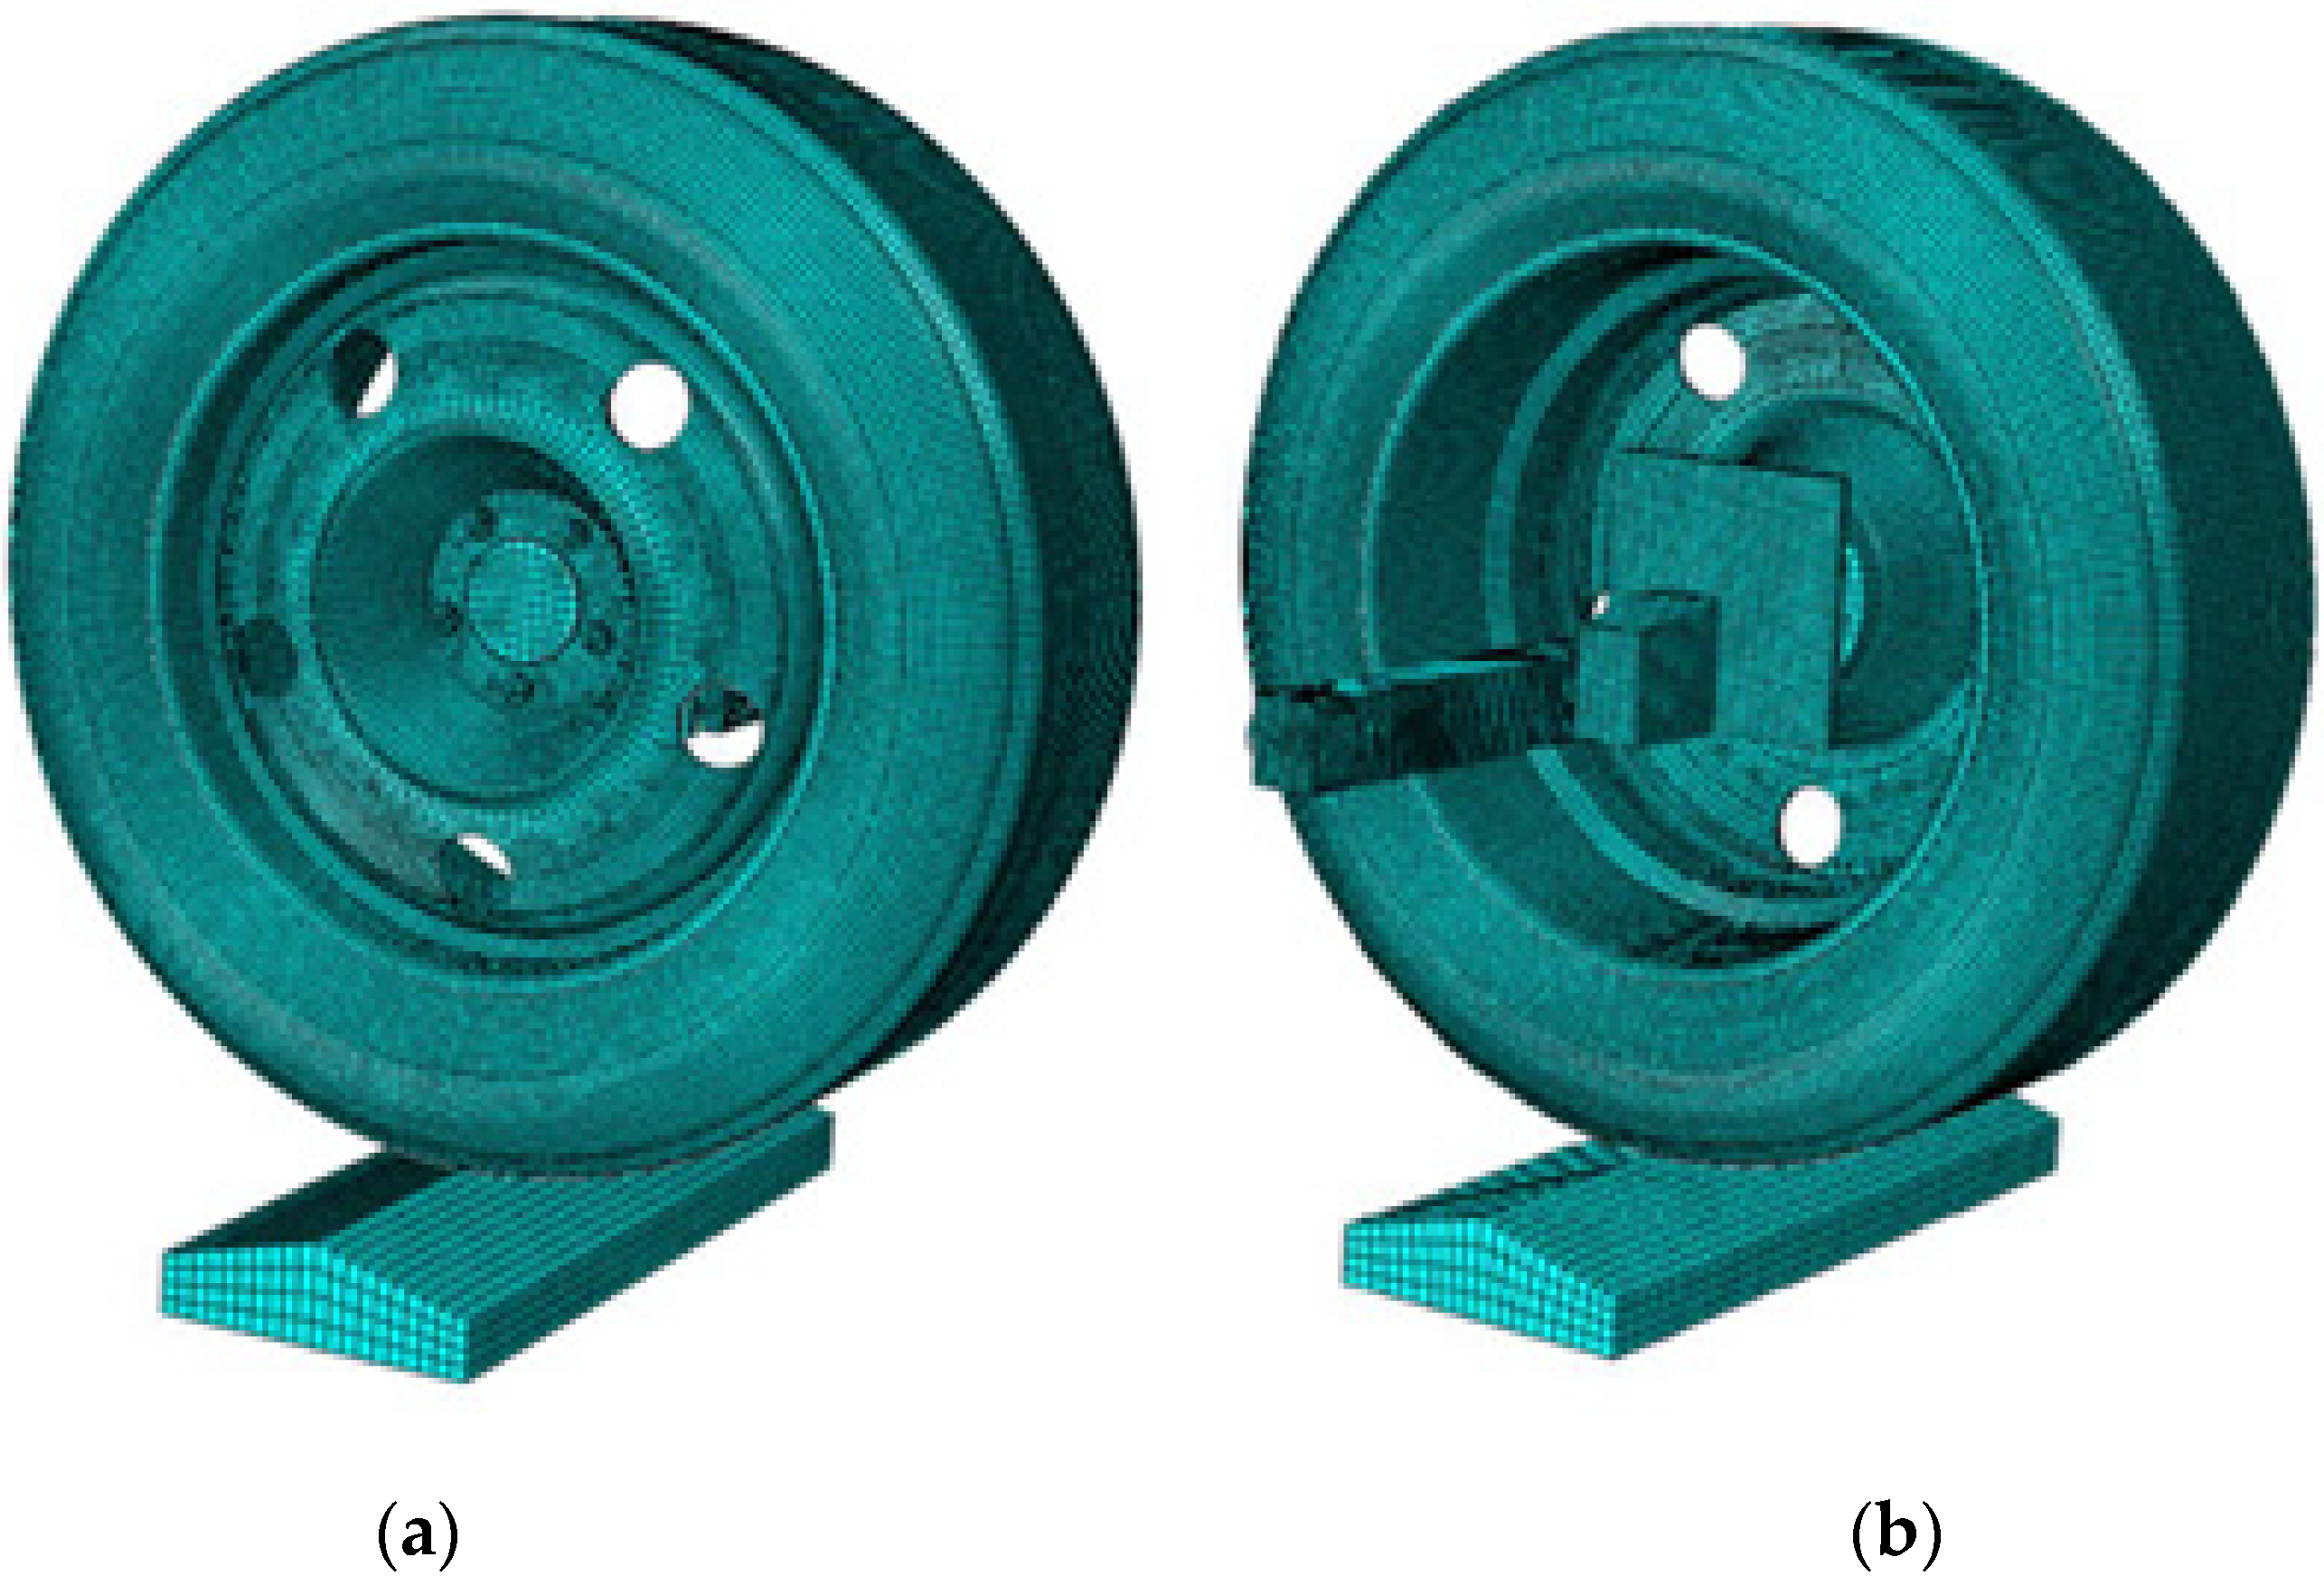
3. Model Subject to Numerical Research

The simulation method based on computer-aided design is characterized by low cost and high safety factor and allows to realistically recreate the failure state [45,51,52]. Due to the complexity and non-linearity of the tire, the tire is usually simplified or neglected in the simulation of the wheel-to-obstacle test [53]. Numerical tests were carried out in the Abaqus program. A solid wheel model was made, consisting of a 225/50R17 tire and a 7.5J×17 ET34 rim.
The rubber layer was described as a non-linear constitutive elastic-plastic material based on the Mooney–Rivlin model [44,46] which was assigned the following parameter values:
  • C10 = 0.14 MPa;
  • C01 = 1.8 MPa;
  • D1 = 0 MPa;
  • ρ = 1100 kg/m3.
The air pressure inside the tire was simulated by applying a pressure of 230 kPa to the inner surface of the tire and the rim. This kind of mapping the pressure ignores the phenomenon of air compression when hitting an obstacle.
The steel belt inside the tire was simulated by a steel rim with a thickness of 0.35 mm, the width of which corresponds to the internal dimension of the tire. It was modeled as a skin element and connected to the inner surface of the tire using the Tie command. Elements such as the carcass, tread, and bead core were not used.
A contact interaction is superimposed on the outer and inner surfaces of the tire which interact with each other. This action is designed to simulate the behavior of the rubber being bent and to avoid it from penetrating the inside of the tire. In addition, the outer sides of the tire will touch the rim flanges during flexing, so it was necessary to apply similar interactions here.
The Tie joint was used to connect the rim flange to the tire edges. Without this connection, the tire could deform inwards on impact. In the real tire, the position is maintained by the bead that was omitted in the analyzed model.
The solid model of the tire rim was made in accordance with the standard [54]. The hub model was made on the basis of a real element, but numerous simplifications were used. This is due to the fact that, in numerical analysis, the hub is used only for mounting the tire. From the outside, a pull was made to support the rim collar. The hub does not have a bearing as the simulation does not include the rolling process of the wheel.
In order to ensure the correct movement of the wheel during the impact, its suspension was modeled. The control arm is simplified in the form of a beam with two holes for sleeves. Due to the fact that the simulations were carried out for the wheels in the straight-ahead position, modeling of the rocker joints was abandoned. The solid models of the elements subjected to the FEM analysis are presented in Figure 1.
The solid model of the wheel suspension did not include a spring and a shock absorber. Only a virtual influence of these elements on the shock impulse was introduced. The following parameters were assigned:
  • Spring stiffness 22,000 N/m;
  • Shock absorber damping coefficient (dashpot coefficient) 2000 Ns/m.
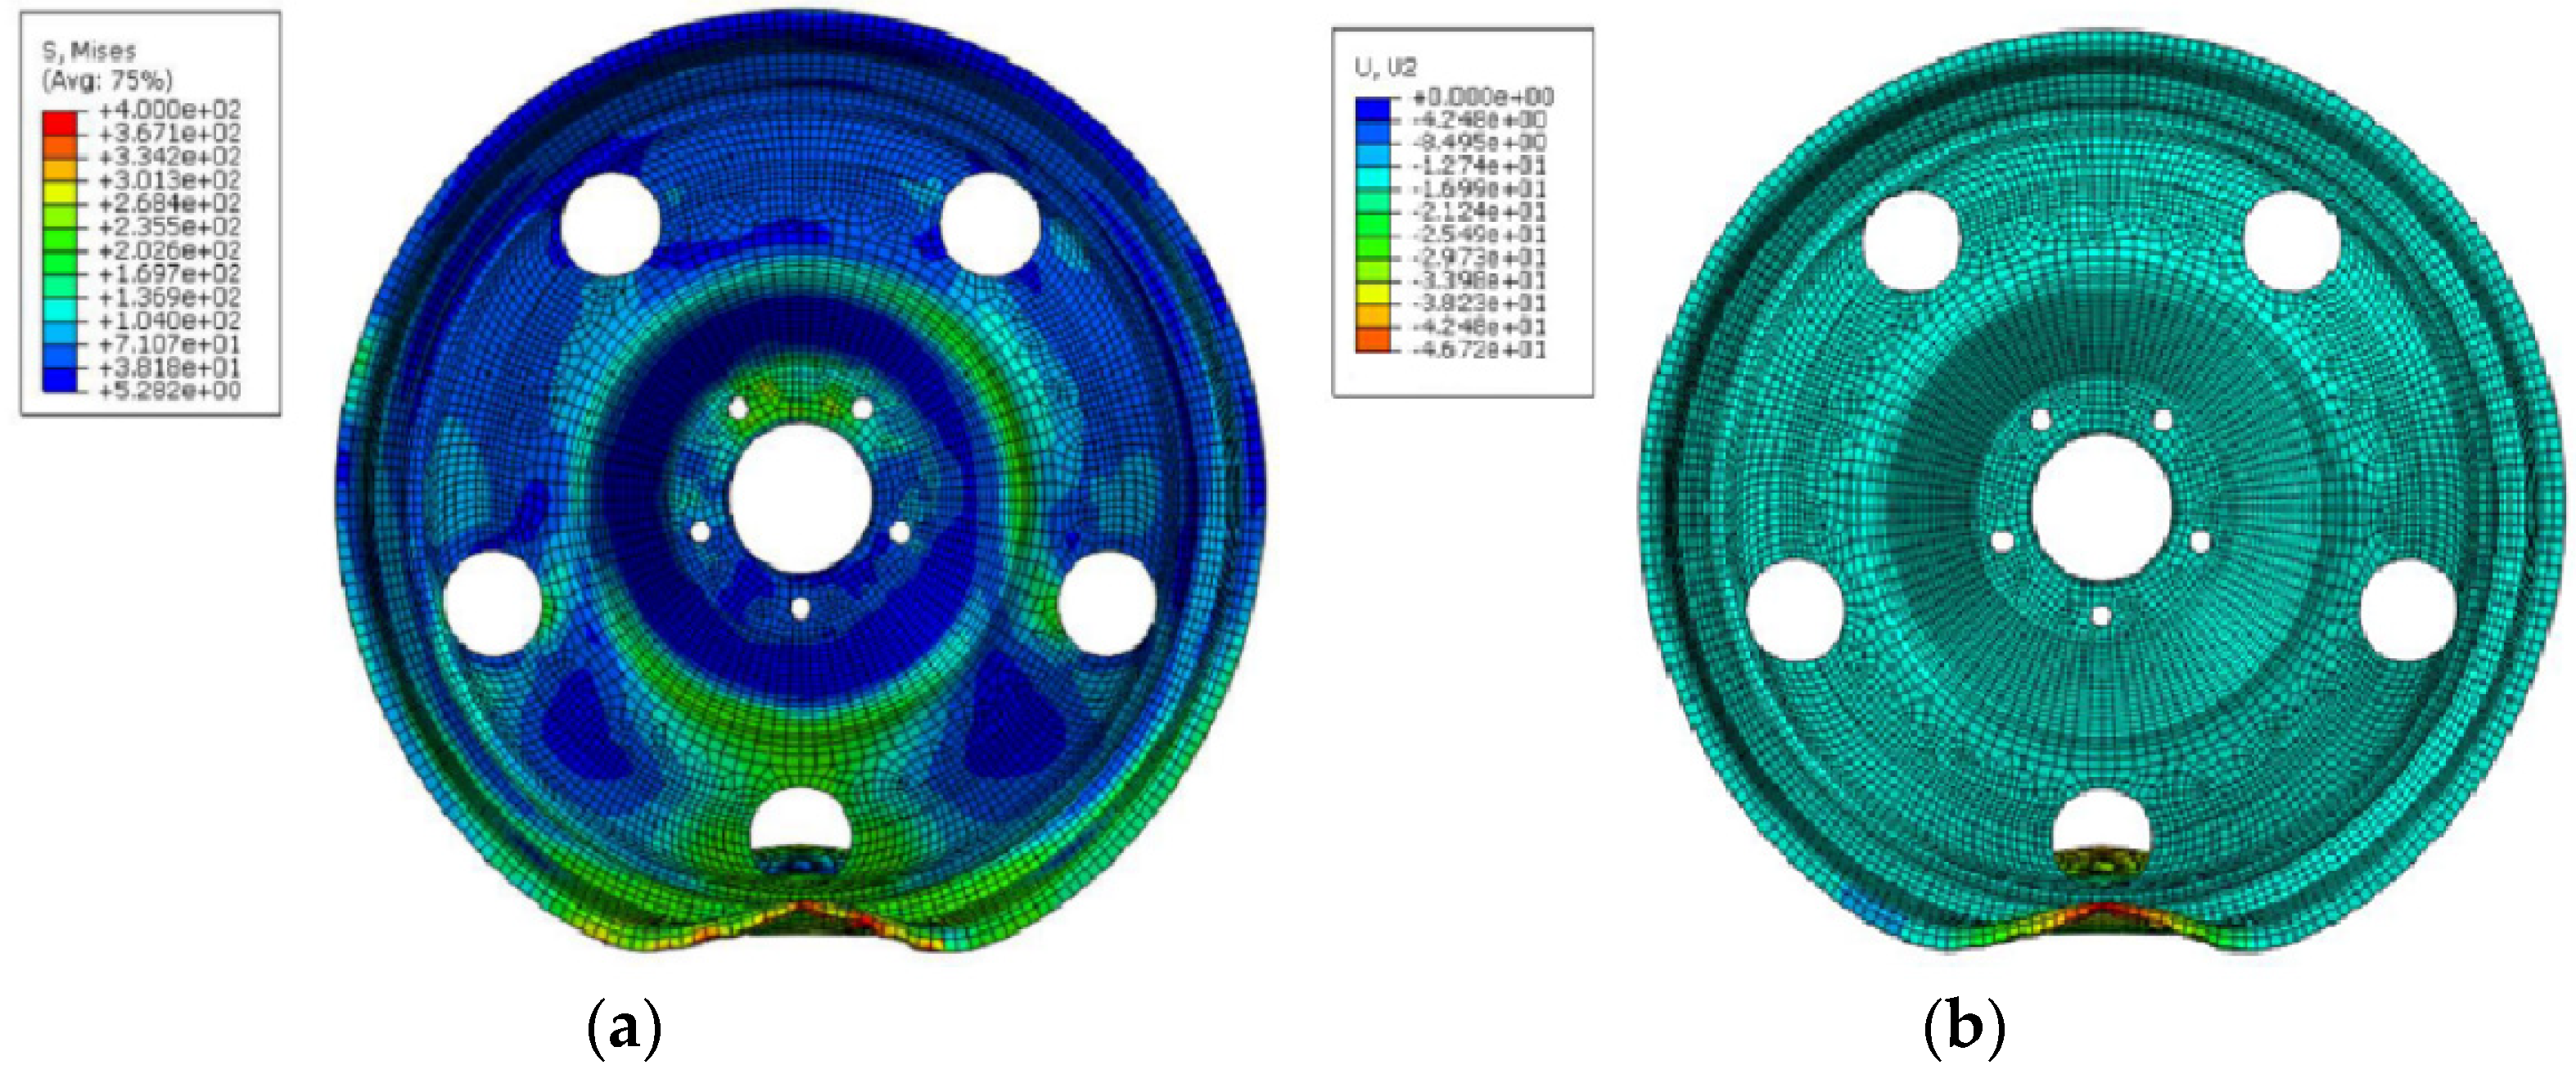
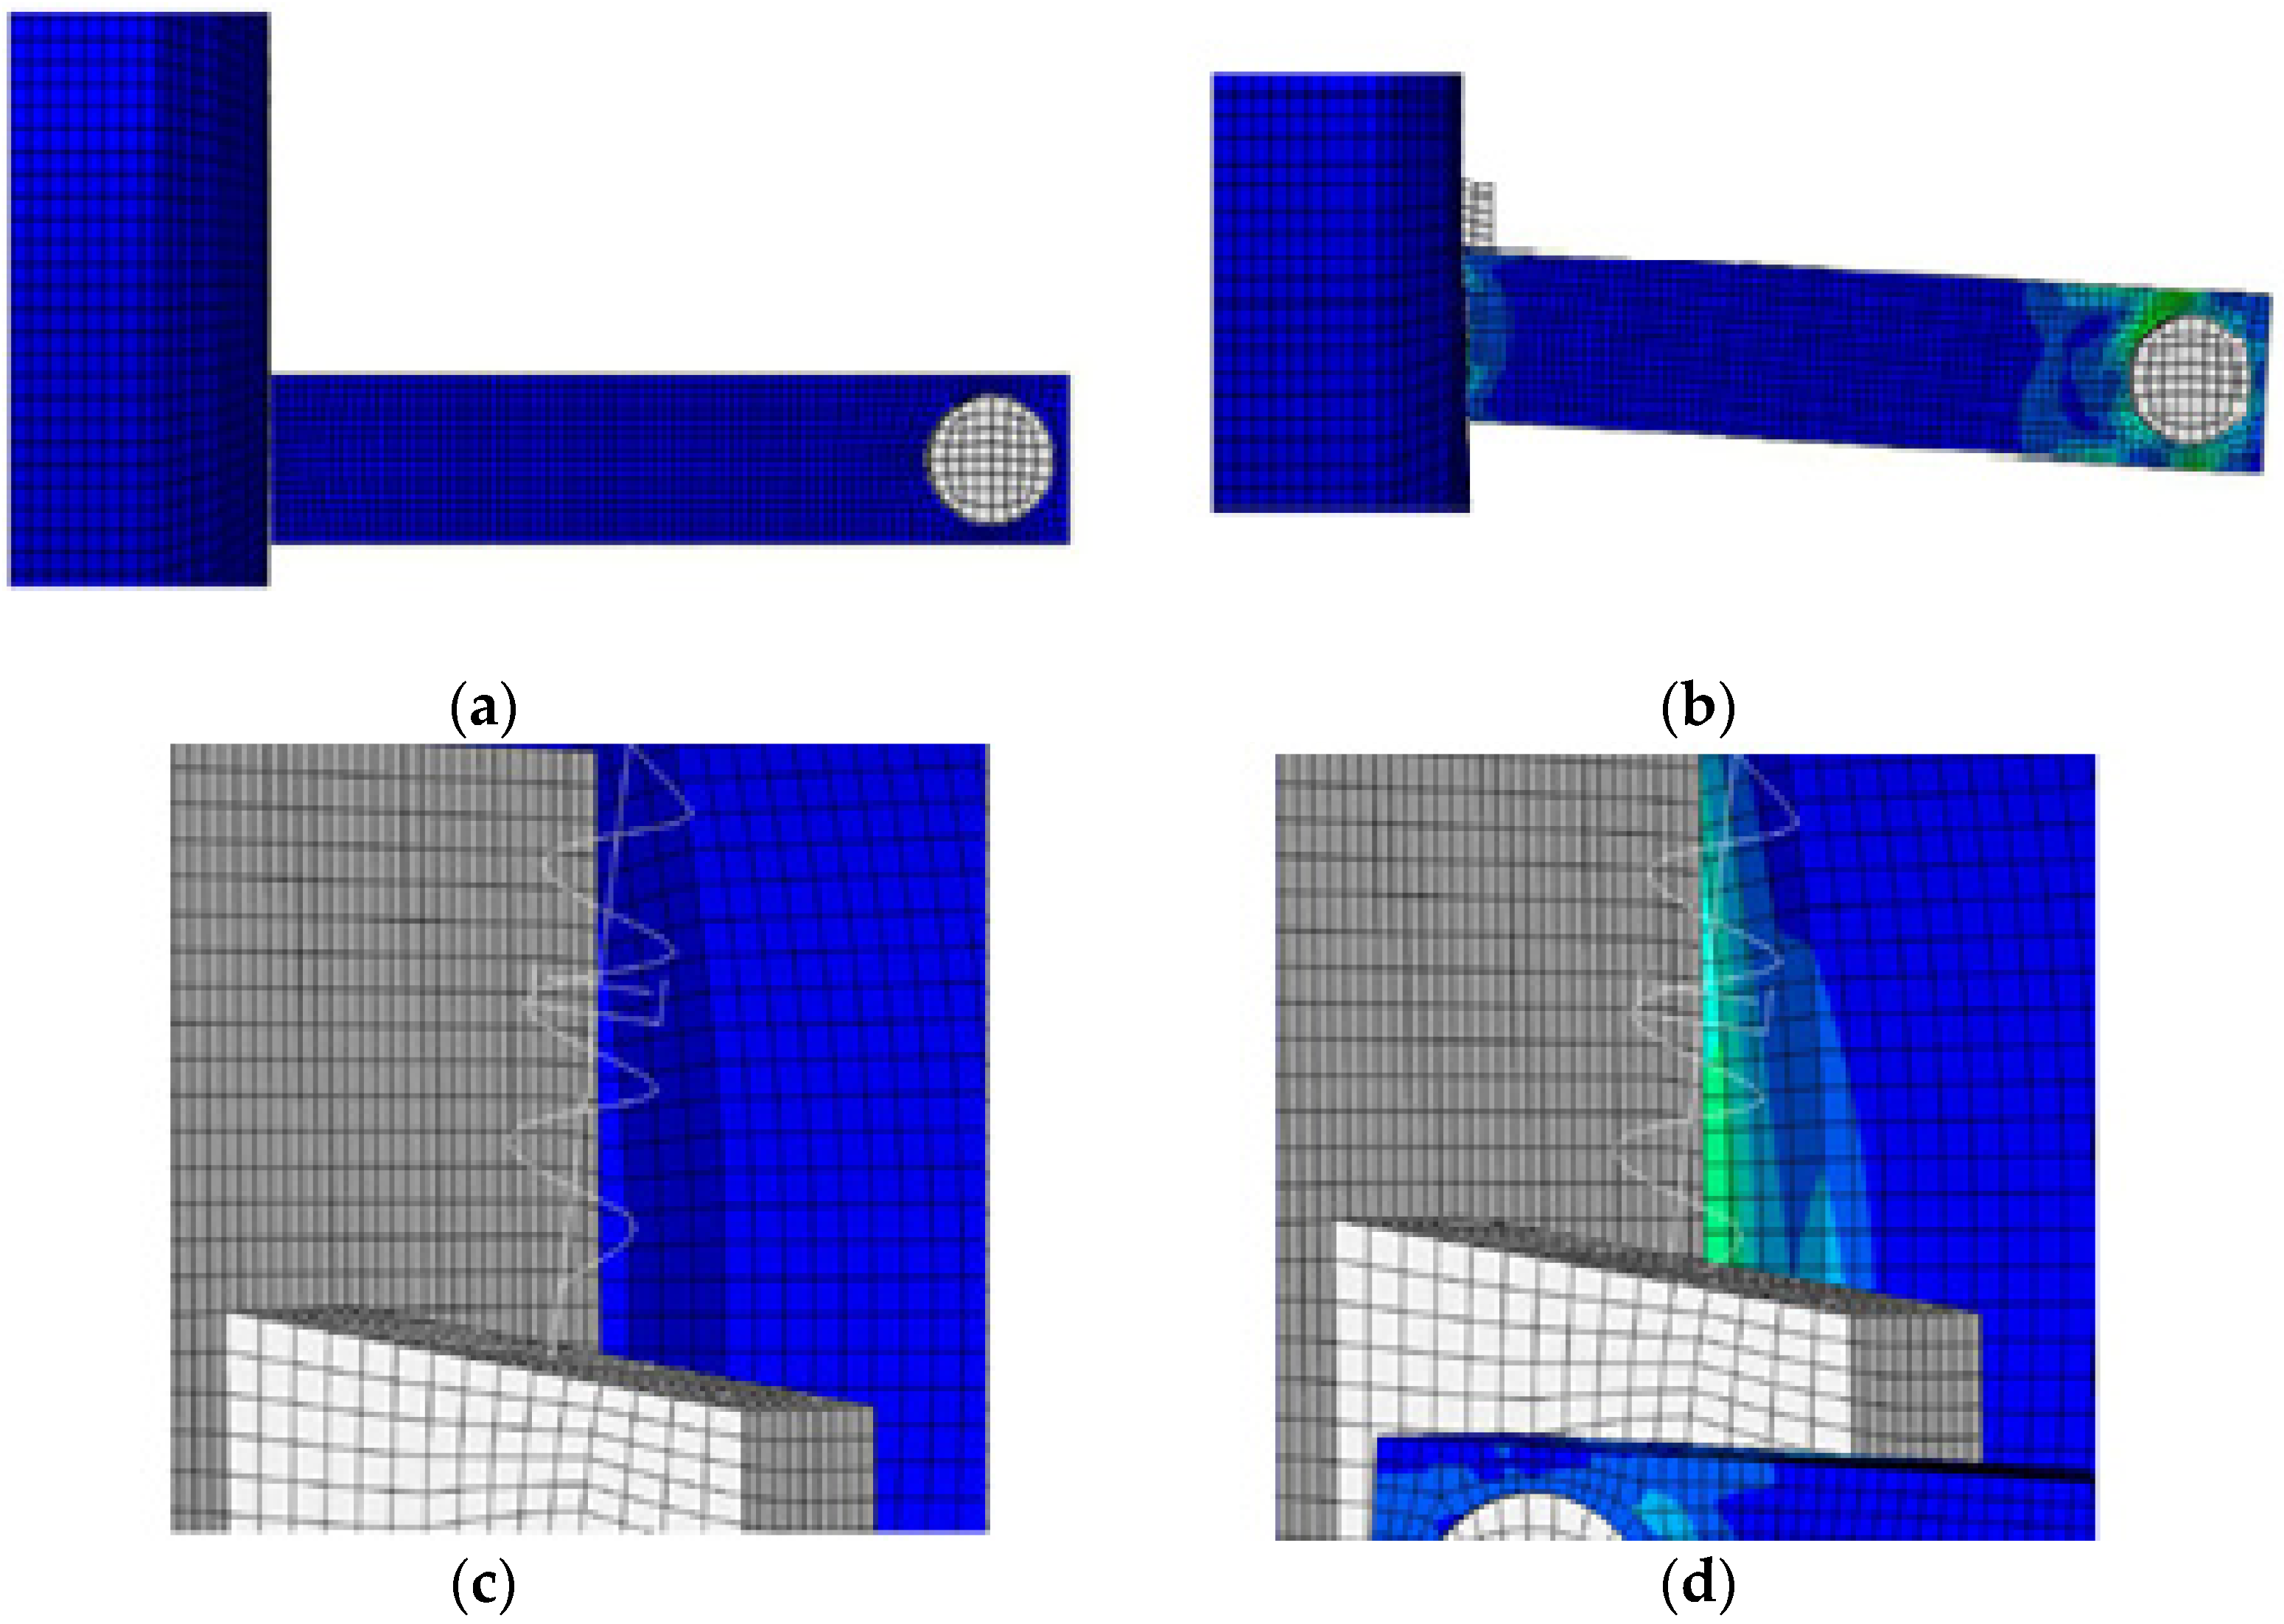
Two variants of the obstacle were created: symmetrical (Figure 2a) and asymmetrical (Figure 2b). The use of these two types of obstacles will allow to create conditions similar to those in reality. These elements were modeled as a non-deformable part, without assigned material properties.
After the assembly was made, the FEM mesh was added, the parameters of which are provided in Table 1.
A FEM net was applied to all wheel elements, the rocker arm and the obstacle, the parameters of which are presented in Table 1. The position of the wheel in relation to the obstacle in the position before starting the analysis is shown in Figure 3.
When assigning impact parameters, an obstacle reference frame was introduced (Figure 4). It was assigned with the ability to move along the vertical axis with a value of v = 13,888 mm/s (v = 50 km/h). The impact time was determined to be t = 0.0102 s.

4. Modeling Results

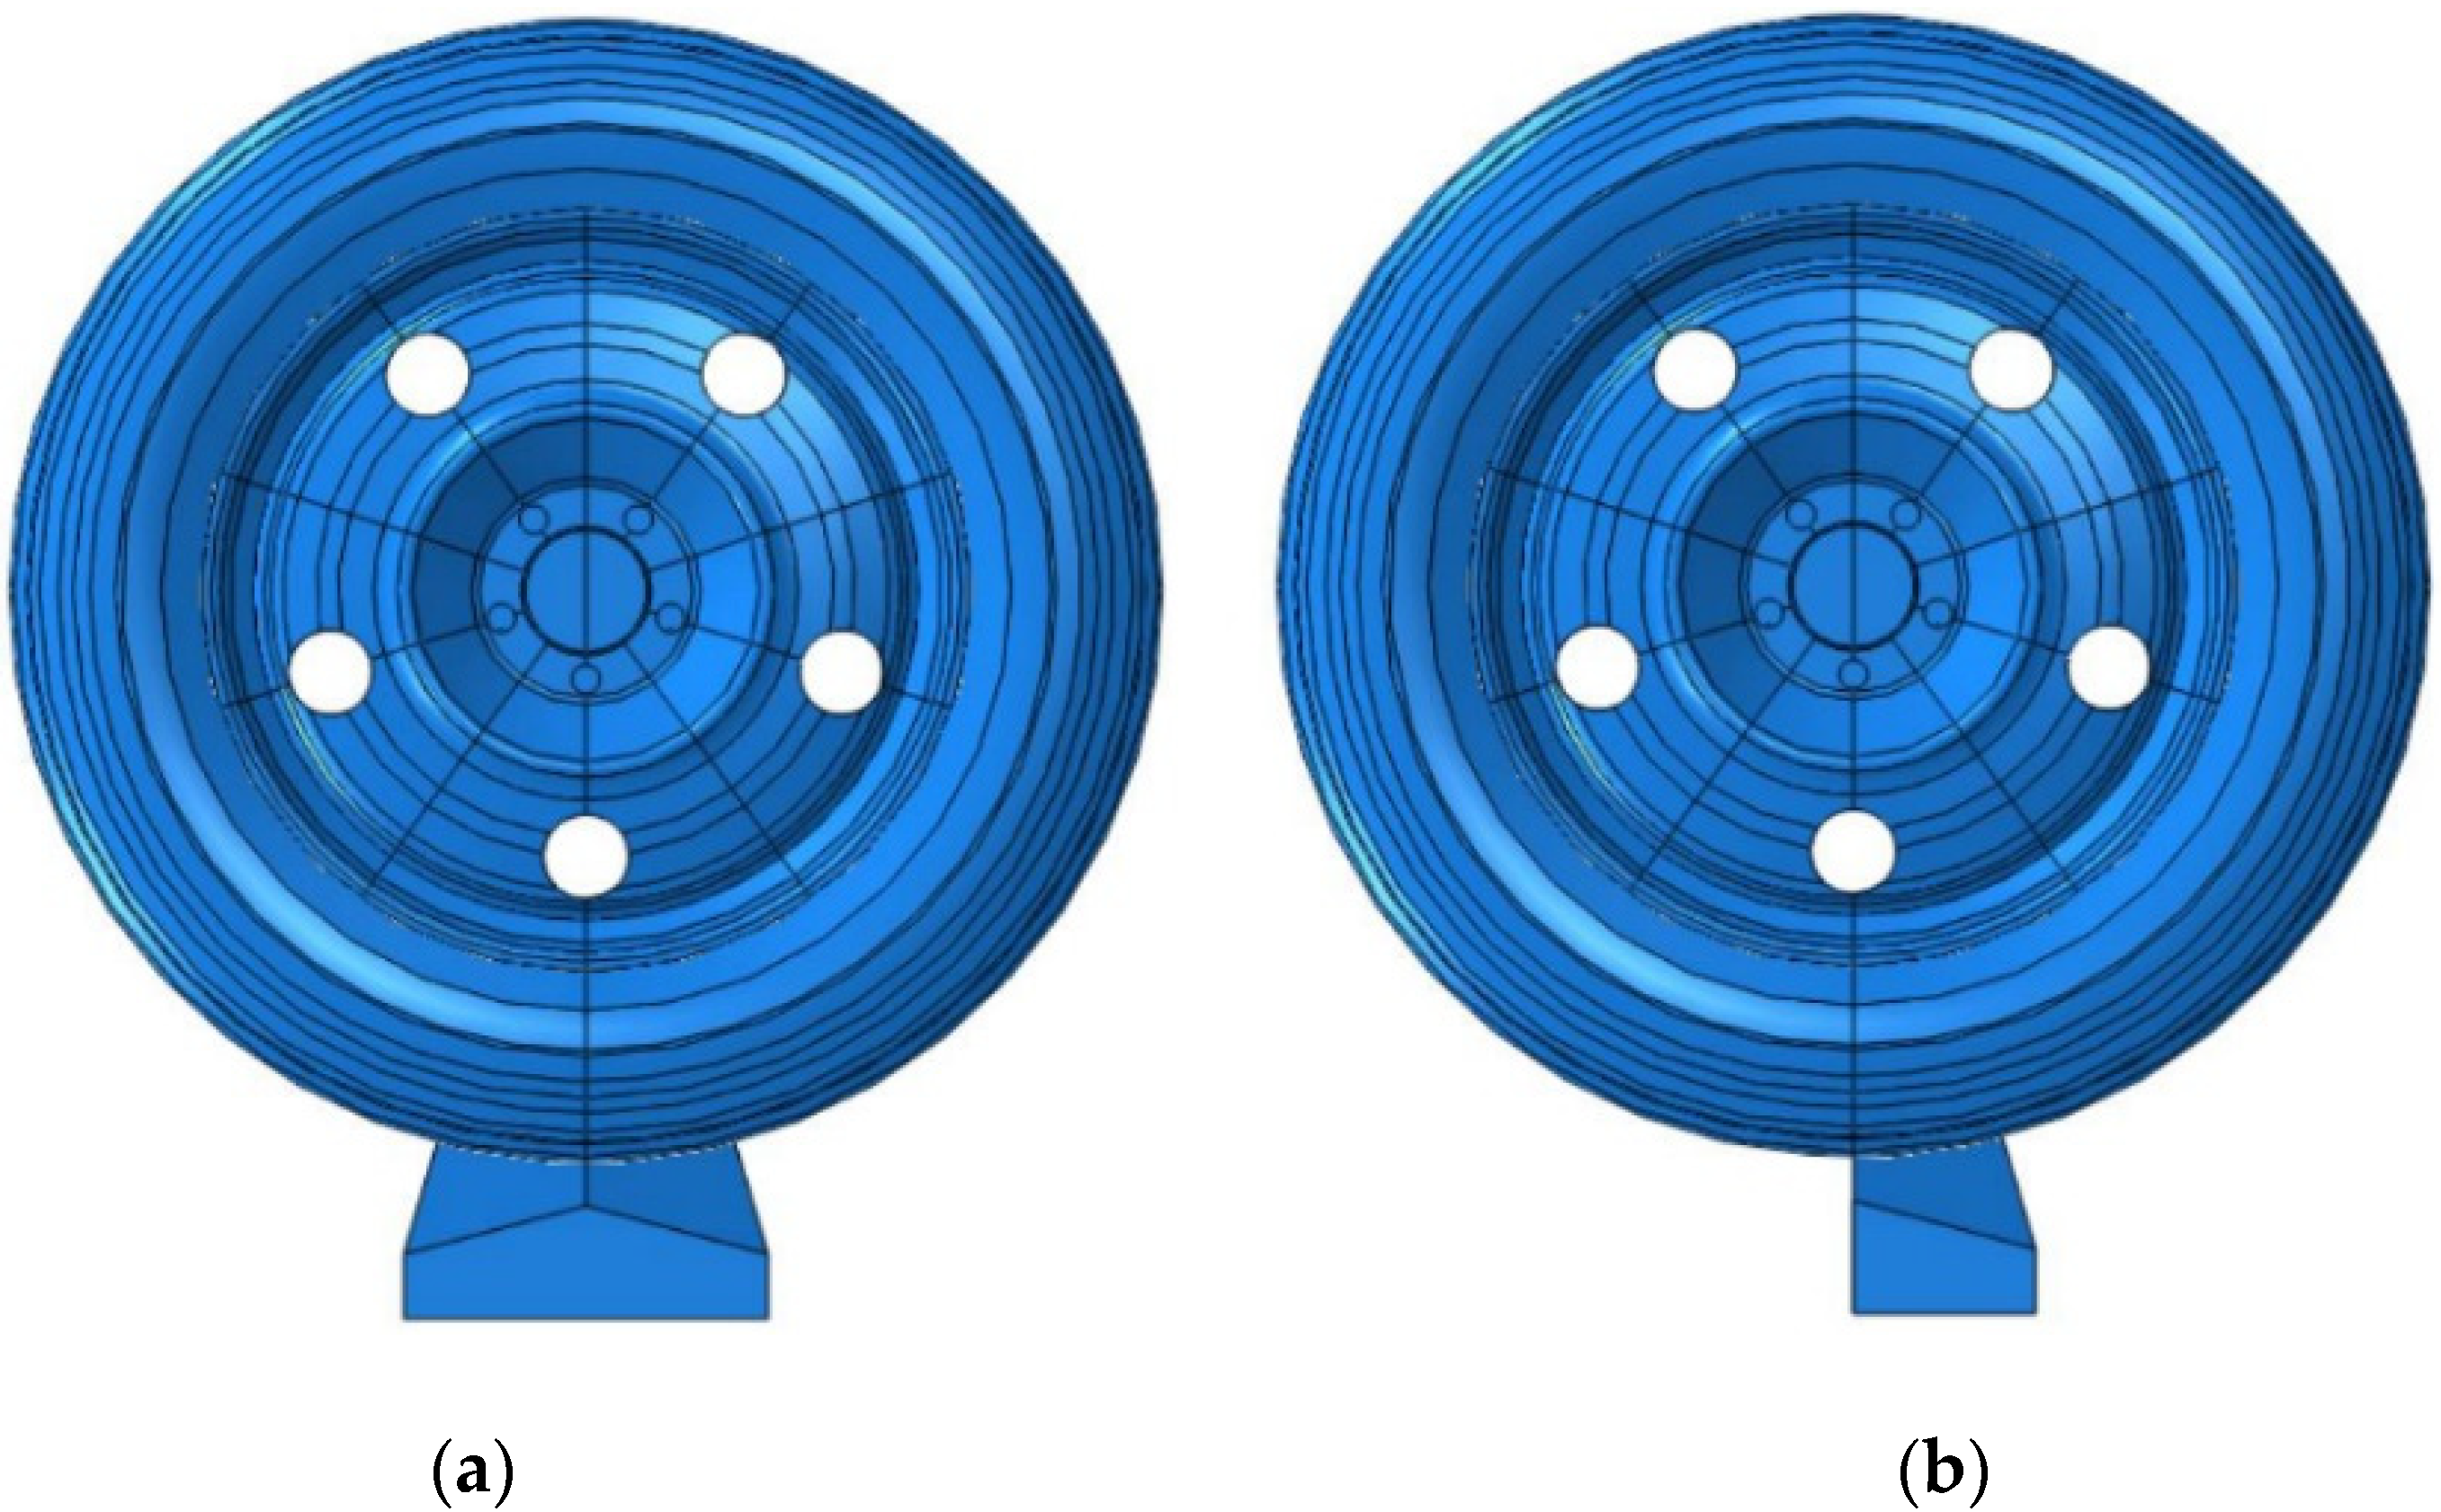
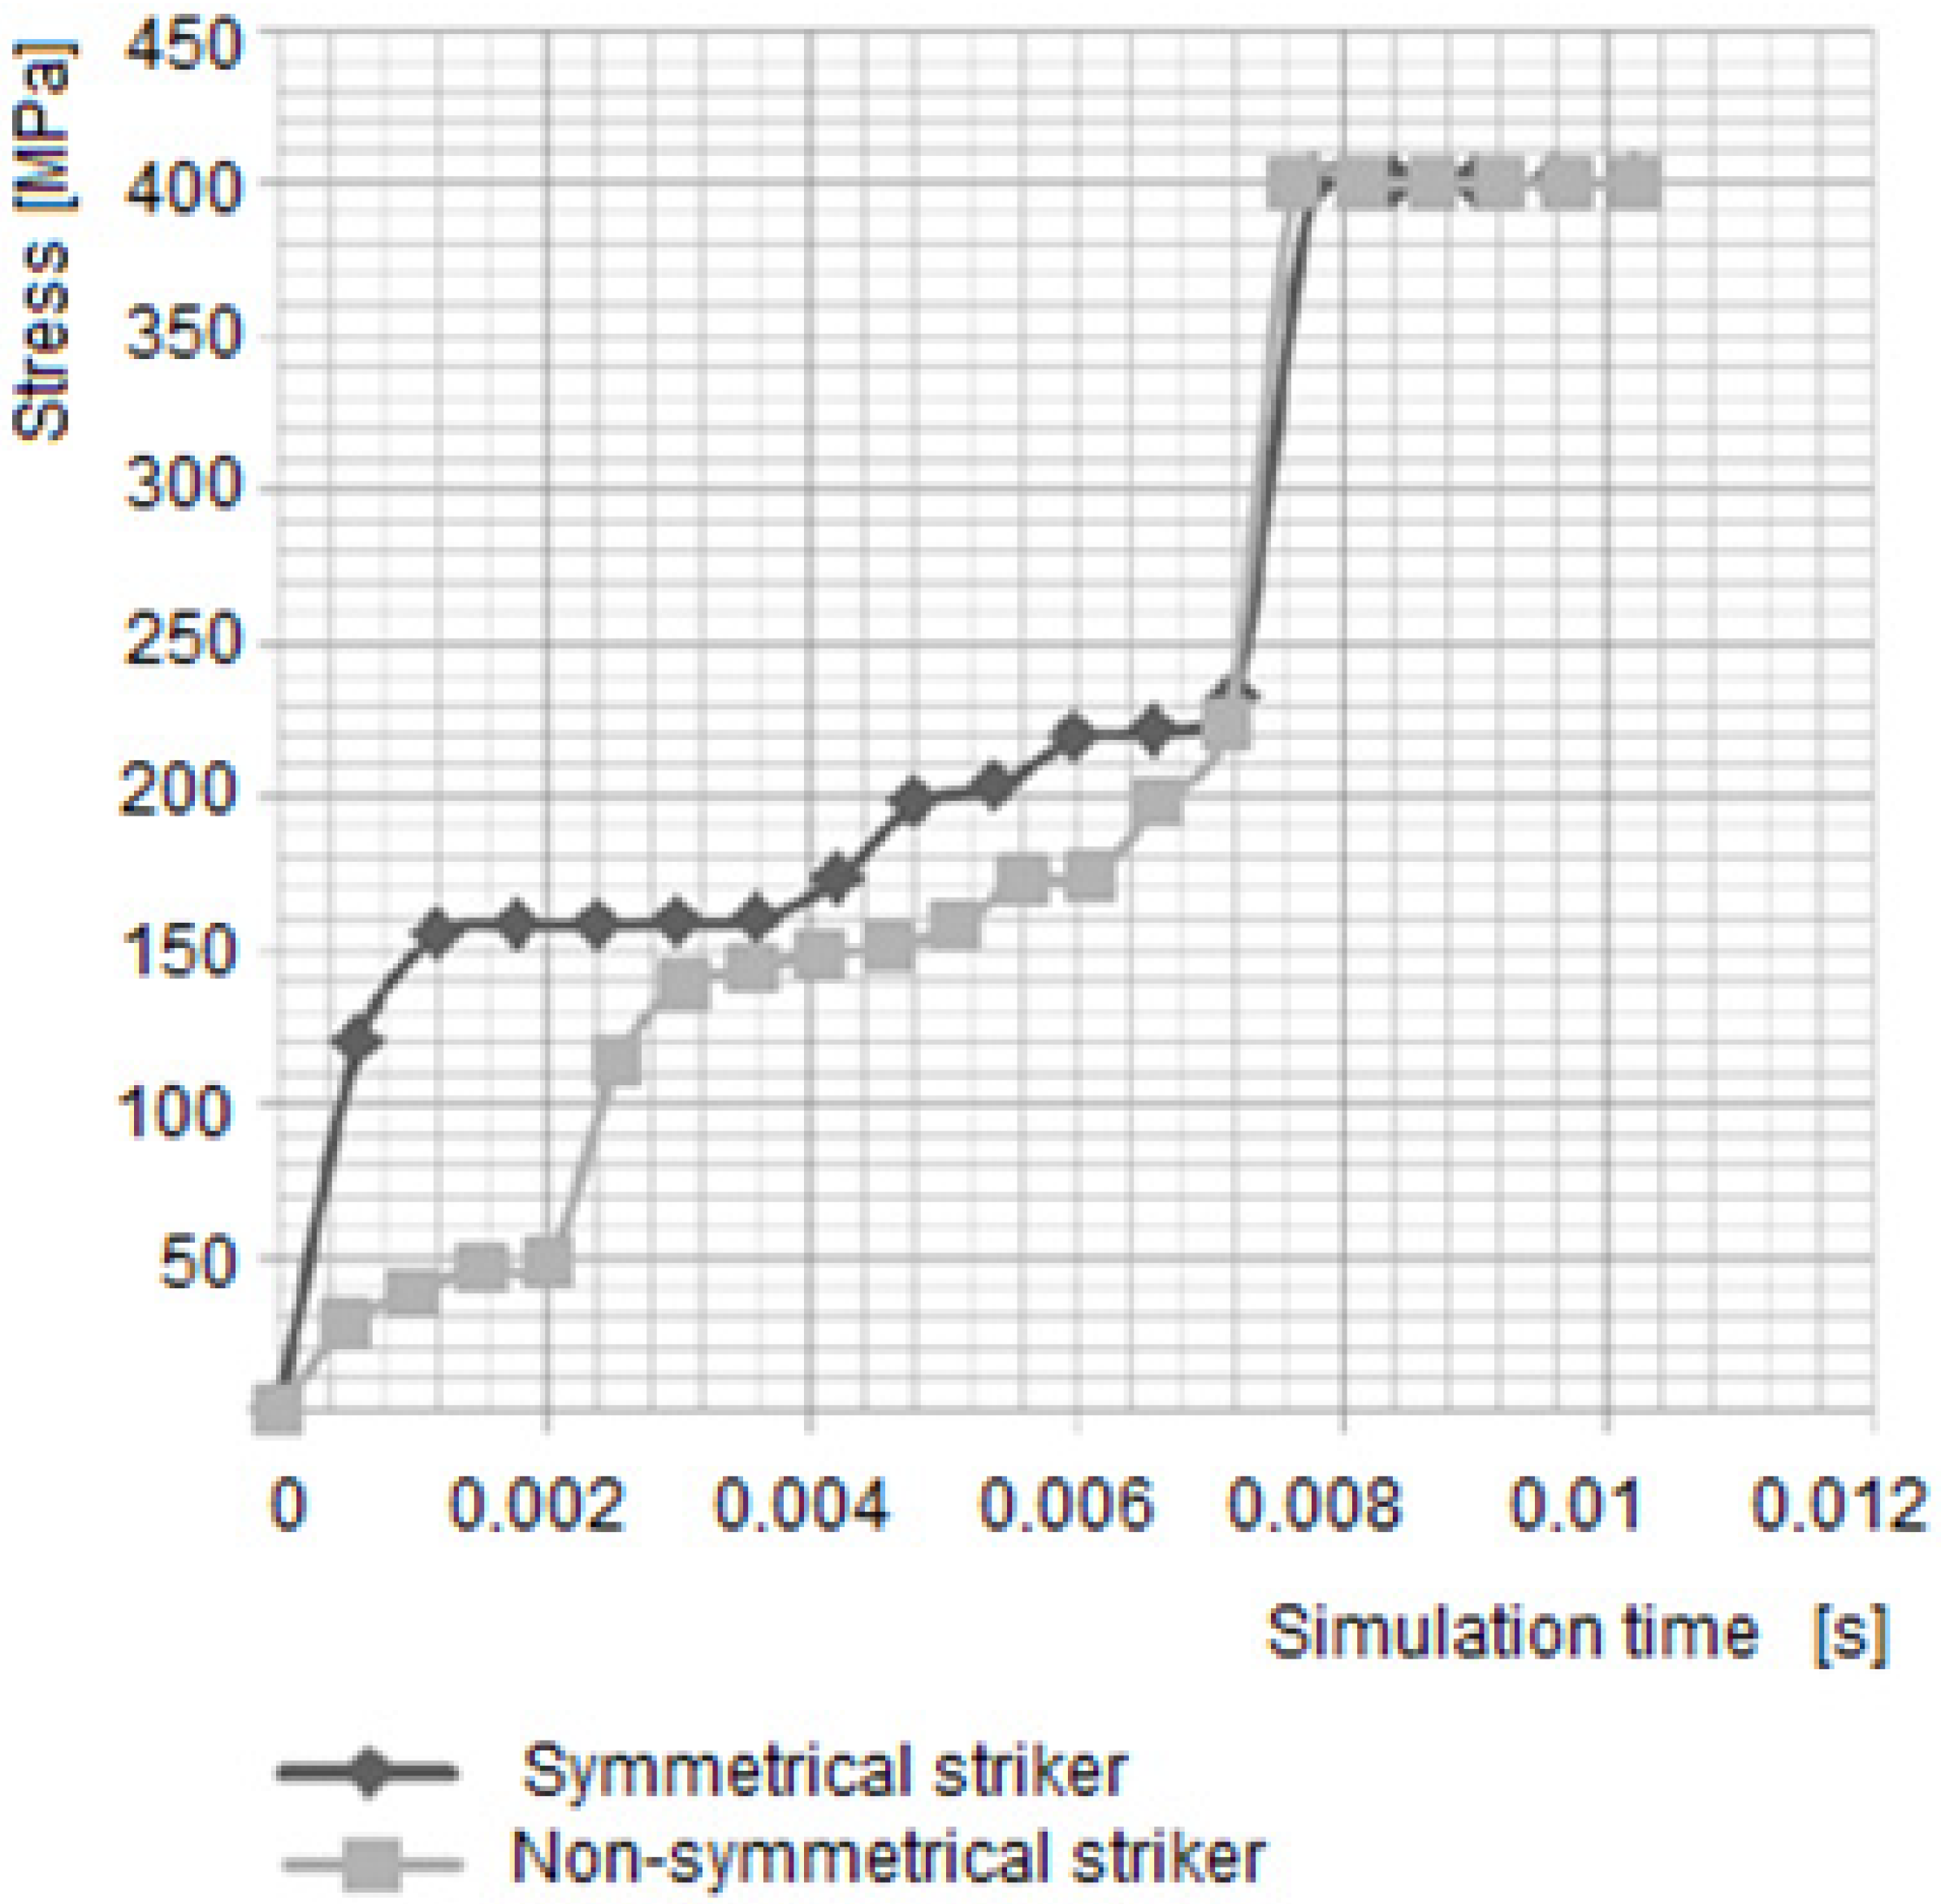
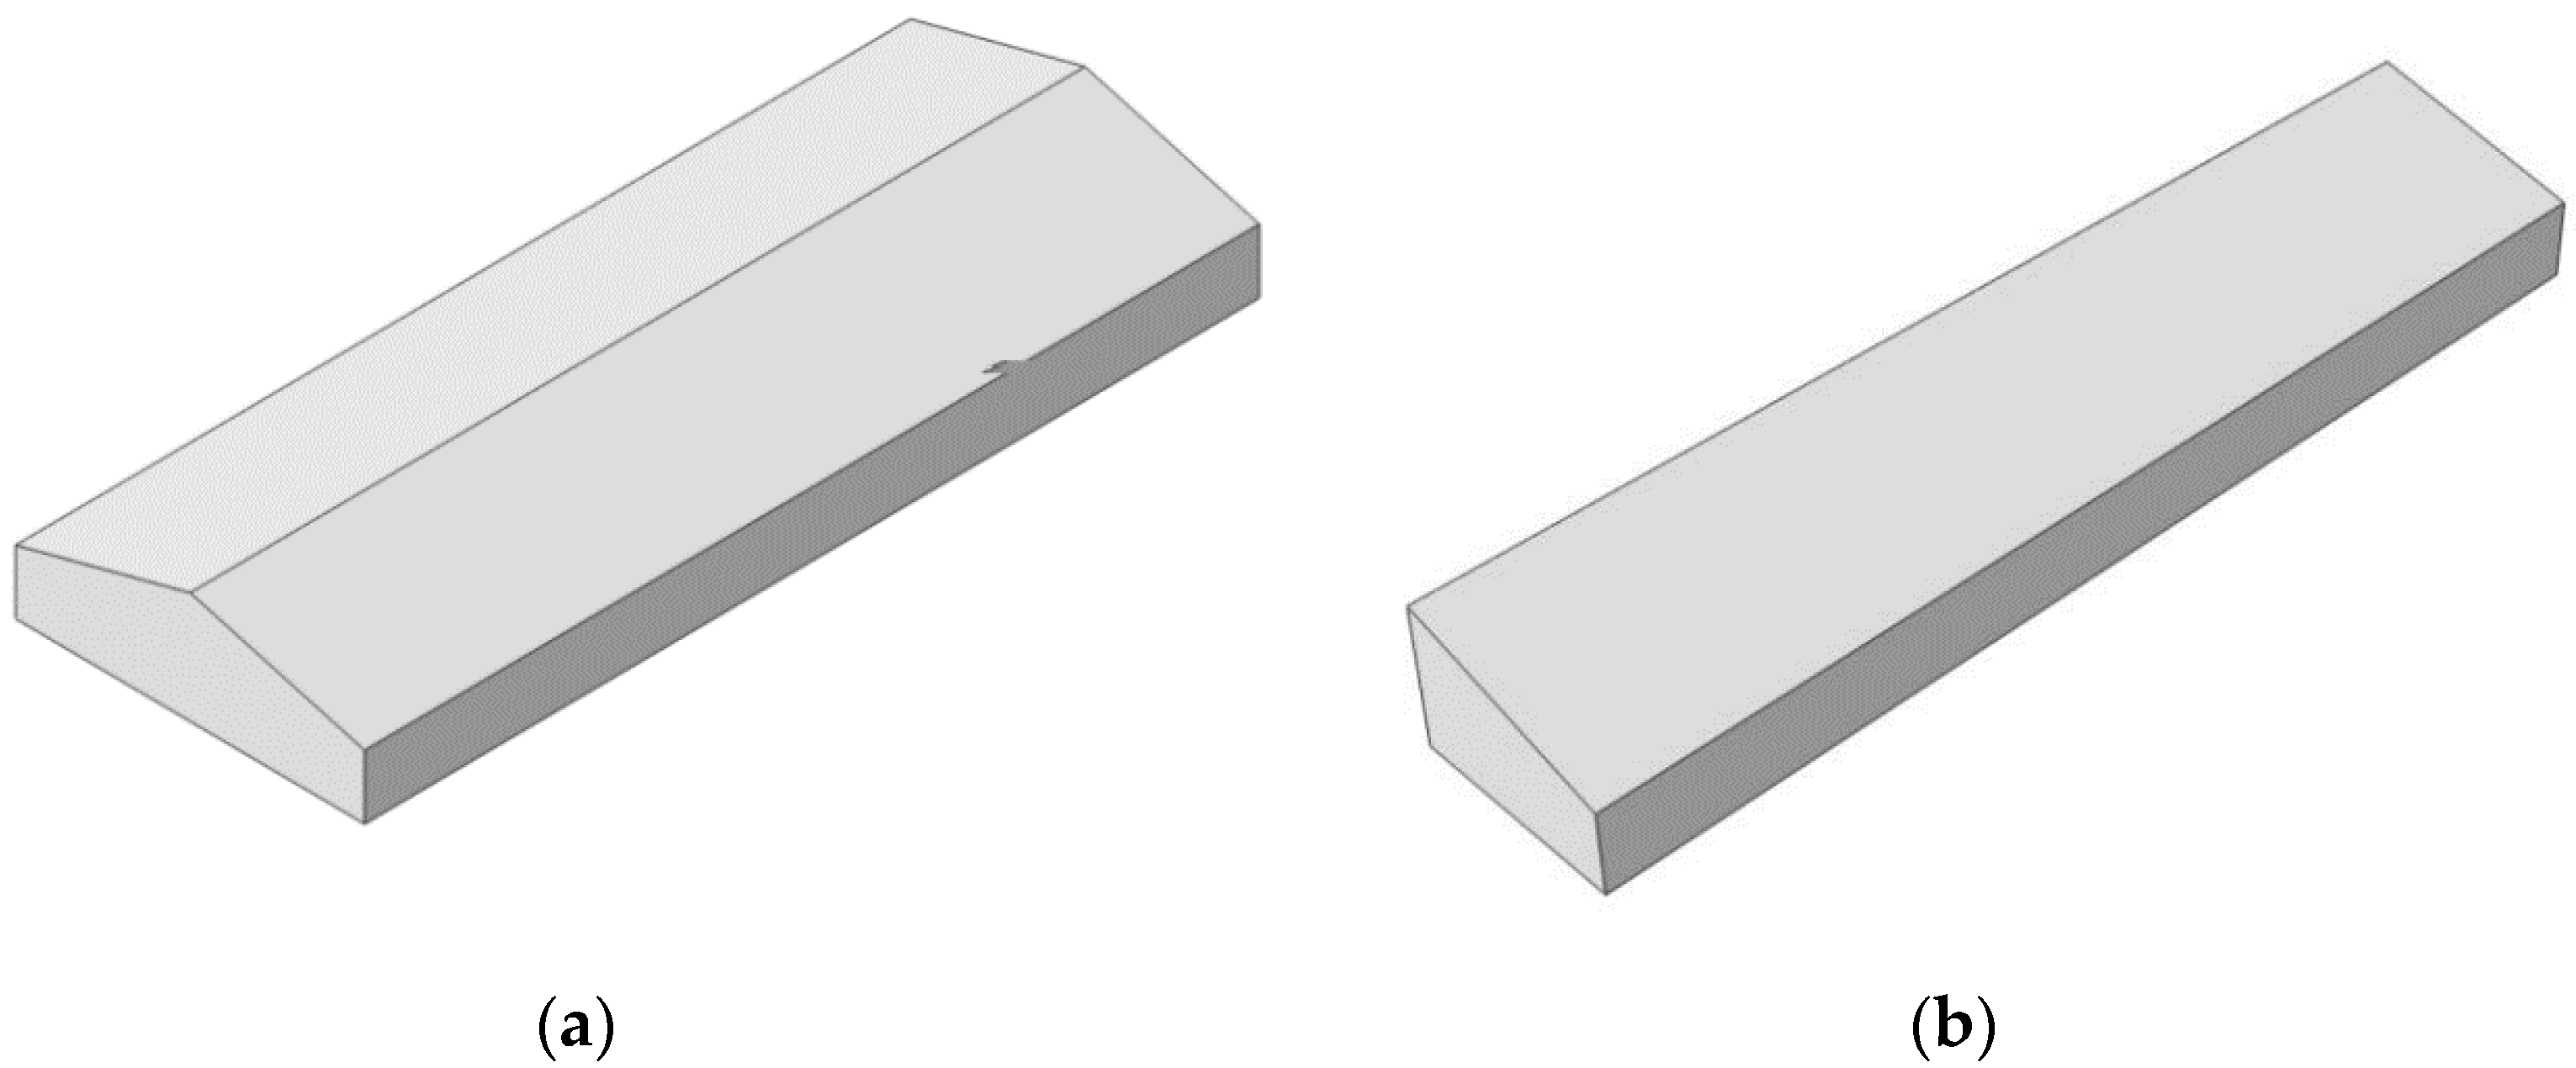
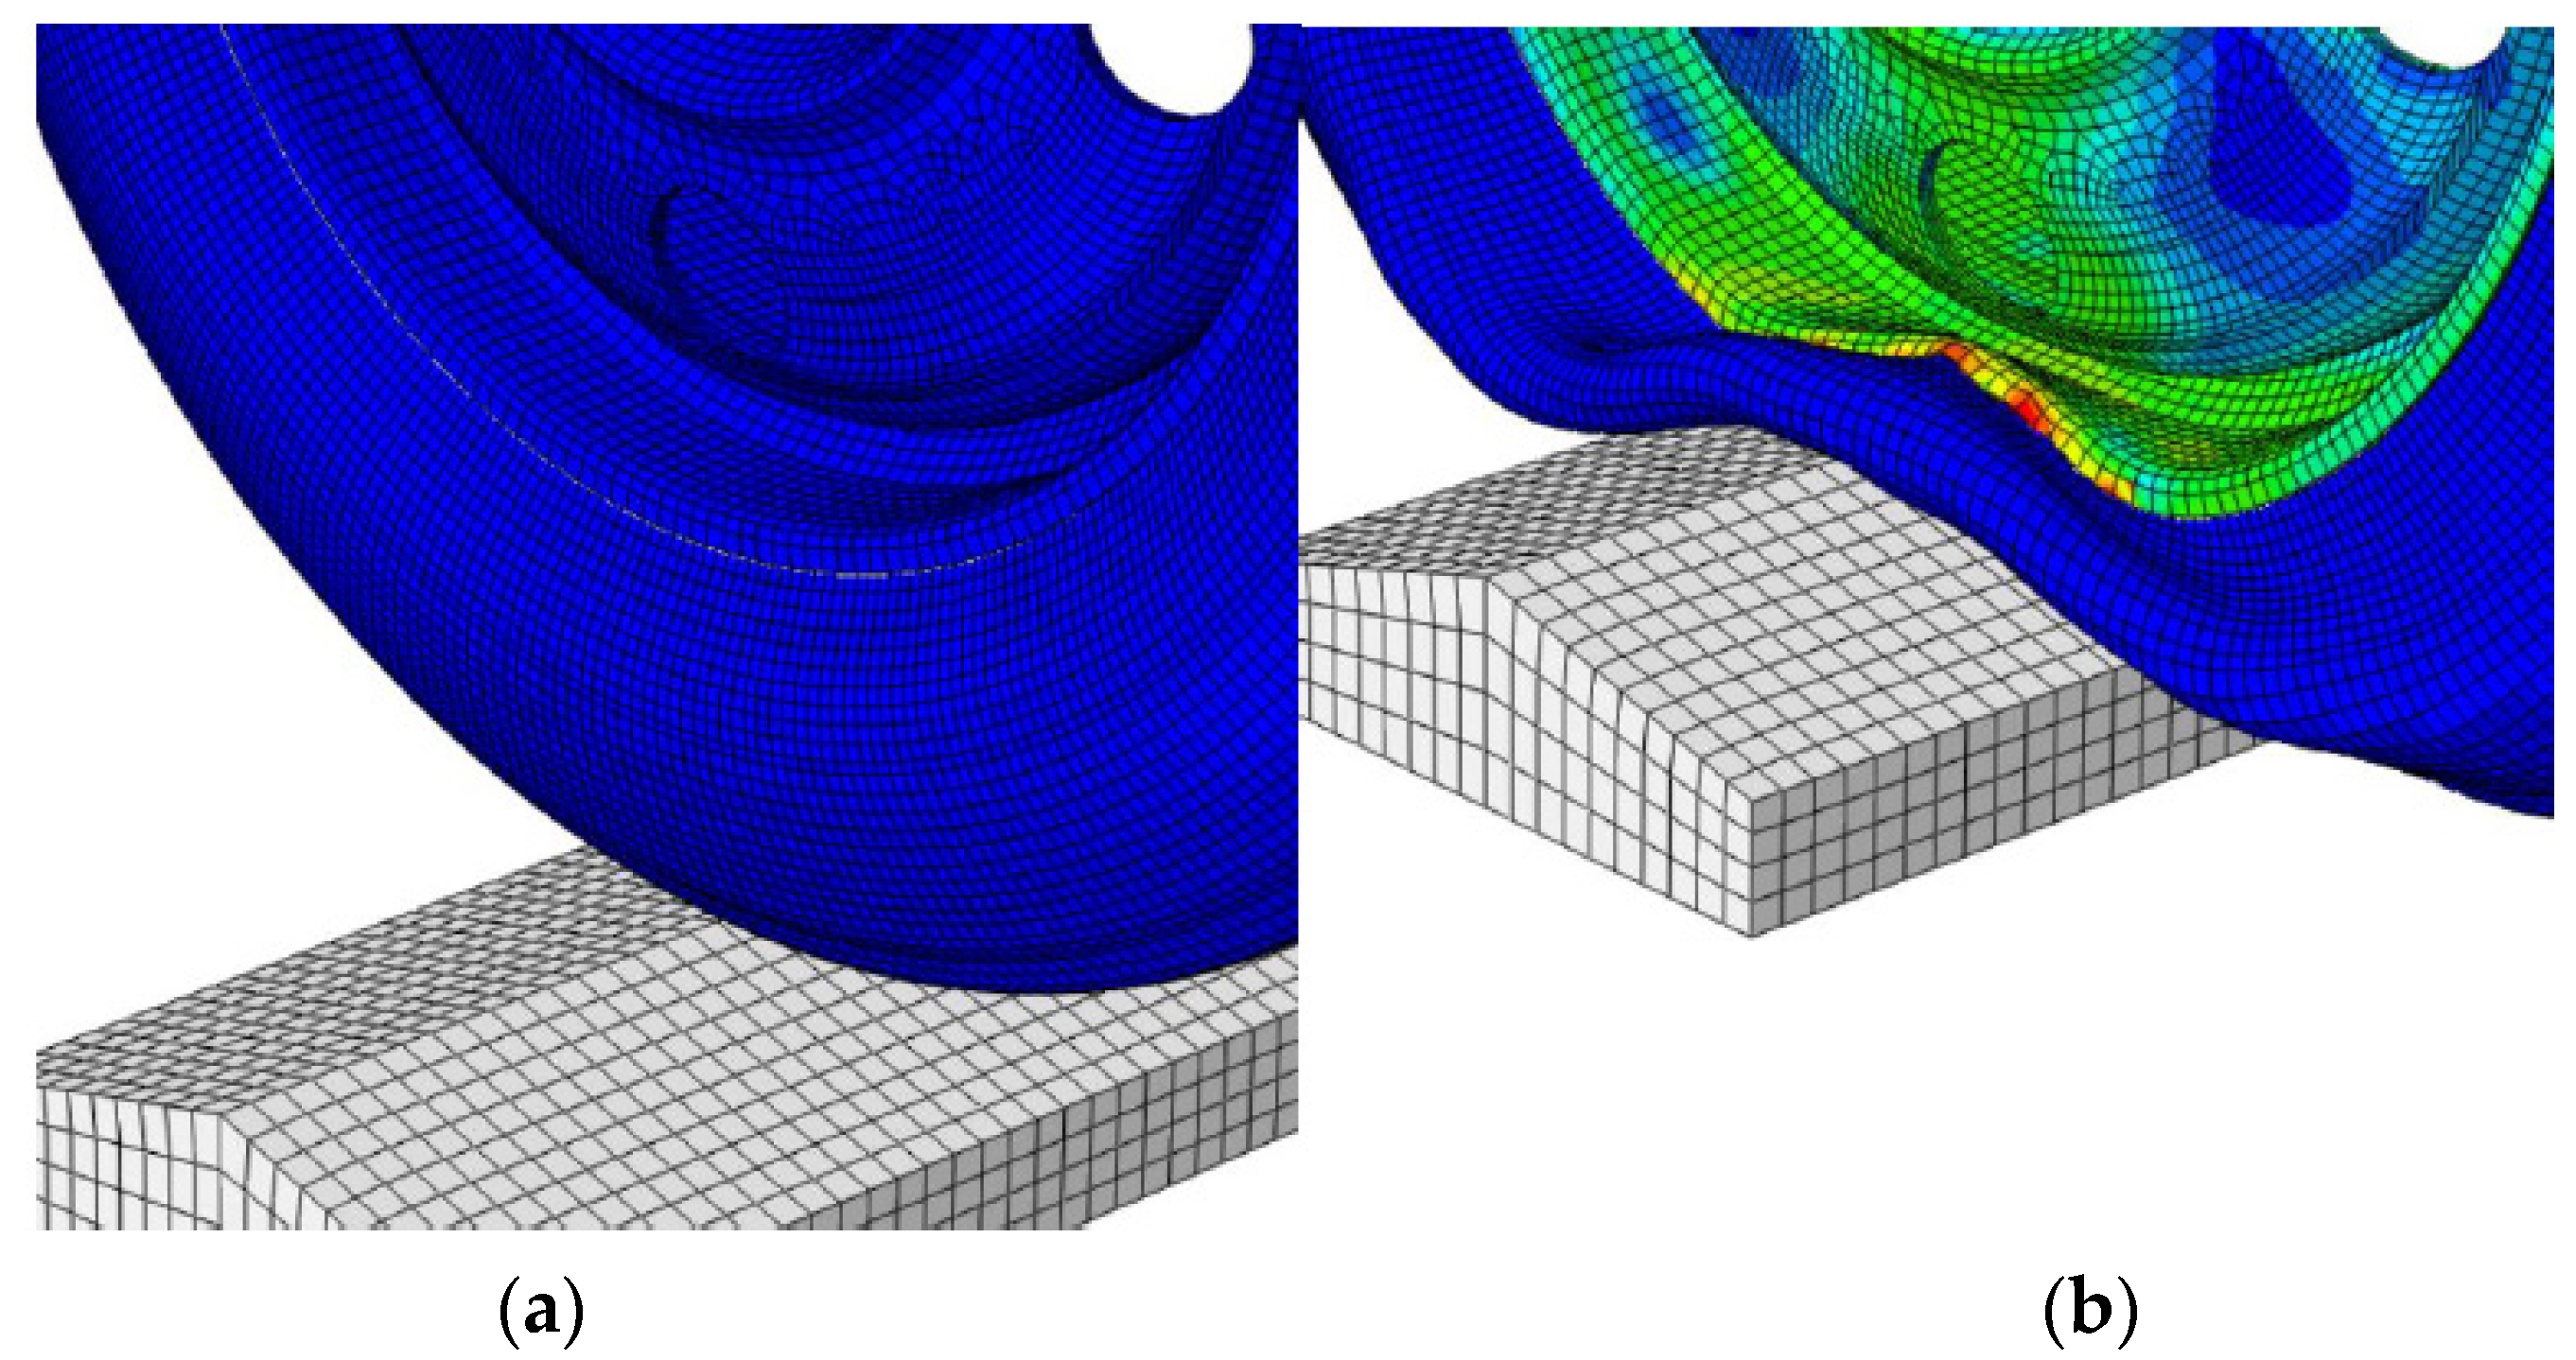
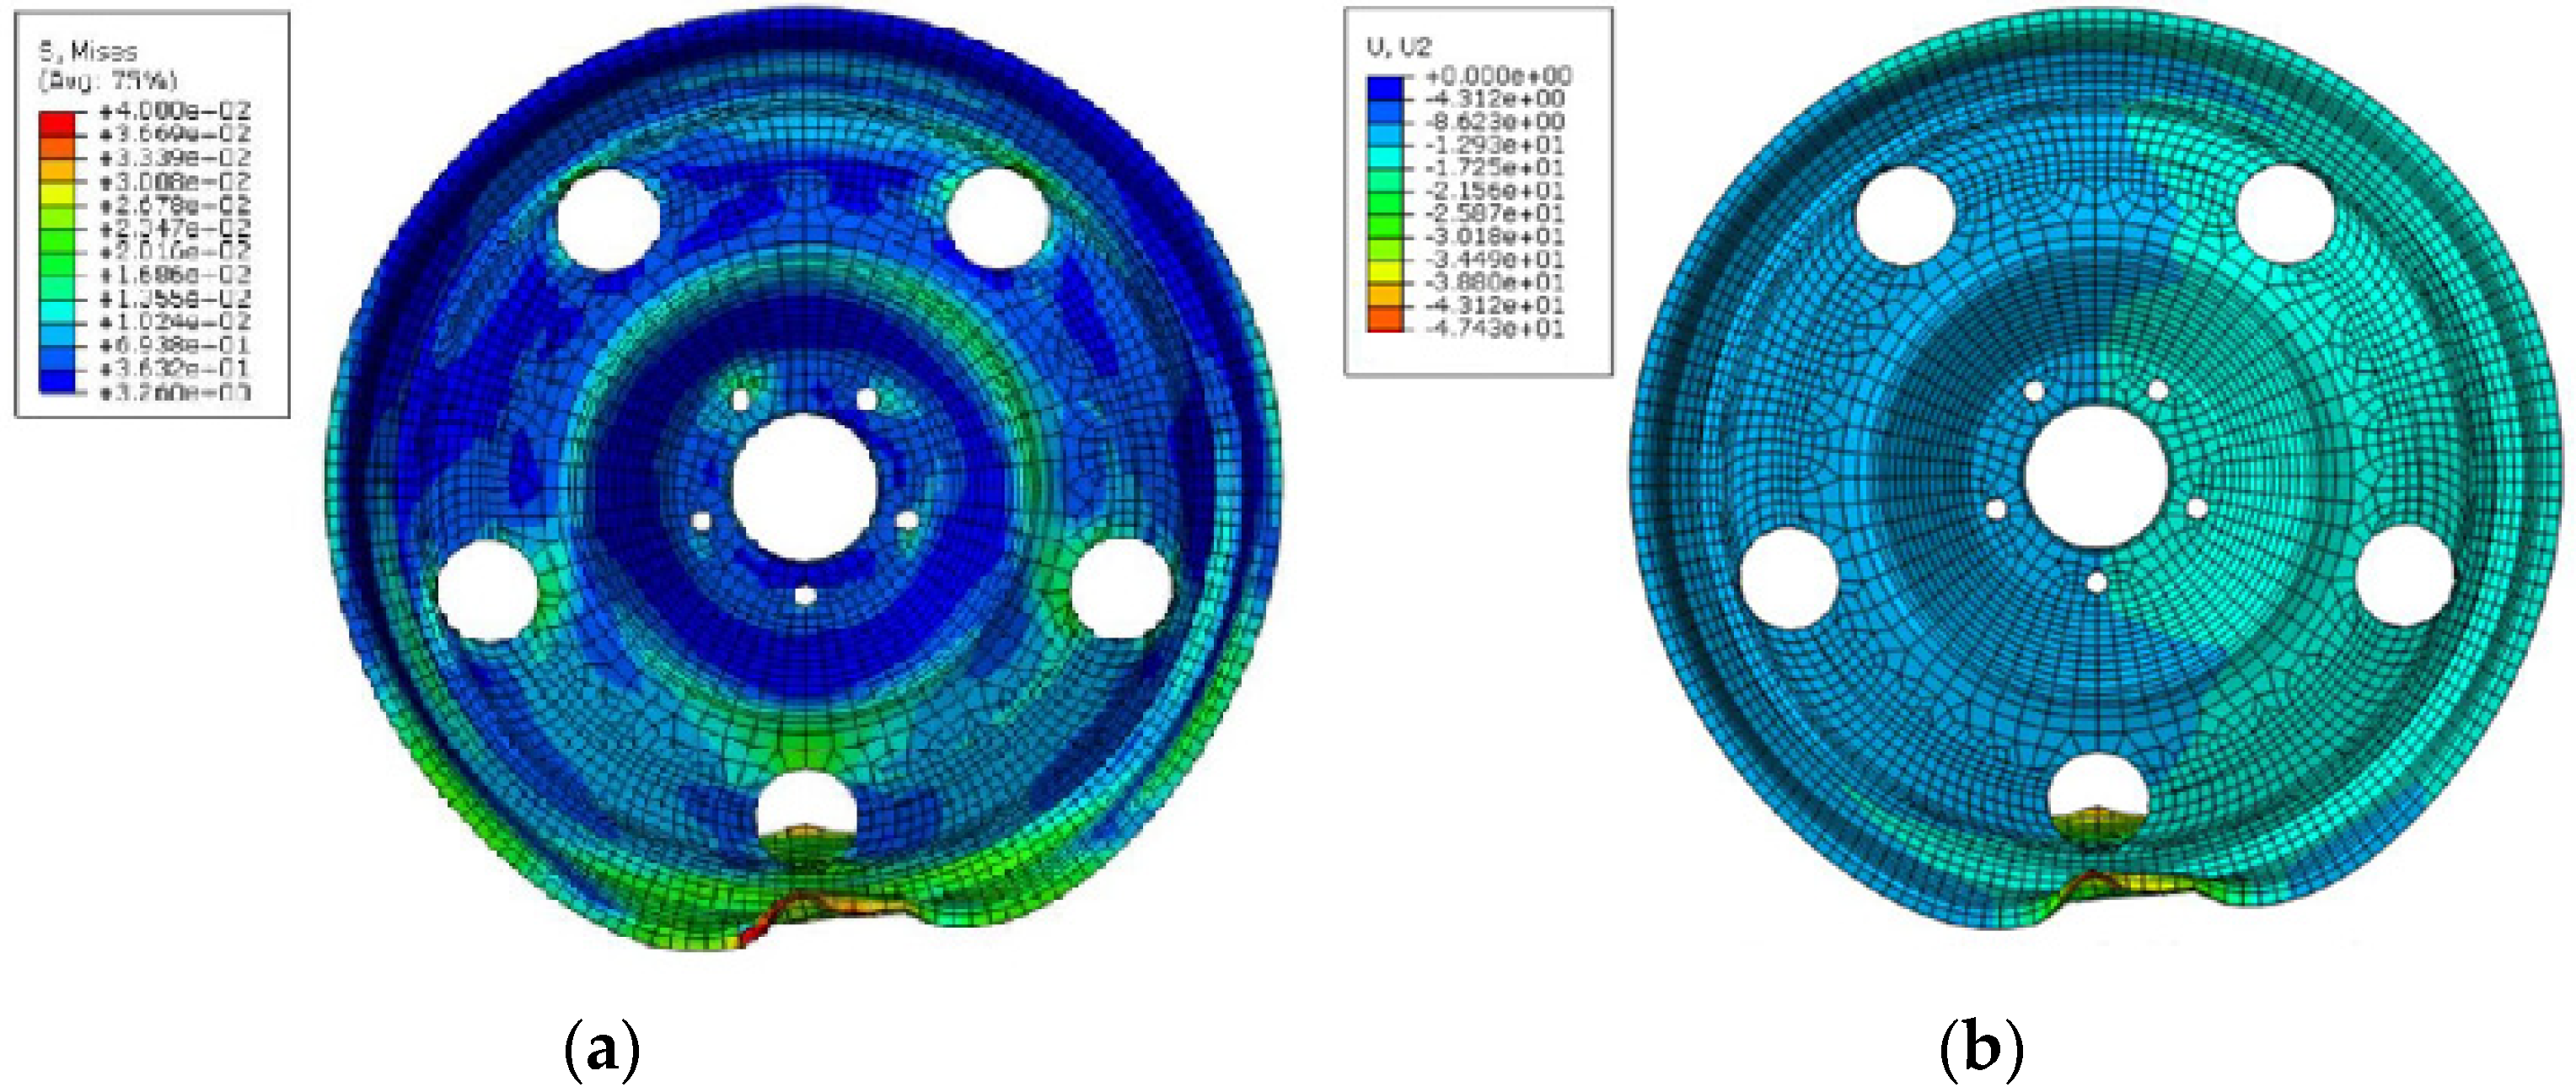
4.1. Hitting a Symmetrical Obstacle

Stresses of about 260 MPa arose in the deformed area. The maximum values, 400 MPa, appeared on the points located on the outer and inner surfaces of the rim flange—Figure 5a. These are points directly exposed to contact with the obstacle.
Figure 5b shows the map of points displacement with respect to the initial position. Due to the inversion of the coordinate system, the displacements are negative. The maximum value of the displacement of individual points on the boundaries of the flanges is 46.7 mm from the initial position. By subtracting this value from the displacement of the global coordinate system (17.6 mm), we obtained the real value of the deformation of the rim, which is 29.1 mm.
Figure 6 shows the behavior of the suspension components (rocker arm, shock absorber, spring) during the simulation. The end of the rocker arm mounted to the hub made a movement consistent with the displacement of the wheel. There was a rotation around the inner sleeve (Figure 6b). A slight deformation of the element was observed, which is as expected due to the use of pins in the actual suspension.
The second element influencing the results of the analysis was a shock absorber with a spring. As expected, there was a change in length (shortening) of this part (Figure 6d)—they worked correctly.
Although the tire model was simplified compared to the real object, the simulation resulted in deformations (Figure 7) consistent with the observation after the wheel hit the real obstacle. It can therefore be concluded that the model and material properties of rubber were correctly selected for the purposes of this analysis.

4.2. Hitting an Asymmetrical Obstacle

Another analysis concerns the impact of the wheel on an asymmetrical obstacle while maintaining the same parameters, i.e., impact speed v = 50 km/h, impact time t = 0.0102 s. The map of stresses for this simulation is shown in Figure 8a.
It can be seen that there are single points on the deformed surface of the rim flange with the same maximum stress value of 400 MPa. On most surfaces, the stresses of 260 MPa were observed as shown in Figure 5. However, the area of their occurrence is different. In the event of a collision with a symmetrical obstacle, the stress map of this value covers the area in the radial direction from the points on the outer diameter through the surface with bolt holes to the curve surrounding the central hole. After hitting an asymmetrical obstacle, the stresses equal to 260 MPa appear on the protective hump (HUMP) of the rim surface. The development of stresses on the flange on an arc equal to 2/5 of the rim circumference is also noticed. The deformation in the rim (Figure 8b) corresponds to the shape of the obstacle. Contrary to Figure 5b, the rim surface is clearly divided into two areas, with different deformation values.
The maximum value of the displacement of individual points on the boundaries of the flanges is 47.4 mm from the initial position. By subtracting this value from the displacement of the global coordinate system (17.6 mm), we get the real value of the rim deformation, which is 29.8 mm.
Figure 9 shows a comparative graph of stress increase as a function of time. The maximum stresses visibly fall into two stages (Figure 7). The first stage is the compression time of the tire. The stresses that arise in the rim then result from the interaction of the tire and compressed air. At the moment of direct impact of the obstacle on the rim, the stress increases rapidly to the maximum values and is maintained until the end of the simulation.
The values of the stresses in the rim when hitting an asymmetric obstacle increase slower than in the case of a test with a symmetrical obstacle. This may be due to the smaller increments of pressure change within the tire due to the different obstacle surface acting on the wheel. When the obstacle is in direct contact with the rim of the wheel, the stress increases rapidly. It can be concluded that, apart from the extent of deformation, the change in the shape of the obstacle has no effect on the differences in the values of stresses in the rim.

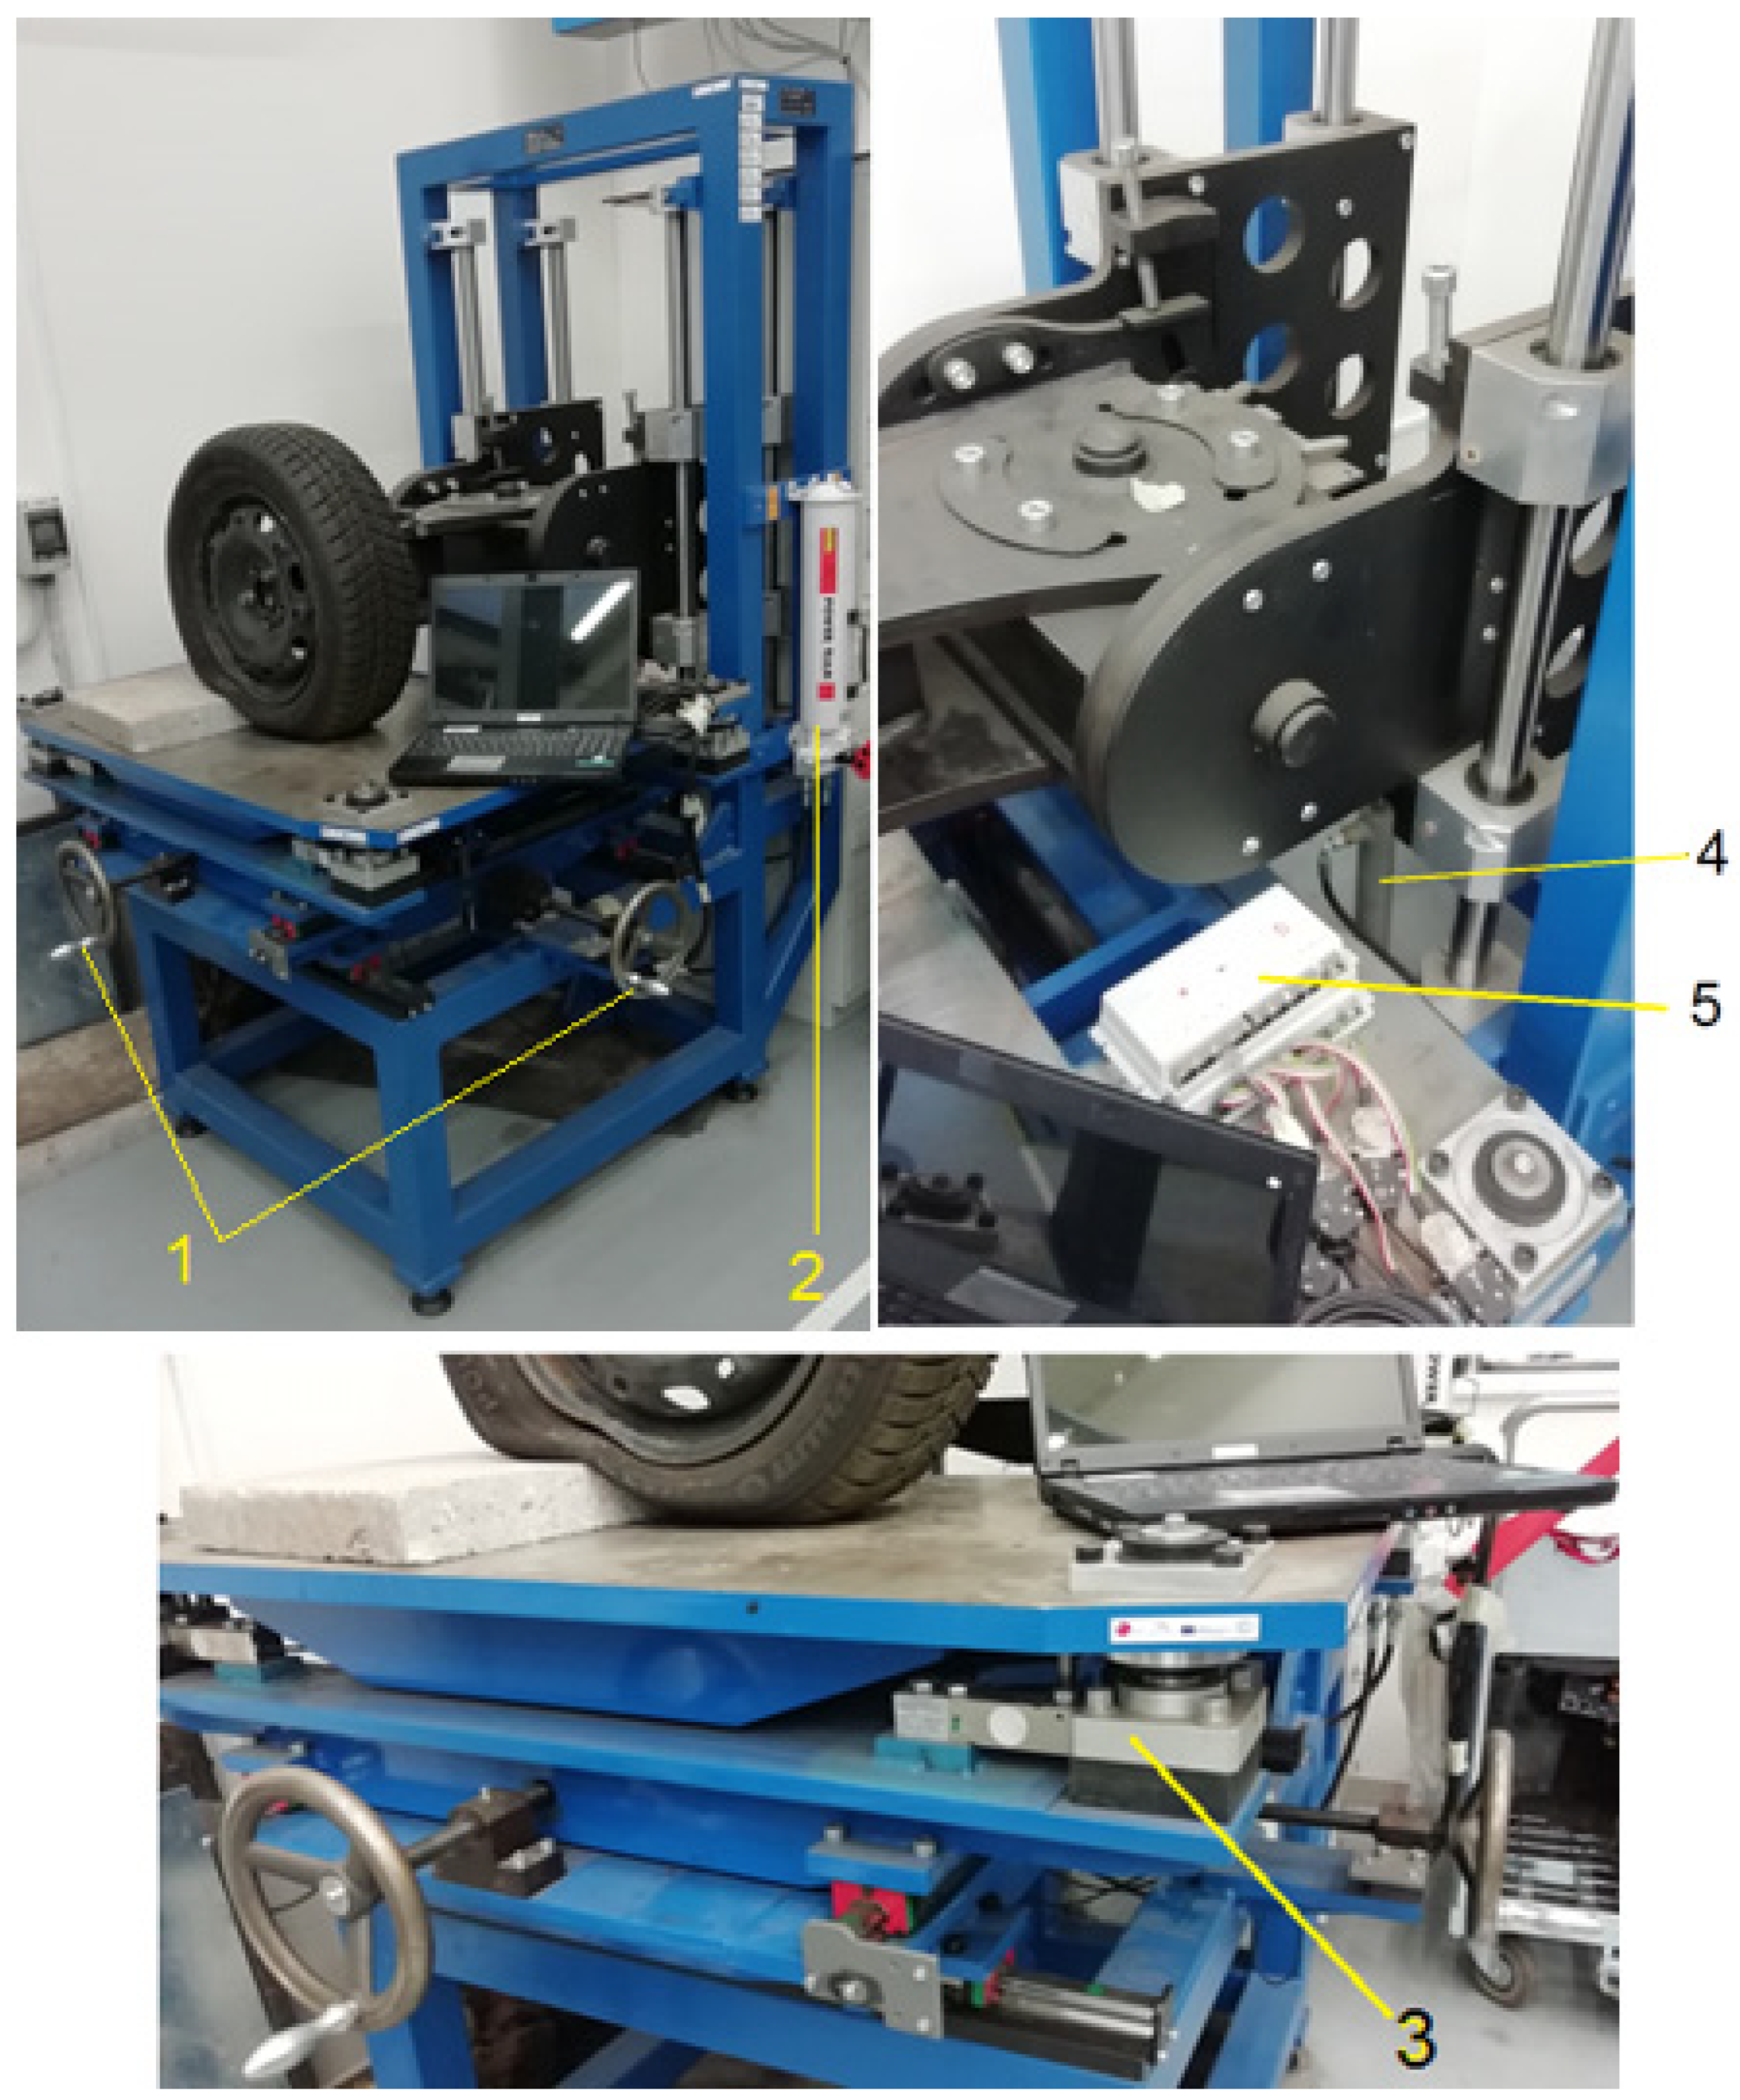
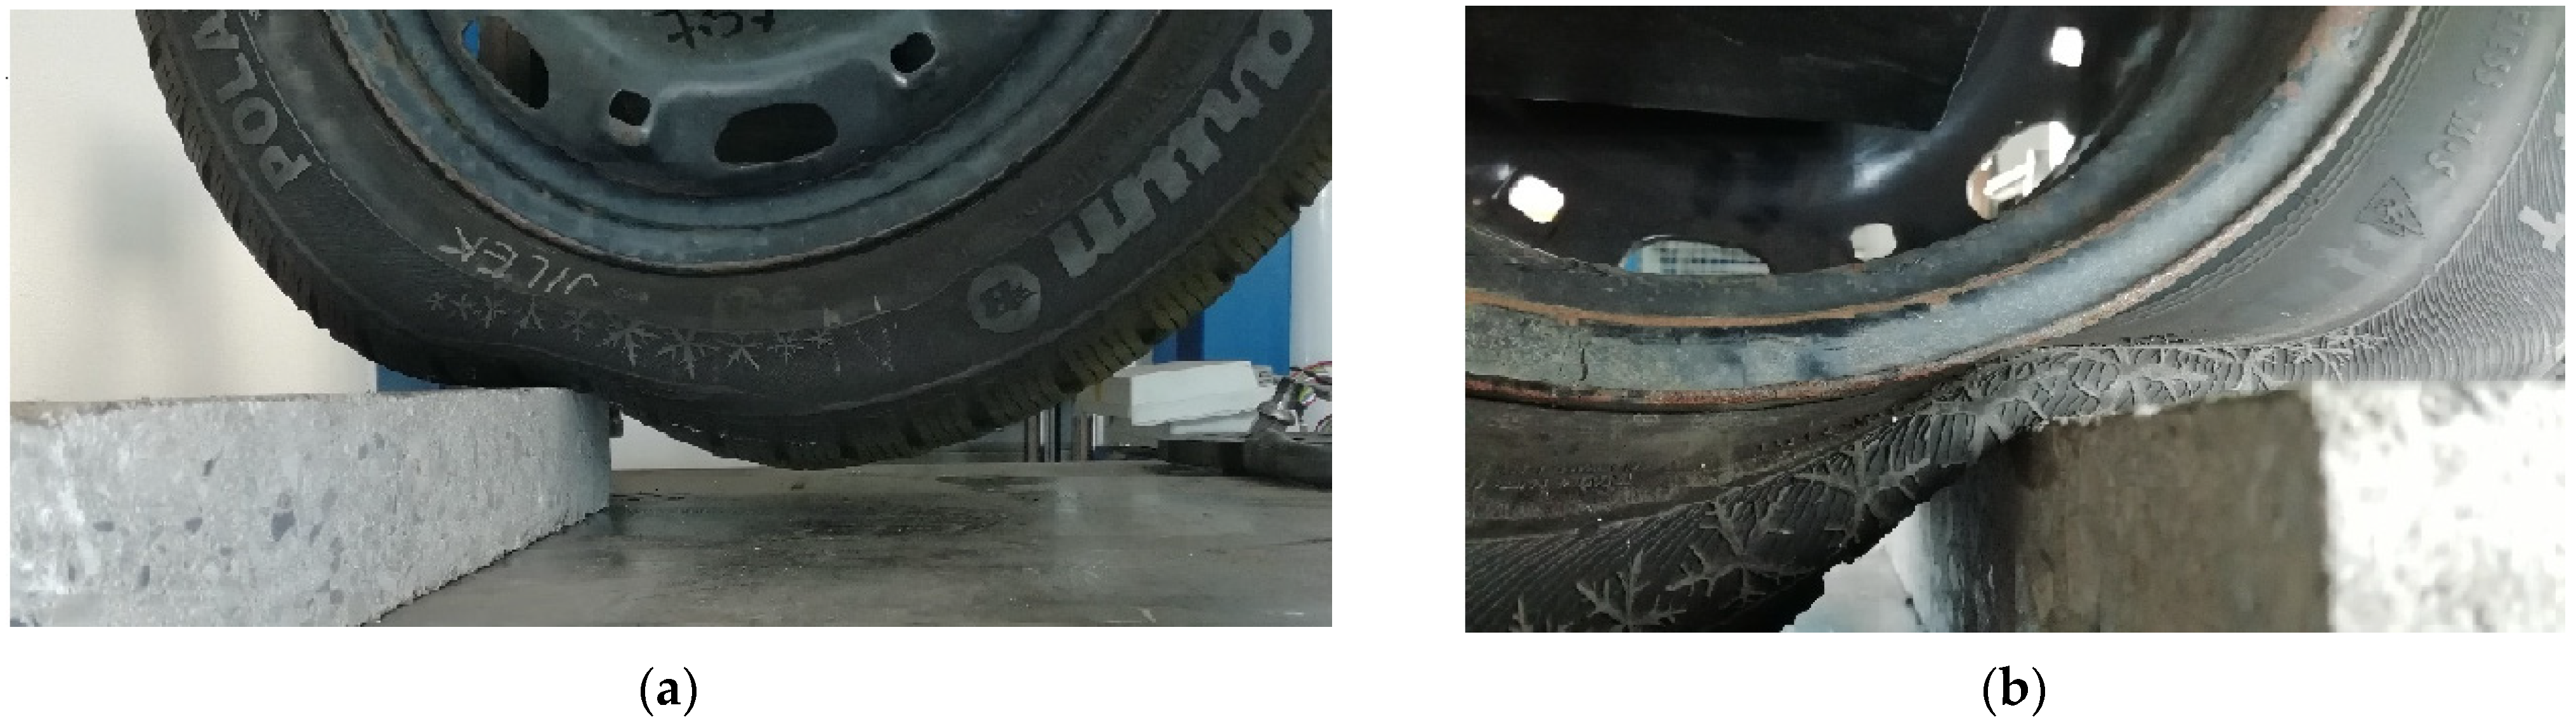
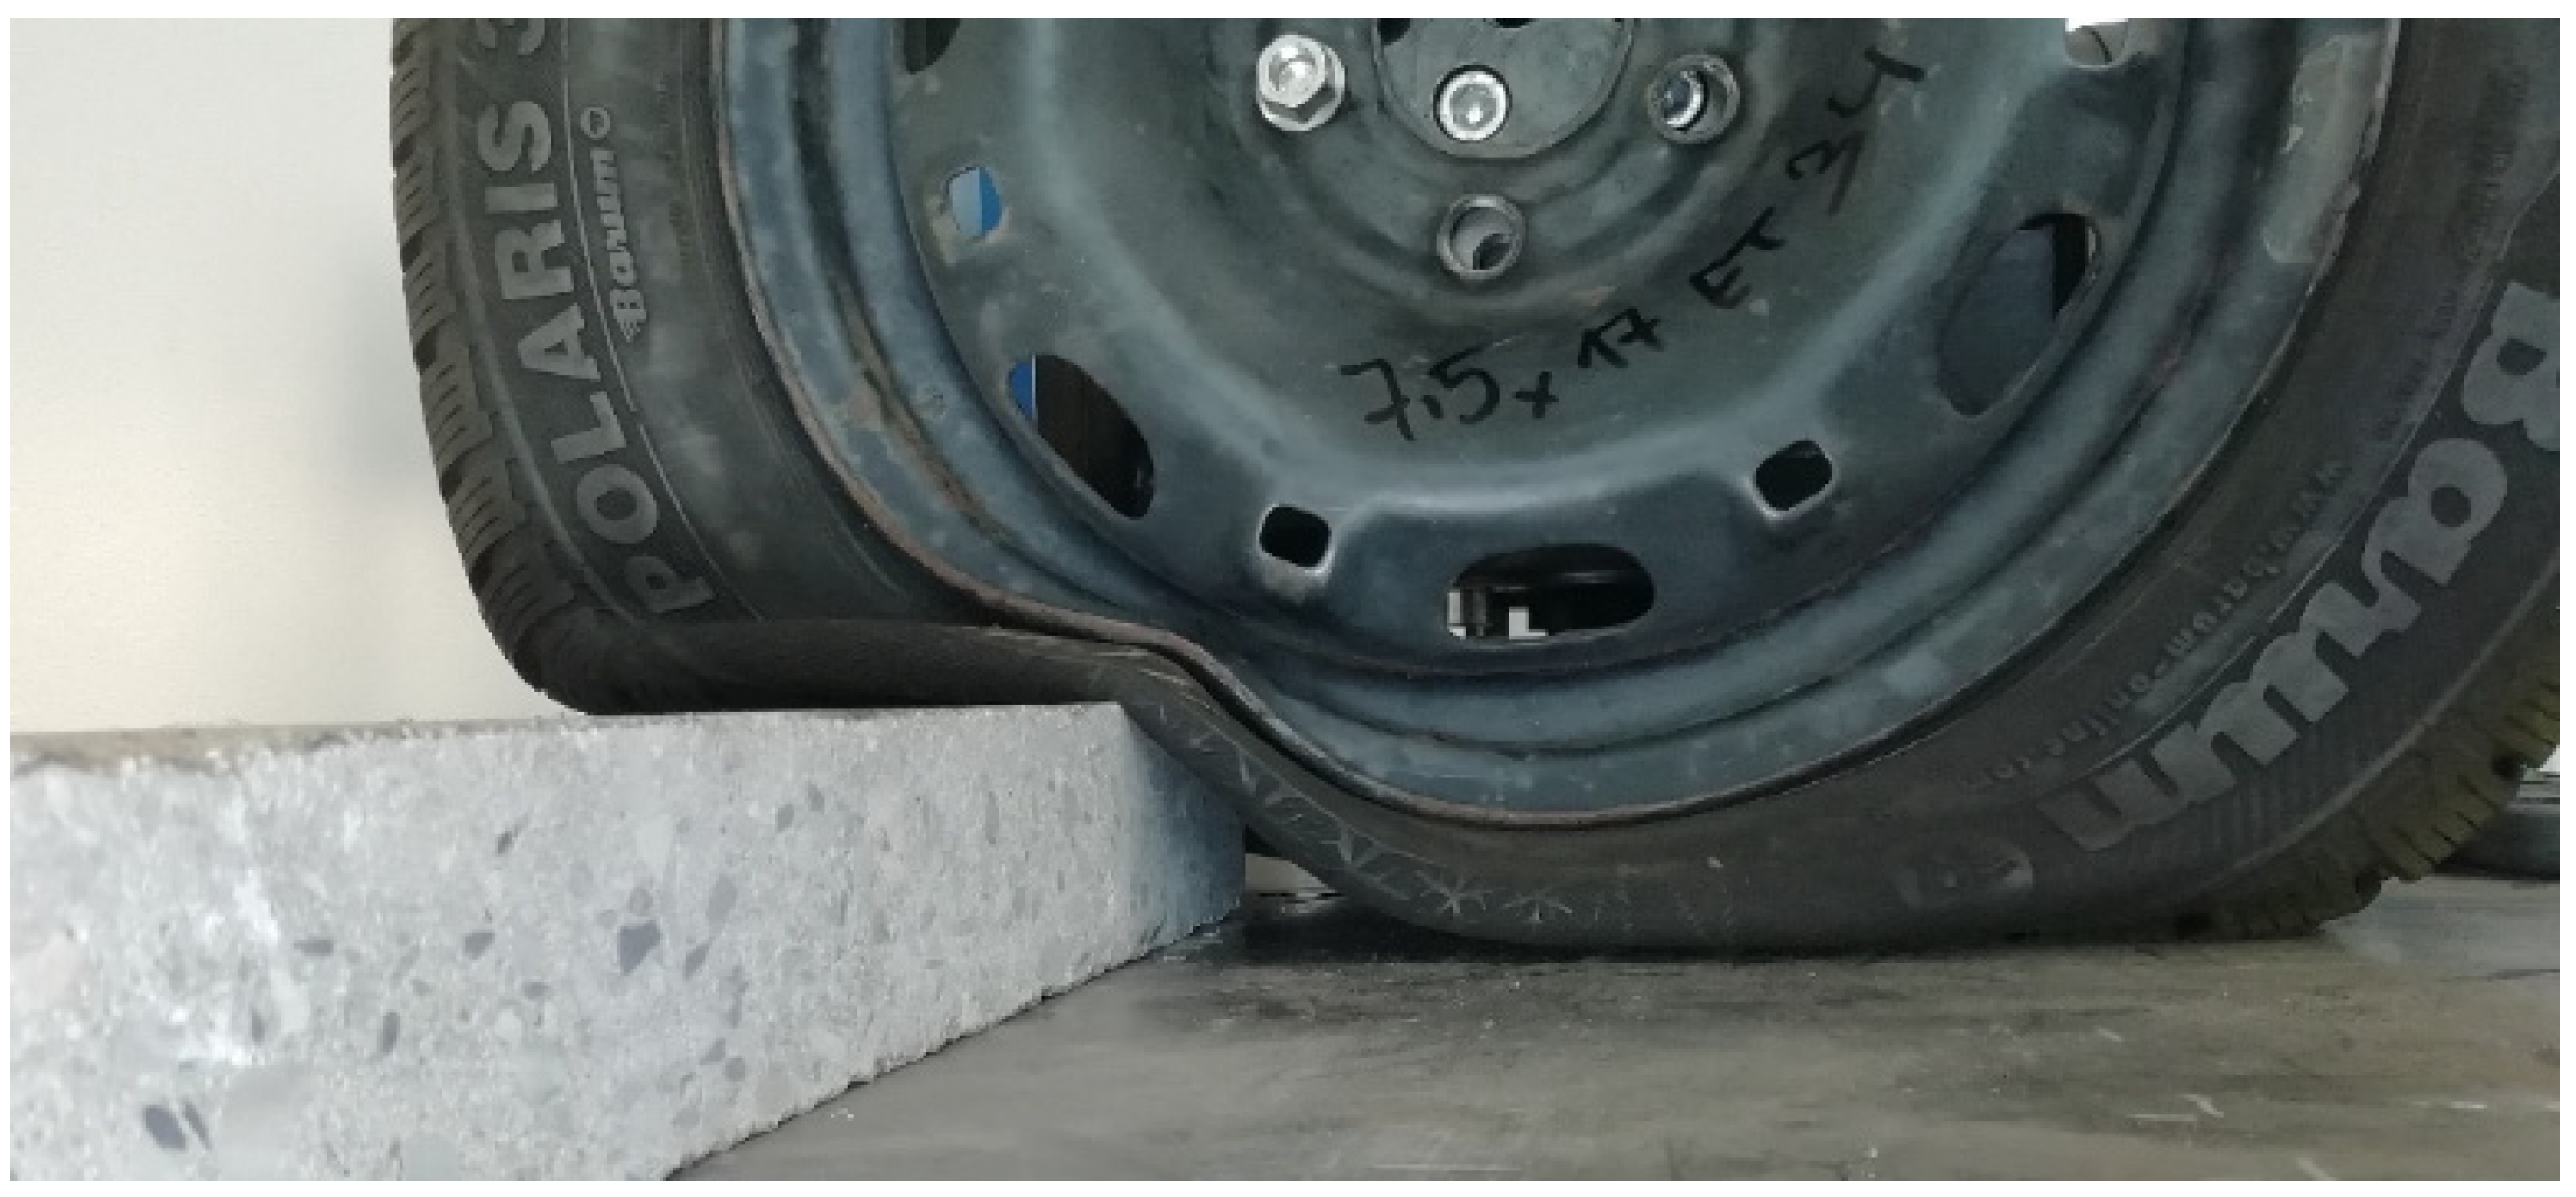
5. Research on a Real Object

Simulations of the impact of a tire with an obstacle are performed with the condition of vertical displacement of the obstacle towards the stationary wheel. This assumption is also the basis for performing experimental tests related to tire damage and deformation of the wheel rim. However, in the case of a real collision, the conditions of contact of the wheel with the obstacle are different and result from the location of the impact point on the wheel, the angular position of which results from the height of the obstacle.
Laboratory tests were carried out on the impact of a pneumatic tire consisting of a 225/50R17 tire mounted on a 7.5J×17 ET34 rim against an obstacle while maintaining impact conditions similar to real ones. The aim of the measurements was to compare the results of the wheel rim deformation obtained in both methods.
The test stand is shown in Figure 10. The wheel mounted on the support system is moved vertically without the possibility of rotating in relation to the obstacle. The obstruction is restrained so that the straight line joining the point of contact with the center of the wheel makes an angle of 30° to the vertical axis of the wheel. The shape and dimensions of the obstacle corresponded to a curb block installed between the road surface and the footpath. The implementation of the experiment consisted of loading the vehicle wheel in the vertical direction. The value of the loading force was selected so that the impact energy corresponded to the energy when the vehicle was moving at a speed of 50 km/h.
Figure 11 and Figure 12 show the stages of the wheel hitting an obstacle performed on the test stand.
The shape of the deformation of the rim is similar to the shape obtained from the model tests of a collision with a symmetrical obstacle (Figure 5). The maximum displacement of the point at the edge of the rim is 21 mm. This value is lower by approx. 30% in relation to the results obtained in FEM modeling. Despite the use of a simplified numerical model to analyze damage to a passenger car wheel after hitting an obstacle, the obtained results were similar to those presented by Gao et al. [55].

6. Conclusions

The bench tire deformation tests were performed according to the test procedure contained in international standards. This is due to the necessity to obtain repeatability of tests and to compare the results obtained for various combinations of tire and wheel rim. The numerical tests using the finite element method were based on the general assumptions of the bench tests regarding impact modeling. In real cases, we often encounter a situation where a vehicle moving along a track perpendicular to an obstacle (curb) hits it. The point of impact does not lie in the vertical plane of the wheel, but its position depends on the diameter of the wheel and the height of the obstacle. The resulting deformation of the rim is the only parameter used to analyze the causes of a collision, in particular the vehicle speed. Therefore, a problem arises whether the results of the tire wheel strength analysis carried out according to standardized procedures can be used to infer the causes of a collision. The results presented in the article allow for the formulation of two basic conclusions regarding the deformation of the rim. The formulation of hypotheses may be supported by the results of numerical analyses of the collision of a wheel with a symmetrical obstacle. The obtained differences in the size of the deformation of the rim are acceptable during court settlements as to the causes and effects of the collision.

Author Contributions

Conceptualization, S.T., J.C. and A.N.; methodology, S.T., J.C., A.N., P.J. and M.S.; software, J.C. and A.N.; validation, P.J. and M.S.; formal analysis, S.T., J.C., A.N., P.J. and M.S.; investigation, S.T., J.C. and A.N.; resources, S.T., J.C., A.N., P.J. and M.S.; data curation, J.C. and A.N.; writing—original draft preparation, S.T., J.C., A.N. and M.S.; writing—review and editing, J.C., A.N. and S.T.; visualization, J.C. and A.N.; supervision, J.C.; project administration, J.C. and A.N. All authors have read and agreed to the published version of the manuscript.

Funding

The project/research was financed in the framework of the project Lublin University of Technology—Regional Excellence Initiative, funded by the Polish Ministry of Science and Higher Education (contract no. 030/RID/2018/19).

Institutional Review Board Statement

Not applicable.

Informed Consent Statement

Not applicable.

Data Availability Statement

Not applicable.

Conflicts of Interest

The authors declare no conflict of interest.

References

  1. Pokorski, J.; Reński, A.; Sar, H. System for investigation of friction properties of the road surface. Balt. J. Road Bridge Eng. 2015, 10, 126–131. [Google Scholar] [CrossRef]
  2. Skrúcaný, T.; Vrábel, J.; Kendra, M.; Kažimír, P. Impact of cargo distribution on the vehicle flatback on braking distance in road freight transport. MATEC Web Conf. 2017, 134, 00054. [Google Scholar] [CrossRef]
  3. Vrabel, J.; Stopka, O.; Rievaj, V.; Šarkan, B.; Pruskova, K.; Michalk, P. Measuring the resistance of tires for passenger vehicle against the rolling and sliding on loading area of the flatbed truck when providing the transport services. Commun. Sci. Lett. Univ. Zilina 2016, 18, 124–128. [Google Scholar] [CrossRef]
  4. Wang, Y.; Hu, J.; Wang, F.; Dong, H.; Yan, Y.; Ren, Y.; Zhou, C.; Yin, G. Tire Road Friction Coefficient Estimation: Review and Research Perspectives. Chin. J. Mech. Eng. 2022, 35, 6. [Google Scholar] [CrossRef]
  5. Stan Bezpieczeństwa ruchu Drogowego oraz Działania Realizowane w tym Zakresie w 2020 r. Uchwała nr 1/2021, Krajowej Rady Bezpieczeństwa Ruchu Drogowego z dnia 22 Kwietnia 2021 r. (In Polish). Available online: https://www.krbrd.gov.pl/wp-content/uploads/2021/05/Stan-bezpieczenstwa-ruchu-drogowego-oraz-dzialania-realizowane-w-tym-zakresie-w-2020-r.pdf (accessed on 10 March 2022).
  6. Kalasova, A.; Čulík, K.; Hajnik, A. Young Drivers and Their Risky Behavior on the Roads. In Proceedings of the 2020 12th International Science-Technical Conference Automotive Safety, Automotive Safety 2020, Kielce, Poland, 21–23 October 2020; p. 9293520. [Google Scholar]
  7. Pajković, V.; Grdinić-Rakonjac, M. Age-related differences in attitudes and perception on road safety issues in Montenegro. Transp. Res. Proc. 2022, 60, 584–591. [Google Scholar] [CrossRef]
  8. Szumska, E.; Frej, D.; Grabski, P. Analysis of the causes of vehicle accidents in Poland in 2009–2019. LOGI Sci. J. Transp. Logist. 2020, 11, 76–87. [Google Scholar] [CrossRef]
  9. Linkov, V.; Perůtka, J.; Zaoral, A.; Tučka, P.; Ťápal, A.; Zůvala, R.; Řezáč, P. The speed behavior of Czech professional drivers according to ordinary vs. variable speed limit signs: An on-road and driving simulation based comparison. Perner’s Contacts 2019, 14, 35–43. [Google Scholar]
  10. Ágoston, G.; Madlenák, R. Road safety macro assessment model: Case study for Hungary. Period. Polytech. Transp. Eng. 2021, 49, 89–92. [Google Scholar] [CrossRef] [Green Version]
  11. Czech, P. Underage pedestrian road users in terms of road accidents. Adv. Intell. Syst. Comput. 2017, 505, 33–44. [Google Scholar]
  12. Gogola, M.; Ondrus, J. Road safety perspective of small children. In Proceedings of the 12th International Science-Technical Conference Automotive Safety, Automotive Safety 2020, Kielce, Poland, 21–23 October 2020; p. 9293525. [Google Scholar]
  13. Hájnik, A.; Harantová, V.; Kalašová, A.; Čulík, K. Traffic modeling of intersections on Vajnorská street in Bratislava. Transp. Probl. 2021, 16, 29–40. [Google Scholar] [CrossRef]
  14. Mamcarz, P.; Droździel, P.; Madleňáková, L.; Sieradzki, A.; Droździel, P. Level of occupational stress, personality and traffic incidents: Comparative study of public and freight transport drivers. Transp. Res. Proc. 2019, 40, 1453–1458. [Google Scholar] [CrossRef]
  15. Pecyna, A.; Krzysiak, Z.; Zarajczyk, J.; Buczaj, A.; Kobus, Z.; Pieniak, D. Safety during transport of hazardous materials in Poland. Przem. Chem. 2019, 98, 1517–1521. [Google Scholar]
  16. Wang, Z.; Suga, S.; Nacpil, E.J.C.; Yang, B.; Nakano, K. Effect of Fixed and sEMG-Based Adaptive Shared Steering Control on Distracted Driver Behavior. Sensors 2021, 21, 7691. [Google Scholar] [CrossRef] [PubMed]
  17. Borawski, A.; Szpica, D.; Mieczkowski, G.; Borawska, E.; Awad, M.M.; Shalaby, R.M.; Sallah, M. Theoretical analysis of the motorcycle front brake heating process during high initial speed emergency braking. J. Appl. Comput. Mech. 2020, 6, 1431–1437. [Google Scholar]
  18. Erd, A.; Jaśkiewicz, M.; Koralewski, G.; Rutkowski, D.; Stoklosa, J. Experimental research of effectiveness of brakes in passenger cars under selected conditions. In Proceedings of the 11th International Science and Technical Conference Automotive Safety, Automotive Safety 2018, Žastá, Slovakia, 18–20 April 2018; pp. 1–5. [Google Scholar]
  19. Ondruš, J.; Vrábel, J.; Kolla, E. The influence of the vehicle weight on the selected vehicle braking characteristics. In Proceedings of the International Conference 2018, Transport Means, Trakai, Lithuania, 3–5 October 2018; pp. 384–390. [Google Scholar]
  20. Šarkan, B.; Jaśkiewicz, M.; Kiktová, M. The impact of the truck loads on the braking efficiency assessment. Open Eng. 2020, 10, 105–112. [Google Scholar] [CrossRef]
  21. Jaśkiewicz, M.; Lisiecki, J.; Lisiecki, S.; Pokropinski, E.; Wieckowski, D. Facility for performance testing of power transmission units. Sci. J. Marit. Univ. Szczec. 2015, 42, 14–25. [Google Scholar]
  22. Szpica, D. Modeling of the operation of a pneumatic differential valve increasing the efficiency of pneumatic brake actuation of road trains. In Proceedings of the International Conference 2018, Transport Means, Trakai, Lithuania, 3–5 October 2018; pp. 151–156. [Google Scholar]
  23. Dižo, J.; Blatnický, M.; Sága, M.; Harušinec, J.; Gerlici, J.; Legutko, S. Development of a New System for Attaching the Wheels of the Front Axle in the Cross-Country Vehicle. Symmetry 2020, 12, 1156. [Google Scholar] [CrossRef]
  24. Gorbunov, M.; Dižo, J.; Blatnický, M.; Kravchenko, K.; Semenov, S.; Mikhailov, E. Proposal of a method for detection of a damaged hydraulic shock absorber in a vehicle’s suspension system. Commun. Sci. Lett. Univ. Zilina 2022, 24, B41–B48. [Google Scholar] [CrossRef]
  25. Jurecki, R.; Jaśkiewicz, M.; Wdowski, T. Testing the influence of car load and pressure in tyres on the value of damping of shock absorbers specified with the use of the Eusama method. Diagnostyka 2014, 15, 45–50. [Google Scholar]
  26. Vaiciunas, G.; Steišunas, S.; Dižo, J. The nadal criterion study in a passenger car with independently rotating wheels. In Proceedings of the International Conference 2020, Transport Means, Kaunas, Lithuania, 30 September–2 October 2020; pp. 878–883. [Google Scholar]
  27. Lukac, M.; Brumercik, F.; Krzywonos, L. Driveability simulation of vehicle with variant tire properties. Commun. Sci. Lett. Univ. Zilina 2016, 18, 34–37. [Google Scholar] [CrossRef]
  28. Orynycz, O.; Tucki, K.; Wasiak, A.; Sobótka, R.; Gola, A. Evaluation of the brake’s performance dependence upon technical condition of car tires as a factor of road safety management. Energies 2019, 13, 9. [Google Scholar] [CrossRef] [Green Version]
  29. Rievaj, V.; Vrabel, J.; Hudak, J. Tire inflation pressure influence on a vehicle stopping distances. Int. J. Traffic Transp. Eng. 2013, 2, 9–13. [Google Scholar]
  30. Trnka, L.; Gogola, M. Analysis of the tire contact area pressure on the road. Perner’s Contacts 2019, 14, 49–59. [Google Scholar]
  31. Kubba, A.E.; Jiang, K. A Comprehensive study on technologies of tyre monitoring systems and possible energy solutions. Sensors 2014, 14, 10306–10345. [Google Scholar] [CrossRef]
  32. Szczucka-Lasota, B.; Węgrzyn, T.; Łazarz, B.; Kamińska, J.A. Tire pressure remote monitoring system reducing the rubber waste. Transp. Res. D Trans. Environ. 2021, 98, 102987. [Google Scholar] [CrossRef]
  33. Bukova, B.; Tengler, J.; Brumercikova, E. A Model of the Environmental Burden of RFID Technology in the Slovak Republic. Sustainability 2021, 13, 3684. [Google Scholar] [CrossRef]
  34. Droździel, P.; Krzywonos, L.; Madlenak, R.; Rybicka, I. Selected aspects of analyses of failure rates of active safety systems in buses. Komunikacie 2014, 16, 114–119. [Google Scholar] [CrossRef]
  35. Gnap, J.; Jagelčák, J.; Marienka, P.; Frančák, M.; Kostrzewski, M. Application of mems sensors for evaluation of the dynamics for cargo securing on road vehicles. Sensors 2021, 21, 2881. [Google Scholar] [CrossRef]
  36. Wang, H.; Sun, Y.; Gao, Z.; Chen, L. Extension coordinated multi-objective adaptive cruise control integrated with direct yaw moment control. Actuators 2021, 10, 295. [Google Scholar] [CrossRef]
  37. Previati, G.; Ballo, F.; Gobbi, M.; Mastinu, G. Radial impact test of aluminum wheels—Numerical simulation and experimental validation. Int. J. Impact Eng. 2019, 126, 117–134. [Google Scholar] [CrossRef]
  38. Chauhan, M.; Kotwal, G.; Majge, A. Numerical Simulation of Tire and Wheel Assembly Impact Test Using Finite Element Method. SAE Tech. Paper 2015. [Google Scholar] [CrossRef]
  39. Kocabicak, U.; Firat, M. Numerical analysis of wheel cornering fatigue tests. Eng. Fail. Anal. 2001, 8, 339–354. [Google Scholar] [CrossRef]
  40. Firat, M.; Kozan, R.; Ozsoy, M.; Mete, O.H. Numerical modeling and simulation of wheel radial fatigue tests. Eng. Fail. Anal. 2009, 16, 1533–1541. [Google Scholar] [CrossRef]
  41. Santiciolli, F.M.; Moller, R.; Krause, I.; Dedini, F.G. Simulation of the scenario of the biaxial wheel fatigue test. Adv. Eng. Softw. 2017, 114, 337–347. [Google Scholar] [CrossRef]
  42. SAE J175, SAE Standards; Wheels—Lateral Impact Test Procedures—Road Vehicles. SAE International: Warrendale, PA, USA, 2016.
  43. ISO 7141, ISO Standards; Road Vehicles—Light Alloy Wheels—Impact Test. ISO: Geneva, Switzerland, 2005.
  44. Rader—Anforderungen und Prufungen, Arbeitskreis Lastenheft, Arbeitskreis-Lastenheft AK-LH 08, Arbeitskreis der Firmen: Audi AG, Bayerische Motorenwerke AG, Daimler Chrysler AG, Porsche AG, Volkswagen AG, 2006.
  45. Ballo, F.; Previati, G.; Mastinu, G.; Comolli, F. Impact tests of wheels of road vehicles: A comprehensive method for numerical simulation. Int. J. Impact Eng. 2020, 146, 103719. [Google Scholar] [CrossRef]
  46. Neves, R.R.V.; Micheli, G.B.; Alves, M. An experimental and numerical investigation on tyre impact. Int. J. Impact Eng. 2010, 37, 685–693. [Google Scholar] [CrossRef]
  47. Chang, C.L.; Yang, S.H. Simulation of wheel impact test using finite element method. Eng. Fail. Anal. 2009, 16, 1711–1719. [Google Scholar] [CrossRef]
  48. Yuan, X.M.; Zhang, L.J.; Chen, X.Y.; Du, B.; Li, B.H.; Fan, L.G.; Pan, Y. Numerical Simulation of Aluminum Alloy Wheel 13° Impact Test Based on Abaqus. Appl. Mech. Mater. 2012, 215–216, 1191–1196. [Google Scholar] [CrossRef]
  49. Sokolov, S.L. Calculation of the stress-strain state of pneumatic tires by the finite element method. J. Mach. Manuf. Reliab. 2007, 36, 45–49. [Google Scholar] [CrossRef]
  50. An Integrated Approach for Transient Rolling of Tyres. Abaqus Technology Brief 2007. Available online: https://imechanica.org/files/Automotive-SIMULIA-Tech-Brief-03-Integrated-Approach-Transient-Tires-Full.pdf (accessed on 2 March 2022).
  51. Wang, Z.; Li, B.; Liang, C.; Wang, X.; Li, J. Response Analysis of a Scraper Conveyor under Chain Faults Based on MBD-DEM-FEM. Stroj. Vestn. J. Mech. Eng. 2021, 67, 501–515. [Google Scholar] [CrossRef]
  52. Sojka, M.; Čornák, Š.; Droppa, P. Selected problems of tracked vehicle movement modelling. In Proceedings of the 21st International Scientific Conference Transport Means 2017, Juodkrante, Klaipėda, Lithuania, 20–22 September 2017; pp. 493–498, Code 135093. [Google Scholar]
  53. Wan, X.; Liu, X.; Shan, Y.; Jiang, E.; Yuan, H. Numerical and experimental investigation on the effect of tire on the 13° impact test of automotive wheel. Adv. Eng. Softw. 2019, 133, 20–27. [Google Scholar] [CrossRef]
  54. ISO 4000-2:2013; Passenger Car Tyres and Rims—Part 2: Rims. ISO: Geneva, Switzerland, 2013.
  55. Gao, Q.; Shan, Y.; Wan, X.; Feng, Q.; Liu, X. 90-degree impact bench test and simulation analysis of automotive steel wheel. Eng. Fail. Anal. 2019, 105, 143–155. [Google Scholar] [CrossRef]
Figure 1. Models used in the strength analysis; (a) rim; (b) tire; (c) wheel hub; (d) rocker arm.
Applsci 12 06371 g001
Figure 2. Variant of the obstacle: (a) symmetrical, (b) asymmetrical.
Applsci 12 06371 g002
Figure 3. Model analyzed with an overlaid FEM mesh: (a) front, (b) back view.
Applsci 12 06371 g003
Figure 4. Graphic illustration of the impact method at t = 0: (a) obstacle symmetrical, (b) obstacle asymmetrical.
Applsci 12 06371 g004
Figure 5. Distribution of stresses (a) and displacements (b) after the wheel hits a symmetrical obstacle—isolated rim.
Applsci 12 06371 g005
Figure 6. Location of suspension elements: (a) rocker arm and shock absorber blocked with spring; (c) in front of; (b,d) after impact.
Applsci 12 06371 g006
Figure 7. Wheel: (a) obstacle system before; (b) after impact.
Applsci 12 06371 g007
Figure 8. (a) Distribution of stresses and (b) displacements; after the wheel hits an asymmetrical obstacle—isolated rim.
Applsci 12 06371 g008
Figure 9. Comparison diagram of the maximum stresses in the wheel rim as a function of the duration of the simulation.
Applsci 12 06371 g009
Figure 10. View of the test stand: 1—transverse and longitudinal displacement mechanism of the measuring table; 2—hydraulic pump; 3—pair of vertical force sensors; 4—hydraulic actuator; and 5—control panel for measuring the vertical load.
Applsci 12 06371 g010
Figure 11. Impact stage: (a) the first phase of contact, pressure increase in the tire and tire deformation, (b) tire deformation, rim edge does not come into contact with the obstacle.
Applsci 12 06371 g011
Figure 12. End of impact simulation, visible maximum tire and rim deformation.
Applsci 12 06371 g012
Table 1. Characteristics of finite elements.
ModelType of Finite ElementsNumber of Finite ElementsNumber of Nodes
TireC3D8R78,719109,783
RimC3D8R34,65653,228
Wheel hubC3D8R17032384
The steel belt inside the tireS4R25402667
ObstacleR3D425602562
Publisher’s Note: MDPI stays neutral with regard to jurisdictional claims in published maps and institutional affiliations.

