Article

Concentrations of Beetroot (Beta vulgaris L.) Peel and Flesh Extracts by Reverse Osmosis Membrane

Department of Food Process Engineering, Institute of Food Science and Technology, Hungarian University of Agriculture and Life Sciences, Ménesi út 44, H-1118 Budapest, Hungary
*
Author to whom correspondence should be addressed.
Appl. Sci. 2022, 12(13), 6360; https://doi.org/10.3390/app12136360
Submission received: 1 June 2022 / Revised: 17 June 2022 / Accepted: 19 June 2022 / Published: 22 June 2022

Abstract

:
The objective of this investigation was to concentrate betalains, phenolics, and antioxidants from the extract of peel and flesh of beetroot (Beta vulgaris L.). Thin-film composite reverse osmosis (RO) membrane composed of the thick polyamide barrier layer, microporous polysulfone interlayer, and polyester support web was used in membrane module. In a later exercise, thermo-instability of betalain color compounds was investigated with different temperatures. After the filtration of the aqueous extract of flesh, betacyanins, betaxanthins, and total betalains were increased by 5.2, 6.1, and 5.5 times, respectively. Likewise, the mentioned bioactive compounds were increased by 3.7, 4.9, and 4.2 times after filtration of the aqueous extract of peel. The amounts of total betalains measured in the final flesh extract were two times lower (14.33 ± 0.15 mg·g−1 dm) compared to the peel concentrate (30.02 ± 0.28 mg·g−1 dm). The superior amount of phenolic was shown in the final flesh extract (34.47 ± 0.19 mg GAE·g−1 dm) compared to peel extract (12.74 ± 0.42 mg GAE·g−1 dm). The antioxidant activity in final beetroot peel extract and flesh extract were 24.65 ± 1.42 mg ASE·g−1 dm and 11.6 ± 0.1 mg ASE·g−1 dm, respectively. The recovery of thermo-sensitive bio-colorants was achieved by membrane filtration with the least thermal degradation.

1. Introduction

Reverse osmosis (RO) is a pressure-driven process, whereby a semipermeable membrane rejects dissolved constituents present in the feed stream. This rejection is due to size exclusion, charge exclusion, and physicochemical interactions between solute, solvent, and membrane [1]. The process efficiency depends on operational parameters, and on the properties of membrane and feed. The most commercially available modules are spiral-wound and hollow fiber. The latter has an extremely high packing density, and thus offers high permeation rate but is more prone to fouling. RO membranes can be either asymmetric, containing one polymer layer, or a composite of two or more layers [2].
The RO process is used in chemical and environmental engineering for the removal of inorganics and organic pollutants present in wastewater [3]. It is seen from the literature review that RO processes have been widely used for the separation and concentration (recovery) of solutes in many fields. The uses of RO in the treatment of various effluents from chemicals, petrochemical, electrochemical, food, paper, and tanning industries, as well as for the treatment of municipal wastewaters, have been reported in several articles [4,5,6]. Applications of RO have been known to be crucial for the concentration of fruit and vegetable juices, sea salts, dairy products, and removal of alcohol from alcoholic beverages [7,8,9]. Fundamentally, RO is combined with other filtration techniques, such as microfiltration [9], ultrafiltration [10], and nanofiltration [11]. This has led to improve the quality of product [3].
Beetroots (Beta vulgaris L.) are herbaceous biennials of the Chenopodiaceae family with high sugar content (7.7%), mostly sucrose, and trace amounts of fructose and glucose [12,13]. The alternative names are red beet, sugar beet, garden beet, white beet, sea beet, spinach beet, and chard. Aside from compacting with biopigment, known as betalains, beetroots are rich in nitrate (NO3), which plays a role in the cardiovascular system. Betalains are composed of red-color-giving betacyanin (BC) and yellow-color-giving betaxanthin (BX) compounds. Betalains associated with their antioxidant activity (AA) have been claimed as having anticancer, antiproliferation, anti-inflammatory, and antimicrobial activities [14,15]. Daily consumption of beetroot juice can regulate blood pressure, and has vasoprotective effects [12,13]. According to the findings of Shuaibu et al. [16], beetroots contain sodium (4.17 mg), potassium (13.82 mg), magnesium (5.91 mg), phosphorous (11.57 mg), copper (0.21 mg), and iron (26.46 mg) per 100 g. The chemical composition of the beetroot peel is presented as follows: moisture content (30.88%), ash content (10.58%), crude fat (3.29%), crude fiber (6.98%), protein (4.1%), and carbohydrate (44.17%), along with the mineral composition of sodium (4.17%), iron (26.46%), copper (0.21%), magnesium (5.91%), potassium (13.82%), and phosphorous (11.57%) [16].
In the articles of Zin et al. [17,18], the application of nano and RO membranes have been exploited in the concentration of the ethanolic, as well as aqueous, extracts of beetroot’s peel. In this particular research, betalains, phenolics, and antioxidants from the aqueous extract of peel, and flesh of beetroot were concentrated by thin-film composite-type RO membrane (X20). Furthermore, thermo-instability of betalains (color compounds) has been investigated.

2. Materials and Methods

2.1. Extraction of Betalains, Phenolics, and Antioxidants from Peel and Flesh of Beetroot

Beetroots (Beta Vulgaris L.), a variety of Cylindra, were supplied from Cegléd, Hungary. Primarily the beetroots were gently cleaned to remove foreign materials and peeled. Both peel and flesh of the beetroots were separately processed for the extraction. After removing crown and tail parts of 1 kg of whole fresh beetroot, around 50 g of peel and 800 g of flesh were achieved. First of all, the selected materials were grounded using a pulverizer (GM200; Retsch GmbH, Haan, Germany); subsequently, aqueous extraction was performed with 1:20 solid-to-solvent ratio. The extraction was achieved by a single-batch-type mode at 40 °C for 40 min [19]. The crude extracts were stored under refrigeration until membrane separations were performed.

2.2. Membrane Separation

Concentration of betalains, phenolics, and antioxidant compounds was performed by RO membrane. Low fouling type Trisep X20 Microdyn advanced composite membrane (WTECH1; Karmiel, Israel) with active surface areas of 0.18 m2 was considered in the present investigation. X20 is a thin-film composite membrane composed of the thick polyamide barrier layer, microporous polysulfone interlayer, and polyester support web. A cross-flow membrane house was used in the experiment. Detailed description of the membrane module is given in an earlier publication [18]. The membrane filtration was performed with TMP of 40 bar and recirculation flow rate of 400 L·h−1. A temperature-controlling system in the feed tank of the membrane module was set up for maintaining the temperature at ⁓27 °C. During the concentration process, the time required to collect each 100 mL of filtrate was recorded for the flux calculation. A total of 20 mL of retentate and permeate were collected at different time intervals for the analytical measurement. Pure water flux measurements were carried out before and after the membrane filtrations to estimate membrane resistance and fouling resistance. After the concentration process, distilled water was used for rinsing and removing the polarization layer completely. The chemical cleaning of the membranes was followed as necessary. Pure water flux measurements, membrane resistance (RM), fouling resistance (RF), permeate flux, and volume reduction ratio (VRR) were measured by the methods described in the previous study by Zin et al. [17].

2.3. Thermo-Instability of Betalains

Thermo-instability of betalains (color compounds) was expressed based on the changes of color. Changes in thermo-instability of betalains (color compounds) upon heat treatment (70 °C) were examined after membrane filtration. Samples in Eppendorf tubes were placed in a water bath (Precision COL 19; Thermo ScientificTM, Waltham, MA, USA) and heated for different times, ranging from 0–90 min in 15 min intervals. Kinetic parameter (k) of degradation kinetic equation and half-life (t1/2) were calculated by concentration of betalains vs. time.

2.4. Analytical Method

2.4.1. Total Betalains Compound (TBC), Betacyanin (BC), and Betaxanthin (BX)

Quantification of betalains was accomplished by Nilsson’s method. A UV–visible spectrophotometer (EvolutionTM 300; Thermo ScientificTM, Waltham, MA, USA) was adopted for this purpose. The sample extracts were diluted with McIlvain buffer solution (pH 6.5) with a suitable dilution factor before reading the absorbances. The respective betalain compounds were evaluated according to the following equations [20,21].
c = A   ×   DF ε   ×   l
where c is the molar concentration, A is the actual absorbance value, DF is the dilution factor, ɛ is the molar attenuation coefficient ( E 1 % 1 cm = 1120 for BC, and E 1 % 1 cm = 750 for BX), and l is the path length (1 cm). The following equations were adopted for the calculation of the respective absorbance values:
X BX = 1.095 × ( A 538 A 600 )
Y BC = A 476 A 538 X BX / 3.1
Z impurity = A 538 X BX
Therefore, TBC can be expressed according to Equation (5).
TBC = X BX + Y BC Z

2.4.2. Color Measurement (Values of L*, a*, and b*)

According to CIE (International Commission on Illumination), 1976; L*, a*, and b* are the uniform color scale, mostly applied in the visualization of the appearance of foods with the interpretation of color tonation. It is based on the respective color coordinates, such as L* for lightness (the closer to 100, the lighter in color), a* for redness or greenness (the higher in positive value, the more redness), and b* for blueness or yellowness (the higher the positive value, the more yellowish). The angle of Hue° denotes the degree between redness and yellowness of the sample, whereas saturation or color intensity is expressed by chroma ( C ab * ) [22]. The colour tonality (L*, a*, and b*) of beetroot peel and flesh extracts was measured to make a comparison between the crude extract, membrane permeate, and retentate. Color patterns of the samples were visualized by Chroma meter (CHROMA METER CR-400; Konica Minolta, Deutschland GmbH, Dusseldorf, Germany). Total color difference ( Δ E ab * ) was calculated according to Equation (6).
Δ E ab * = Δ L * + Δ a * + Δ b *
where ∆L* means differences between the lightness of the sample and the standard, ∆a* means the differences in redness or greenness, and ∆b* refers to the differences in yellowness or blueness. Chroma ( C ab * ) and Hue° were calculated from the respective a* and b* values.
C ab * = ( a * ) 2 + ( b * ) 2
Hue o = tan 1 ( b * a * )

2.4.3. Browning Index (BI)

The following equation was adopted from Ding et al. [22] to visualize the browning assessment of samples. Values of the measured color tonality, such as L*, a*, and b*, were used for the calculation.
BI = [ 100 × ( x 0.31 ) 0.17 ]
x = ( a * + 1.75 L * ) ( 5.645 L * + a * 0.3012 b * )

2.4.4. Total Phenolic Compound

Total phenolic compound (TPC) was measured by the Folin–Ciocalteu method [23]. A total of 20 µL of sample was mixed with 1250 µL of Folin reagent-distilled water (v:v 1:9) and 230 µL of the methanol-distilled water (v:v 4:1). The sample with reagent was incubated at room temperature (25 °C) for 1 min. Subsequently, 1000 µL of 0.7 M sodium carbonate solution was added to the sample–reagent mixture and it was incubated at 50 °C for 5 min in a water bath (Precision COL 19; Thermo ScientificTM, Waltham, MA, USA). The absorbance was measured at wavelength of 760 nm by a spectrophotometer (EvolutionTM 300; Thermo ScientificTM, Waltham, MA, USA). Gallic acid was used as a standard to express the result by gallic acid equivalent (GAE). The concentration of TPC was calculated by mentioned correlation.
TPC = A × TS × DF   s × α [ mg   GAE L ]
where A is the absorbance (-), TS is the total volume of solution (mL), s is the volume of sample (mL), α is the extinction coefficient (L·mg−1 of gallic acid), DF is the dilution factor (-), and TPC is represented by mg GAE·g−1 dm.

2.4.5. Ferric Reduction Antioxidant Power (FRAP) Assay

The ferric reducing antioxidant power (FRAP) method, according to Benzie and Devaki [24], was used to quantify the antioxidant activity (AA) of samples. FRAP reagent was prepared with 200 mL of acetate buffer (pH 3.6), 20 mL of ferric chloride solution (30 mM), and 20 mL of 2,4,6-tri [2-pyridyl]-1,3,5-triazine (TPTZ) solution (10 mM). A total of 10 mM of TPTZ solution was prepared by 40 mM of HCl. Totals of 1.5 mL of FRAP reagent, 30 µL of distilled water, and 20 µL of the sample were mixed and incubated in the dark condition for 5 min at room temperature. The colorimetric determination was performed at wavelength of 593 nm by a spectrophotometer (EvolutionTM 300; Thermo ScientificTM, Waltham, MA, USA). Ascorbic acid was used as a standard to express the result by ascorbic acid equivalent (ASE). AA in samples was calculated by mentioned correlation.
AA = A × TS × DF   s × α   [ mg   ASE L ]
where A is the absorbance, TS is the total volume of solution (mL), s is the volume of sample (mL), α is the extinction coefficient (L·mg−1 of ascorbic acid), DF is the dilution factor (-), and AA is represented by mg ASE·g−1 dm.

2.4.6. Miscellaneous

Yield percentage was calculated by moisture analyzer (KERN MLS; KERN & SOHN GmbH, Balingen, Germany). Total soluble solid (TSS) was determined by a refractometer (Pocket PAL-α; ATAGO Co., Ltd., Minato, Tokyo, Japan). Density was measured by a density meter (DMA 4500; Anton Paar, Graz, Austria).

3. Results

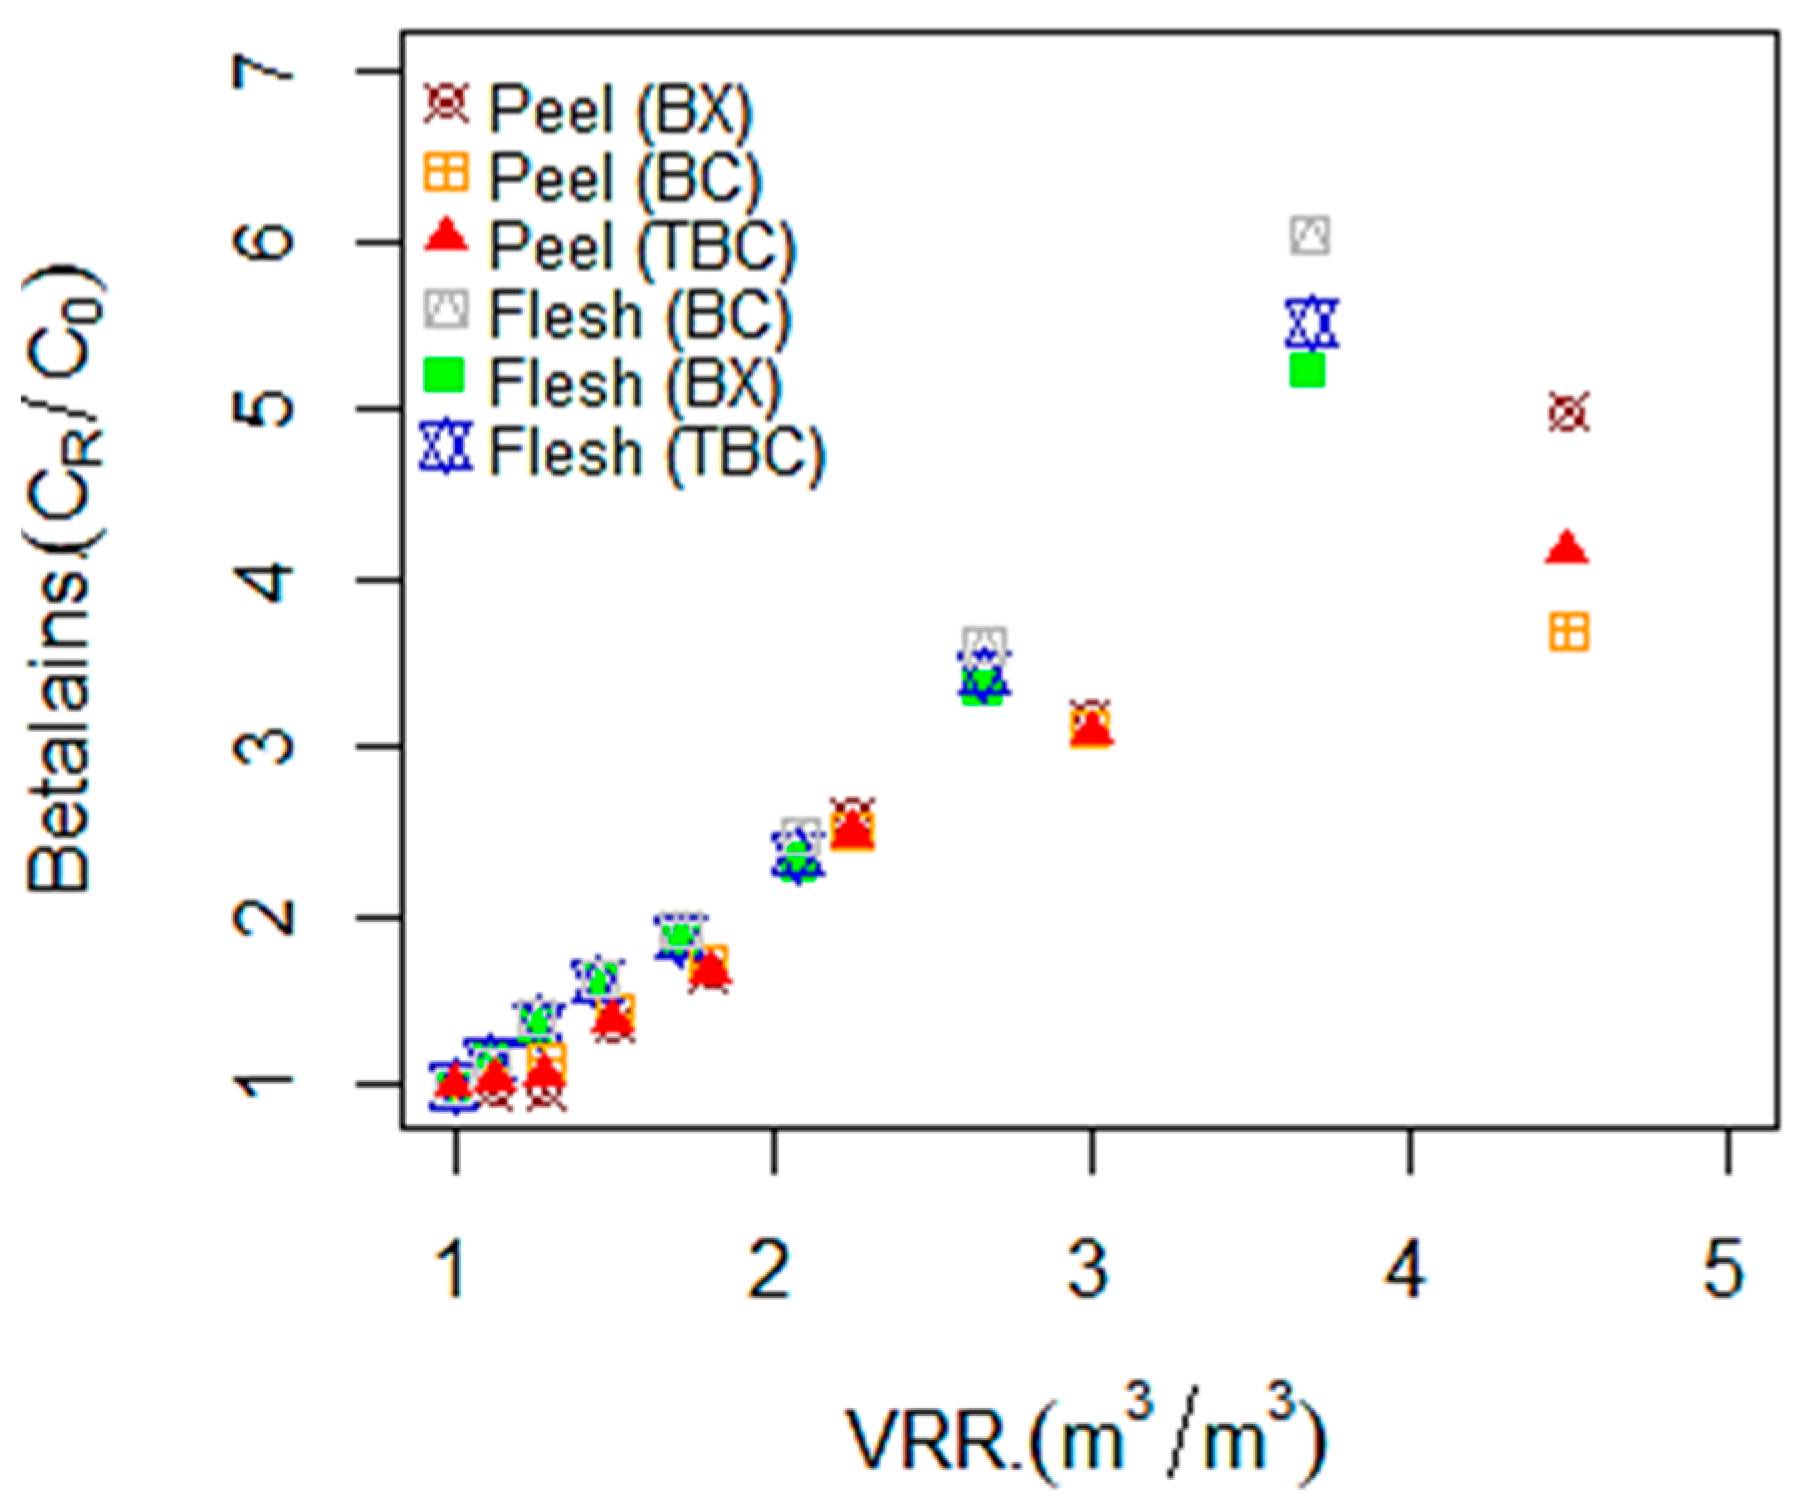
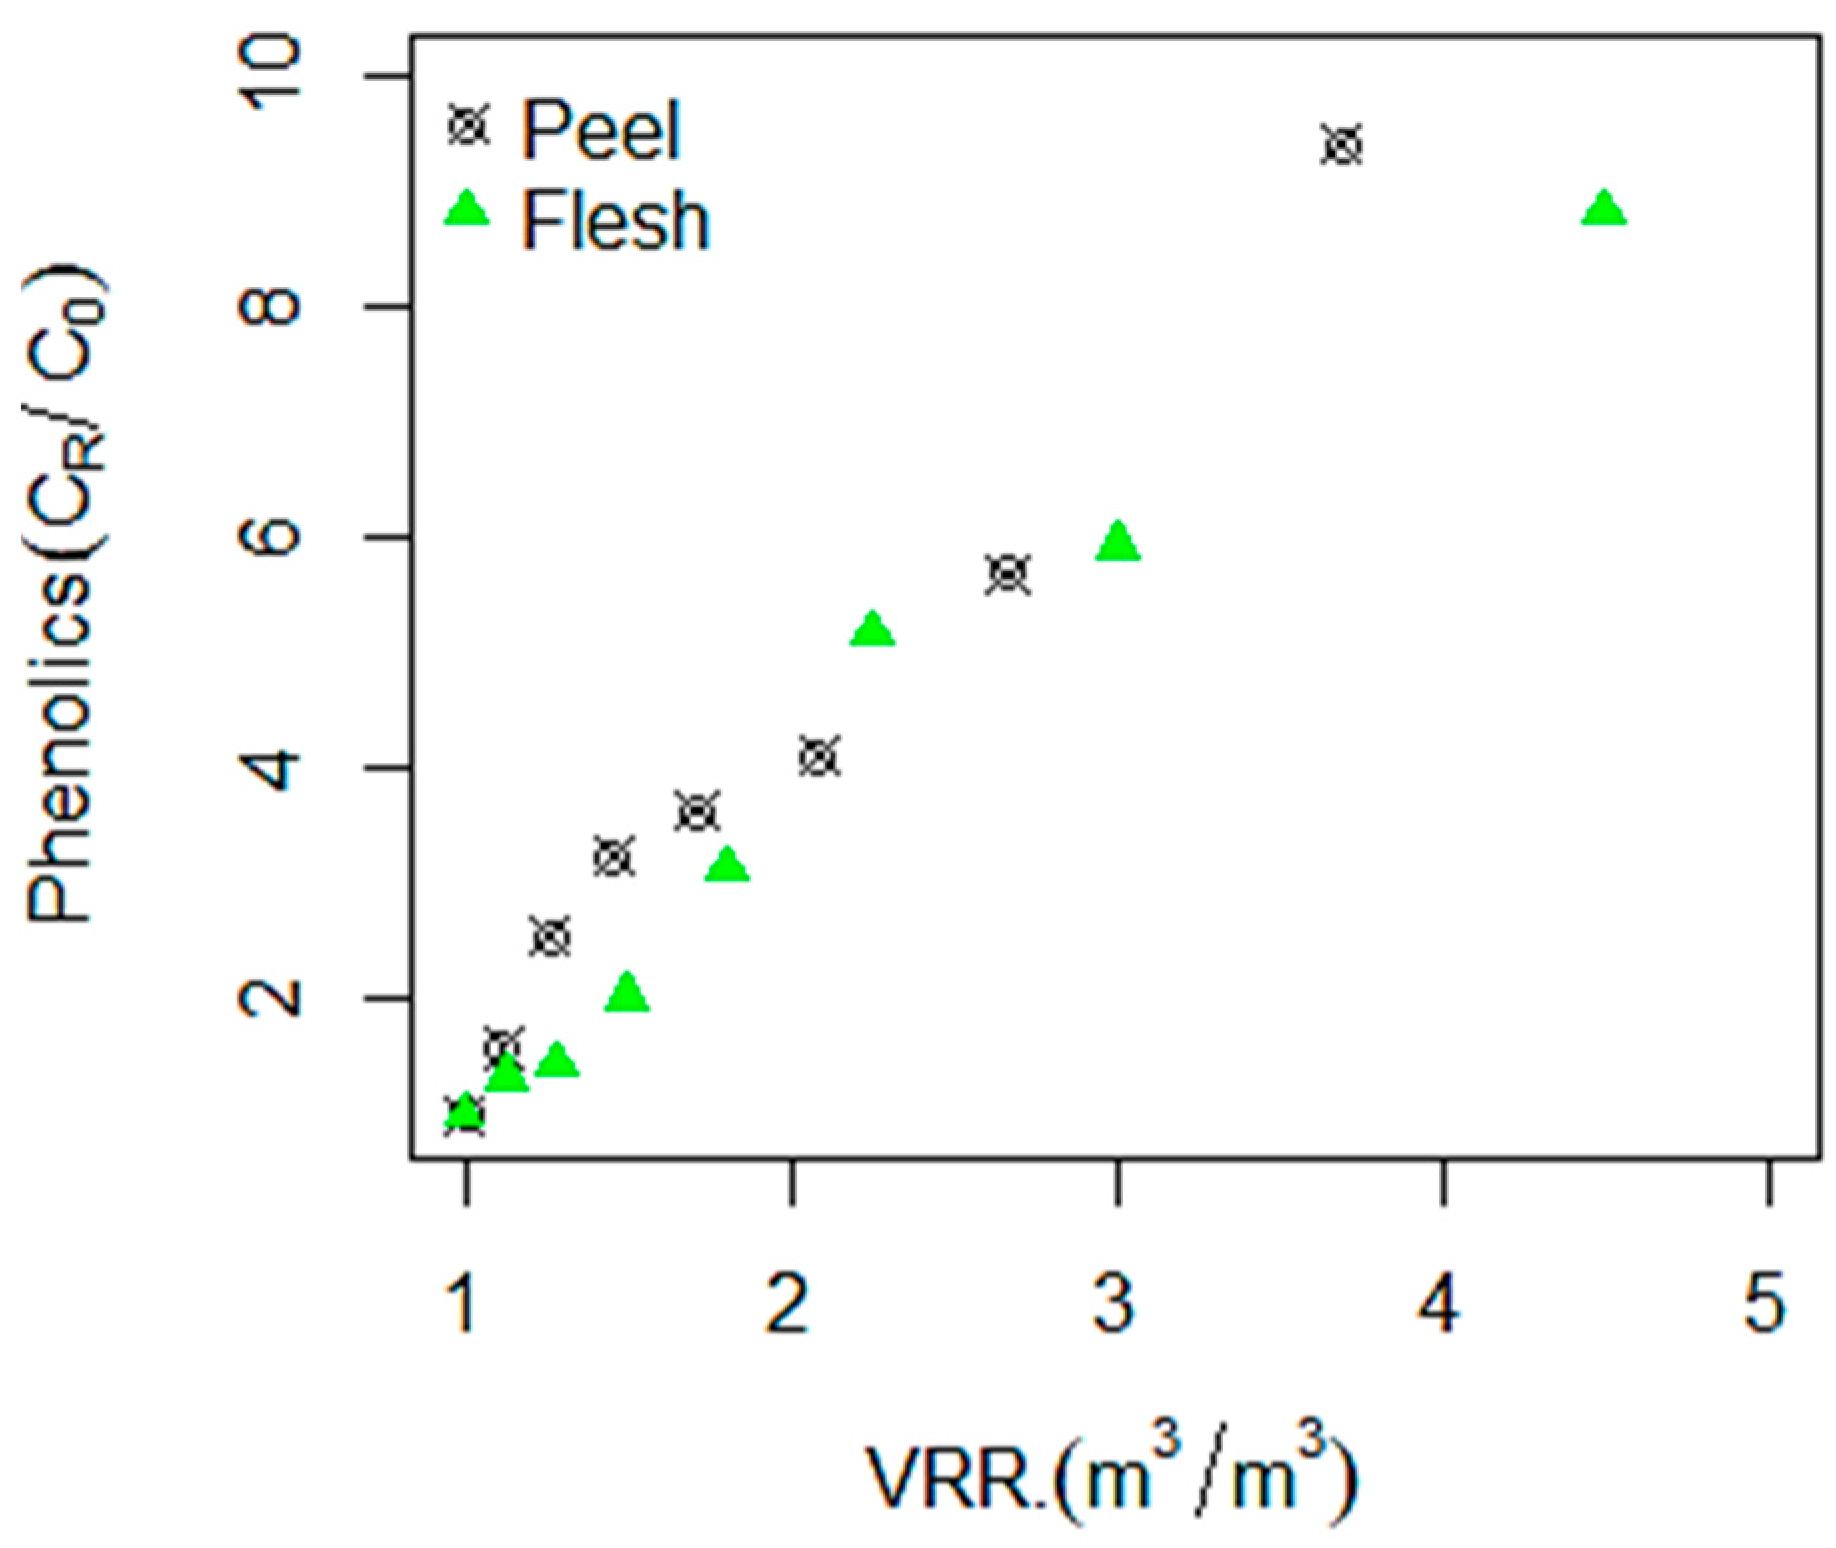
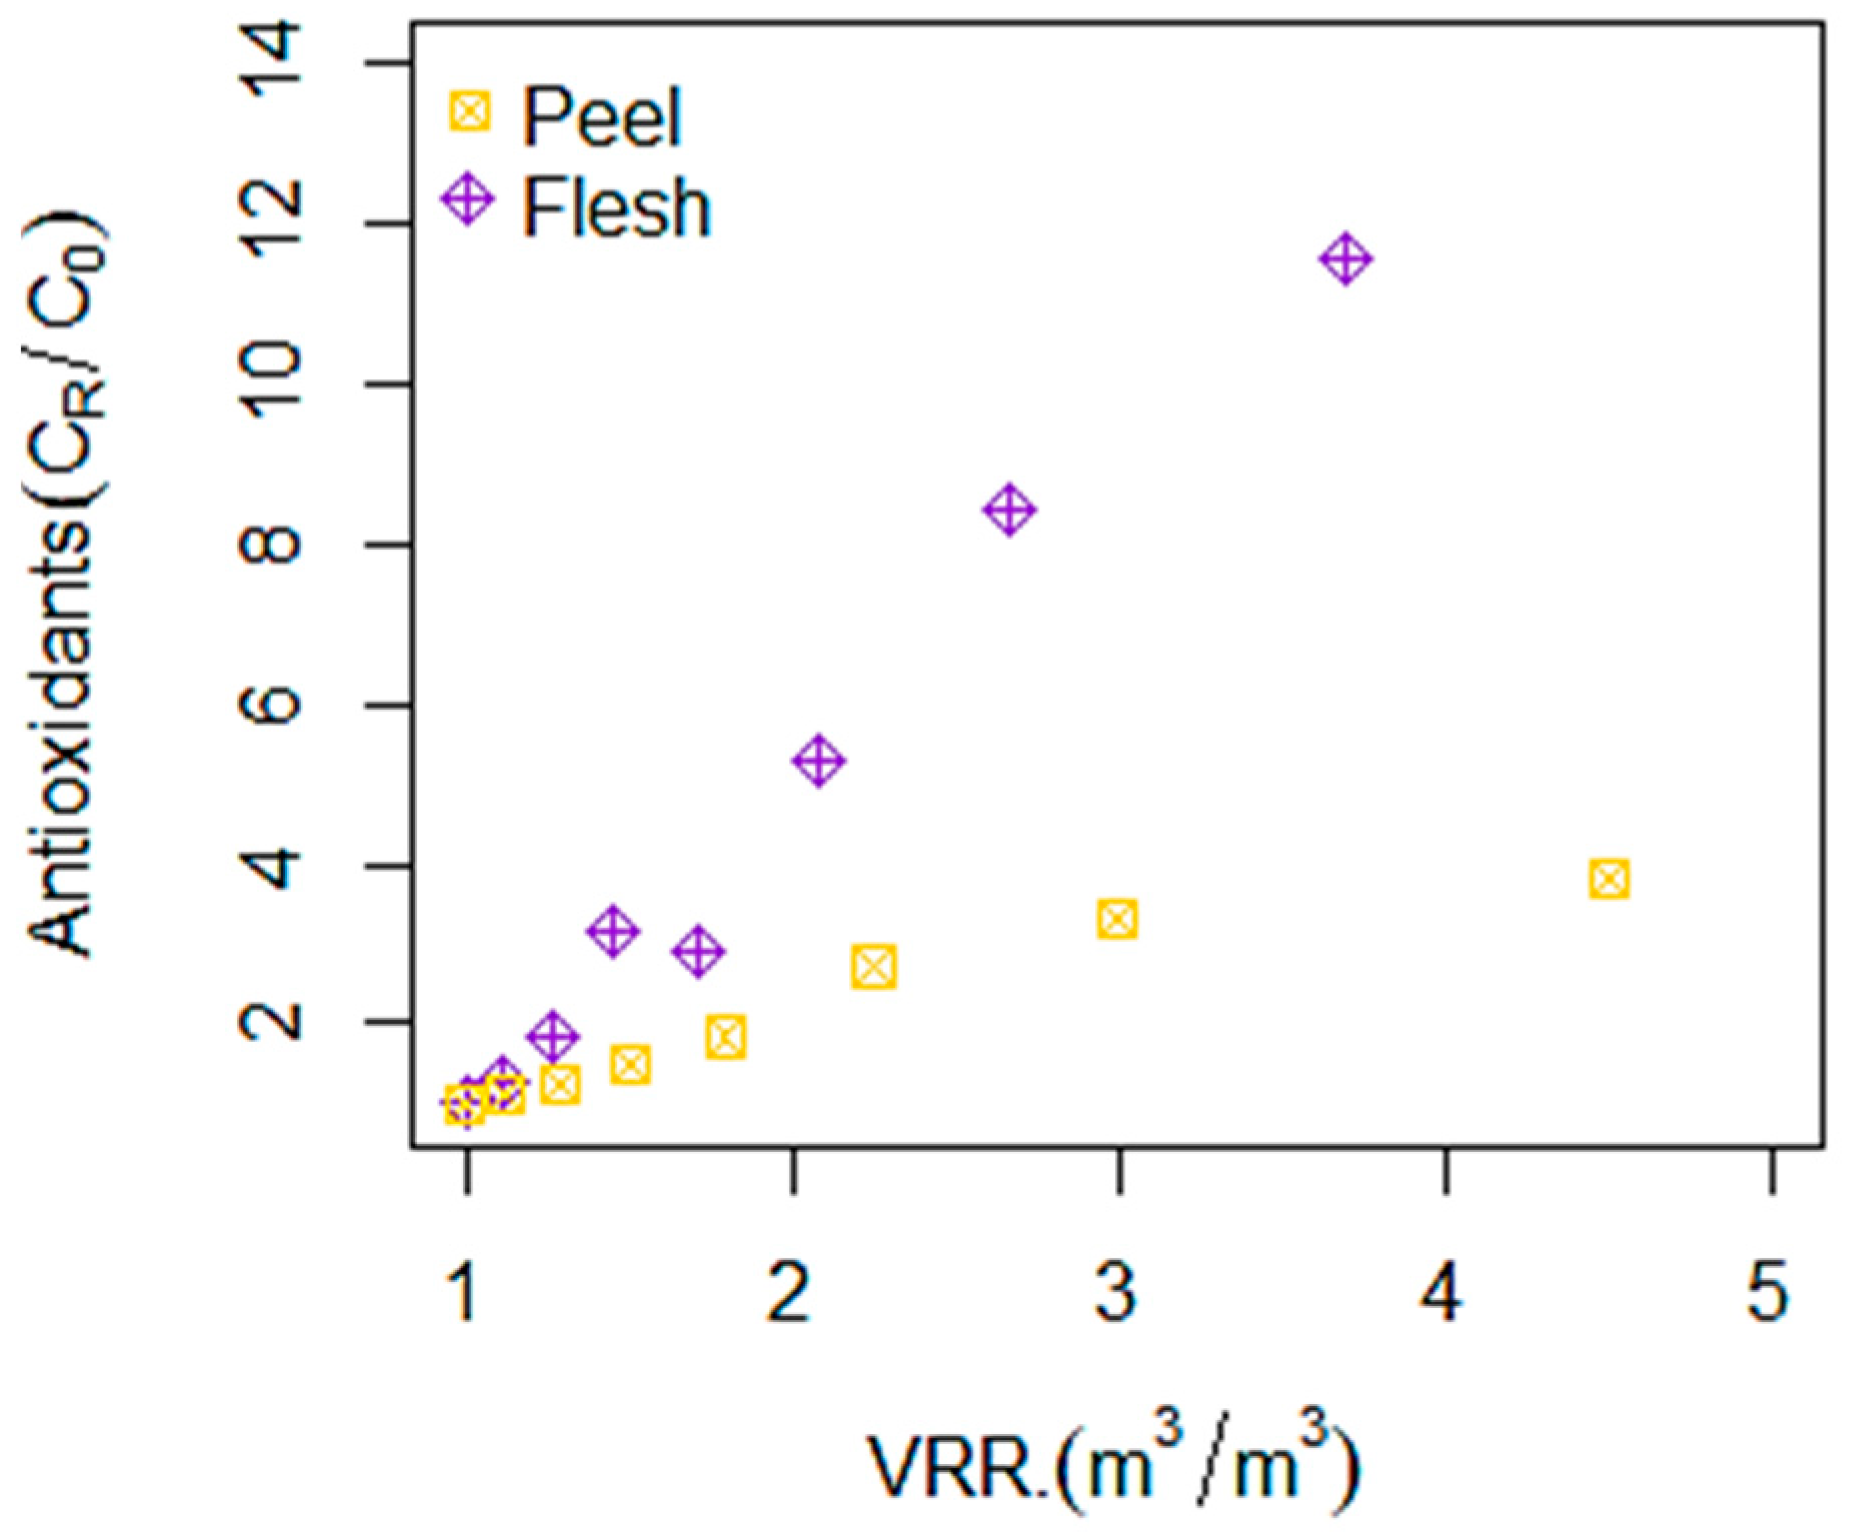
3.1. Betalains, TPC, and Antioxidant Compounds Recovery by RO Membrane (X20)

Spectrophotometric analysis was conducted for the quantification of TBC, TPC, and antioxidant compounds in aqueous extract, membrane permeate, and retentate. Retention percentages of mentioned biomolecules were calculated from the concentration data. As betalains, TPC, and antioxidant compounds were not determined in the permeates, it can be concluded that mentioned biomolecules were rejected by the RO membrane at more than 99%.
The determined amounts of BC, BX, and TBC in each sample are shown in Table 1. The BC contents in membrane feeds for beetroot peel and flesh were 4.06 ± 0.11 mg·g−1 dm and 1.72 ± 0.03 mg·g−1 dm, respectively. These values in retentate went up constantly with progresses of VRR. They reached 15 ± 0.17 mg·g−1 dm and 8.98 ± 0.11 mg·g−1 dm in final retentates of beetroot peel and flesh extracts, respectively. The amount of BX in beetroot peel extract was 3.02 ± 0.15 mg·g−1 dm, and it became 15.06 ± 0.13 mg·g−1 dm at the end of filtration. In the flesh extract, the amount of BX was 0.89 ± 0.03 mg·g−1 dm, and it went up to 5.39 ± 0.04 mg·g−1 dm at the end of the filtration process. The amount of TBC in extract of beetroot peel was 7.22 ± 0.06 mg·g−1 dm, which was three times greater than the flesh extract (2.6 ± 0.05 mg·g−1 dm). Likewise, the TBC in peel extract was increased more than four times after membrane filtration, whereas it was increased more than five times for flesh extract. Betalain contents in each sample were varied during membrane filtrations. In Figure 1, betalain content is presented with the function of VRR. Concentration ratio (CR) of TBC in final retentates of beetroot peel was 4.16. These values were 3.69 and 4.99 for BC and BX, respectively. The beetroot flesh filtrates exhibited CR of 5.22 for BC, 6.04 for BX, and 5.52 for TBC.
TPC in peel–water extract (3.91 ± 0.74 mg GAE·g−1 dm) was increased to 34.47 ± 0.19 GAE·g−1 dm after membrane filtration. Similar to before, TPC in flesh–water extract (1.35 ± 0.0 mg GAE·g−1 dm) went up to 12.74 ± 0.42 GAE·g−1 dm (Table 1). The CR of TPC for each extract is presented in Figure 2. It is shown that the CR of beetroot flesh (8.8) outweighed the CR of beetroot peel (9.4) at the end of filtration.
AA in beetroot peel and flesh extracts were recorded as 6.5 ± 0.09 mg ASE·g−1 dm and 1.00 ± 0.04 mg ASE·g−1 dm, respectively (Table 1). It went up to 24.65 ± 1.42 mg ASE·g−1 dm for peel extract, and 11.6 ± 0.1 mg ASE·g−1 dm for flesh extract at the end of membrane filtration. Antioxidant component in each sample along with VRR is presented in Figure 3. It is noted that the CR of antioxidant content for both peel and flesh extracts are increased drastically with increase of VRR. CR for antioxidant for beetroot peel and flesh were 3.8 and 11.6, respectively, at the end of filtration.
Flux behaviors for filtration of beetroot peel and flesh extracts by RO membrane with different VRRs are shown in Figure 4. In both cases, permeate flux was reduced with the increase of VRR. Reduction of permeate flux was more for flesh extract compared to peel extract. VRR reached 1.5, 2, 2.5, and 3 at 7.4, 11.6, 14.3, and 15.8 min of filtration time, respectively, in the case of flesh extract. On the other hand, VRR reached 1.5, 2, 2.5, and 3 at 6.5, 9.7, 11.9, and 13.4 min of filtration time, respectively, in the case of peel extract.
From pure water flux measurements, after the concentration process of beetroot peel and flesh extracts, fouling resistances of membranes were calculated. Those are depicted in Figure 5. No significant difference in fouling resistance is observed between peel and flesh concentrations.

3.2. Color Retention and Tonality Measurement

Color variations of beetroot flesh and peel extracts before and after the RO filtration process are presented in Figure 6A,B, respectively. In those images, it is noted that intensity of red color is more in the final (membrane retentate) compared to the initial (extract). No color compounds have been noted in permeates of membrane for both peel and flesh extracts.
The resulting differences in color patterns of the respective samples are listed in Table 2. In flesh extract, all examined values of L*, a*, b*, Δ E ab * , Hue°, and BI were decreased after the concentration process, except C ab * value. Likewise, the final peel concentrates typified lower values of a*, Hue°, Δ E ab * , and BI, whereas L*, b*, and C ab * values were found to be exceeded compared to the crude extract.
Table 3 represents the characteristics of the flesh and peel extracts before and after the filtration. Moisture percentage, dry matter, yield percentage, density, and TSS for flesh and peel extracts were taken into consideration. Significant improvements in dry matter content were observed in the final retentates of beetroot flesh (6 times) and peel (16 times) along with yield percentage after membrane concentration. The densities of the extracts did not change decisively, albeit TSS of crude beetroot flesh extract was improved from 0.02 to 4.1%, while TSS of peel extract went up to nearly 3% more than the initial feed (0.1%).

3.3. Thermo-Instability of Betalains (Color Compounds)

Variations of betalains in the feeds and final concentrates with heating time (0–90 min) at 70 °C are shown in Table 4. In the retentate of peel extract, the amounts of BC, BX, and TBC were reduced a bit more than in feed after 90 min of heating. In contrast, improvements in the recovery of BC, BX, and TBC were experienced in the retentate of flesh compared to the feed.
Table 5 reveals the color diversity of beetroot flesh and peel extracts before and after heat treatment at 70 °C for 90 min. It is shown in Table 5 that the membrane filtration has some influence on the tonality of the extracts, and the variations depend upon the type of extract, whether it is peel or flesh.
Values of t1/2 and k of the betalains in feed and concentrates of peel and flesh extracts are listed in Table 6. In general, the peel extract revealed a greater t1/2 value than the flesh extract both before and after filtration. The improvements in thermal stability after the membrane filtration are proven by the increased t1/2 values. There are not many such differences for the values of k among the extracts of feed or retentate.
CRs of betalains in the beetroot flesh and peel extracts are presented in Figure 7a,b, respectively. In the case of flesh extract, the drastic changes in CR of betalains appeared between the heating times of 30 min and 45 min. The CR of betalains in beetroot peel extract dropped significantly after 30 min of heating time.

4. Discussion

In the case of membrane filtration, CRs of betalains in final retentates of beetroot peel were 3.69 for BC, 4.99 for BX, and 4.16 for TBC, whereas beetroot flesh filtrates exhibited CRs of 5.22 for BC, 6.04 for BX, and 5.52 for TBC. The superiority of CR for flesh concentrate, compared to peel, can be explained by the variation of dry matter, vitamin, mineral, and other biomolecules in different parts of beetroot [25]. Additionally, the superior amount of TPC was in concentration of peel extract, compared to concentration of flesh extract. Amounts of betalains, phenolics, and antioxidants depend upon the variety of beetroot and their sources [26]. The CR of phenolics in beetroot flesh retentate outweighed the CR of beetroot peel filtrates (from 8.8 to 9.4) at the end of the filtration. The nature of beetroot, as earlier discussed, might have influenced the efficiency of the membrane performance, leading to the differences in VRR and CR. In terms of CR for antioxidants, beetroot peel extract exhibited 3.8, which is significantly lower than the CR for beetroot flesh concentrates (CR 11.6). The detected huge amounts of antioxidants in the final concentrates of flesh–water extracts imply the presence of antioxidant-rich water-soluble compounds, which are accumulated in the cytoplasm [27].
With increase of VRR, the concentrations of TBC, TPC, and AA were increased. The flux behavior of peel extract showed regular reduction with increasing VRR. The accumulation of the compounds on the membrane surface led to the flux declination due to membrane fouling and concentration polarization [28]. Being regarded as non-porous, formation of cake layer on RO membrane surface was more rapid [29]. The accumulation of foulants, cake formation, and pore plugging on/in the membrane layers might be responsible for the resistance to permeation [30]. In membrane filtration, fouling starts with the interaction between the solute and the membrane material by developing the chemical bonds and the van der Waals forces [31]. The extent of adsorption is determined by several factors, such as the membrane material, type, concentration of solutes, ionic strength, and pH of feed solution [32]. The filtration processes of beetroot peel and flesh extracts by RO membrane succeeded in retaining the mentioned compounds at ⁓99% in the concentrates. Likewise, approximately 98% of betalains were retained by loose RO membrane [33]. TSS of crude beetroot flesh extract was improved from 0.02 to 4%, while TSS of peel extract went up to nearly 3% more than the initial feed (0.1%). According to Rodriguesa and coworkers [34], the concentrations of phenolics, anthocyanins, vitamin C, and cyanidin-3-glucoside were increased by 3.2, 6.5, 7, and 4.5 times, respectively, by R25A polyamide RO membrane. Furthermore, the membrane filtration has some influence on the tonality of extracts, and the variations depend upon type of extract, whether it is peel or flesh.
After the membrane filtration, the improvements in t1/2 values were observed with higher retention values in peel extracts. In the peel extracts, CR of betalains went down significantly after 15 min of heating time, whereas the CR of respective betalains in the beetroot’s flesh extracts dramatically reduced within 30 to 45 min of heating. Bengardino and coworkers [35] claimed that the degradation of betalains from beet leaves after heat in touch was 60 min. Furthermore, it has been reported that thermal treatment at 45 °C for 6 days affects the stability of betalains in the blanching wastewater of beetroot processing [36].

5. Conclusions

The objective of the investigation was to concentrate the TBC, TPC, and antioxidant compounds from extracts of peel and flesh of beetroot by RO membrane. The solid–liquid extractions were carried out from beetroot peel and flesh. CRs of TBC in final retentates of beetroot peel were 3.69 for BC, 4.99 for BX, and 4.16 for TBC, whereas beetroot flesh filtrates exhibited CRs of 5.22 for BC, 6.04 for BX, and 5.52 for TBC. CRs of TPC in beetroot flesh and peel retentates outweighed the CR of peel filtrates, which are 8.8 and 9.4, respectively. However, while CRs of AA in beetroot peel and flesh concentrate have significant differences (CR for beetroot peel concentrate: 3.8 and CR for beetroot peel concentrate: 11.6), there are no significant differences for CRs of TPC and TBC in beetroot flesh concentrate and beetroot peel concentrate. The RO filtration improved the t1/2 values of the specific betalains as well as the color tonality, to some point. It may be expected that natural color, phenolics, and antioxidant compounds from beetroot shall be useful in the food and biopharmaceutical industries. The present research was performed with a laboratory-scale setup. Following our experimental results, the conclusion appears to be that membrane technology can be applied effectively for the concentration or separation of valuable compounds from vegetable wastes.

Author Contributions

Conceptualization, M.M.Z.; methodology, M.M.Z. and S.B.; software, M.M.Z.; validation, M.M.Z., A.N., A.A., A.C. and S.B.; formal analysis, M.M.Z. and A.N.; investigation, M.M.Z.; resources, M.M.Z. and A.A.; data curation, A.N. and S.B.; writing—original draft preparation, M.M.Z. and A.A.; writing—review and editing, M.M.Z. and A.N.; visualization, M.M.Z.; supervision, S.B.; project administration, A.N. and S.B.; funding acquisition, A.N. and S.B. All authors have read and agreed to the published version of the manuscript.

Funding

This research was funded by the European Union and the European Social Fund (grant agreement no. EFOP-3.6.3-VEKOP-16-2017-00005).

Institutional Review Board Statement

Not applicable.

Informed Consent Statement

Not applicable.

Data Availability Statement

Not applicable.

Acknowledgments

M.M.Z. and A.A. acknowledge the Tempus Public Foundation for the Stipendium Hungaricum Scholarship Program. A.N. acknowledges the Hungarian State Postdoctoral Scholarship.

Conflicts of Interest

The authors declare no conflict of interest.

References

  1. Malaeb, L.; George, M.; Ayoub, G.M. Reverse osmosis technology for water treatment: State of the art review. Desalination 2011, 267, 1–8. [Google Scholar] [CrossRef]
  2. Gabelich, C.; Ishida, K.; Bold, R. Testing of water treatment copolymers for compatibility with polyamide reverse osmosis membranes. Environ. Prog. 2005, 24, 410–416. [Google Scholar] [CrossRef]
  3. Alsobh, A.; Zin, M.M.; Vatai, G.; Bánvölgyi, S. The application of membrane technology in the concentration and purification of plant extracts: A review. Period. Polytech. Chem. Eng. 2022, 66, 394–408. [Google Scholar] [CrossRef]
  4. Wenten, I.G.; Khoiruddin. Reverse osmosis applications: Prospect and challenges. Desalination 2016, 391, 112–125. [Google Scholar] [CrossRef]
  5. Qasim, M.; Badrelzaman, M.; Darwish, N.N.; Darwish, N.A.; Hilal, N. Reverse osmosis desalination: A state-of-the-art review. Desalination 2019, 459, 59–104. [Google Scholar] [CrossRef] [Green Version]
  6. Garud, R.M.; Kore, S.V.; Kore, V.S.; Kulkarni, G.S.A. Short Review on Process and Applications of Reverse Osmosis. Univers. J. Environ. Res. Technol. 2011, 1, 233–238. [Google Scholar]
  7. Deshwal, G.K.; Akshit; Kadyan, S.; Sharma, H.; Singh, A.K.; Panjagari, N.R.; Meena, G.S. Applications of reverse osmosis in dairy processing: An Indian perspective. J. Food Sci. Technol. 2021, 58, 3676–3688. [Google Scholar] [CrossRef]
  8. El-Gazzar, F.E.; Marth, E.H. Ultrafiltration and Reverse Osmosis in Dairy Technology: A Review. J. Food Prot. 1991, 54, 801–809. [Google Scholar] [CrossRef]
  9. Matta, V.M.; Moretti, R.H.; Cabral, L.M.C. Microfiltration and reverse osmosis for clarification and concentration of acerola juice. J. Food Eng. 2004, 61, 477–482. [Google Scholar] [CrossRef]
  10. Echavarría, A.P.; Falguera, V.; Torras, C.; Berdún, C.; Pagán, J.; Ibarz, A. Ultrafiltration and reverse osmosis for clarification and concentration of fruit juices at pilot plant scale. LWT-Food Sci. Technol. 2012, 46, 189–195. [Google Scholar] [CrossRef]
  11. Massota, A.; Mietton-Peuchota, M.; Peuchotb, C.; Milisica, V. Nanofiltration and reverse osmosis in winemaking. Desalination 2008, 231, 283–289. [Google Scholar] [CrossRef]
  12. Wruss, J.; Waldenberger, G.; Huemer, S.; Uygun, P.; Lanzerstorfer, P.; Müller, U.; Höglinger, O.; Weghuber, J. Compositional characteristics of commercial beetroot products and beetroot juice prepared from seven beetroot varieties grown in Upper Austria. J. Food Compos. Anal. 2015, 42, 46–55. [Google Scholar] [CrossRef] [Green Version]
  13. Mirmiran, P.; Houshialsadat, Z.; Gaeini, Z.; Bahadoran, Z.; Azizi, F. Functional properties of beetroot (Beta vulgaris) in management of cardio-metabolic diseases. Nutr. Metab. 2020, 17, 3. [Google Scholar] [CrossRef] [PubMed] [Green Version]
  14. Zin, M.M.; Anucha, C.B.; Bánvölgyi, S. Recovery of phytochemicals via electromagnetic irradiation (Microwave-Assisted-Extraction): Betalain and phenolic compounds in perspective. Foods 2020, 9, 918. [Google Scholar] [CrossRef]
  15. Dhiman, A.; Suhag, R.; Chauhan, D.S.; Thakur, D.; Chhikara, S.; Prabhakar, P.K. Status of beetroot processing and processed products: Thermal and emerging technologies intervention. Trends Food Sci. Technol. 2021, 114, 443–458. [Google Scholar] [CrossRef]
  16. Shuaibu, B.S.; Aremu, M.O.; Kalifa, U.J. Chemical composition and antioxidant activities of beetroot peel. Afr. J. Eng. Environ. Res. 2021, 2, 62–73. [Google Scholar]
  17. Zin, M.M.; Márki, E.; Bánvölgyi, S. Evaluation of reverse osmosis membranes in concentration of beetroot peel extract. Period. Polytech. Chem. Eng. 2020, 64, 340–348. [Google Scholar] [CrossRef]
  18. Zin, M.M.; Bánvölgyi, S. Portfolio of Beetroot (Beta vulgaris L.) Peel Extracts concentrated by nanofiltration membrane. Int. J. Food Stud. 2021, 10, 334–345. [Google Scholar] [CrossRef]
  19. Fu, Y.; Shi, J.; Xie, S.Y.; Zhang, T.Y.; Soladoey, O.P.; Aluko, R.E. Red Beetroot Betalains: Perspectives on Extraction, Processing, and Potential Health Benefits. J. Agric. Food Chem. 2020, 68, 11595–11611. [Google Scholar] [CrossRef]
  20. Gokhale, S.V.; Lele, S.S. Dehydration of red beet root (Beta vulgaris) by hot air drying: Process optimization and mathematical modeling. Food Sci. Biotechnol. 2011, 20, 955–964. [Google Scholar] [CrossRef]
  21. Antigo, J.L.D.; Bergamasco, R.D.C.; Madrona, G.S. Effect of pH on the stability of red beet extract (Beta vulgaris L.) microcapsules produced by spray drying or freeze drying. Trends Food Sci. Technol. 2018, 38, 72–77. [Google Scholar] [CrossRef] [Green Version]
  22. Ding, P.; Ling, Y.S. Browning assessment methods and polyphenol oxidase in UV-C irradiated Berangan banana fruit. Int. Food Res. J. 2014, 21, 1667–1674. [Google Scholar]
  23. Singleton, V.L.; Rossi, J.A. Colorimetry of total phenolics with phosphomolybdic-phosphotungstic acid reagent. Am. J. Enol. Vitic. 1965, 16, 144–158. [Google Scholar]
  24. Benzie, I.F.F.; Devaki, M. The ferric reducing/antioxidant power (FRAP) assay for non-enzymatic antioxidant capacity: Concepts, procedures, limitations and applications. In Measurement of Antioxidant Activity & Capacity: Recent Trends and Applications, 1st ed.; Apak, R., Capanoglu, E., Shahidi, F., Eds.; Wiley & Sons Ltd.: New York, NY, USA, 2017; pp. 77–106. [Google Scholar] [CrossRef]
  25. Hájos, T.M.; Rubóczki, T. Evaluation of mineral element content of beetroot during the different stages of the growing season. Acta Agrar. Debr. 2018, 150, 459–469. [Google Scholar] [CrossRef]
  26. Hussain, E.A.; Sadiq, Z.; Zia-Ul-Haq, M. Sources of Betalains. In Betalains: Biomolecular Aspects, 1st ed.; Hussain, E.A., Sadiq, Z., Zia-Ul-Haq, M., Eds.; Springer: Cham, Switzerland, 2018; pp. 15–32. [Google Scholar] [CrossRef]
  27. Moussa, Z.; Judeh, Z.M.A.; Ahmed, S.A. Nonenzymatic Exogenous and Endogenous Antioxidants. In Free Radical Medicine and Biology, 1st ed.; InTech: Rijeca, Croatia, 2019. [Google Scholar] [CrossRef] [Green Version]
  28. Couto, D.S.; Corrêa Cabral, L.M.; da Matta, V.M.; Deliza, R.; de Grandi Castro Freitas, D. Concentration of pineapple juice by reverse osmosis: Physicochemical characteristics and consumer acceptance. Food Sci. Technol. 2011, 31, 905–910. [Google Scholar] [CrossRef] [Green Version]
  29. Zhu, X.; Elimelech, M. Colloidal Fouling of Reverse Osmosis Membranes: Measurements and Fouling Mechanisms. Environ. Sci. Technol. 1997, 31, 3654–3662. [Google Scholar] [CrossRef]
  30. Miller, D.J.; Kasemset, S.; Paul, D.R.; Freeman, B.D. Comparison of membrane fouling at constant flux and constant transmembrane pressure conditions. J. Membr. Sci. 2014, 454, 505–515. [Google Scholar] [CrossRef]
  31. Hafidi, A.; Pioch, D.; Ajana, H. Adsorptive fouling of inorganic membranes during microfiltration of vegetable oils. Eur. J. Lipid Sci. Technol. 2003, 105, 138–148. [Google Scholar] [CrossRef]
  32. Mulder, M.H.V. Membrane preparation: Phase Inversion Membranes. In Encyclopedia of Separation Science, 1st ed.; Academic Press: Cambridge, MA, USA, 2000; pp. 3331–3346. [Google Scholar] [CrossRef]
  33. Mereddy, R.; Chan, A.; Fanning, K.; Nirmal, N.; Sultanbawa, Y. Betalain rich functional extract with reduced salts and nitrate content from red beetroot (Beta vulgaris L.) using membrane separation technology. Food Chem. 2017, 215, 311–317. [Google Scholar] [CrossRef] [Green Version]
  34. Rodriguesa, L.M.; Romanini, E.B.; Silva, E.; Pilau, E.J.; Costa, S.C.; Madrona, G.S. Camu-camu bioactive compounds extraction by ecofriendly sequential processes (ultrasound assisted extraction and reverse osmosis). Ultrason. Sonochem. 2020, 64, 105017. [Google Scholar] [CrossRef]
  35. Bengardino, M.B.; Fernandez, M.V.; Nutter, J.; Jagus, R.J.; Agüero, M.V. Recovery of bioactive compounds from beet leavesthrough simultaneous extraction: Modelling andprocess optimization. Food Bioprod. Process. 2019, 118, 227–236. [Google Scholar] [CrossRef]
  36. Otálora, C.M.; Bonifazi, E.L.; Fissore, E.N.; Basanta, M.F.; Gerschenson, L.N. Thermal Stability of Betalains in By-Products of the Blanching and Cutting of Beta vulgaris L. Var conditiva. Pol. J. Food Nutr. Sci. 2020, 70, 15–24. [Google Scholar] [CrossRef]
Figure 1. Variation of betalains during the concentration by RO membrane (X20).
Applsci 12 06360 g001
Figure 2. Variation of TPC with VRR during concentration by RO membrane (X20).
Applsci 12 06360 g002
Figure 3. Variation of antioxidant capacity with VRR during concentration by RO membrane (X20).
Applsci 12 06360 g003
Figure 4. Permeate flux with VRR during the concentration process by RO membrane (X20).
Applsci 12 06360 g004
Figure 5. Membrane resistance (RM) and fouling resistance (RF) of RO membrane (X20).
Applsci 12 06360 g005
Figure 6. Crude extracts, retentates, and permeates of beetroot flesh (A) and peel (B).
Applsci 12 06360 g006
Figure 7. Concentration ratios of betalains in concentrations of beetroot flesh (a) and peel (b) at different heating times.
Applsci 12 06360 g007
Table 1. Betalains, TPC, and antioxidant contents in initial and retentate beetroot peel and flesh extracts.
MaterialsConcentratesBC
(mg·g−1 dm)
BX
(mg·g−1 dm)
TBC
(mg·g−1 dm)
TPC
(mg GAE·g−1 dm)
AA
(mg ASE·g−1 dm)
PeelInitial4.06 ± 0.113.02 ± 0.157.22 ± 0.063.91 ± 0.746.5 ± 0.09
500 mL4.45 ± 0.062.94 ± 0.047.37 ± 0.15.2 ± 0.067.2 ± 0.05
1000 mL4.66 ± 0.132.97 ± 0.17.61 ± 0.225.63 ± 0.468.11 ± 0.19
1500 mL5.78 ± 0.344.09 ± 0.219.86 ± 0.557.86 ± 0.419.68 ± 0.24
2000 mL6.94 ± 0.15.04 ± 0.1811.96 ± 0.2712.26 ± 0.5311.97 ± 0.28
2500 mL10.15 ± 0.147.84 ± 0.1117.97 ± 0.2420.17 ± 1.017.7 ± 0.05
3000 mL12.61 ± 0.249.61 ± 0.2822.2 ± 0.4223.19 ± 1.6521.61 ± 0.33
Final15 ± 0.1715.06 ± 0.1330.02 ± 0.2834.47 ± 0.1924.65 ± 1.42
FleshInitial1.72 ± 0.030.89 ± 0.032.6 ± 0.051.35 ± 0.01.00 ± 0.04
500 mL2.00 ± 0.040.99 ± 0.052.98 ± 0.082.13 ± 0.01.28 ± 0.1
1000 mL2.32 ± 0.011.24 ± 0.043.54 ± 0.053.45 ± 0.451.82 ± 0.11
1500 mL2.74 ± 0.031.46 ± 0.024.18 ± 0.014.38 ± 0.343.16 ± 0.16
2000 mL3.17 ± 0.041.71 ± 0.074.87 ± 0.114.92 ± 0.672.91 ± 0.21
2500 mL3.98 ± 0.132.21 ± 0.096.17 ± 0.215.57 ± 0.175.31 ± 0.08
3000 mL5.75 ± 0.143.22 ± 0.048.94 ± 0.187.7 ± 0.678.44 ± 0.58
Final8.98 ± 0.115.39 ± 0.0414.33 ± 0.1512.74 ± 0.4211.6 ± 0.1
Table 2. Values of L*, a*, b*, C ab * , Hue°, Δ E ab * , and BI of the beetroot flesh and peel extracts before and after the concentration by RO membrane (X20).
MaterialSampleL*a*b*
C a b *
Hue°
Δ E a b *
BI
FleshInitial β11.1 ± 0.6735.23 ± 1.1318.44 ± 1.2327.61 ± 0.8439.77 ± 1.5760.89 ± 0.36165.32 ± 2.69
Final β10 ± 0.2518.91 ± 1.1814.5 ± 0.6737.51 ± 0.4823.83 ± 1.3457.7 ± 0.24119.34 ± 7.96
PeelInitial θ3.53 ± 0.3311.6 ± 0.784.14 ± 0.3319.4 ± 0.1312.04 ± 0.4966.72 ± 0.38163.26 ± 6.41
Final θ4.58 ± 0.219.93 ± 0.164.22 ± 0.0323.04 ± 0.2310.79 ± 0.1665.66 ± 0.18126.77 ± 0.6
The same letters, β and θ, mean no significant differences among the measurements.
Table 3. Characteristics of the beetroot flesh and peel extracts before and after the concentration by RO membrane (X20).
MaterialSampleMoisture (%)Dry Matter (%)Dry Matter (g)Yield (%)Density
(g·cm−2)
TSS (Brix%)
FleshInitial99.60.40.0043.440.99980.02
Final97.752.250.02319.571.00734.1
PeelInitial99.910.090.0010.550.99920.1
Final98.51.50.0159.111.00393
Table 4. Variation of betalains in the feeds and concentrates after heating at 70 °C for 90 min.
MaterialHeating Time (min)BC (mg·g−1 dm)BX (mg·g−1 dm)TBC (mg·g−1 dm)
Peel FeedRetentateFeedRetentateFeedRetentate
04.06 ± 0.1115 ± 0.173.02 ± 0.1515.06 ± 0.137.07 ± 0.2630.02 ± 0.28
153.73 ± 0.1312.87 ± 5.172.75 ± 0.0914.88 ± 2.476.47 ± 0.2129.31 ± 2.34
301.41 ± 0.186.77 ± 0.191.22 ± 0.076.27 ± 0.22.72 ± 0.1313.02 ± 0.39
451.32 ± 0.056.31 ± 0.611.22 ± 0.036.44 ± 0.02.12 ± 0.6612.28 ± 0.0
600.94 ± 0.115.34 ± 0.431.02 ± 0.166.5 ± 0.481.95 ± 0.2711.81 ± 0.91
750.77 ± 0.094.29 ± 0.340.99 ± 0.085.78 ± 0.391.81 ± 0.1110.05 ± 0.72
900.71 ± 0.053.23 ± 0.000.95 ± 0.04.89 ± 0.001.64 ± 0.038.1 ± 0.00
Flesh01.72 ± 0.038.98 ± 0.110.89 ± 0.035.39 ± 0.042.6 ± 0.0514.33 ± 0.15
151.96 ± 0.149.27 ± 1.231.1 ± 0.115.67 ± 0.793.05 ± 0.2414.42 ± 2.04
301.56 ± 0.188.27 ± 0.711.09 ± 0.186.24 ± 0.562.73 ± 0.3214.48 ± 1.28
450.67 ± 0.043.17 ± 0.340.51 ± 0.312.82 ± 0.341 ± 0.385.97 ± 0.68
600.54 ± 0.082.51 ± 0.240.34 ± 0.12.7 ± 0.280.87 ± 0.185.19 ± 0.51
750.43 ± 0.041.88 ± 0.650.27 ± 0.022.64 ± 0.740.67 ± 0.054.5 ± 1.39
900.43 ± 0.021.49 ± 0.000.46 ± 0.072.46 ± 0.000.88 ± 0.13.94 ± 0.00
Table 5. Values of L*, a*, b*, C ab * , Hue°, Δ E ab * , and BI of the beetroot flesh and peel concentrations before and after heat treatment.
MaterialSampleL*a*b*
C a b *
Hue°
Δ E a b *
BI
Fleshbefore heat treatment β27.14 ± 0.3130.91 ± 0.9232.57 ± 1.8746.47 ± 0.8144.91 ± 1.9943.03 ± 0.2182.24 ± 1.84
after heat treatment β17.04 ± 0.8735.11 ± 1.3128.56 ± 1.4439.11 ± 0.4543.8 ± 4.4454.04 ± 0.34128.97 ± 1.74
Peelbefore heat treatment θ4.12 ± 0.0614.11 ± 0.056.74 ± 0.0425.53 ± 0.1415.64 ± 0.0665.28 ± 0.05172.65 ± 1.38
after heat treatment θ4.61 ± 0.449.81 ± 0.196.4 ± 0.2933.09 ± 0.7211.71 ± 0.3264.69 ± 0.33134.46 ± 5.28
The same letters, β and θ, mean no significant differences among the measurements.
Table 6. t1/2, k, and retention of the betalains in beetroot flesh and peel concentrations after heating at 70 °C.
MaterialCompoundInitial FeedFinal Concentrate
Half-Life (t1/2, min)Degradation Constant (k, min−1)Retention (%)Half-Life (t1/2, min)Degradation Constant (k, min−1)Retention (%)
FleshBC35.190.0225.0029.880.0216.62
BX49.510.0152.0661.890.0145.68
TBC39.160.0233.9040.300.0227.48
PeelBC33.160.0217.6041.260.0221.51
BX51.340.0131.4757.760.0132.47
TBC40.070.0223.1447.150.0126.97
Publisher’s Note: MDPI stays neutral with regard to jurisdictional claims in published maps and institutional affiliations.

