
Seismic Response Analysis of Anchor Joint in Shield–Driven Tunnel Considering Soil–Structure Interaction


Abstract
1. Introduction
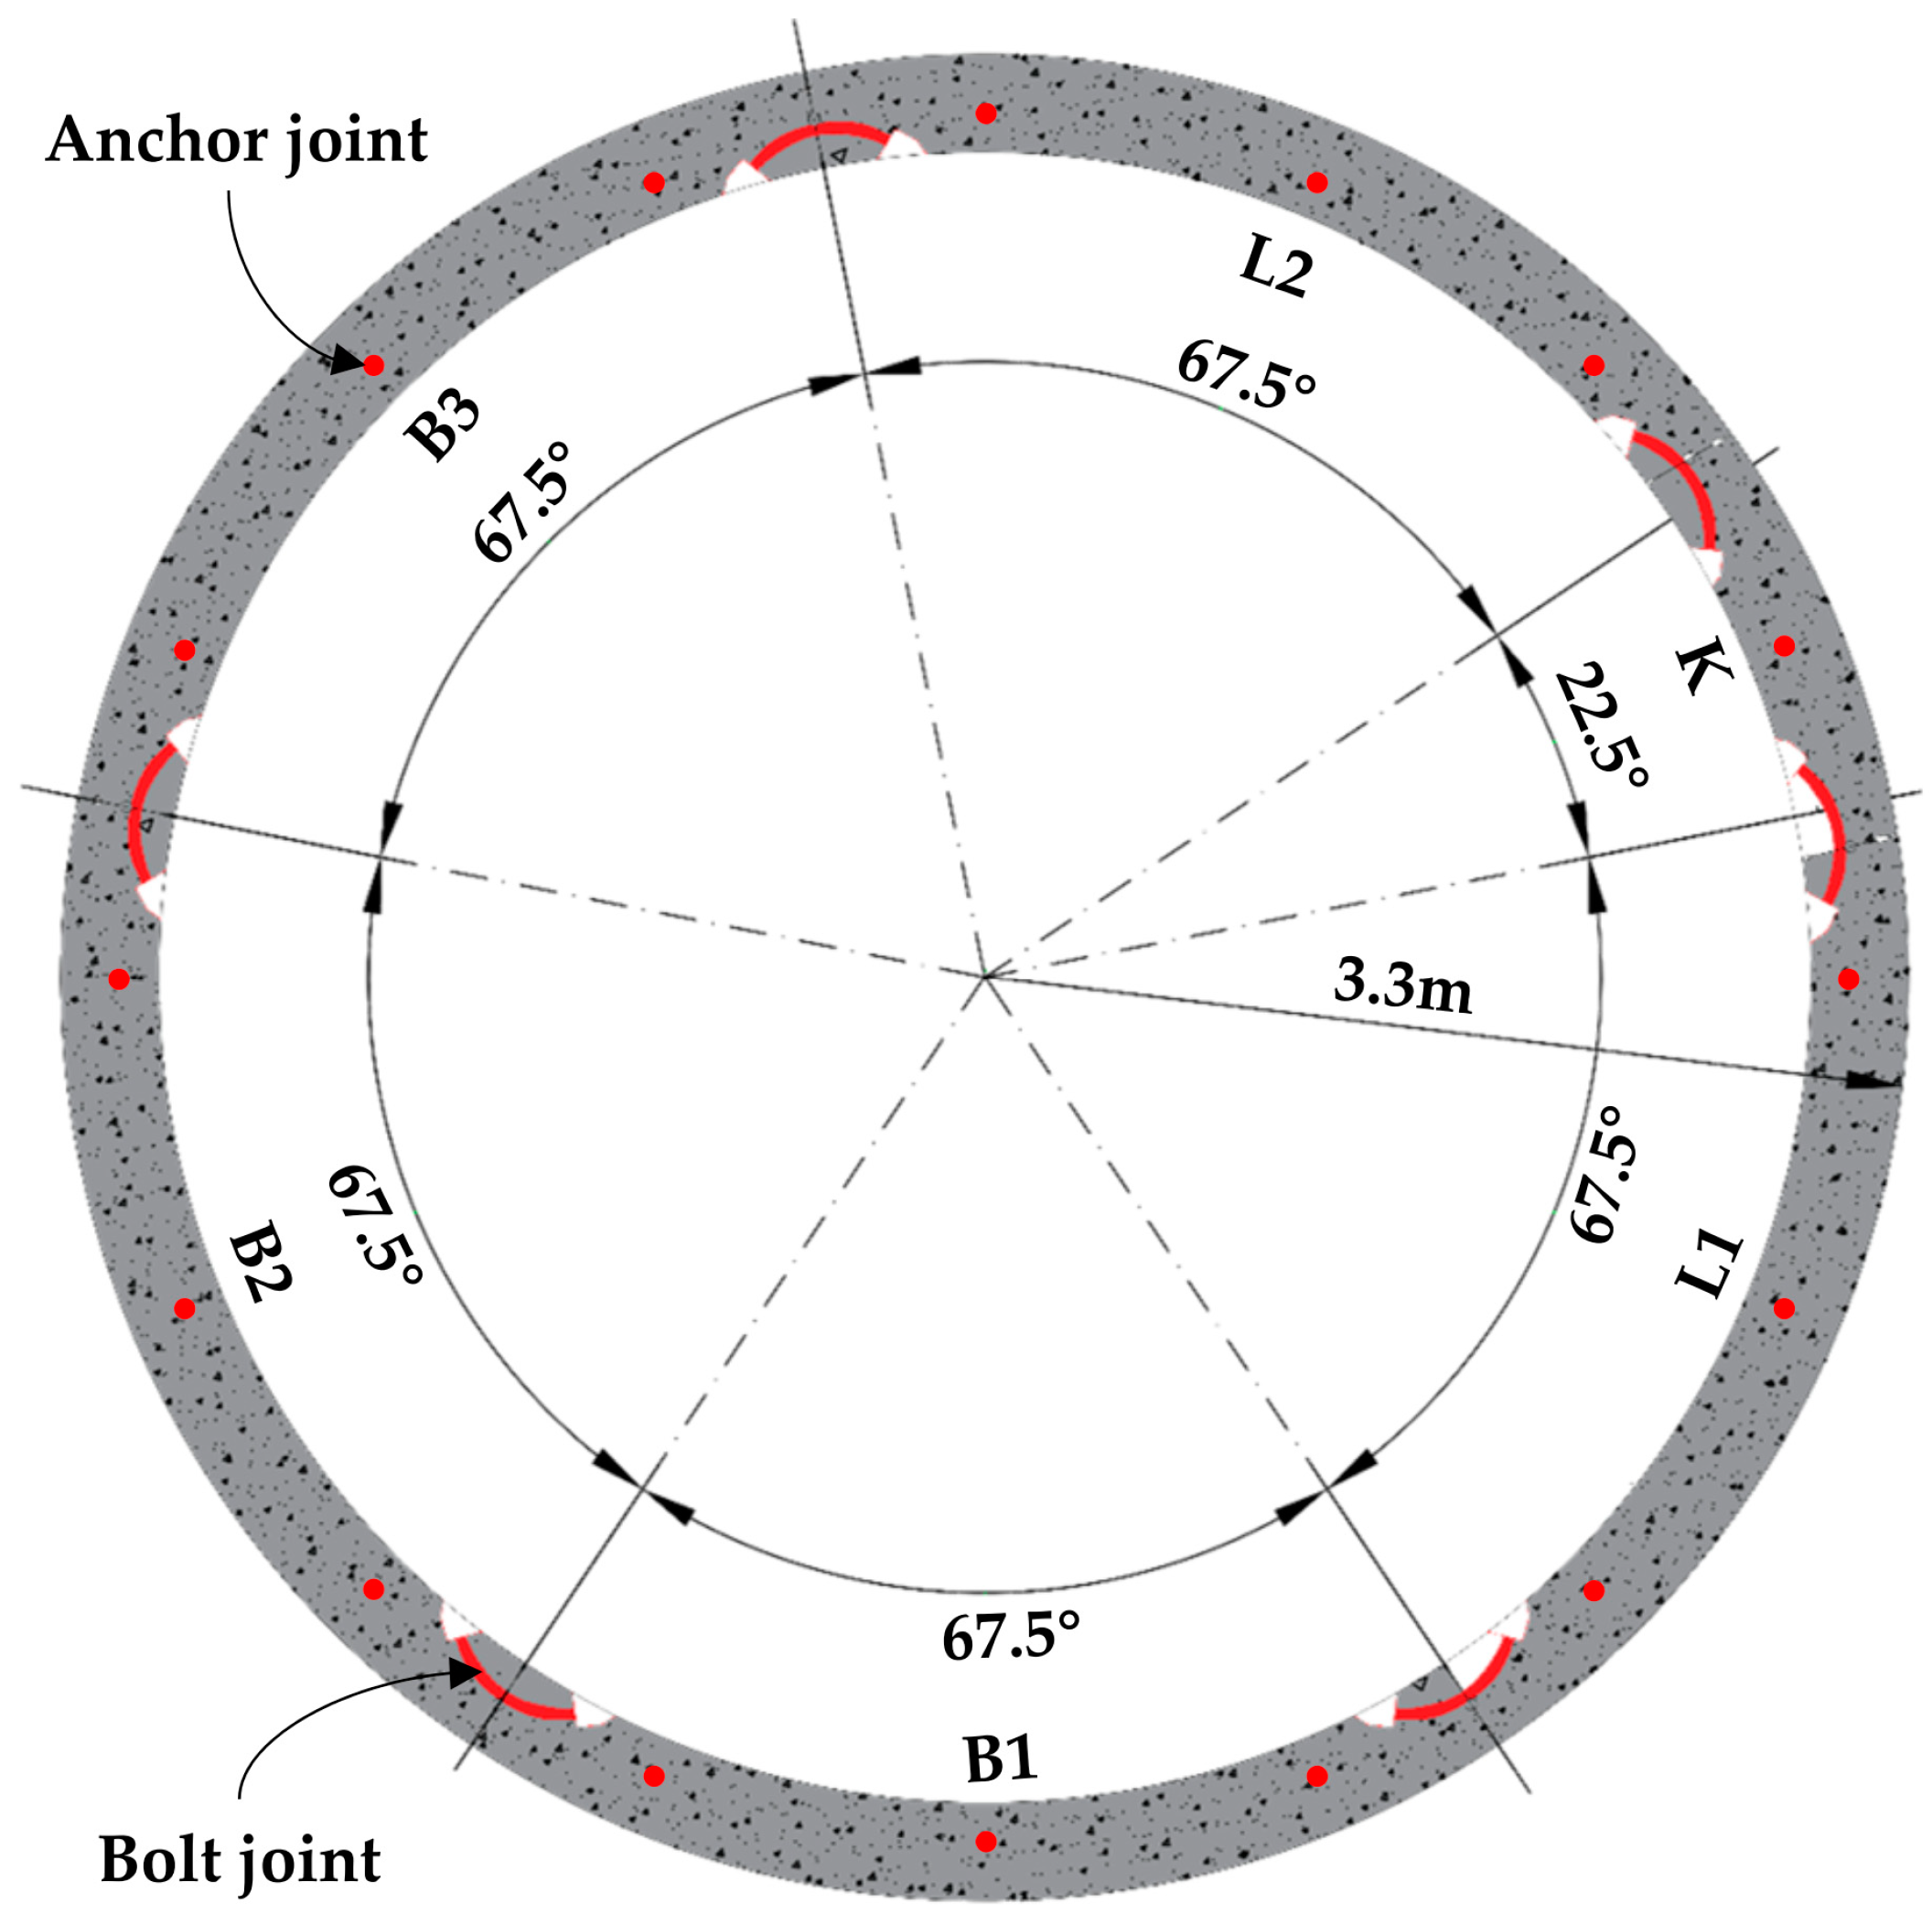
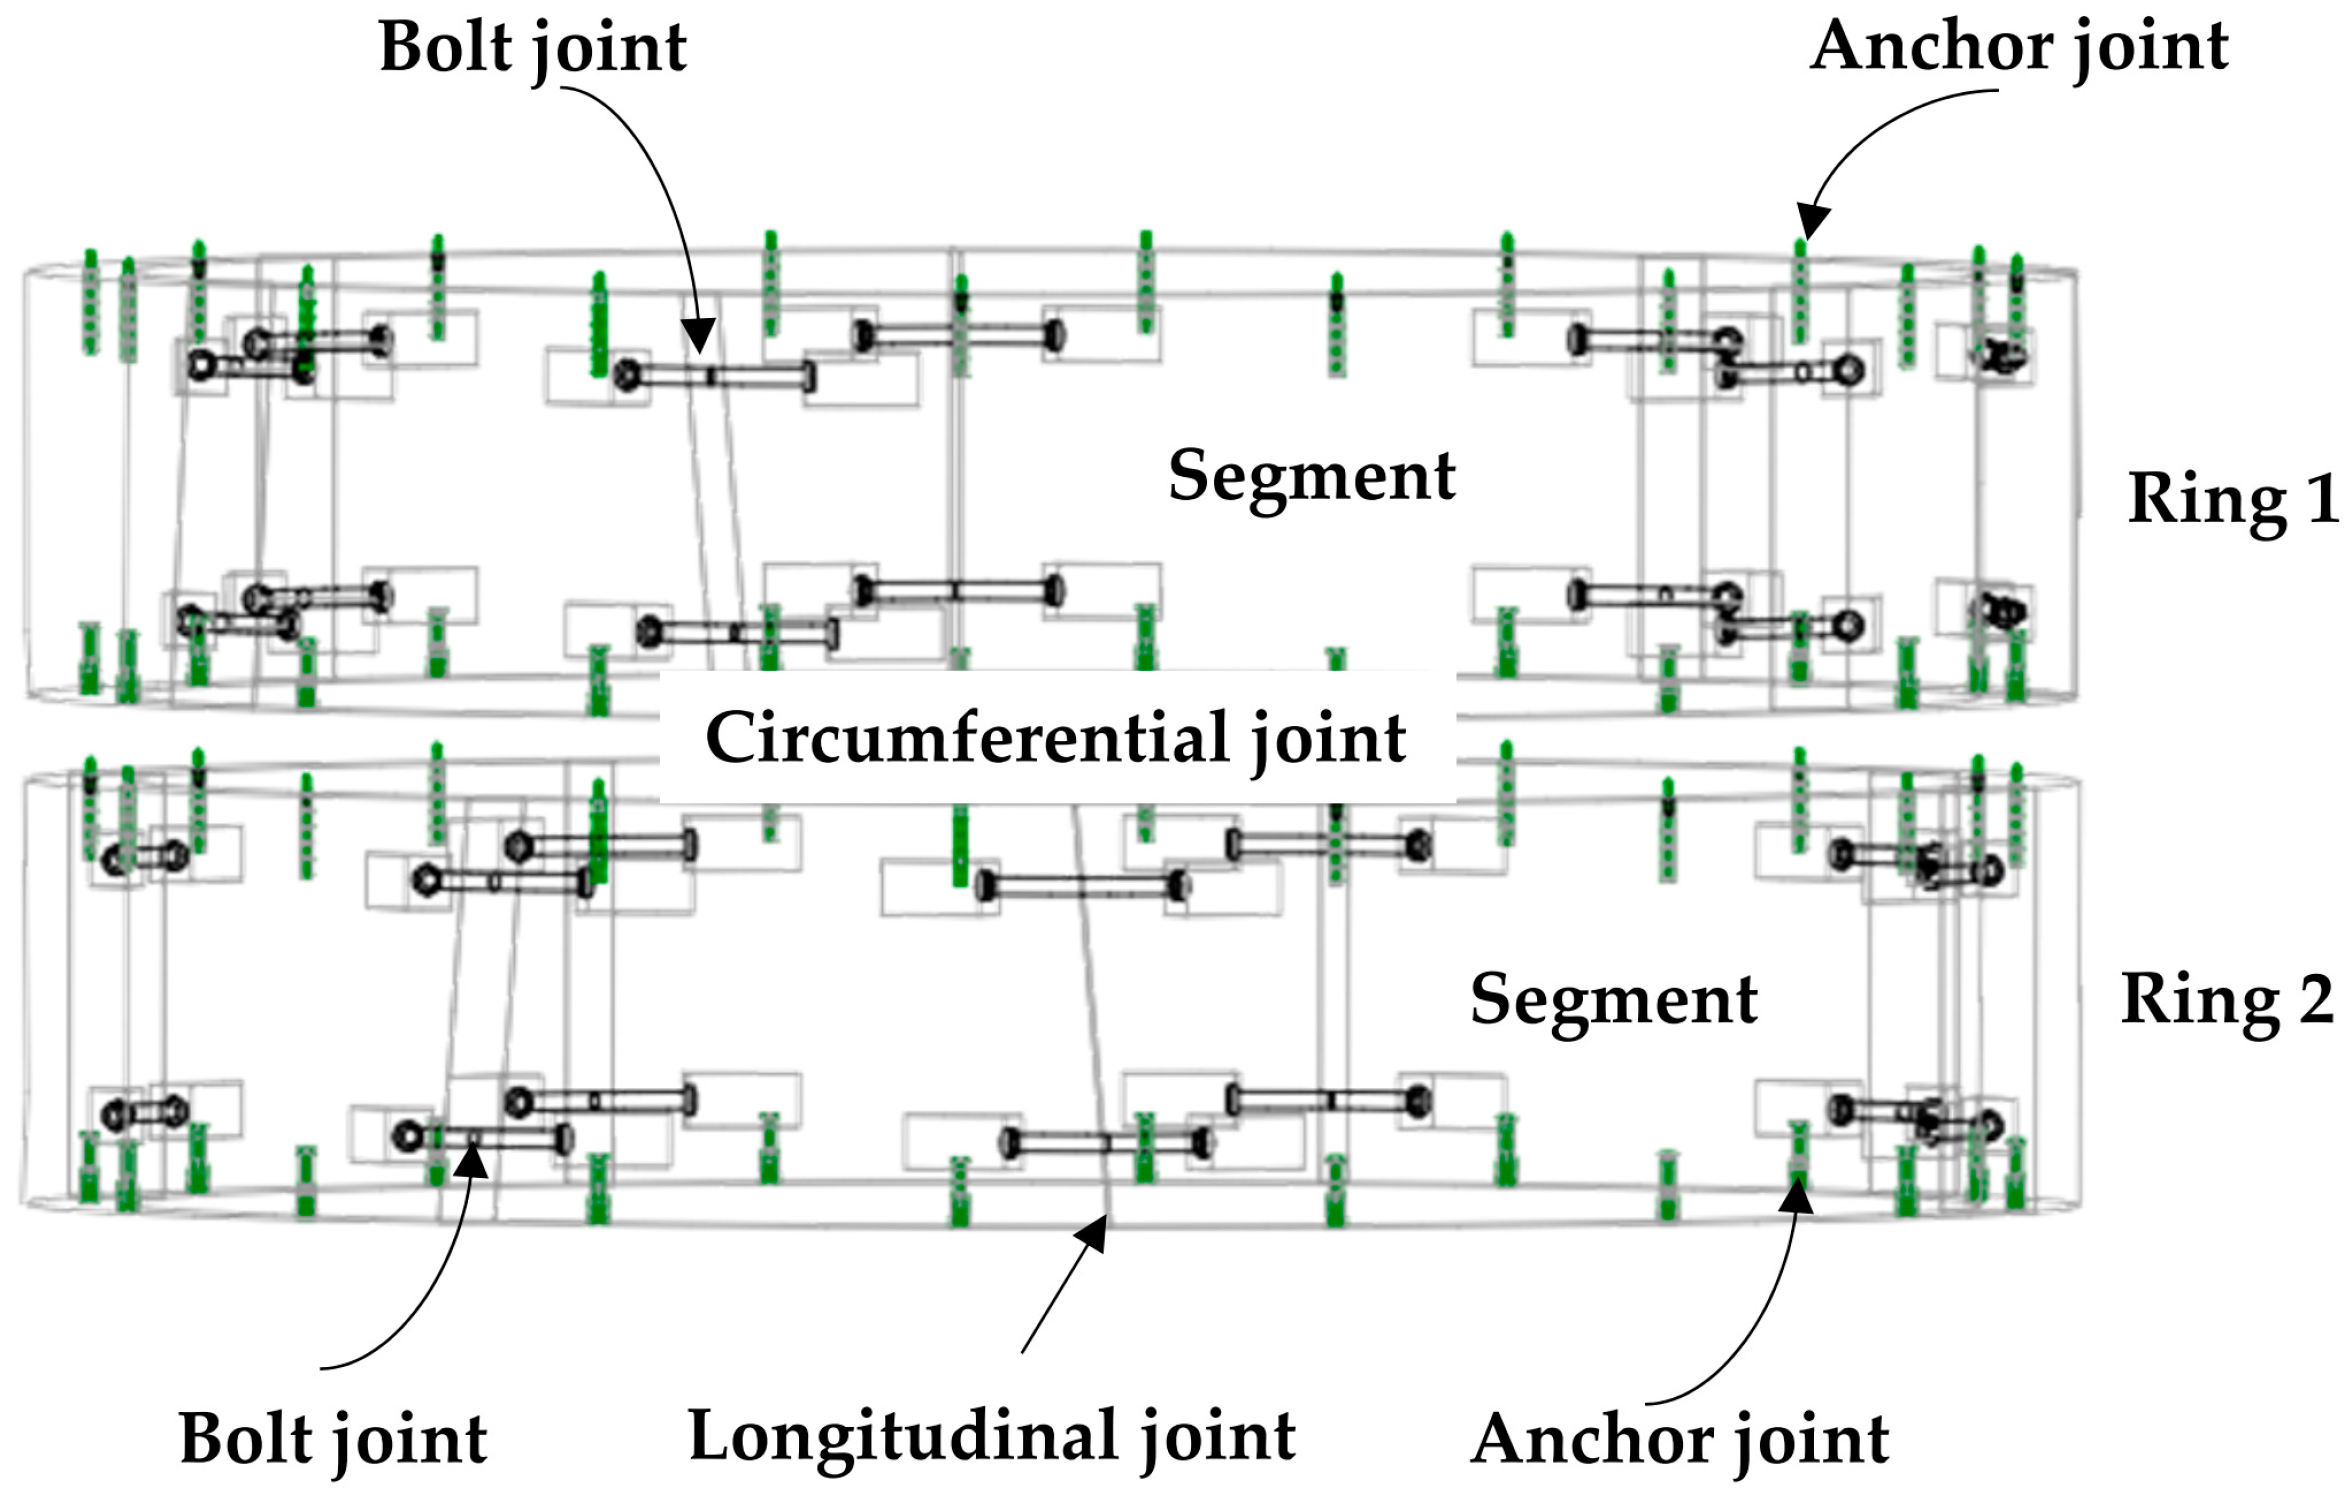
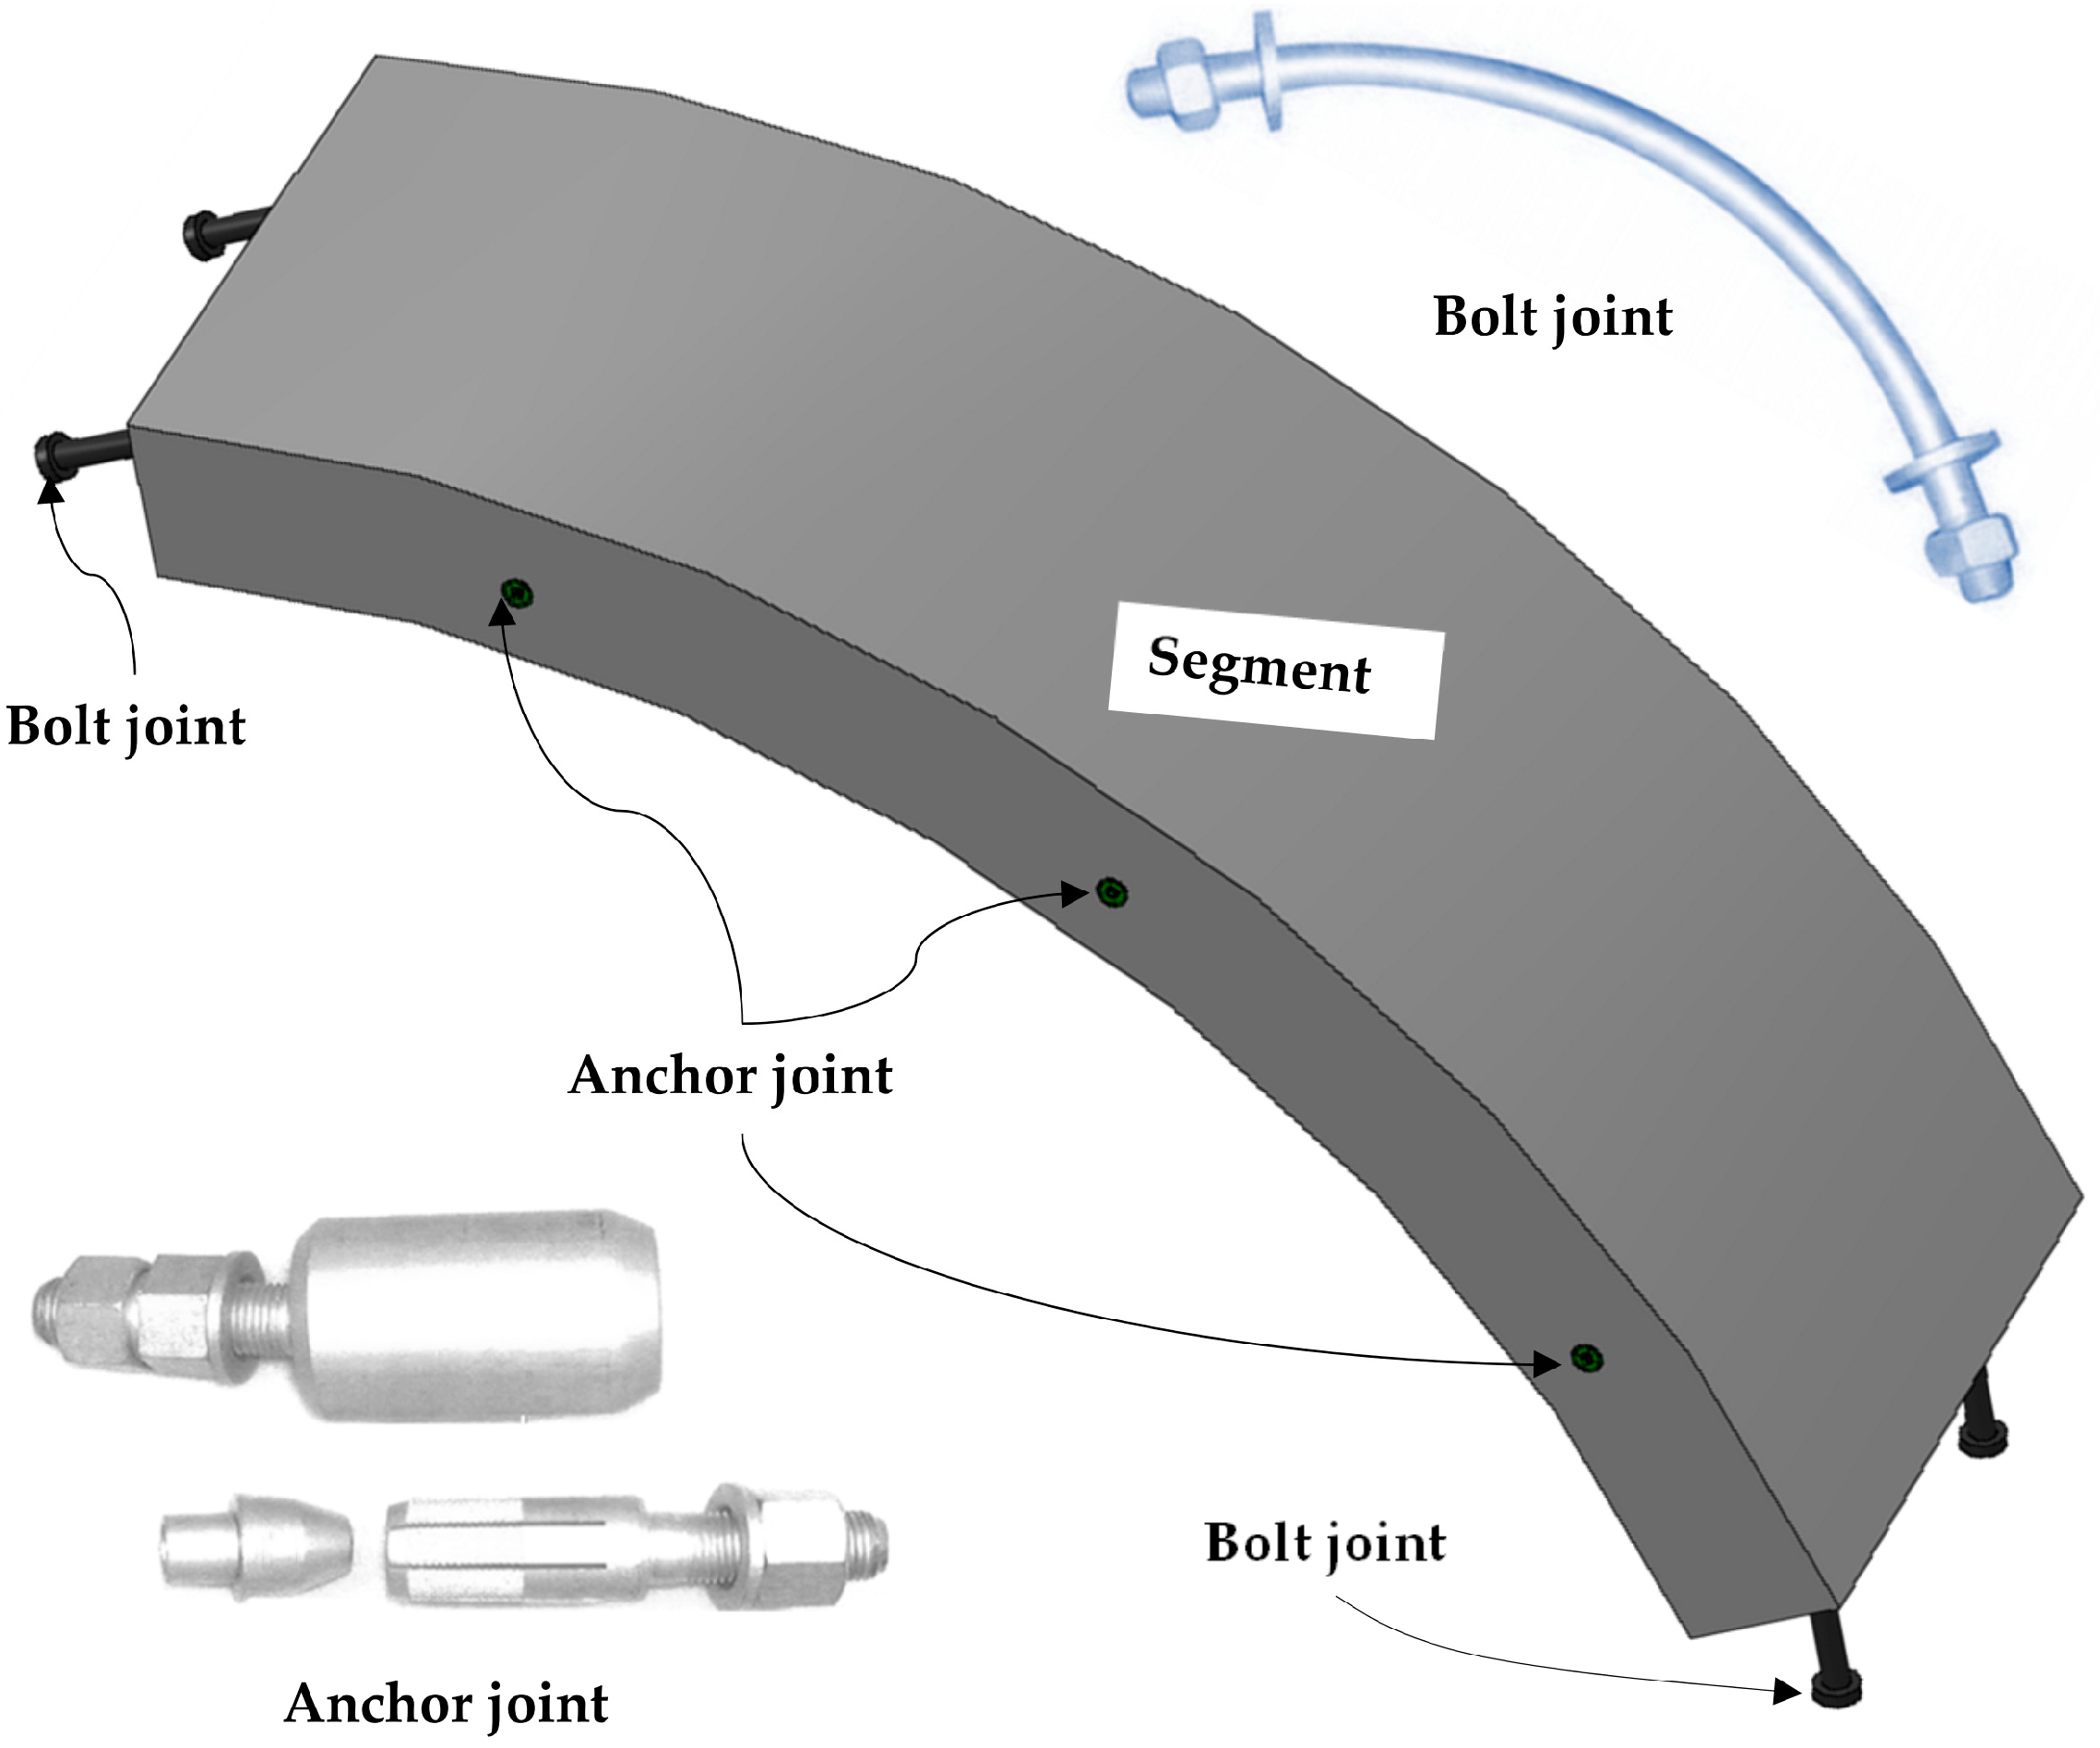
2. Project Overview
3. Improved Method to Investigate Seismic Response of Anchor Joint
4. Numerical Model and Materials
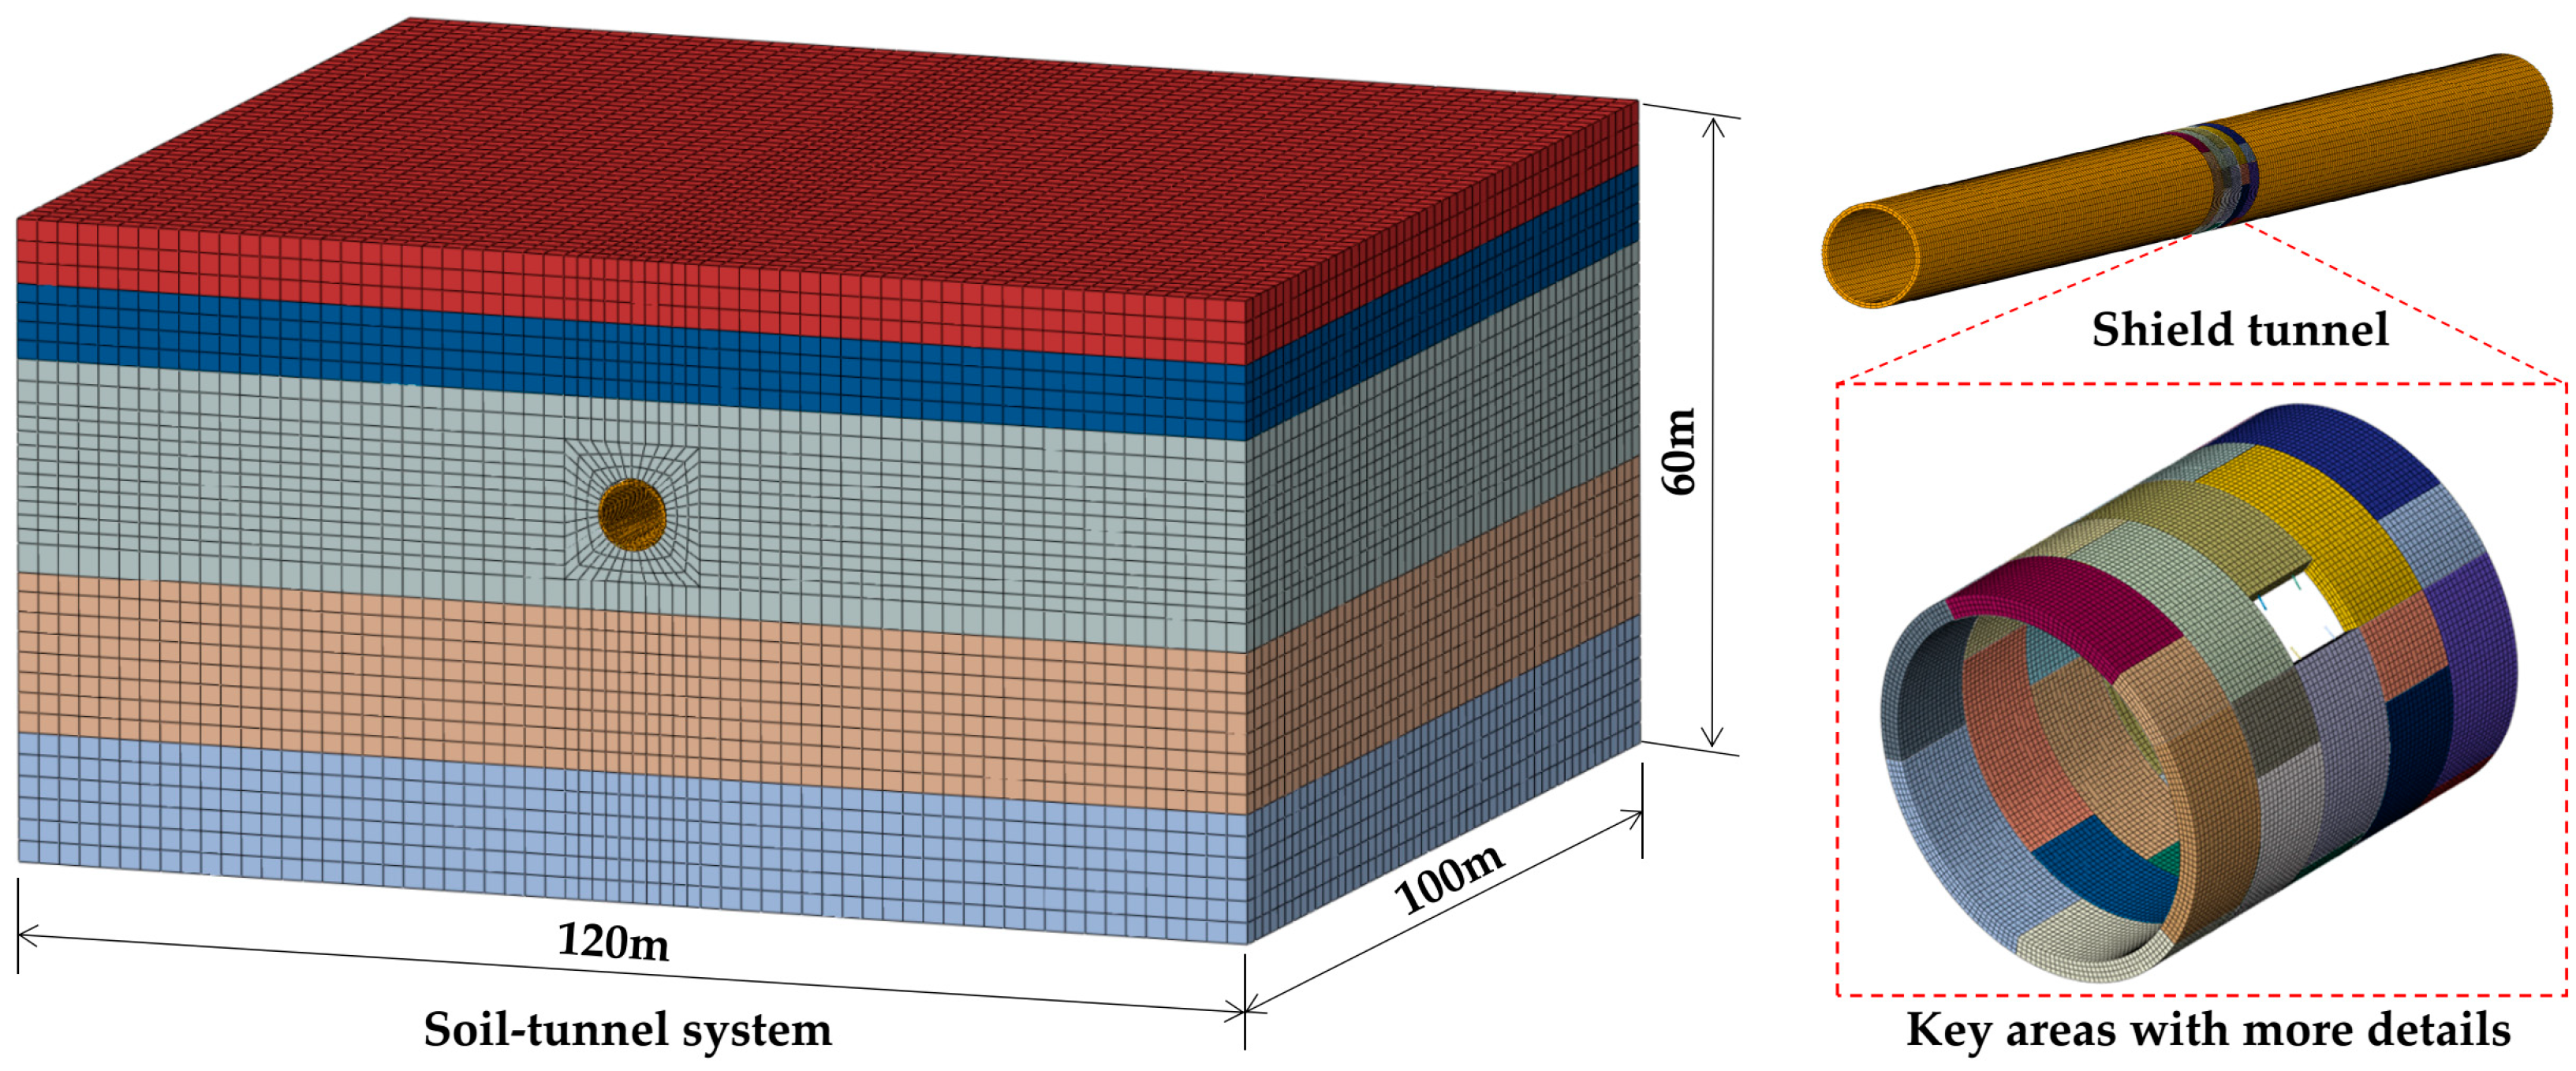
4.1. Soil-Tunnel System
4.1.1. Soil-Tunnel Model
4.1.2. Material Properties
4.1.3. Contact Relationships
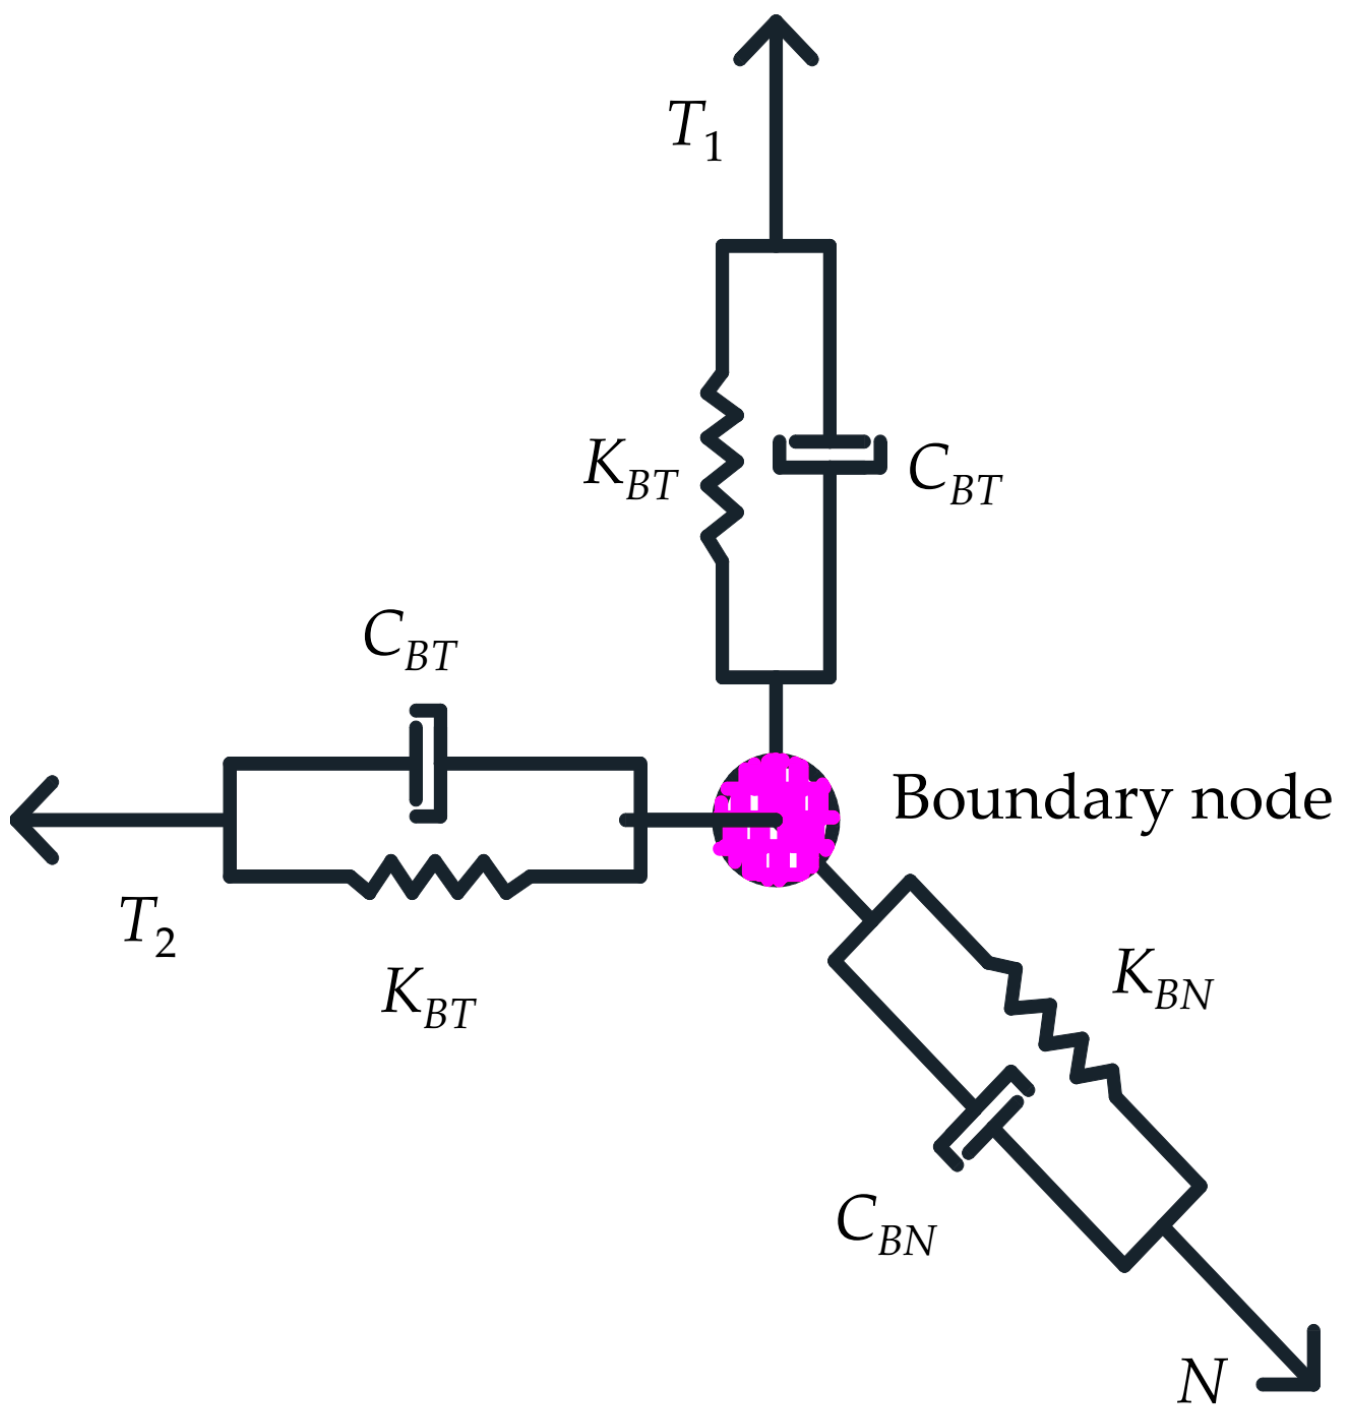
4.1.4. Boundary Conditions
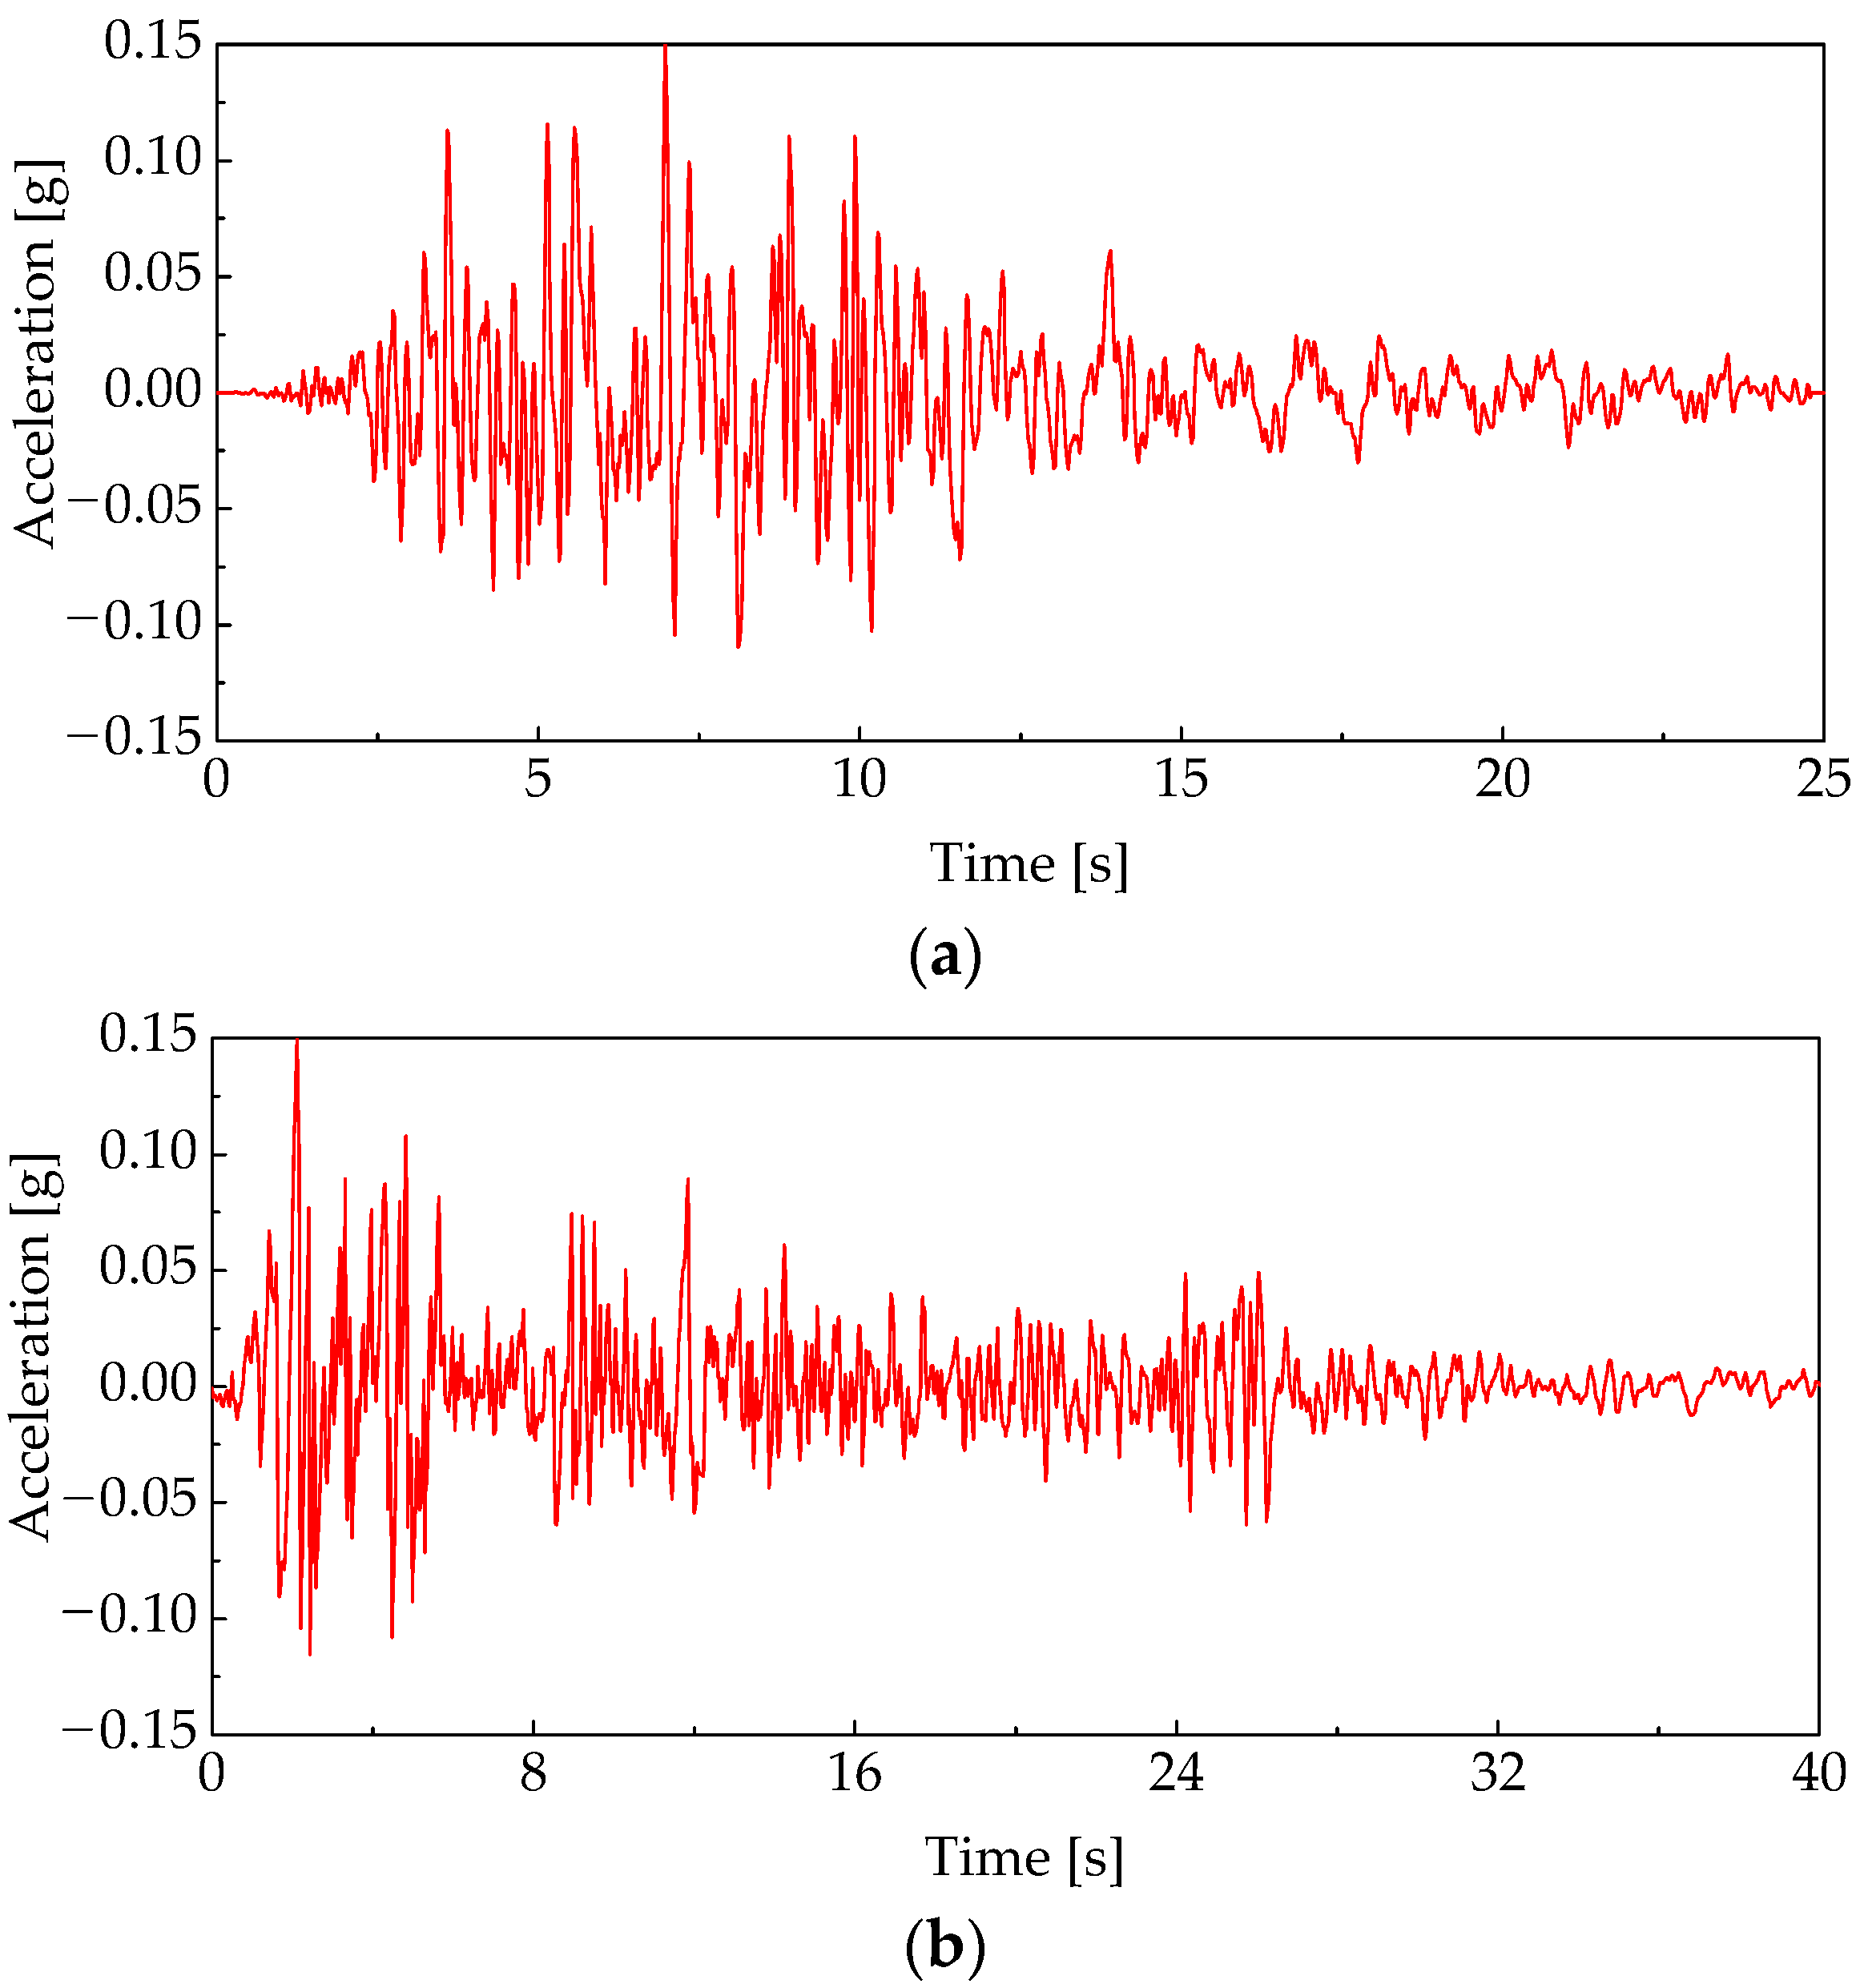
4.1.5. Earthquake Records
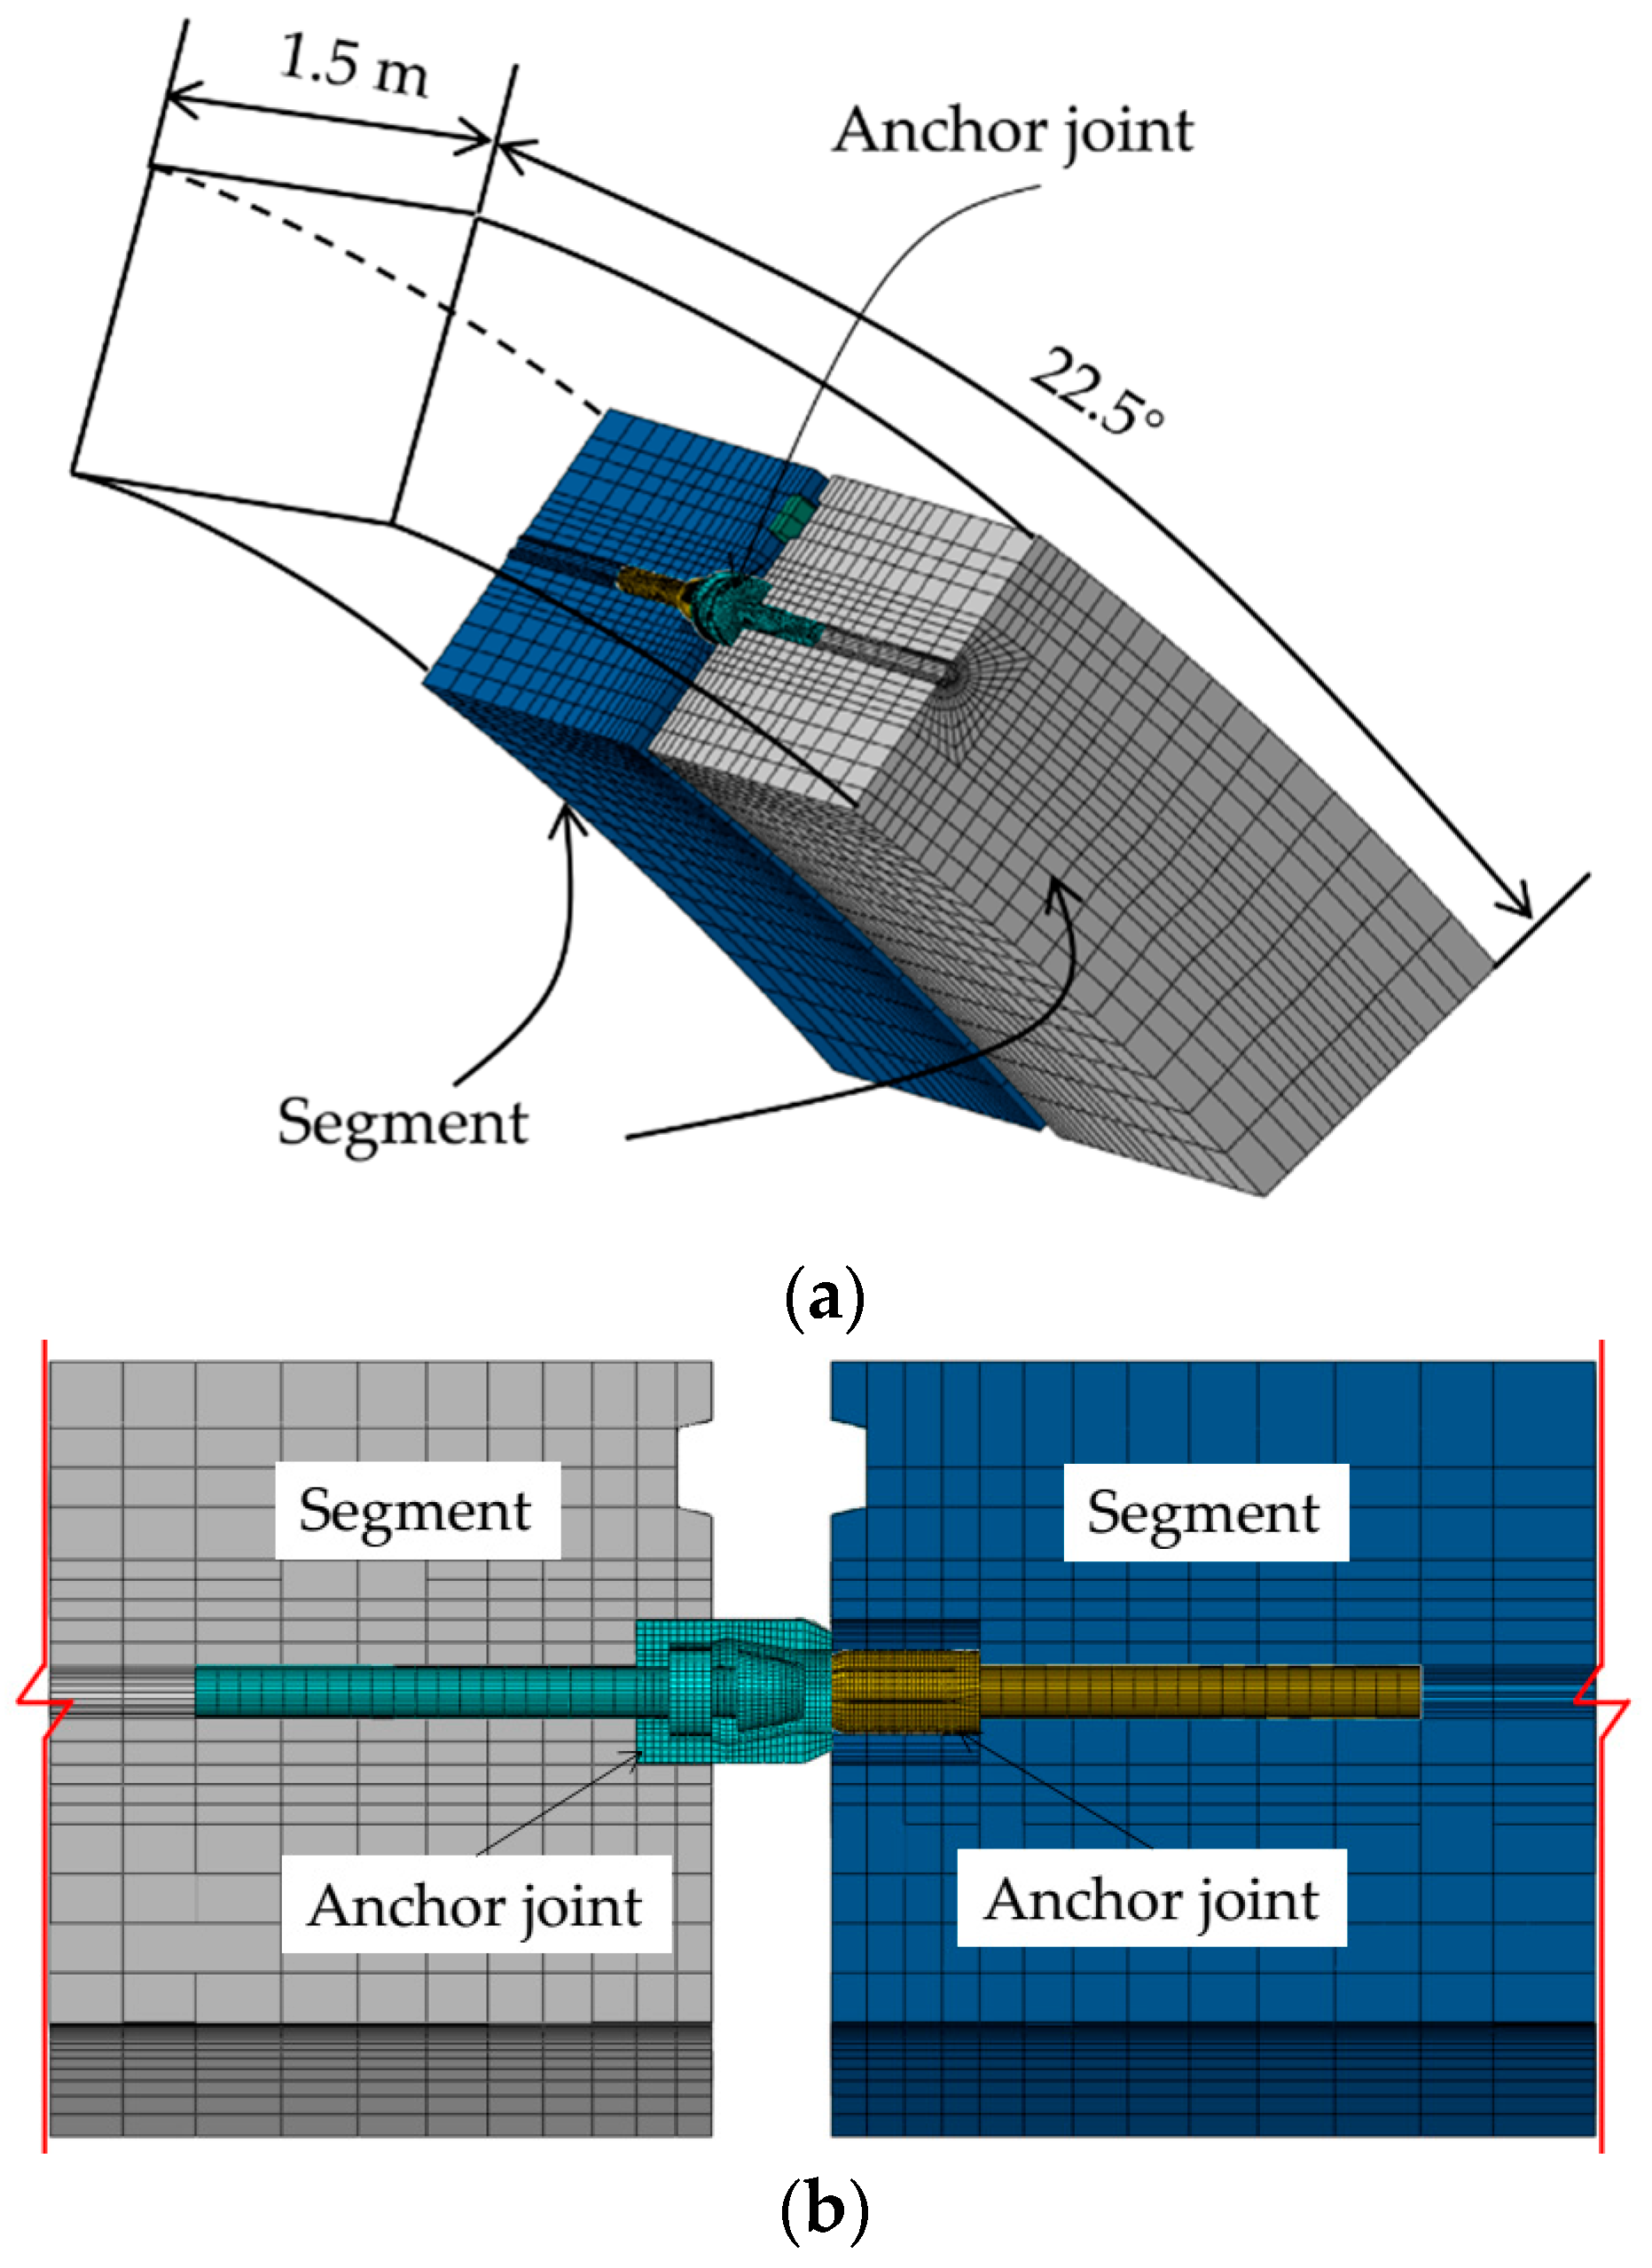
4.2. Refined Model of Anchor Joint
4.2.1. Refined Numerical Model of Anchor Joint
4.2.2. Material Properties
4.2.3. Contact Relationships
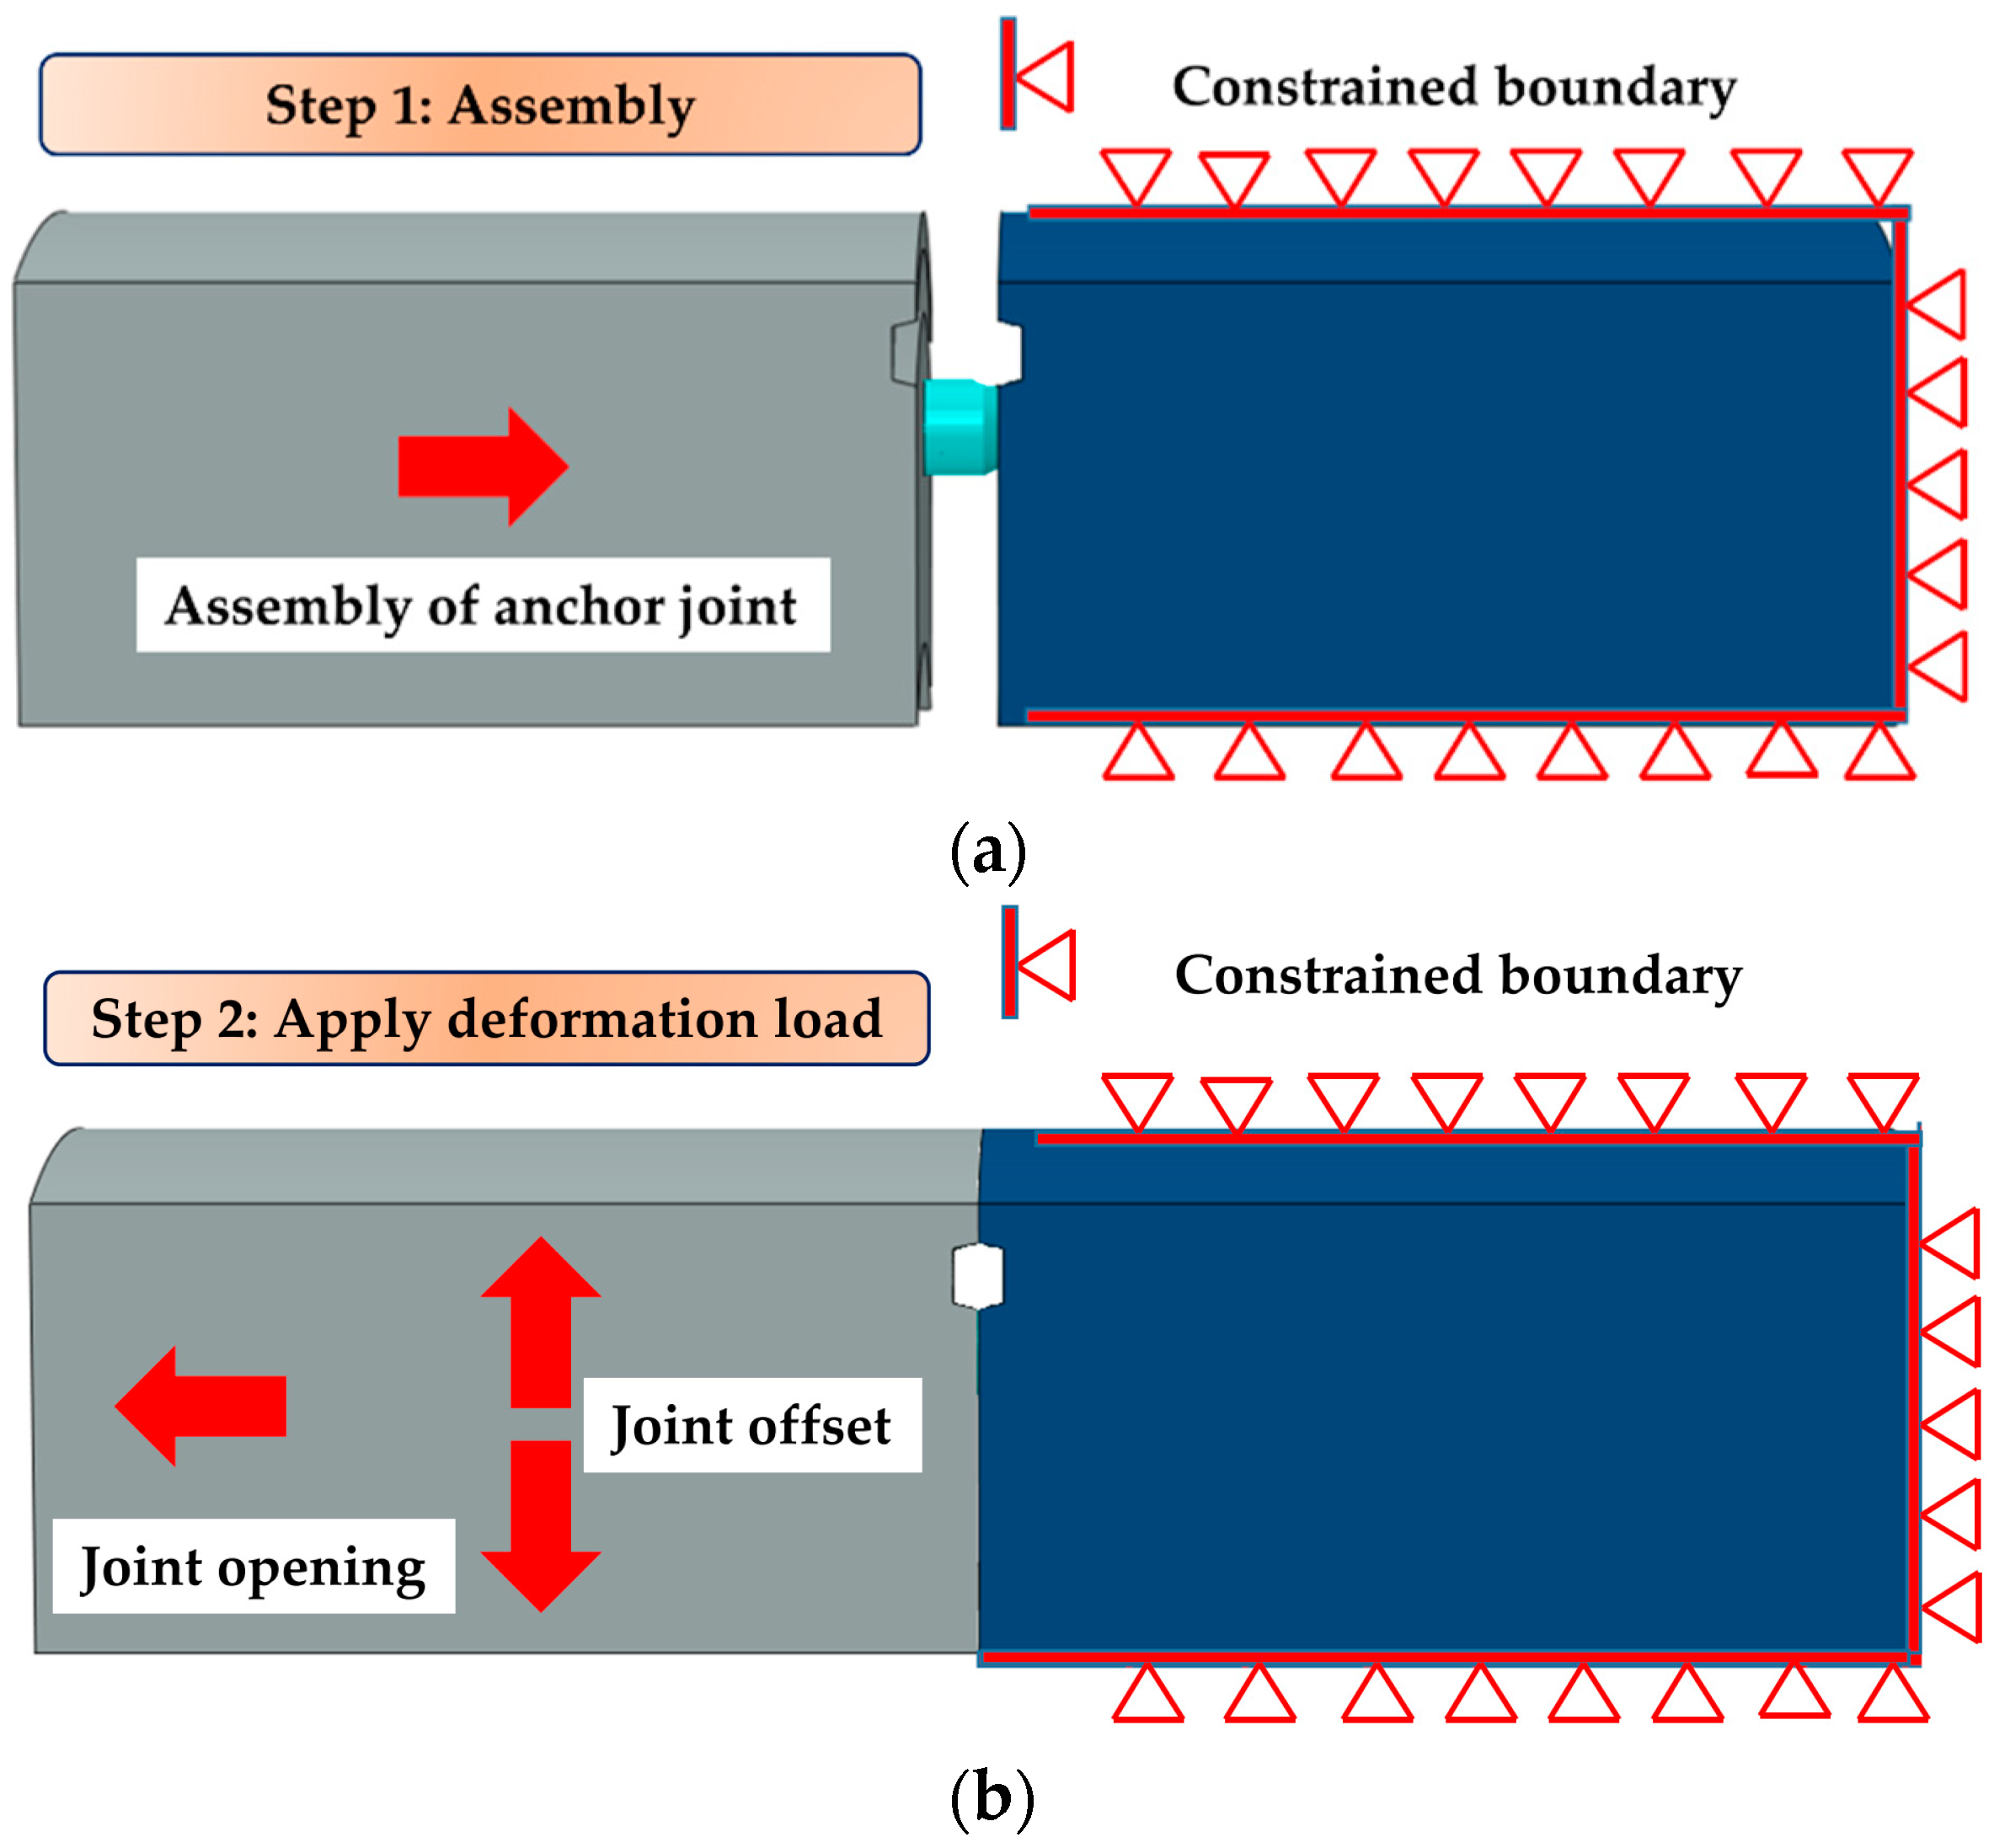
4.2.4. Boundary and Loading Conditions
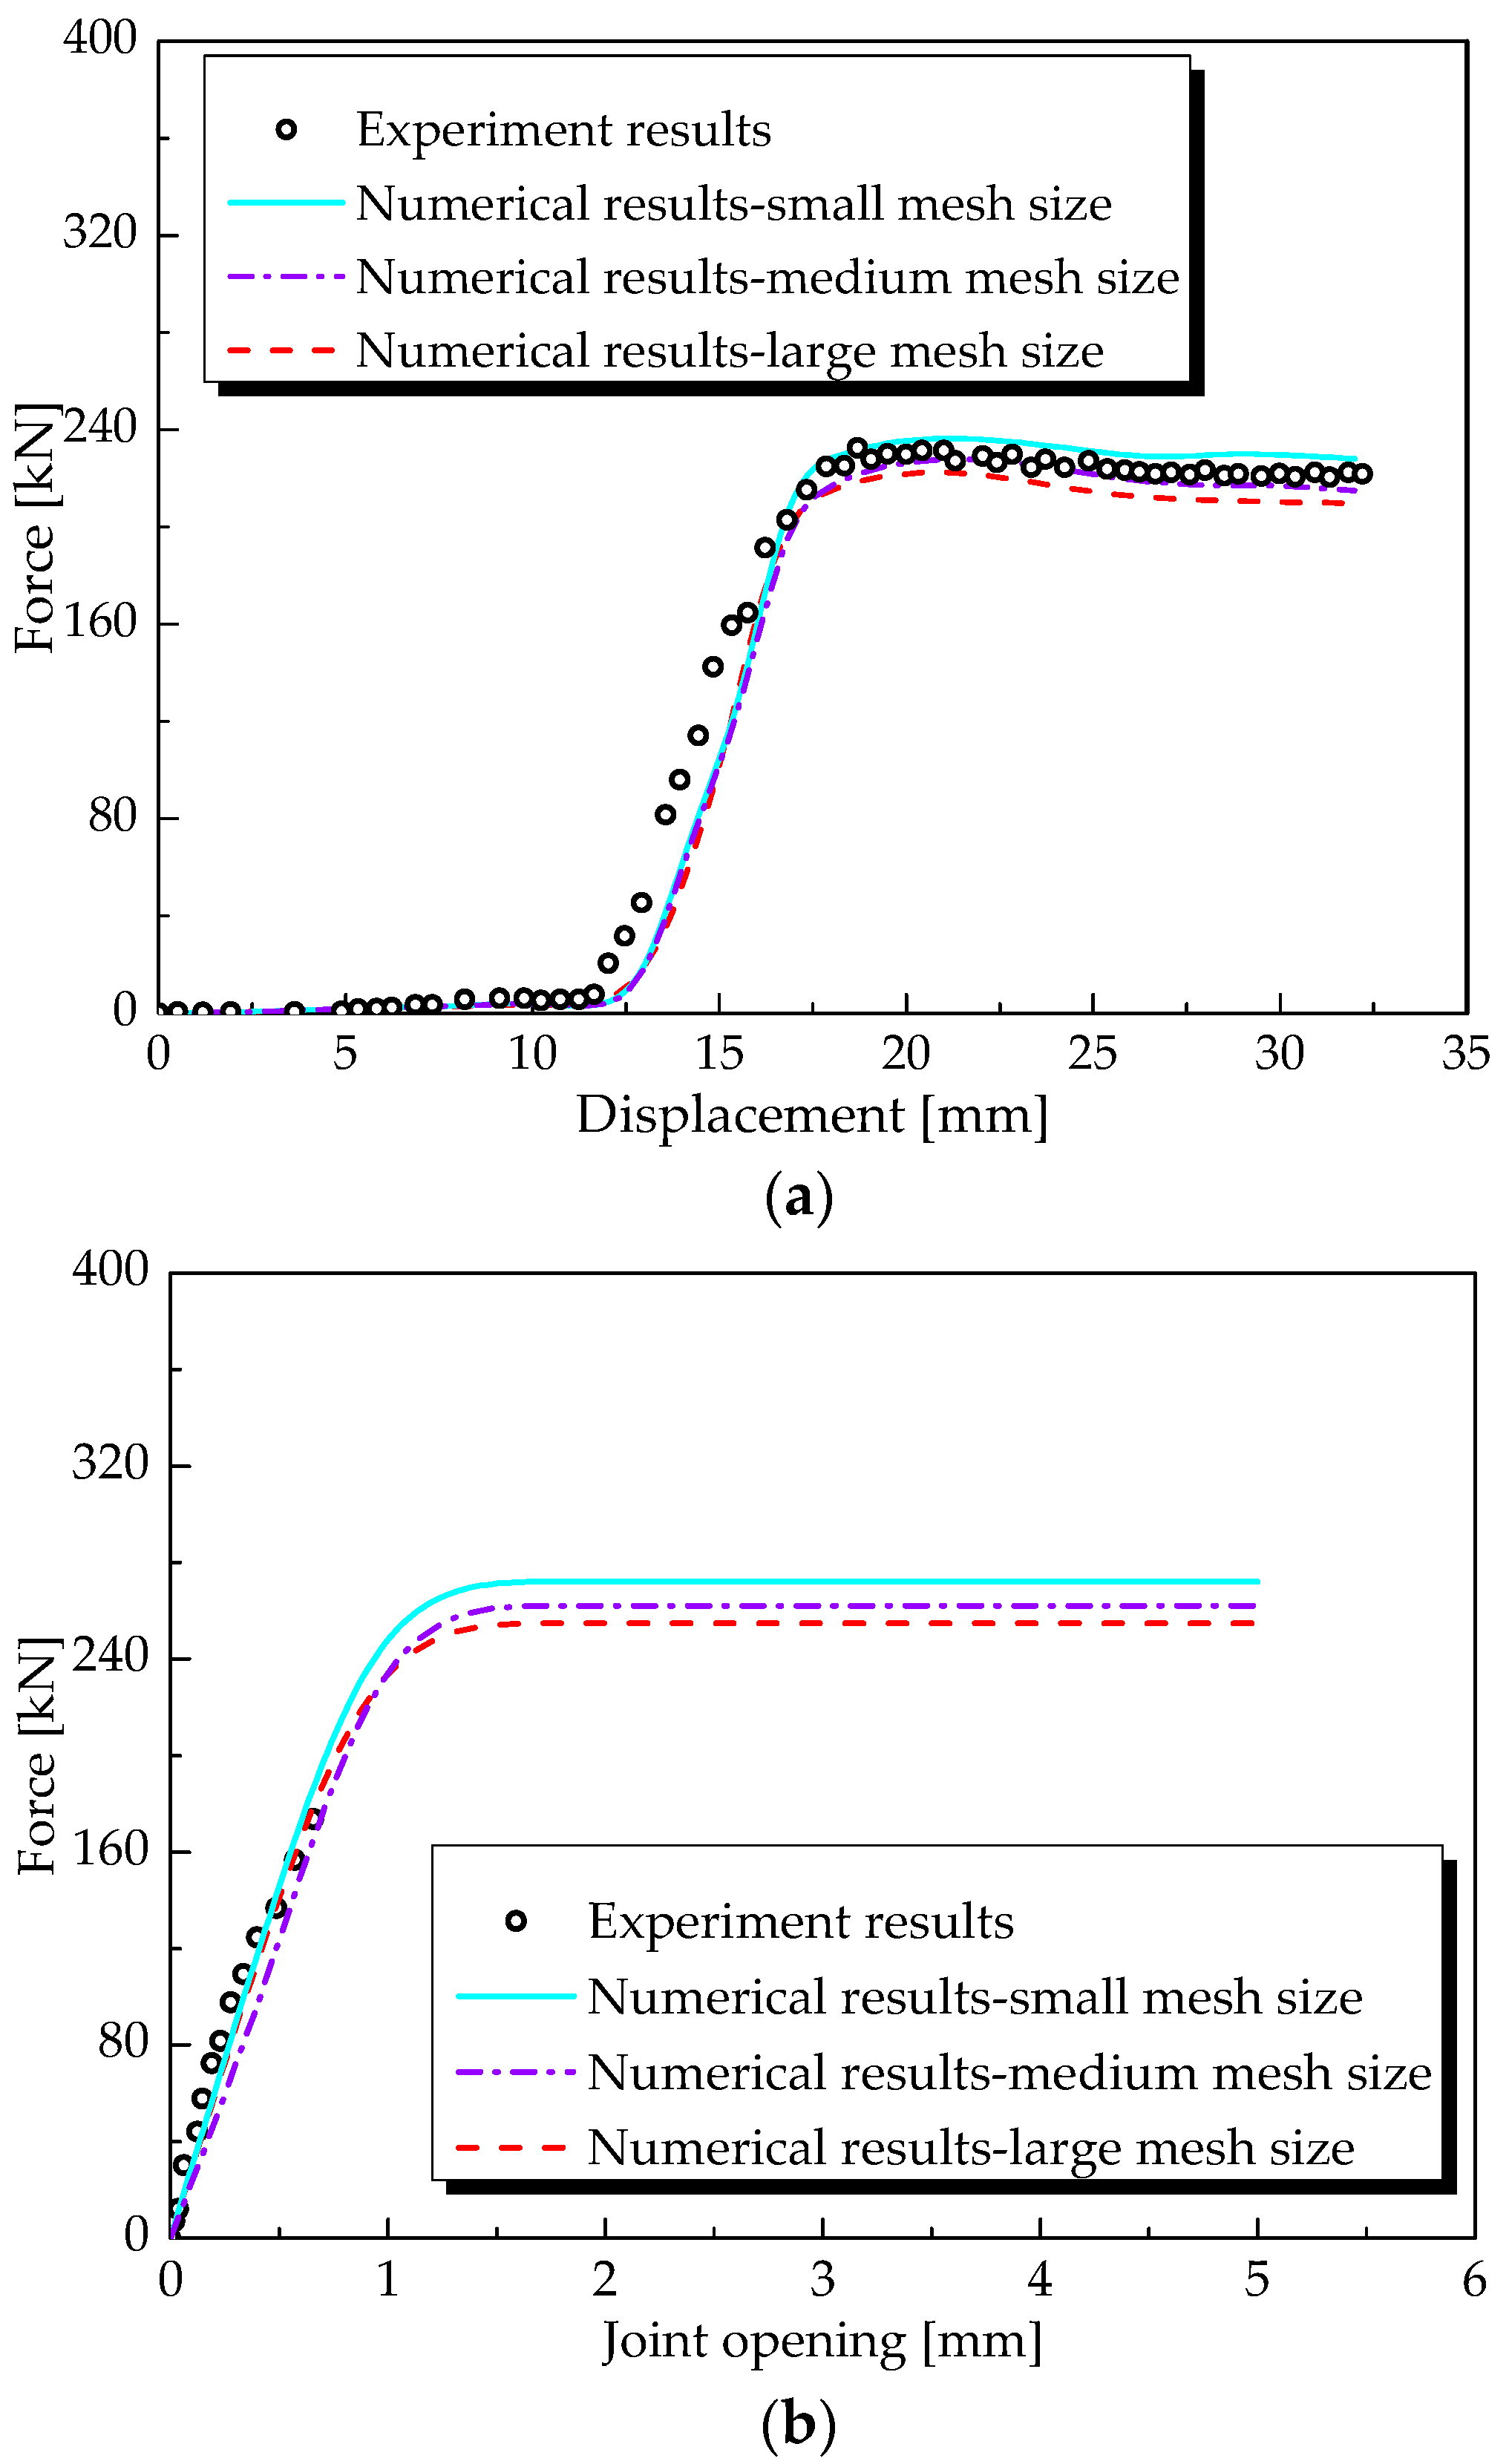
4.3. Model Validation and Convergence Study
5. Seismic Response of Anchor Joint
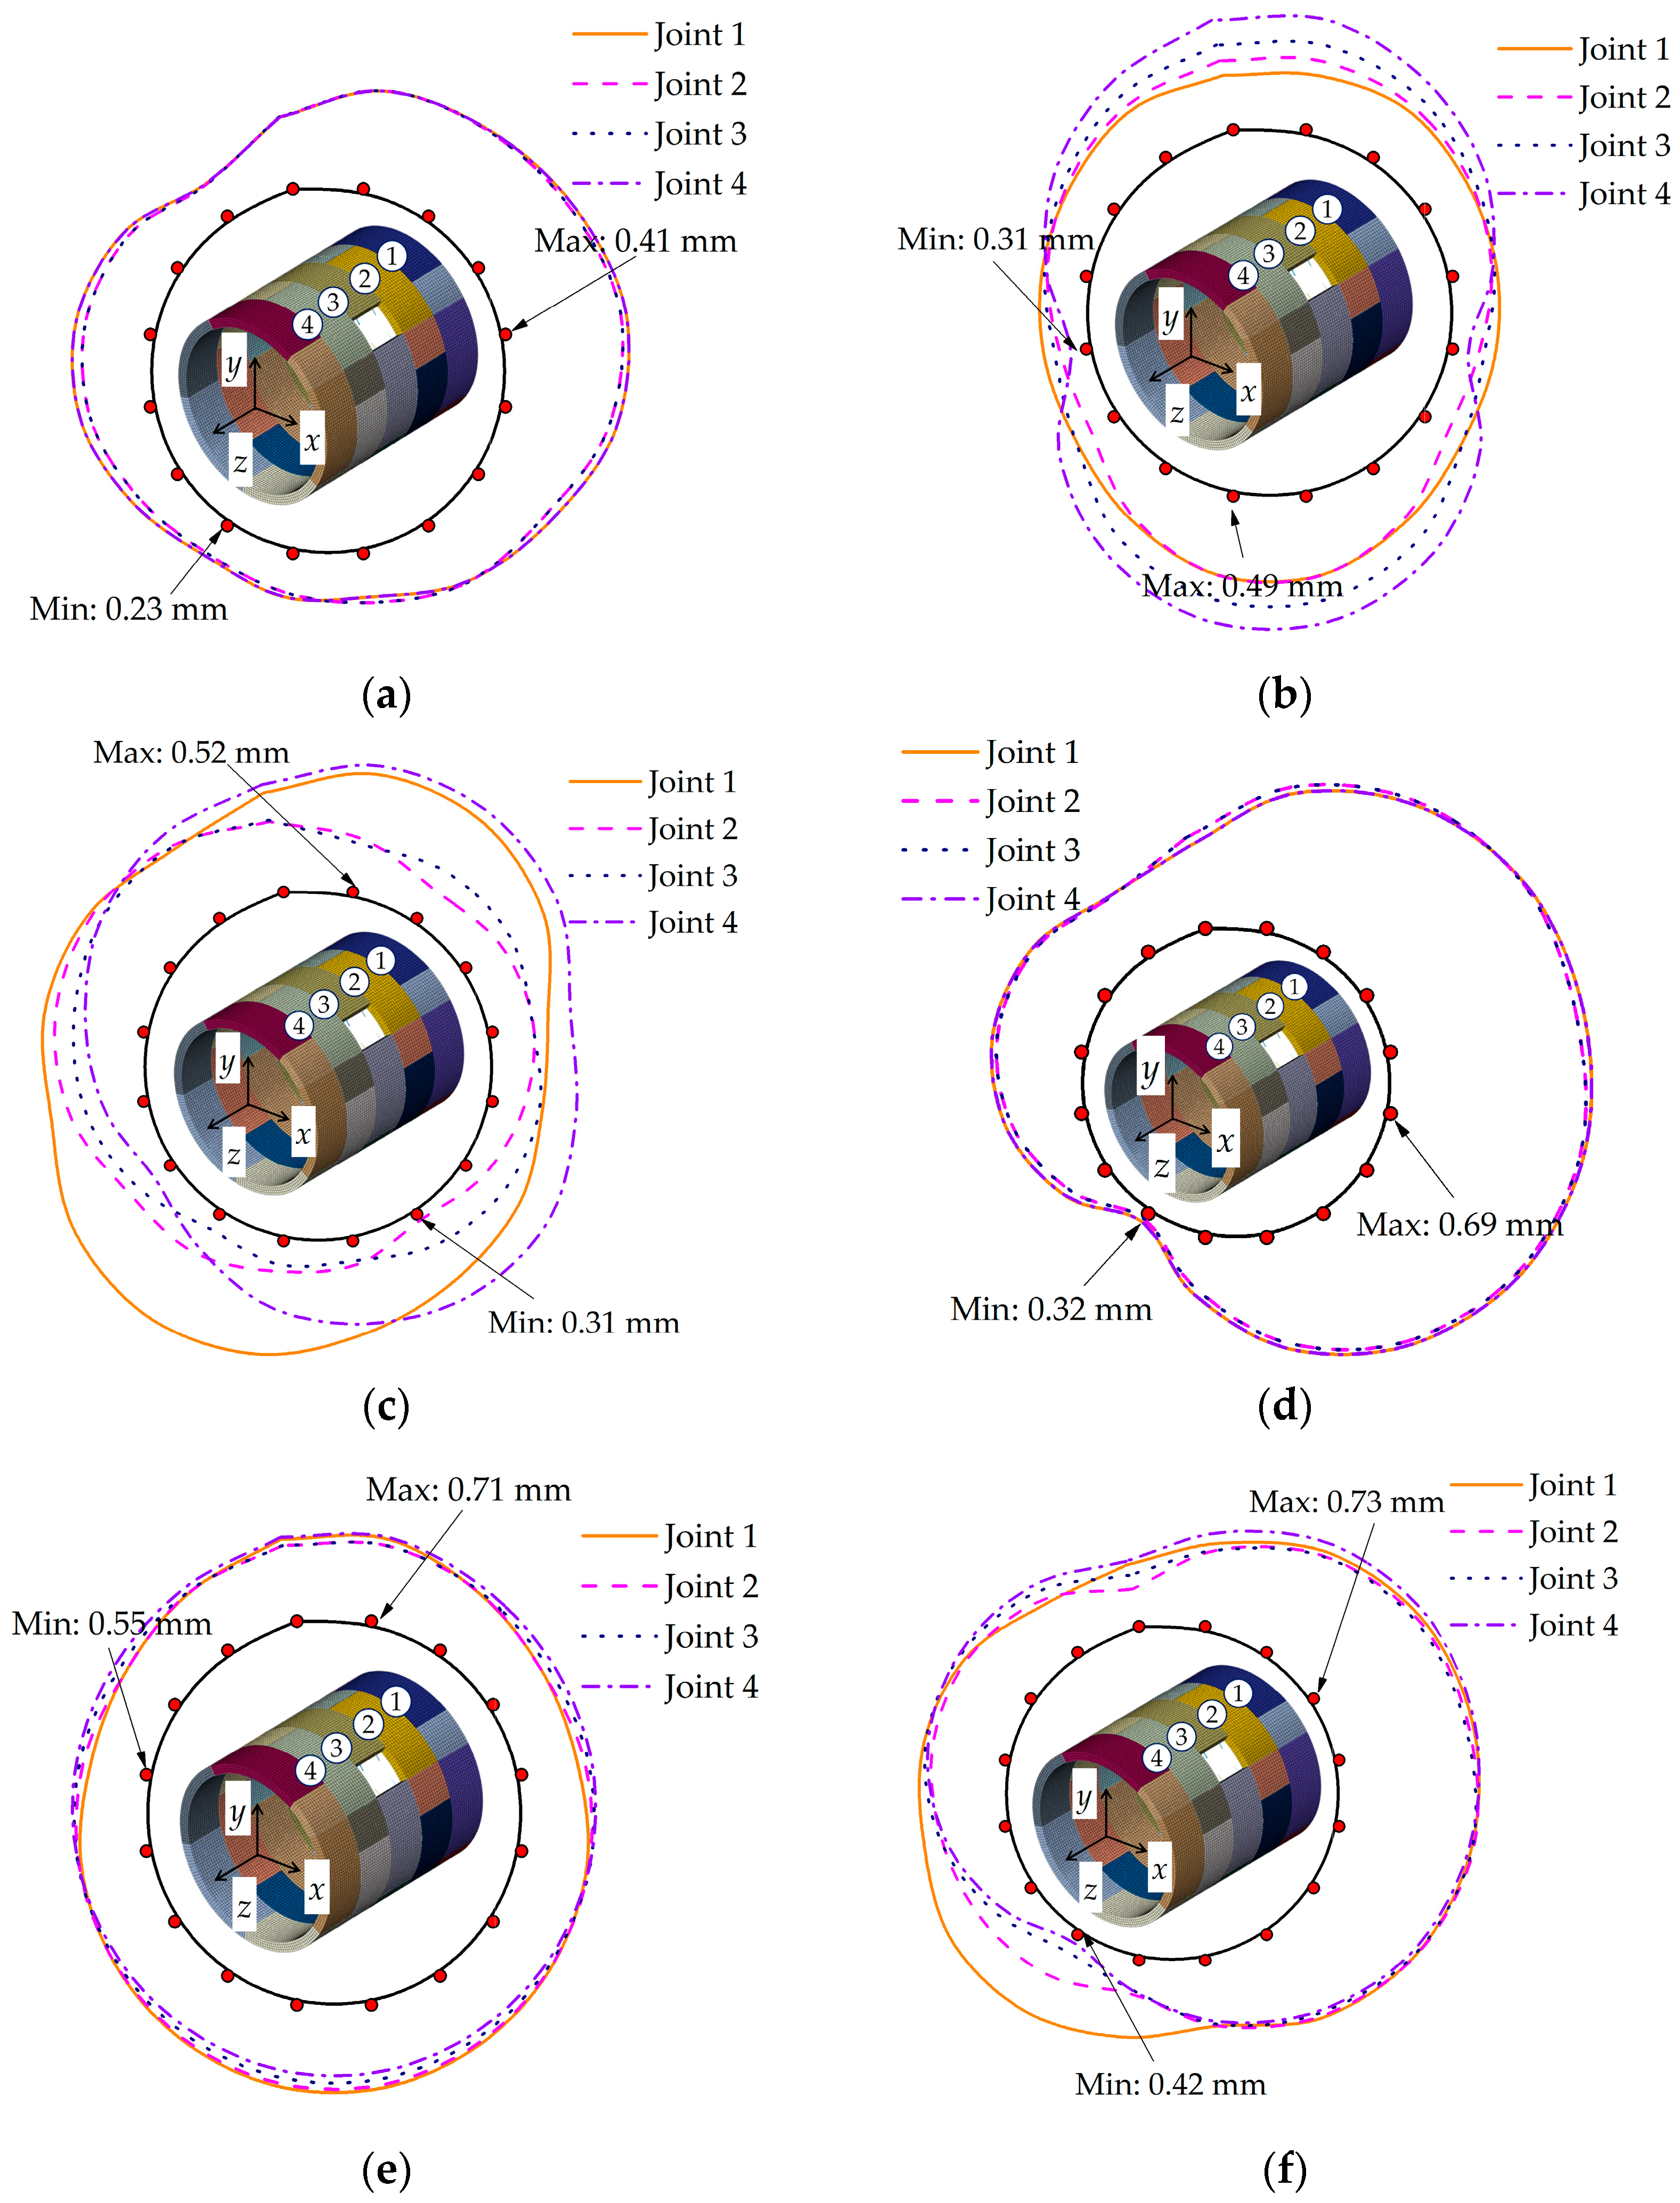
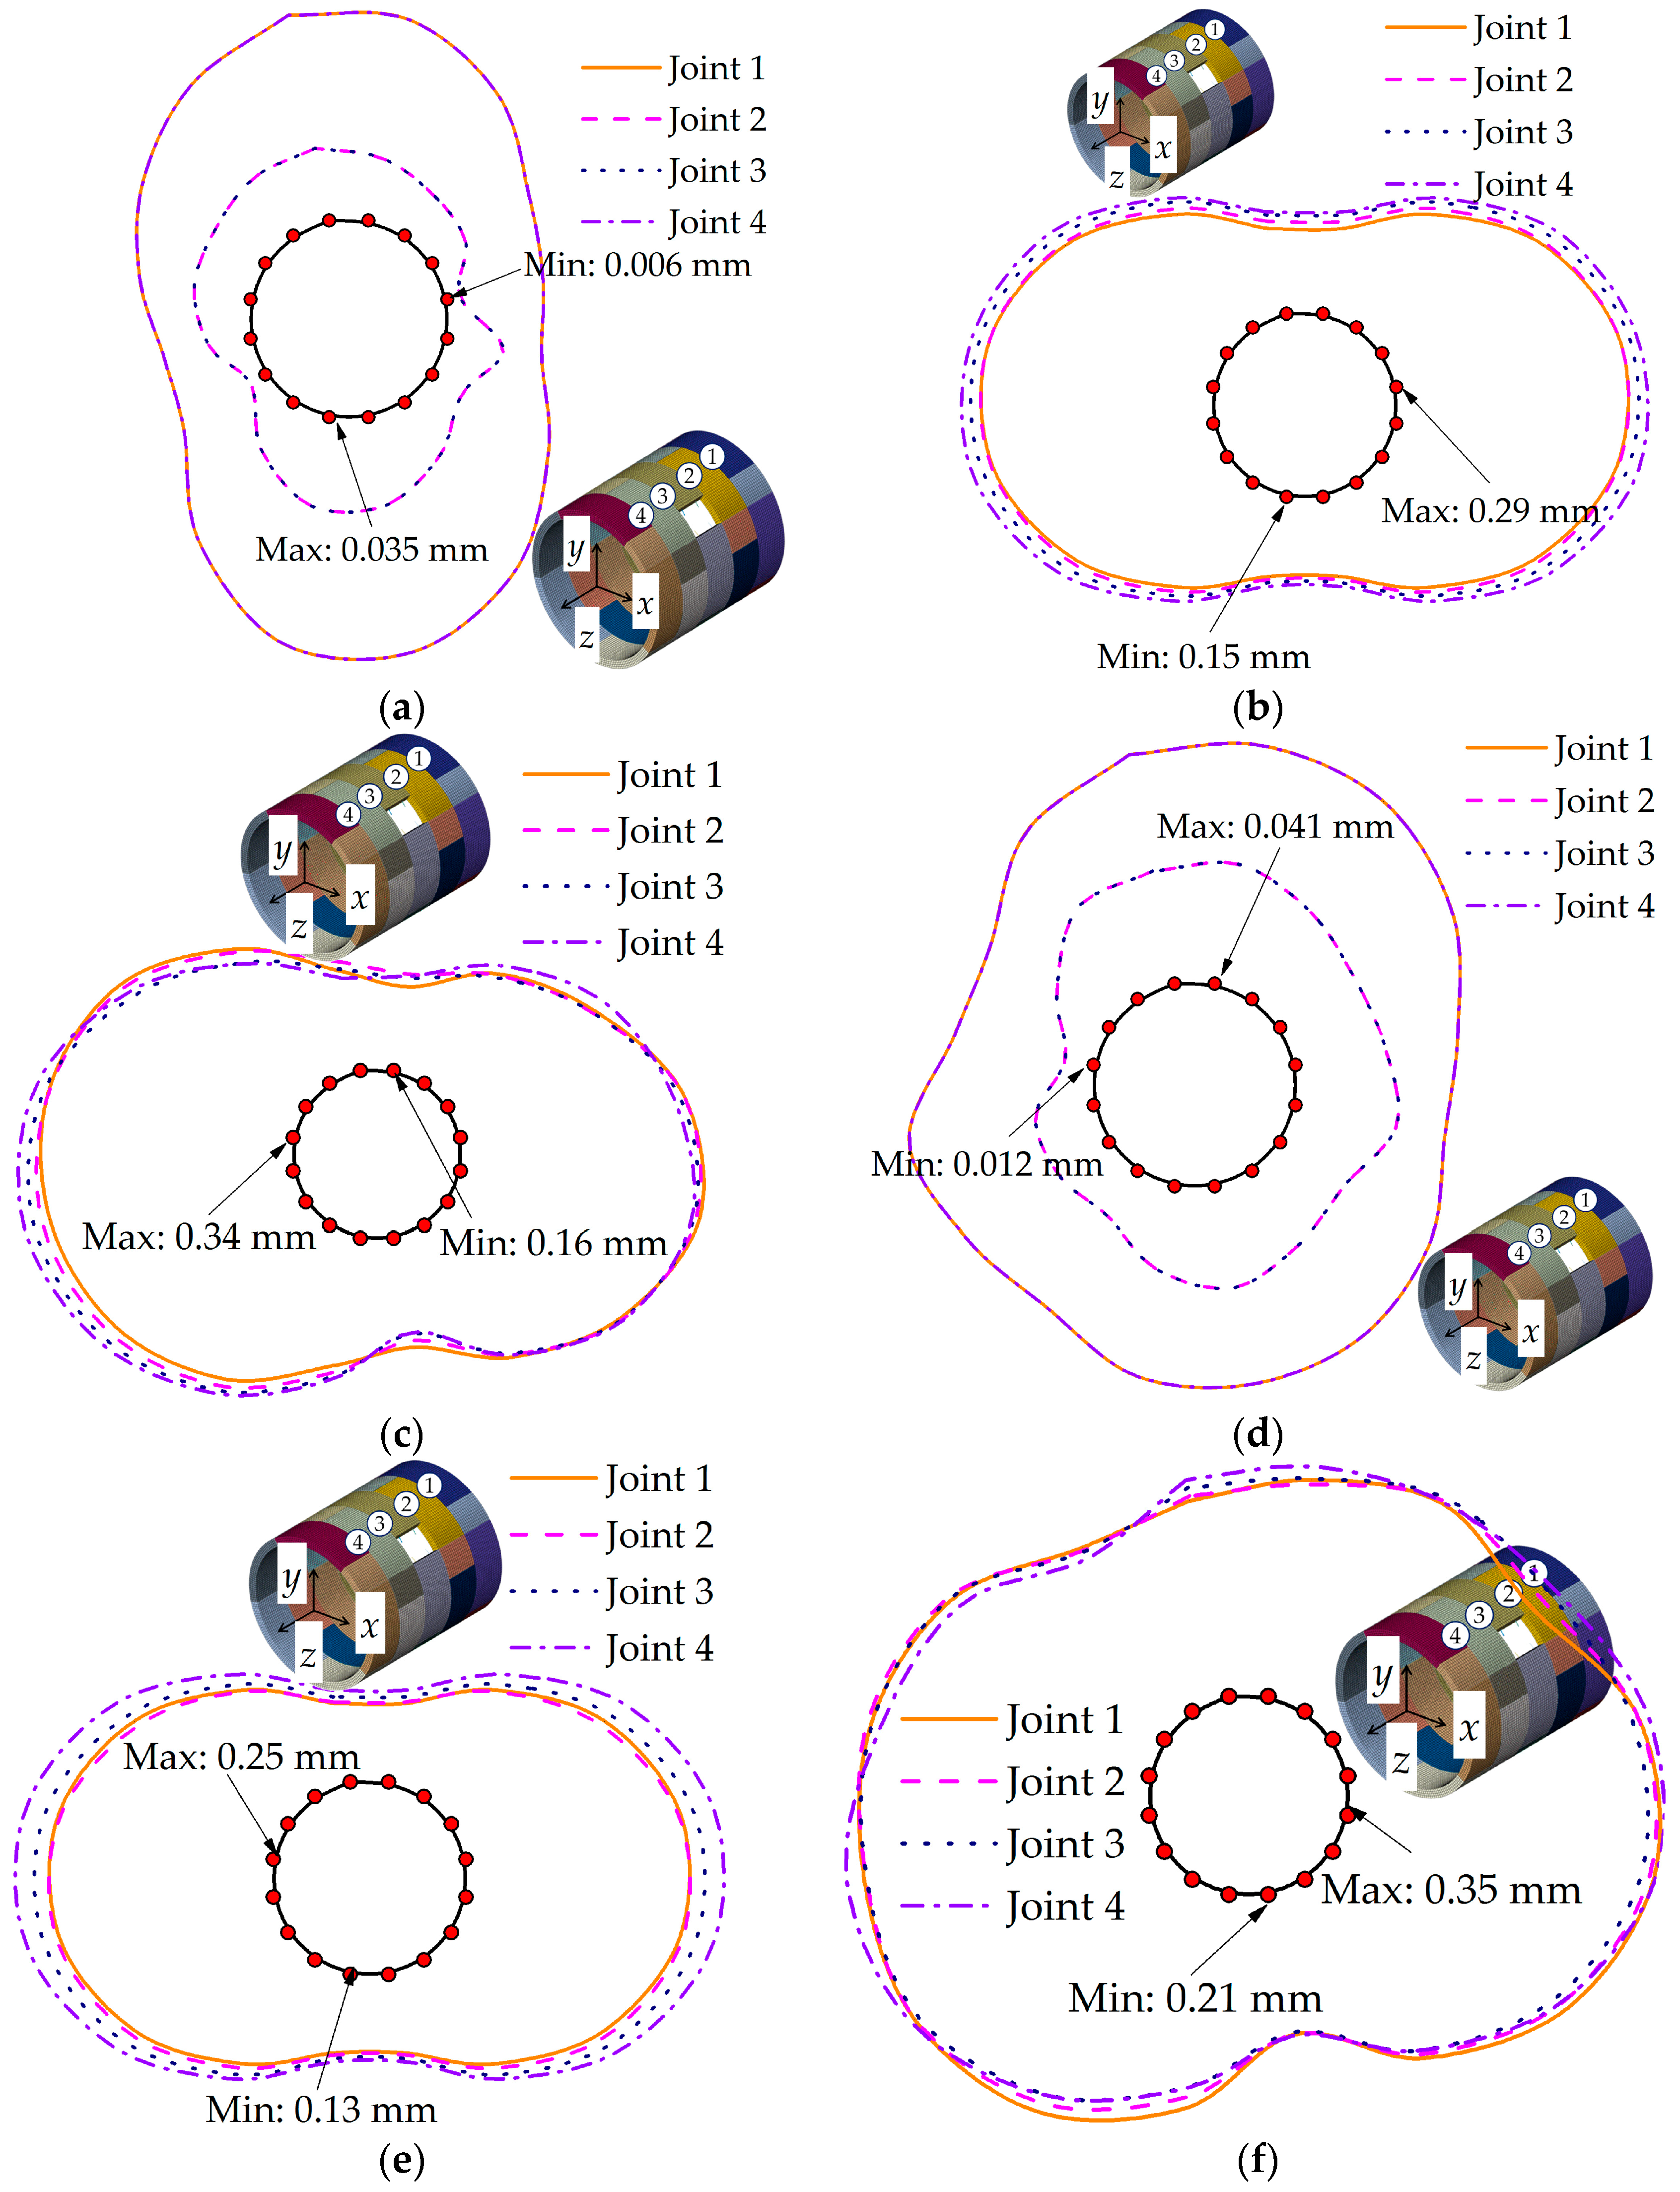
5.1. Joint Opening and Offset
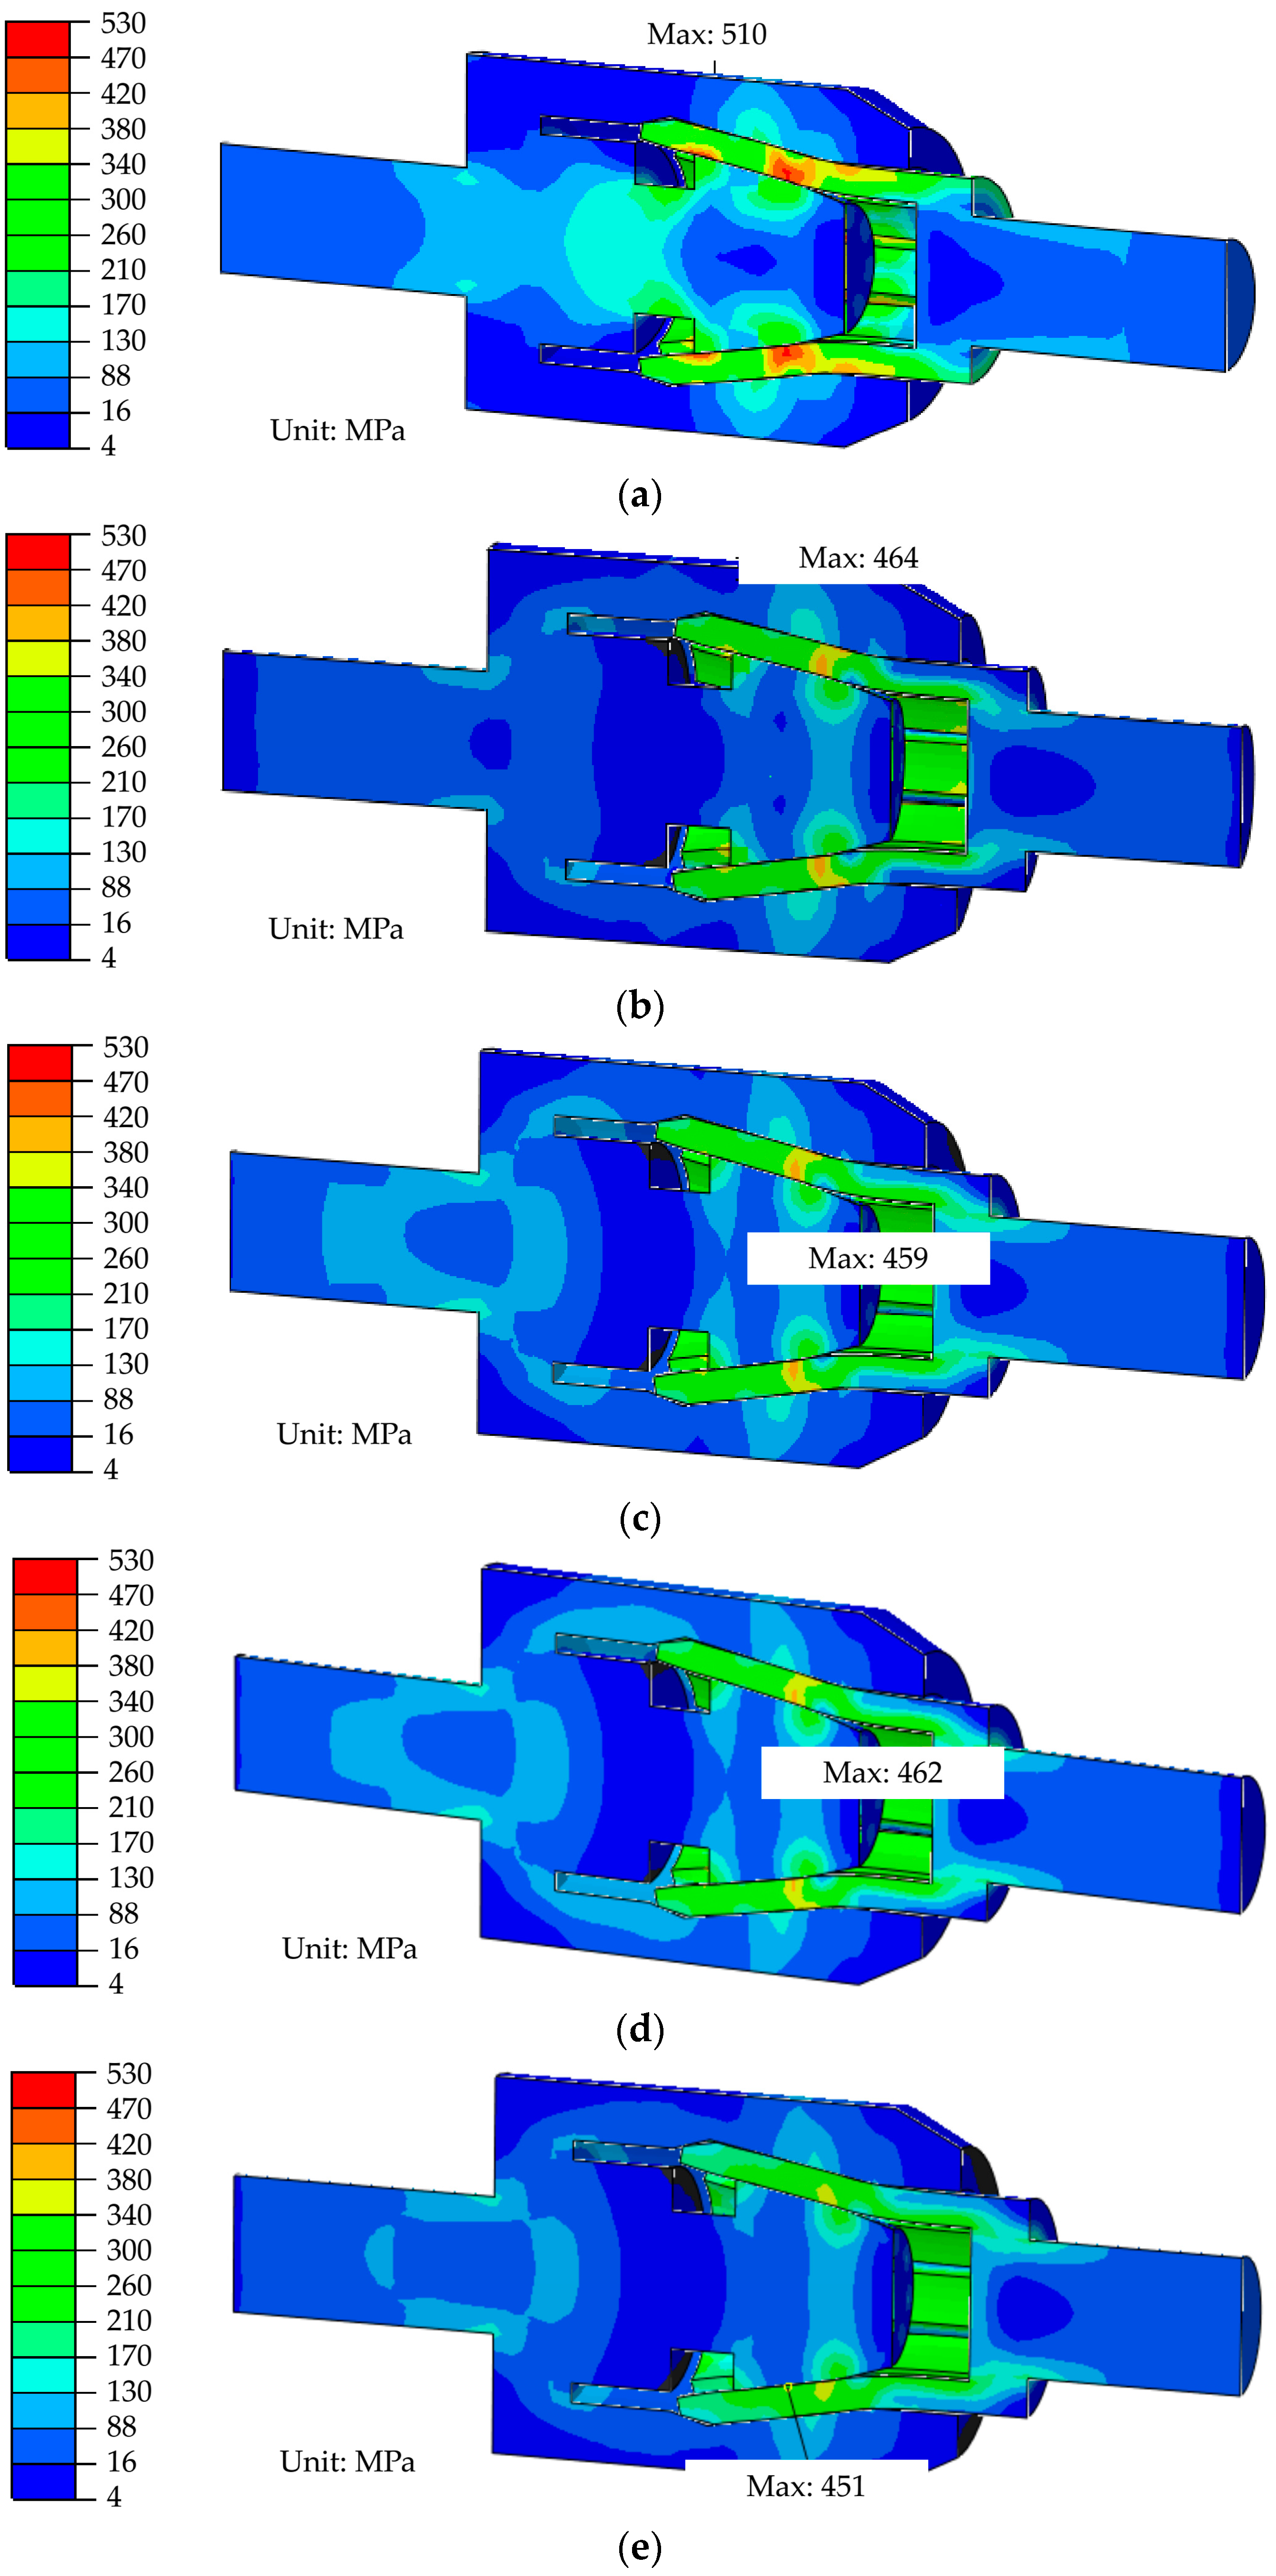
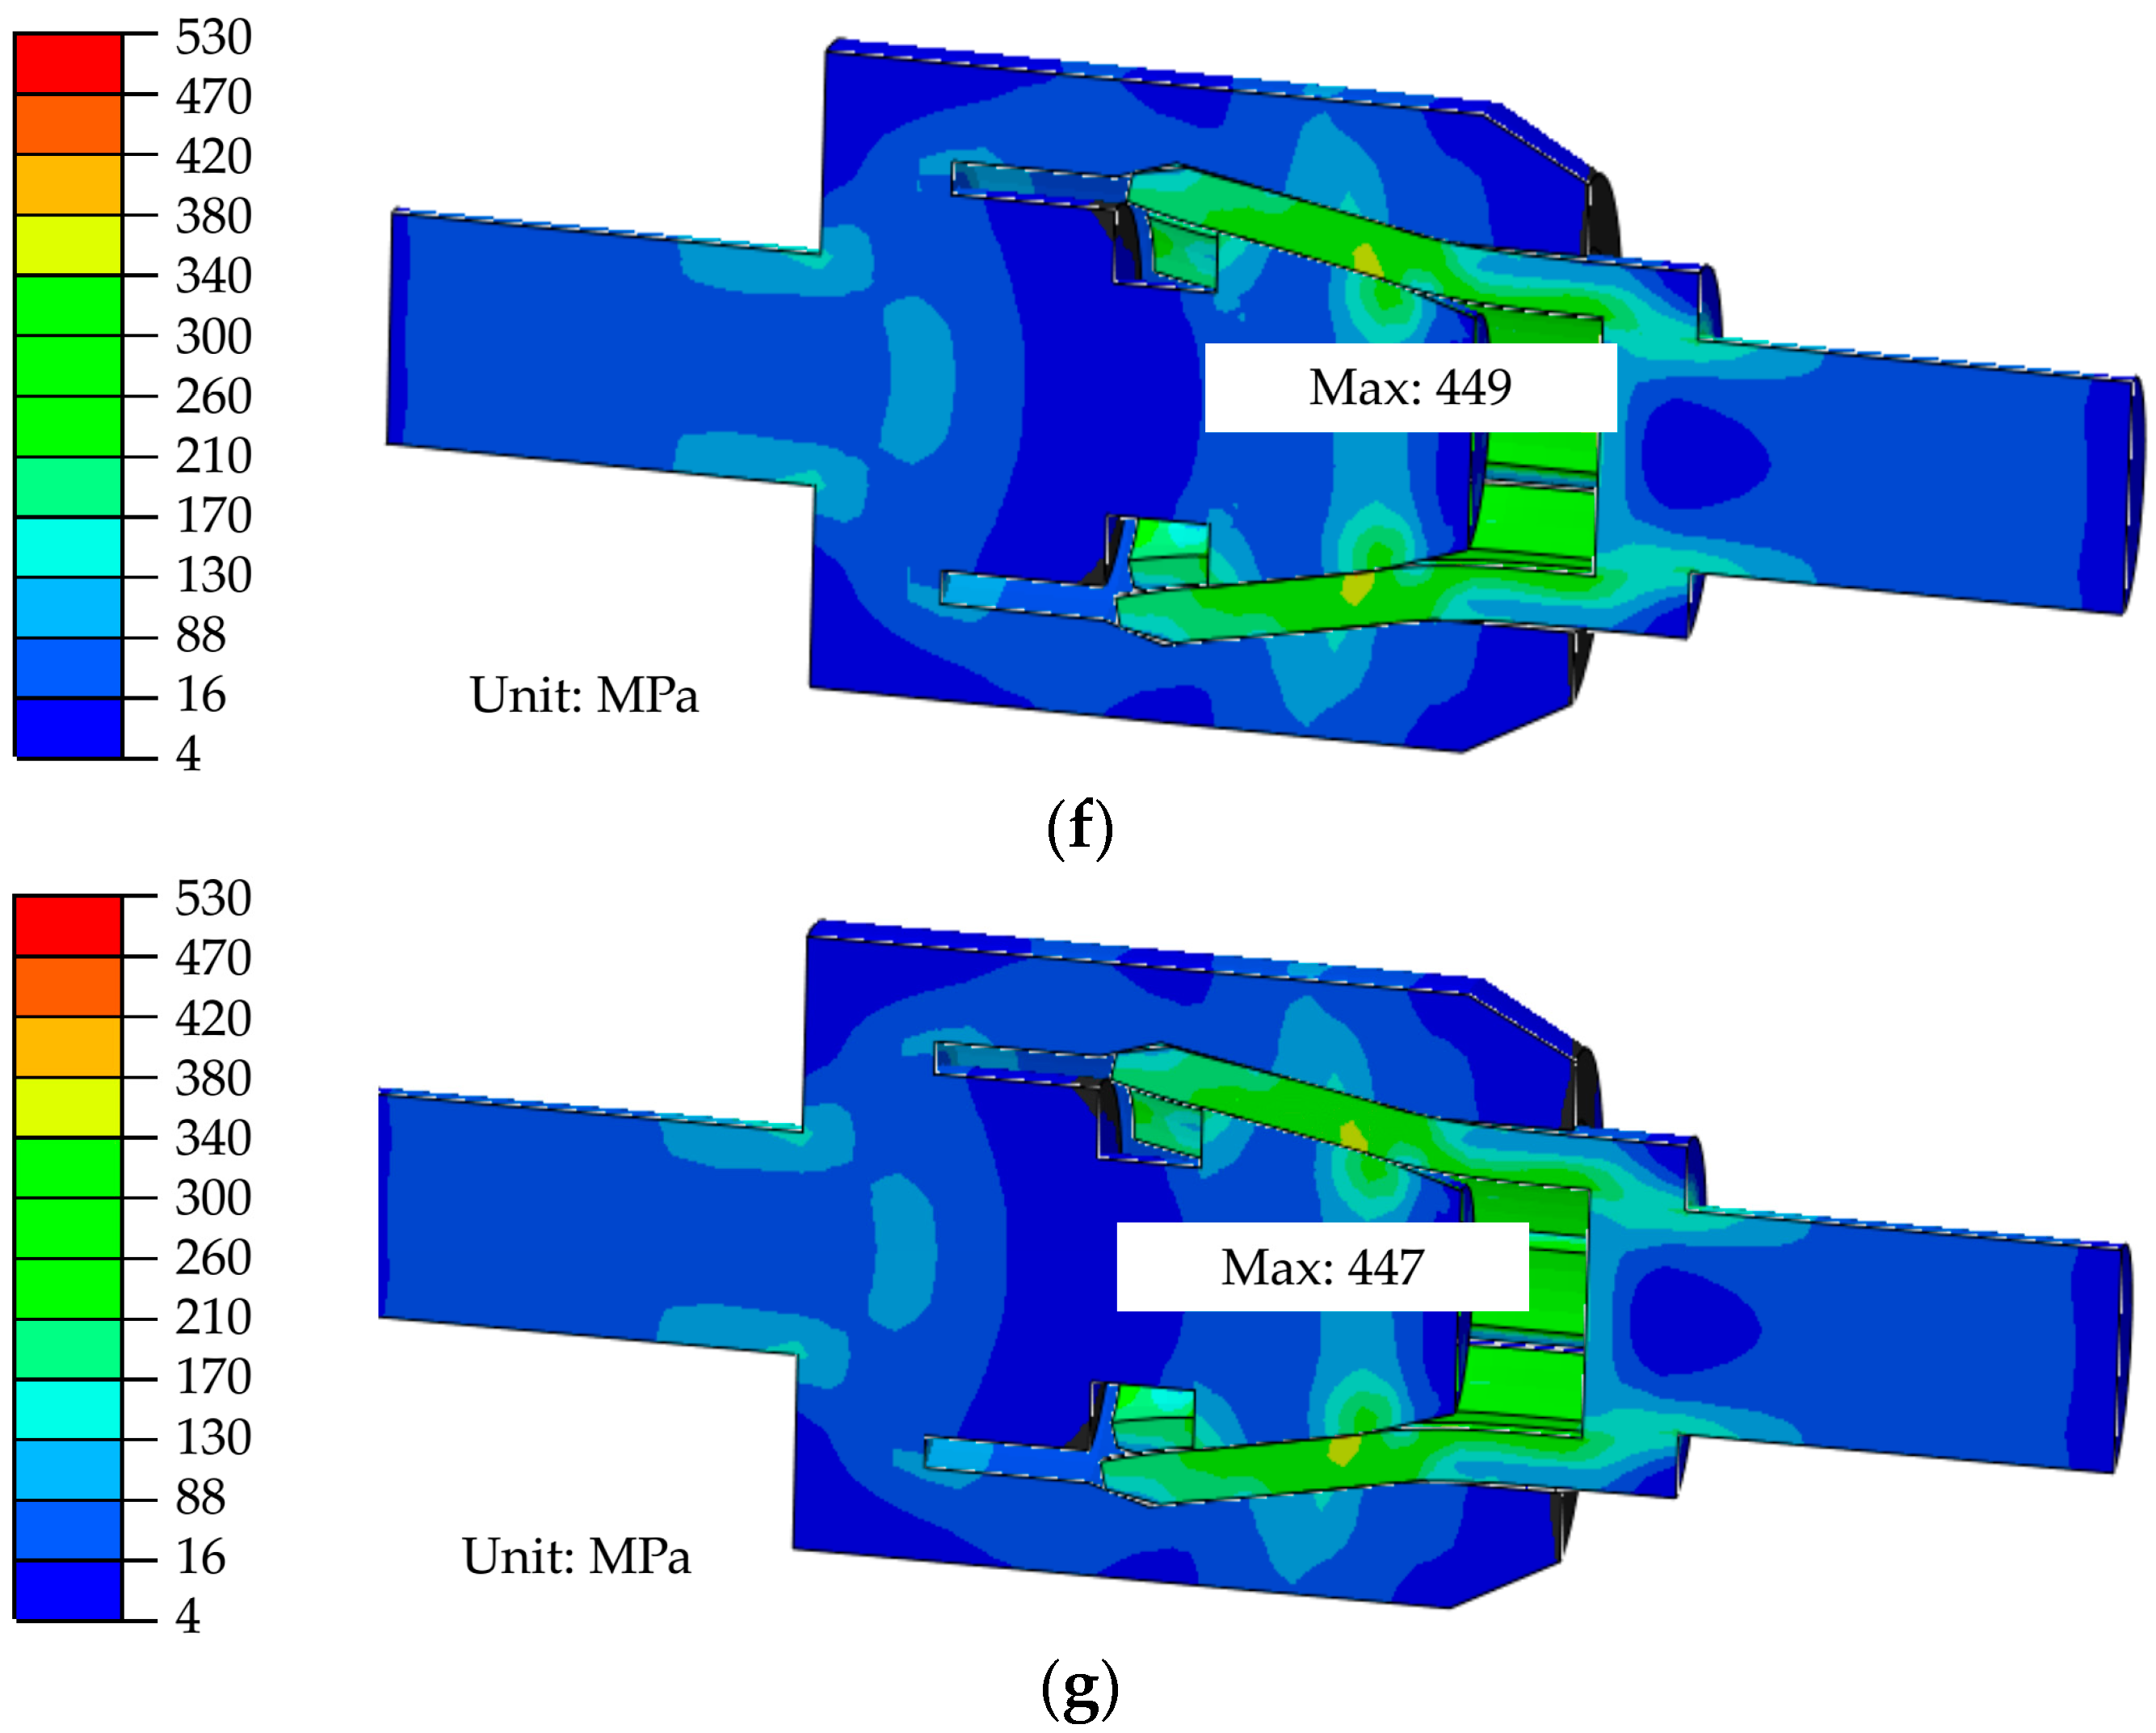
5.2. Stress Distribution Characteristics of Anchor Joint
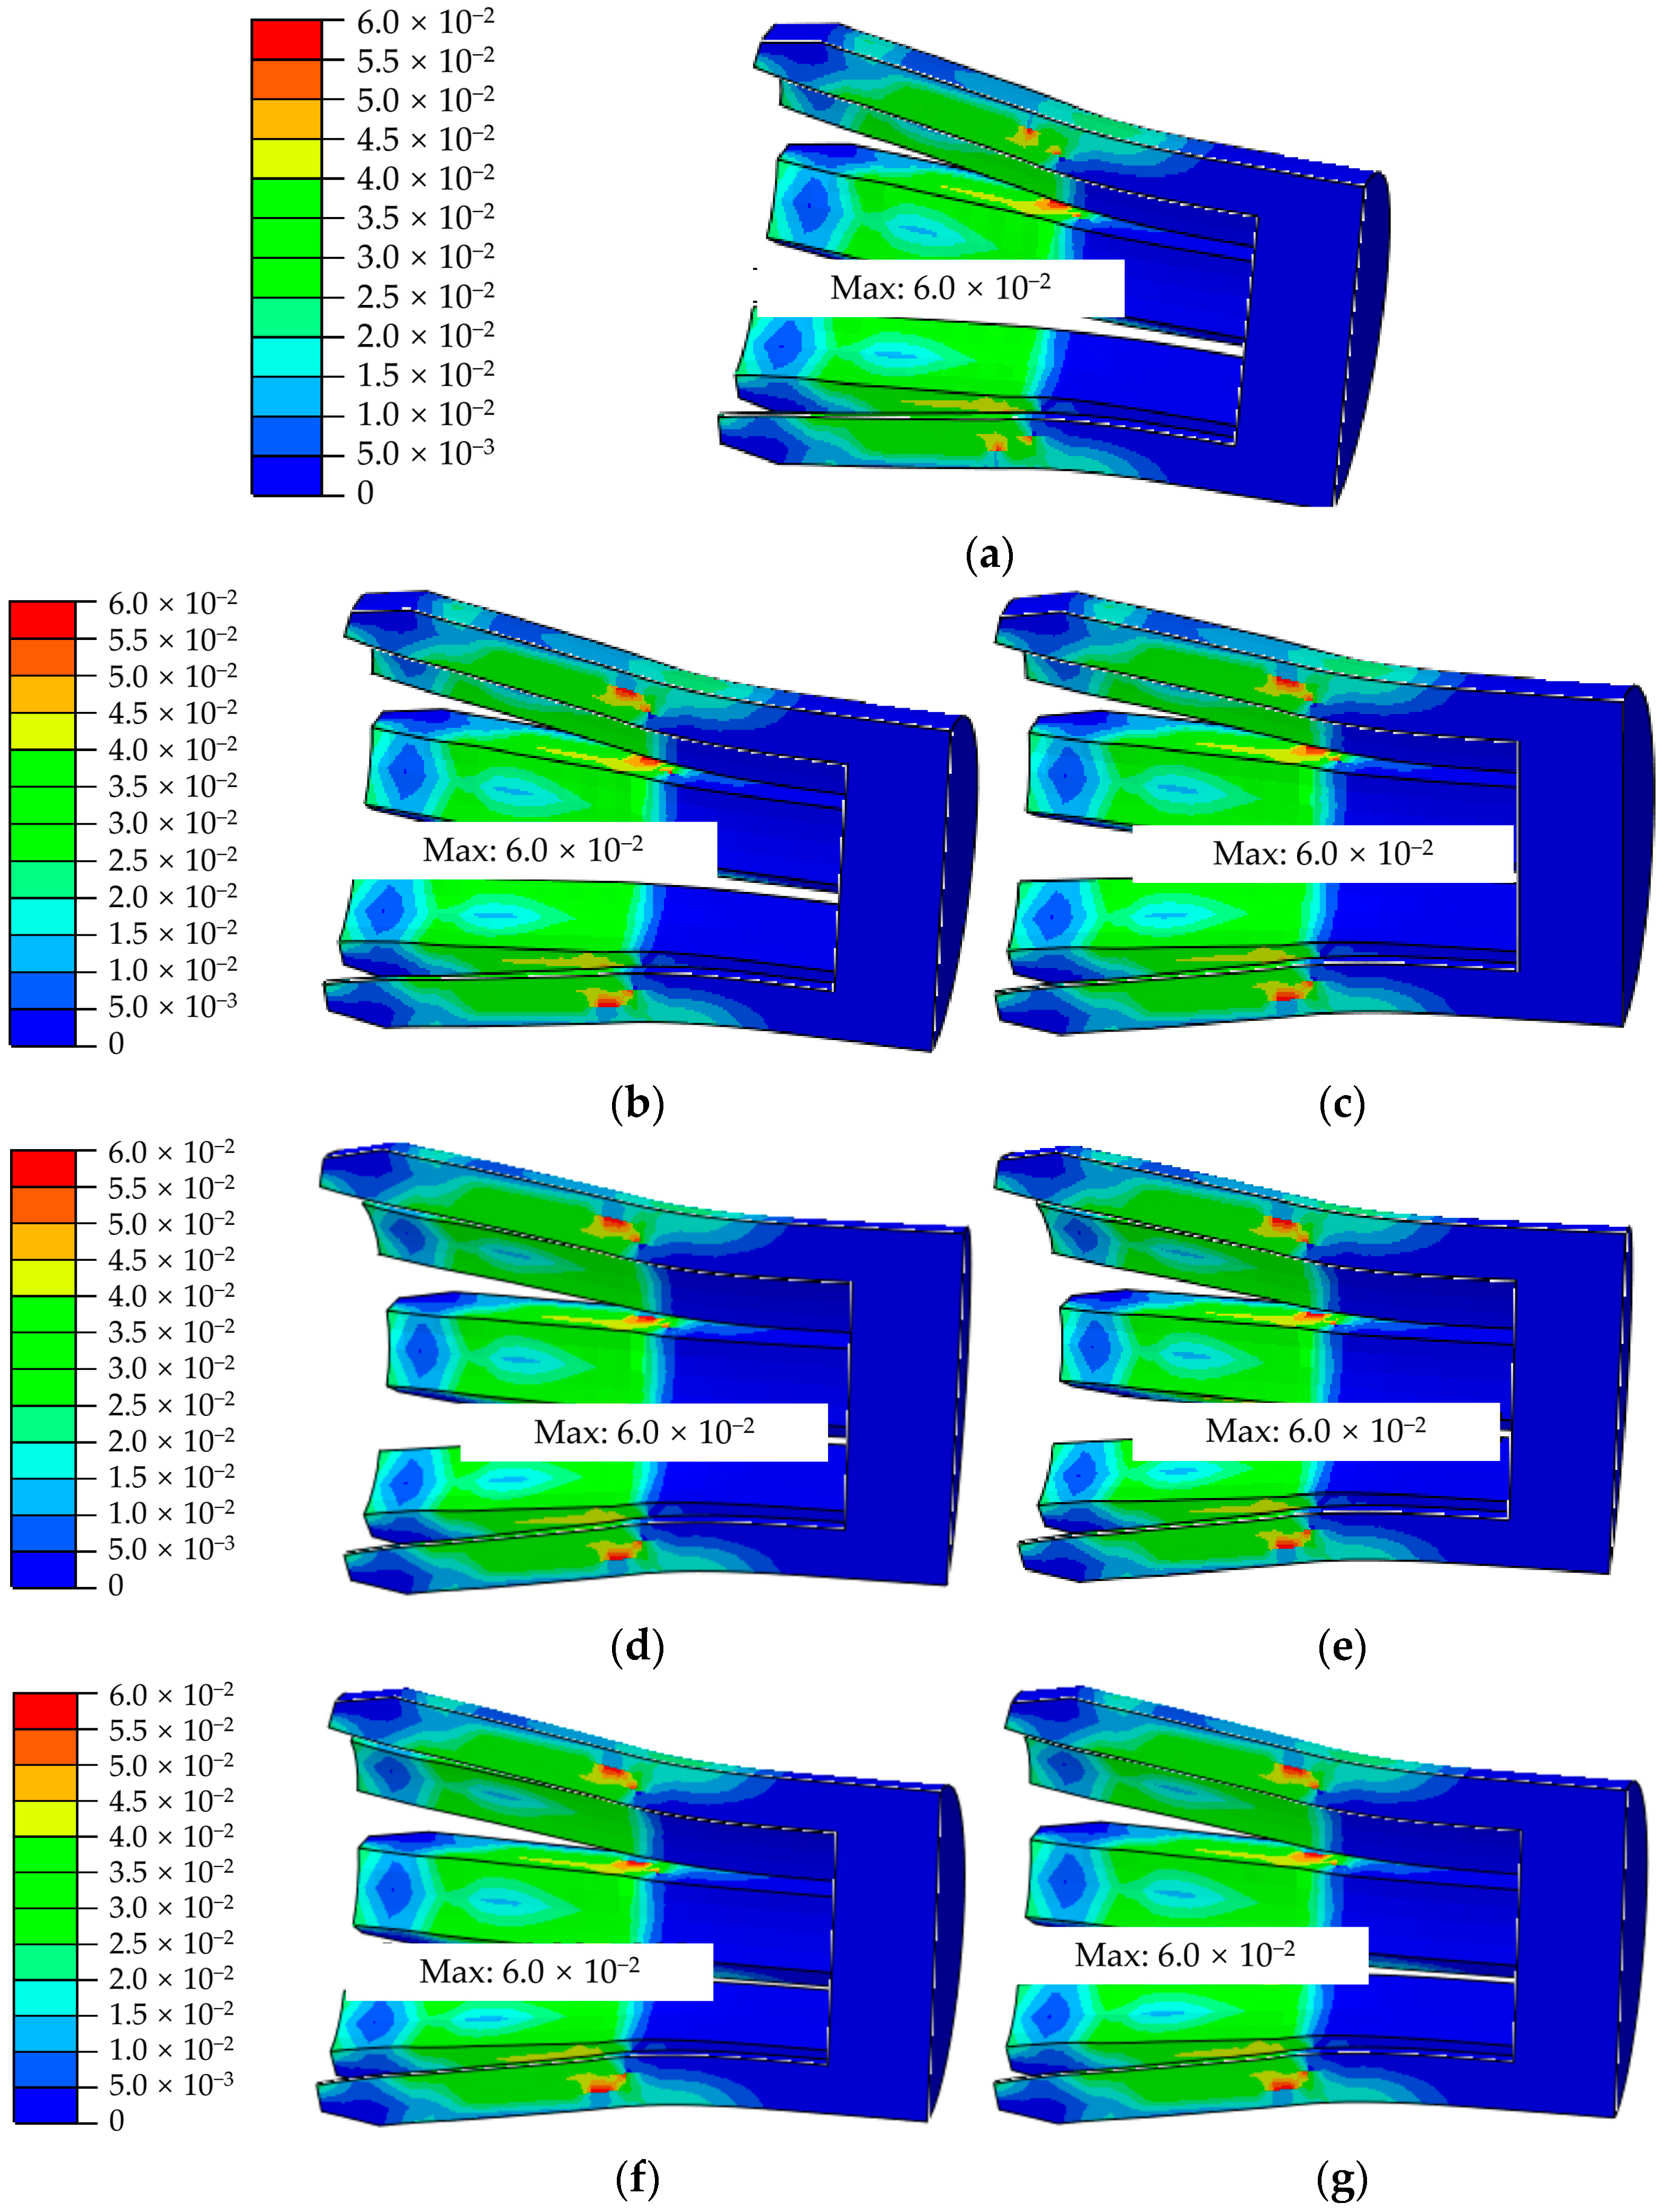
5.3. Strain Response of Anchor Joint
6. Conclusions
- (1)
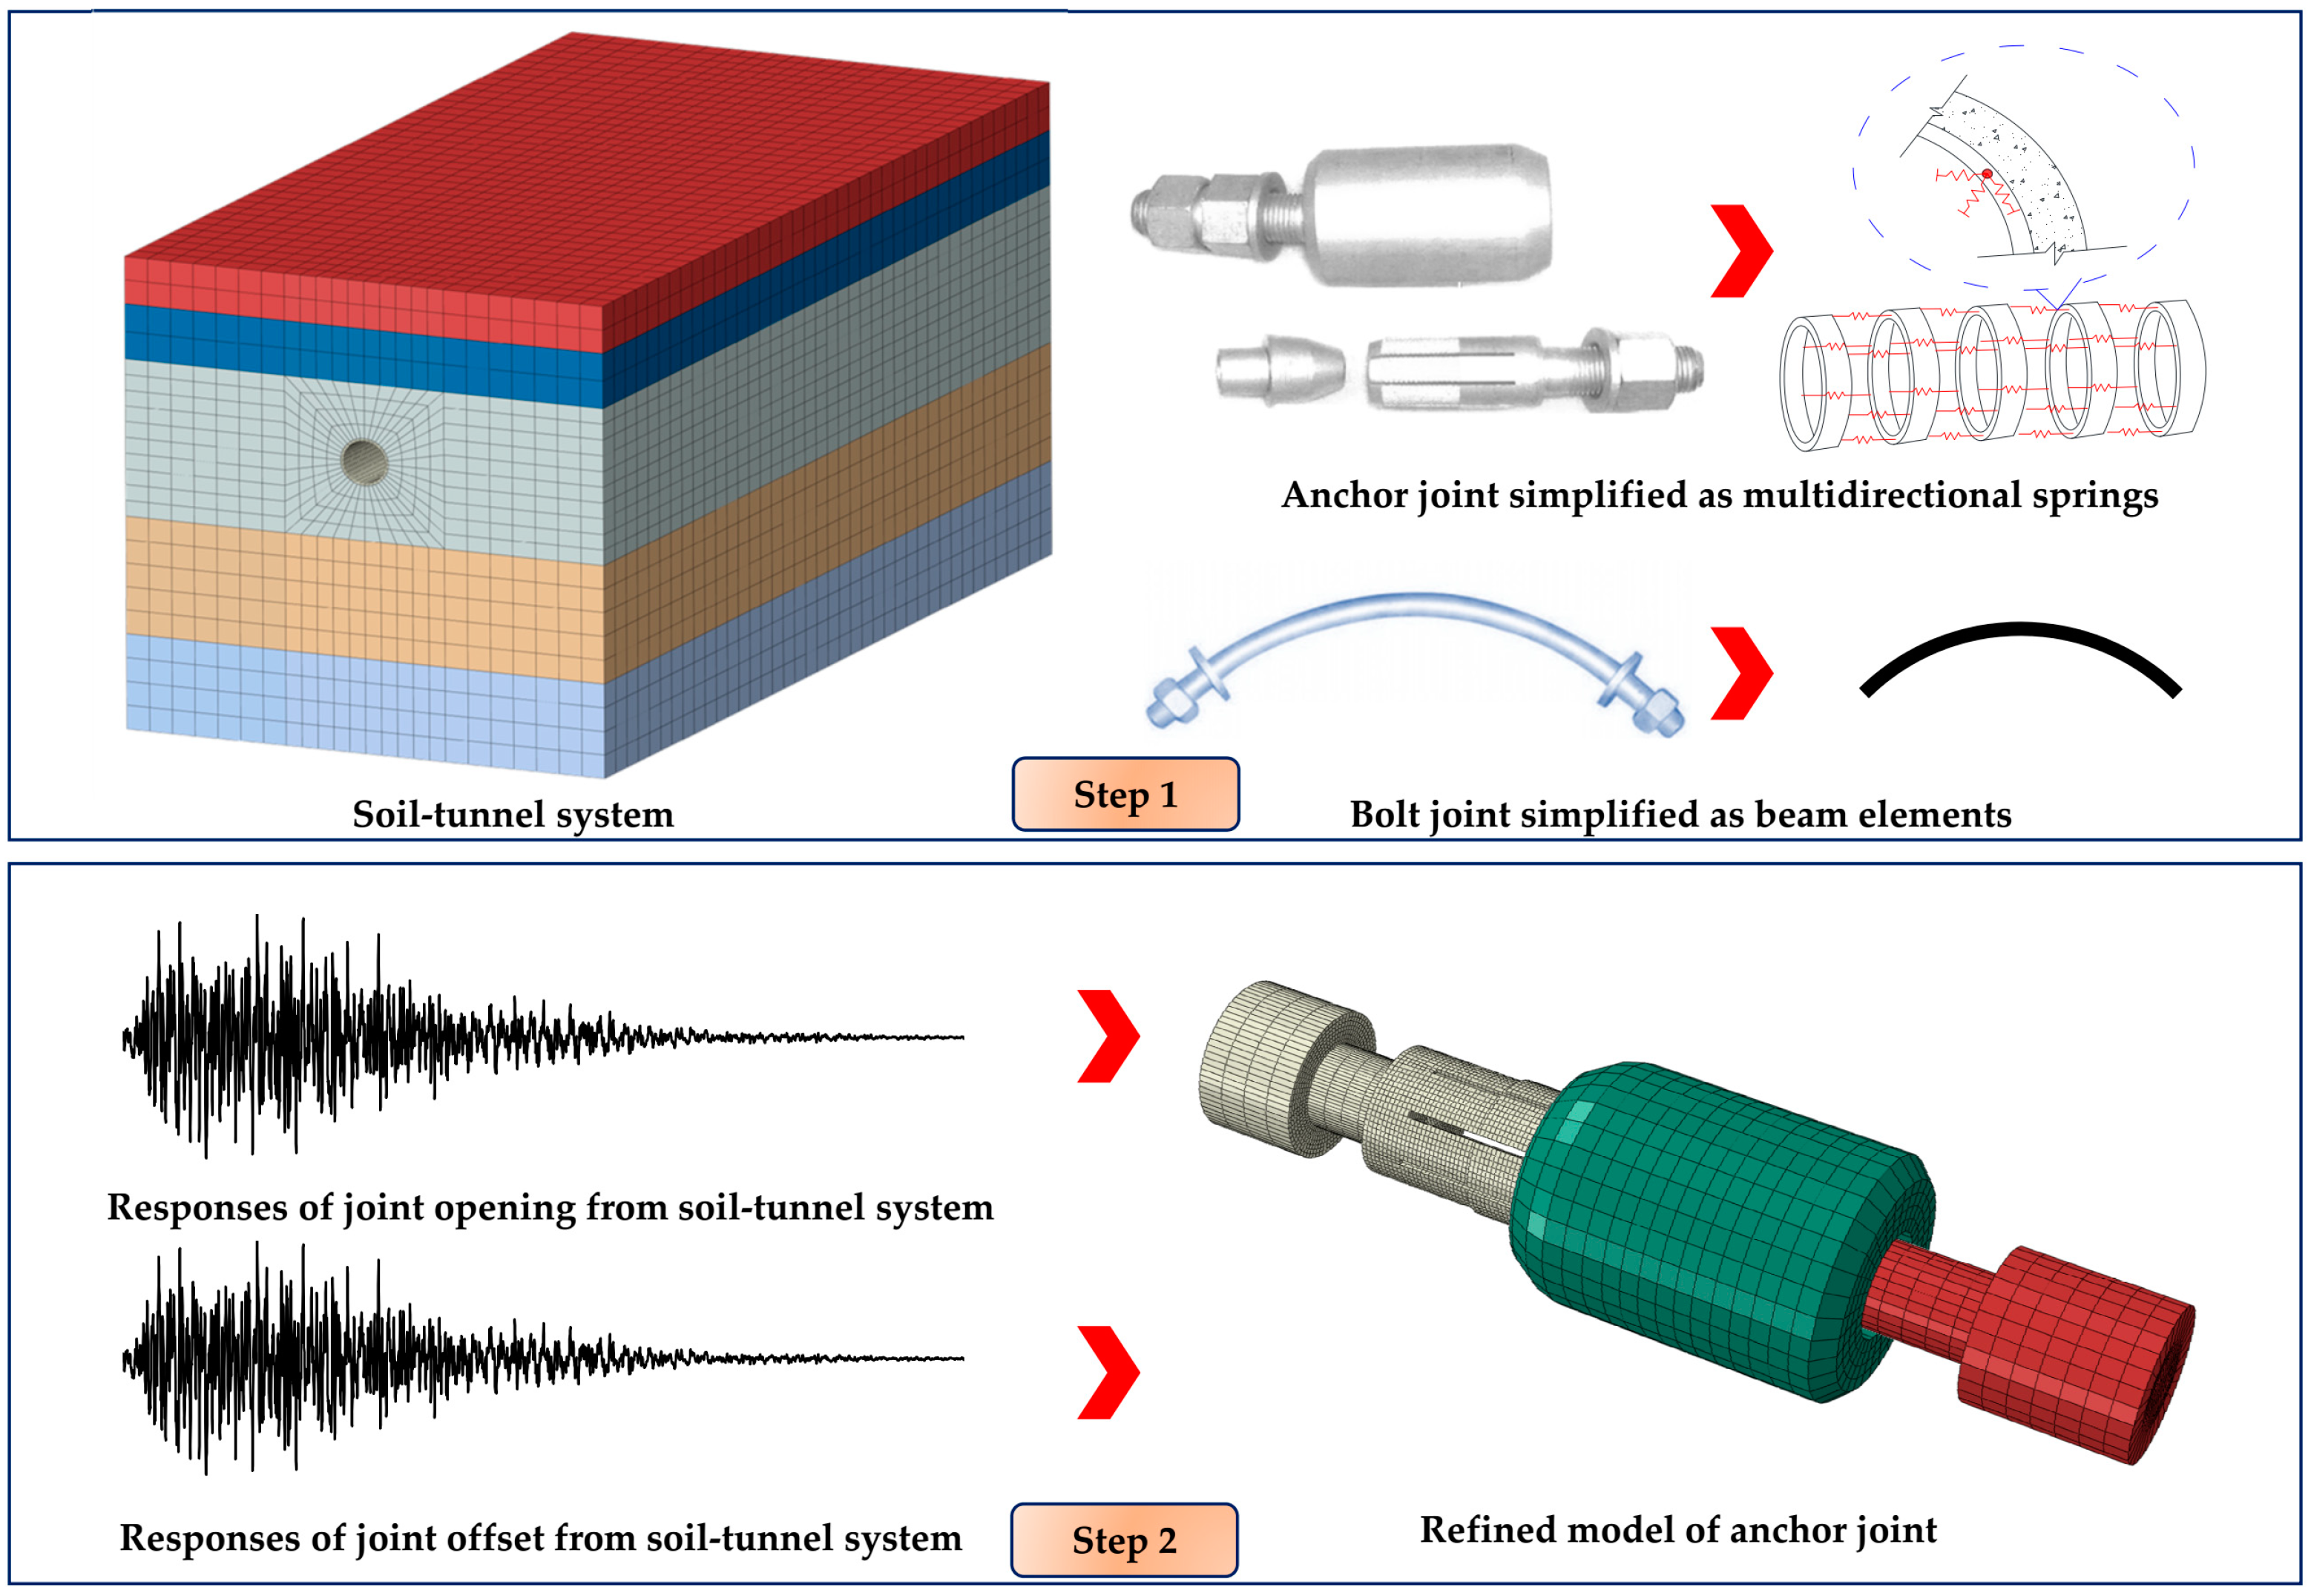
- Combing the dynamic time history method and the response displacement method, an improved approach is proposed for the overall and detailed seismic response study of the anchor joint. Using this method can effectively reduce the modeling difficulty and computing resource consumption caused by the complex structure of the anchor joint.
- (2)
- The maximum opening and offset of the anchor joint under the axial seismic input are greater than those under the transverse seismic input. The distribution features of joint opening and offset are obviously different under different seismic excitations. The seismic action leads to a more negative impact on the joint opening than the joint offset.
- (3)
- Compared with the unidirectional seismic input conditions, the maximum opening and offset of the anchor joint under the bidirectional seismic action are increased. However, the deformation of joints at different locations is rather distinct, which cannot be directly obtained from the sum of results from unidirectional seismic input conditions.
- (4)
- The opening and offset caused by earthquake can cause the separation of the components in the anchor joint, resulting in the decrease of the contact pressure among the components, and further reduce the bearing capacity of the anchor joint. The stress distribution of the sleeve shows obvious changes, while the distribution range of the maximum plastic strain of the sleeve walls is expanded.
- (5)
- For the evaluation on the deformation resistance and post-earthquake performance of the anchor joint, the final deformation of the anchor joint and the cumulative plastic strain of the sleeve can be used as the quantitative indicators.
Author Contributions
Funding
Conflicts of Interest
References
- Editorial Department of China Journal of Highway and Transport. Review on China’s Traffic Tunnel Engineering Research 2022. China J. Highw. Transp. 2022, 35, 1–40. [Google Scholar] [CrossRef]
- Chen, Z.; Liang, S.; Shen, H.; He, C. Dynamic centrifuge tests on effects of isolation layer and cross-section dimensions on shield tunnels. Soil Dyn. Earthq. Eng. 2018, 109, 173–187. [Google Scholar] [CrossRef]
- Gong, C.; Wang, Y.; Ding, W.; Lei, M.; Shi, C. Waterproof Performance of Sealing Gasket in Shield Tunnel: A Review. Appl. Sci. 2022, 12, 4556. [Google Scholar] [CrossRef]
- Zhang, G.; Zhang, W.; Li, H.; Cao, W.; Wang, B.; Guo, W.; Gao, P. Waterproofing behavior of sealing gaskets for circumferential joints in shield tunnels: A full-scale experimental investigation. Tunn. Undergr. Space Technol. 2021, 108, 103682. [Google Scholar] [CrossRef]
- Zhang, G.; Zhang, W.; Cao, W.; Wang, B.; Lai, T.; Guo, W.; Gao, P. A novel test setup for determining waterproof performance of rubber gaskets used in tunnel segmental joints: Development and application. Tunn. Undergr. Space Technol. 2021, 115, 104079. [Google Scholar] [CrossRef]
- Wang, W.L.; Wang, T.T.; Su, J.J.; Lin, C.; Seng, C.R.; Huang, T.H. Assessment of damage in mountain tunnels due to the Taiwan Chi-chi earthquake. Tunn. Undergr. Space Technol. 2001, 16, 133–150. [Google Scholar] [CrossRef]
- Lin, G.; Luo, S.; Ni, J. Damages of Metro Structures Due to Earthquake and Corresponding Treatment Measures. Mod. Tunn. Technol. 2009, 46, 36–41. [Google Scholar]
- Zhang, W.W.; Jin, X.L.; Yang, Z.H. Combined equivalent & multi-scale simulation method for 3-D seismic analysis of large-scale shield tunnel. Eng. Comput. 2014, 31, 584–620. [Google Scholar] [CrossRef]
- Hashash, Y.M.A.; Hook, J.J.; Schmidt, B.; Yao, J.I.C. Seismic design and analysis of underground structures. Tunn. Undergr. Space Technol. 2001, 16, 247–293. [Google Scholar] [CrossRef]
- Wang, X.; Jin, X.; Wang, P.; Yang, Z. Parallel Dynamic Analysis of a Large-Scale Water Conveyance Tunnel under Seismic Excitation Using ALE Finite-Element Method. Appl. Sci. 2016, 6, 36. [Google Scholar] [CrossRef]
- Brandis, A.; Kraus, I.; Petrovčič, S. Simplified Numerical Analysis of Soil–Structure Systems Subjected to Monotonically Increasing Lateral Load. Appl. Sci. 2021, 11, 4219. [Google Scholar] [CrossRef]
- Ma, J.; Han, S.; Gao, X.; Li, D.; Guo, Y.; Liu, Q. Dynamic Lateral Response of the Partially-Embedded Single Piles in Layered Soil. Appl. Sci. 2022, 12, 1504. [Google Scholar] [CrossRef]
- Brachman, R.W.I.; Elshimi, T.M.; Mak, A.C.; Moore, I.D. Testing and Analysis of a Deep-Corrugated Large-Span Box Culvert prior to Burial. J. Bridge Eng. 2012, 17, 81–88. [Google Scholar] [CrossRef]
- Abdel-Sayed, G.; Salib, S.R. Minimum Depth of Soil Cover above Soil–Steel Bridges. J. Geotech. Geoenviron. 2002, 128, 672–681. [Google Scholar] [CrossRef]
- Yeau, K.Y.; Sezen, H.; Fox, P.J. Simulation of Behavior of In-Service Metal Culverts. J. Pipeline Syst. Eng. 2014, 5, 04013016. [Google Scholar] [CrossRef]
- Kasper, T.; Meschke, G. A numerical study of the effect of soil and grout material properties and cover depth in shield tunnelling. Comput. Geotech. 2006, 33, 234–247. [Google Scholar] [CrossRef]
- Maleska, T.; Beben, D. Behaviour of soil-steel composite bridge with various cover depths under seismic excitation. Steel Compos. Struct. 2022, 42, 747–764. [Google Scholar] [CrossRef]
- Maleska, T.; Beben, D.; Nowacka, J. Seismic vulnerability of a soil-steel composite tunnel—Norway Tolpinrud Railway Tunnel Case Study. Tunn. Undergr. Space Technol. 2021, 110, 103808. [Google Scholar] [CrossRef]
- Kuribayashi, E.; Iwasaki, T.; Kawashima, K. Dynamic behaviour of a subsurface tubular structure. Bull. N. Z. Soc. Earthq. 1974, 7, 200–209. [Google Scholar] [CrossRef]
- Luco, J.E.; de Barros, F.C.P. Seismic response of a cylindrical shell embedded in a layered viscoelastic half-space. I: Formulation. Earthq. Eng. Struct. D 1994, 23, 553–567. [Google Scholar] [CrossRef]
- De Barros, F.C.P.; Luco, J.E. Seismic response of a cylindrical shell embedded in a layered viscoelastic half-space. II: Validation and numerical results. Earthq. Eng. Struct. D. 1994, 23, 569–580. [Google Scholar] [CrossRef]
- Kouretzis, G.P.; Bouckovalas, G.D.; Gantes, C.J. 3-D shell analysis of cylindrical underground structures under seismic shear (S) wave action. Soil Dyn. Earthq. Eng. 2006, 26, 909–921. [Google Scholar] [CrossRef]
- Chen, J.; Shi, X.; Li, J. Shaking table test of utility tunnel under non-uniform earthquake wave excitation. Soil Dyn. Earthq. Eng. 2010, 30, 1400–1416. [Google Scholar] [CrossRef]
- An, J.; Tao, L.; Jiang, L.; Yan, H. A shaking table-based experimental study of seismic response of shield-enlarge-dig type’s underground subway station in liquefiable ground. Soil Dyn. Earthq. Eng. 2021, 147, 106621. [Google Scholar] [CrossRef]
- Wang, Z.Z.; Jiang, Y.J.; Zhu, C.A.; Sun, T.C. Shaking table tests of tunnel linings in progressive states of damage. Tunn. Undergr. Space Technol. 2015, 50, 109–117. [Google Scholar] [CrossRef]
- Wang, F.; Jiang, X.; Niu, J. The Large-Scale Shaking Table Model Test of the Shallow-Bias Tunnel with a Small Clear Distance. Geotech. Geol. Eng. 2017, 35, 1093–1110. [Google Scholar] [CrossRef]
- Chen, G.; Ruan, B.; Zhao, K.; Chen, W.; Zhuang, H.; Du, X.; Khoshnevisan, S.; Juang, C.H. Nonlinear Response Characteristics of Undersea Shield Tunnel Subjected to Strong Earthquake Motions. J. Earthq. Eng. 2020, 24, 351–380. [Google Scholar] [CrossRef]
- Miao, Y.; Yao, E.; Ruan, B.; Zhuang, H. Seismic response of shield tunnel subjected to spatially varying earthquake ground motions. Tunn. Undergr. Space Technol. 2018, 77, 216–226. [Google Scholar] [CrossRef]
- Amorosi, A.; Boldini, D.; Falcone, G. Numerical prediction of tunnel performance during centrifuge dynamic tests. Acta Geotech. 2014, 9, 581–586. [Google Scholar] [CrossRef]
- Lee, K.M.; Hou, X.Y.; Ge, X.W.; Tang, Y. An analytical solution for a jointed shield-driven tunnel lining. Int. J. Numer. Anal. Methods Geomech. 2001, 25, 365–390. [Google Scholar] [CrossRef]
- Zhao, T.; Liu, W.; Ye, Z.; Mosallam, A.S. Effects of Water Inrush from Tunnel Excavation Face on the Deformation and Mechanical Performance of Shield Tunnel Segment Joints. Adv. Civ. Eng. 2017, 2017, 5913640. [Google Scholar] [CrossRef]
- Jin, H.; Yu, S.; Zhou, S.; Xiao, J. Research on Mechanics of Longitudinal Joint in Shield Tunnel by the Nonlinear Spring Equivalent Method. KSCE J. Civ. Eng. 2018, 23, 902–913. [Google Scholar] [CrossRef]
- Zhang, W.; Zhang, Q.; Cao, W. Study on Stress and Deformation of Bolt Joints of Shield Tunnel under Static and Seismic Action. KSCE J. Civ. Eng. 2021, 25, 3146–3159. [Google Scholar] [CrossRef]
- Liu, Y.; Zhang, M.; Li, P.; Wang, B.; Wang, L.; Yuan, P. Experiments on the seismic performance of Y-shape joints of subway stations built by enlarging two parallel shield tunnels. Tunn. Undergr. Space Technol. 2021, 115, 104048. [Google Scholar] [CrossRef]
- Yang, C.; Mo, H.; Chen, J.; Wang, Y.; Giunta, G.; Guan, Z. Influence of Seismic Loading on Segment Opening of a Shield Tunnel. Sci. World J. 2014, 2014, 387210. [Google Scholar] [CrossRef]
- Yan, Q.X.; Bao, R.; Chen, H.; Li, B.J.; Chen, W.Y.; Dai, Y.W.; Zhou, H.Y. Dynamic response and waterproof property of tunnel segmental lining subjected to earthquake action. Earthq. Struct. 2019, 17, 411–424. [Google Scholar] [CrossRef]
- Zhang, W.; Zhang, G.; Lei, H. Research on Shear Performance of FRP-Key Joint for Shield Tunnel and Rationality of Arrangement Based on Plastic-damage Model. China J. Highw. Transp. 2017, 30, 38–48. [Google Scholar] [CrossRef]
- Shirato, M.; Furuichi, K.; Takimoto, K.; Hara, H.; Mukuno, K.; Yoshida, K. Development of New Composite Segment and Application to the Tunneling Project. J. JSCE 2003, 728, 157–174. [Google Scholar] [CrossRef]
- Nakajima, S.; Akiyama, S.; Yasaka, M.; Sato, H.; Mukuno, K. Development of the Axial-Slide Ductile Segment. Tunn. Eng. Res. Rep. 1998, 8, 39–46. [Google Scholar]
- Zhang, W.; Zhang, G.; Su, R.; Jin, M. Numerical Study on Influence of Manufacturing Process on Mechanical Properties of Longitudinal Anchor Joint for Shield Tunnel. Tunn. Constr. 2016, 36, 150–157. [Google Scholar] [CrossRef]
- Wang, R.; Han, L.; Zhao, X.; Rasmussen, K.J.R. Analytical behavior of concrete filled double steel tubular (CFDST) members under lateral impact. Thin Wall Struct. 2016, 101, 129140. [Google Scholar] [CrossRef]
- Takeuchi, T.; Emori, Y.; Suda, Y.; Koizumi, A. Influence on segments by jack thrust of shield-driven tunneling. Doboku Gakkai Ronbunshuu F 2010, 66, 599–611. [Google Scholar] [CrossRef][Green Version]
- Gu, Y.; Liu, J.; Du, Y. 3D consistent viscous-spring artificial boundary and viscous-spring boundary element. Eng. Mech. 2007, 24, 31–37. [Google Scholar]
- Xu, C.; Song, J.; Du, X.; Zhong, Z. A completely explicit finite element method for solving dynamic u-p equations of fluid-saturated porous media. Soil Dyn. Earthq. Eng. 2017, 97, 364–376. [Google Scholar] [CrossRef]
- Zhang, X.; Far, H. Effects of dynamic soil-structure interaction on seismic behaviour of high-rise buildings. Bull. Earthq. Eng. 2022, 20, 3443–3467. [Google Scholar] [CrossRef]


| Uniaxial Compressive Stress/(MPa) | Uniaxial Inelastic Compressive Strain | Compressive Damage dc | Uniaxial Tensile Stress/(MPa) | Uniaxial Cracking Tensile Strain | Tensile Damage dt |
|---|---|---|---|---|---|
| 7.239 | 0 | 0 | 2.720 | 0 | 0 |
| 22.122 | 6.77 × 10⁻⁵ | 0.032 | 2.216 | 8.28 × 10⁻⁵ | 0.293 |
| 32.149 | 2.25 × 10⁻⁴ | 0.112 | 1.682 | 1.33 × 10⁻⁴ | 0.447 |
| 34.258 | 7.68 × 10⁻⁴ | 0.241 | 1.426 | 1.72 × 10⁻⁴ | 0.579 |
| 29.164 | 1.23 × 10⁻³ | 0.447 | 1.218 | 2.26 × 10⁻⁴ | 0.652 |
| 23.297 | 2.51 × 10⁻³ | 0.622 | 0.982 | 2.58 × 10⁻⁴ | 0.742 |
| 19.332 | 3.56 × 10⁻³ | 0.741 | 0.872 | 2.93 × 10⁻⁴ | 0.791 |
| 14.265 | 4.12 × 10⁻³ | 0.823 | 0.783 | 3.24 × 10⁻⁴ | 0.824 |
| 11.173 | 4.83 × 10⁻³ | 0.872 | 0.691 | 3.63 × 10⁻⁴ | 0.857 |
| 10.293 | 5.63 × 10⁻³ | 0.894 | 0.635 | 3.94 × 10⁻⁴ | 0.872 |
| 8.973 | 6.58 × 10⁻³ | 0.928 | 0.593 | 4.32 × 10⁻⁴ | 0.894 |
| 7.254 | 7.24 × 10⁻³ | 0.933 | 0.551 | 4.69 × 10⁻⁴ | 0.912 |
| 4.982 | 8.73 × 10⁻³ | 0.973 | 0.514 | 4.92 × 10⁻⁴ | 0.939 |
| Layer | Density/ (kg/m3) | Shear Wave Velocity/(m/s) | Poisson’s Ratio | Friction Angle/(°) | Cohesion/ (kPa) |
|---|---|---|---|---|---|
| Slit | 1720 | 180 | 0.45 | 36 | 10 |
| Clay | 1780 | 220 | 0.32 | 32 | 18 |
| Silty clay | 1840 | 270 | 0.38 | 30 | 26 |
| Sand | 1950 | 340 | 0.25 | 40 | 2 |
| Bedrock | 1920 | 600 | 0.20 | - | - |
| Case No. | Incident Direction | Transverse Direction | Peak Acceleration | Axial Direction | Peak Acceleration |
|---|---|---|---|---|---|
| 1 | Transverse | Wave 1 | 0.15 g | - | - |
| 2 | Axial | - | - | Wave 1 | 0.15 g |
| 3 | Two-directional | Wave 1 | 0.15 g | Wave 1 | 0.1275 g |
| 4 | Transverse | Wave 2 | 0.15 g | - | - |
| 5 | Axial | - | - | Wave 2 | 0.15 g |
| 6 | Two-directional | Wave 2 | 0.15 g | Wave 2 | 0.1275 g |
Publisher’s Note: MDPI stays neutral with regard to jurisdictional claims in published maps and institutional affiliations. |
© 2022 by the authors. Licensee MDPI, Basel, Switzerland. This article is an open access article distributed under the terms and conditions of the Creative Commons Attribution (CC BY) license (https://creativecommons.org/licenses/by/4.0/).
Share and Cite
Zhang, G.; Zhang, W.; Qi, J.; Niu, R.; Zhang, C. Seismic Response Analysis of Anchor Joint in Shield–Driven Tunnel Considering Soil–Structure Interaction. Appl. Sci. 2022, 12, 6362. https://doi.org/10.3390/app12136362
Zhang G, Zhang W, Qi J, Niu R, Zhang C. Seismic Response Analysis of Anchor Joint in Shield–Driven Tunnel Considering Soil–Structure Interaction. Applied Sciences. 2022; 12(13):6362. https://doi.org/10.3390/app12136362
Chicago/Turabian StyleZhang, Gaole, Wenjun Zhang, Jianbing Qi, Rongjian Niu, and Chi Zhang. 2022. "Seismic Response Analysis of Anchor Joint in Shield–Driven Tunnel Considering Soil–Structure Interaction" Applied Sciences 12, no. 13: 6362. https://doi.org/10.3390/app12136362
APA StyleZhang, G., Zhang, W., Qi, J., Niu, R., & Zhang, C. (2022). Seismic Response Analysis of Anchor Joint in Shield–Driven Tunnel Considering Soil–Structure Interaction. Applied Sciences, 12(13), 6362. https://doi.org/10.3390/app12136362