Abstract
Leukemia is a form of blood cancer that develops when the human body’s bone marrow contains too many white blood cells. This medical condition affects adults and is considered a prevalent form of cancer in children. Treatment for leukaemia is determined by the type and the extent to which cancer has developed across the body. It is crucial to diagnose leukaemia early in order to provide adequate care and to cure patients. Researchers have been working on advanced diagnostics systems based on Machine Learning (ML) approaches to diagnose leukaemia early. In this research, we employ deep learning (DL) based convolutional neural network (CNN) and hybridized two individual blocks of CNN named CNN-1 and CNN-2 to detect acute lymphoblastic leukaemia (ALL), acute myeloid leukaemia (AML), and multiple myeloma (MM). The proposed model detects malignant leukaemia cells using microscopic blood smear images. We construct a dataset of about 4150 images from a public directory. The main challenges were background removal, ripping out un-essential blood components of blood supplies, reduce the noise and blurriness and minimal method for image segmentation. To accomplish the pre-processing and segmentation, we transform RGB color-space into the greyscale 8-bit mode, enhancing the contrast of images using the image intensity adjustment method and adaptive histogram equalisation (AHE) method. We increase the structure and sharpness of images by multiplication of binary image with the output of enhanced images. In the next step, complement is done to get the background in black colour and nucleus of blood in white colour. Thereafter, we applied area operation and closing operation to remove background noise. Finally, we multiply the final output to source image to regenerate the images dataset in RGB colour space, and we resize dataset images to [400, 400]. After applying all methods and techniques, we have managed to get noiseless, non-blurred, sharped and segmented images of the lesion. In next step, enhanced segmented images are given as input to CNNs. Two parallel CCN models are trained, which extract deep features. The extracted features are further combined using the Canonical Correlation Analysis (CCA) fusion method to get more prominent features. We used five classification algorithms, namely, SVM, Bagging ensemble, total boosts, RUSBoost, and fine KNN, to evaluate the performance of feature extraction algorithms. Among the classification algorithms, Bagging ensemble outperformed the other algorithms by achieving the highest accuracy of 97.04%.
1. Introduction
Biomedical image processing has played a significant role in the detection of various diseases, enabling computers to replace human experts [1]. Blood supplies oxygen and nutrients to body cells to keep them alive [2]. Blood is a mixture of white cells, red cells, plasma, and platelets [3]. Cancer is the rapid formation of aberrant cells that expand beyond their normal bounds, allowing them to infect neighboring body parts and spread to other organs [4]. Blood cancer is also called leukaemia. The entomology of leukaemia is from the Greek word “leukos”, which means “white”, and “aim” means “blood” [5]. This type of cancer starts formation in the bone marrow and causes uncontrollable excess or morphological disturbance of leucocytes in the blood [6]. In 2018, cancer was the world’s second-largest cause of death, which killed 9.6 million people and reported 18.1 million new cases worldwide [7]. One out of six deaths around the world is due to cancer. It becomes even severe in underdeveloped countries where the death rate due to cancer increases to 70 percent of the total number of deaths [8]. According to World Health Organization (WHO), the mortality statistics of Pakistan in 2018 reported 173,937 deaths caused by cancer. Among other blood diseases, leukaemia is considered the most harmful. In Pakistan, Leukaemia is ranked fifth among the other cancers, which caused around 5000 deaths and 7139 new cases of leukemia in the year 2019 [9] (World Health Organization, 2019). According to the American cancer society, leukaemia caused an estimated 595,690 deaths only in United States in 2016 [1], around 60,300 (3.5%) new leukaemia patients were registered in 2018, and 399,967 people diagnosed with leukaemia since 2019 [6]. Table 1 shows number of registered cases and estimated deaths in 2019 due to leukemia. Leukaemia is a life-threatening disease, and if not treated at an early stage, it may lead to death. Therefore, there is a dire need for fast detection and cure of Leukaemia [10,11].

Table 1.
Estimated deaths from all types of leukaemia, 2019 (USA) [12].
Microscopic images of blood are used to detect leukemia. Hematologists or lab experts analyze these images. Hematologists or lab experts use different techniques to detect cancer, including fluorescence saturation, hybridization, immunophenotyping, cytogenic analysis, and cytochemistry. The earlier methods are expensive to test cancer and have certain limitations; these procedures are not widely available at laboratories. Moreover, these methods require manual observation, and also, they are not much time-efficient as it is a manual methods. The obtained findings of the disease report rely on conditions such as the hematologist’s expertise, skills, and fatigue. So, keen observation is required by the pathologists [10]. As a result, a cost-effective, automated, and reliable method for detecting leukaemia is needed. Pathologists can speed up and improve the precision of their evaluations by using automatic microscopic examination of blood samples [13]. The automation process overcomes the possible difficulties of manual diagnosis; it is essential to simplify the diagnosis by creating an automatic classifier. Several computer-aided diagnostic methods for distinguishing the characteristics of healthy and blast cells have been established in recent decades [14]. Furthermore, testing microscopic images is less costly, and lab equipment is not needed for research [1].
Machine Learning-based networks [15,16] have been used extensively to extract valuable patterns for prediction tasks in several fields [17], including medical diagnostics systems. Death rates can be lessened if the disease is diagnosed earlier and treated in the meantime. It creates a desperate situation, and it consumes much time to detect the disease manually by the hematologist. The detection of leukaemia through computer-aided techniques is very effective, time-efficient, and accurate in overcoming these problems [18]. Still, there are multiple problems, barriers, and research gaps in the computer-aided system, such as the accuracy of leukaemia cancer and its types (Acute Myelogenous Leukaemia, Acute Lymphoblastic Leukaemia, and Multiple Myeloma), and further their segmentation, and classification. In this research, we focus on detecting leukemia and further identifying its subtype [19].
Moreover, there are a few more problems like the size of malignant tumor and resemblance between types of leukemia. Noise in high resolution images is a challenging task for machine learning and deep learning techniques to handle. Extraction of relevant feature play a vital role in determining classification accuracy. There is a need to detect and remove redundant and irrelevant feature to reduce computational complexity and to enhance accuracy. The contribution of this paper are as under:
- Efficient detection of leukaemia cancer, types of leukaemia, and sub-types.
- Background elimination, removing non-essential blood supplies, image enhancement, and noise removal mechanism to get dense features.
- Handcrafted based feature extraction and fusion from CNN layers and concatenation of features using CCA, Serial, and PCA.
- Segregation into malignant and non-malignant classes with their sub types.
The remaining sections of the paper enclose the content as: The review of similar work on leukaemia is expressed in Section 2. Section 3 demonstrates the proposed methodology, including image acquisitions, pre-processing, data augmentation, and image classification. Section 4 exemplifies the statistical results gathered after training models by two custom build CNNs. The study is concluded in Section 5.
2. Related Work
Pre-processing is an essential step in improving the aesthetics of medical imaging. Many methods exist for pre-processing to render the image noiseless and clean and improve image quality.
A multiple image pre-processing technique was used to identify the WBC. They started by converting the RGB color scheme to CMYK. Then, they used contrast stretching to eliminate background noise before adding the Gaussian filter. They then used a color-based clustering strategy for segmentation. Finally, binary Support Vector Machines (SVM) were deployed to categorize the images. In this classifier, the input data is translated into a higher dimensional feature space, and the maximum margin hyperplane was divided into relevant classes [11].
One researcher [20] enhanced image quality by changing rotation (rotated images from the center between 0 and 360 degrees; for data augmentation, adjusting degrees to 12 degrees), illumination, contrast, shearing, horizontal and vertical flip, and translation. Following that, they conditioned a ten-layer convolution neural network CNN architecture. This architecture accomplished two critical tasks. The first task was to extract features from an input image, and the second task was to identify the extracted features using studied CNN features.
Several arithmetic operations and methods were established in their work to remove noise and improve image quality. Then, gamma correction and contrast-enhancing techniques are used. Account accuracy relies heavily on segmentation. They used a two-step protocol for image segmentation, one of which is leukocyte localization and the other is f region extraction. They both had three sub-steps. Sub-steps include localization, thresholding three-phase filtration, neighboring cell identification, and cell extraction. At the same time, the nucleus area was extracted by nucleus localization, nucleus isolation, and cytoplasm extraction [21].
To improve image consistency and quality, the researcher converted the original RGB image to Hue-Saturated-Value (HSV) color space. After that, an HSV threshold was multiplied by a Boolean mask of images determined using pixel values. Then, in the blob detection phase, they collected relevant information from leukocytes. Following the pre-processing method, the watershed algorithm was used to segment leukocytes. Later, scientists used the CCN model to remove features. Following that, they classified their dataset using three linear support vector machine models [22].
The procedures of a researcher were examined in two stages. In the first step, they differentiated between red, blue, and green colors in images. In the second step, they transformed images to grayscale. Grayscale images are then filtered for histogram equalization and linear contrast stretching separately. They suggested a three-step segmentation technique, the first of which was WBC extraction, followed by nucleus extraction. The researcher extracted white blood cells using a color segmentation methodology in the first step. Then, in the second stage, they extracted a nucleus using histogram equalization and linear contrast stretching [23].
Another study found that blood cells and their backgrounds differ greatly depending on color and intensity. The primary causes of this inconsistency are lighting variations, camera settings, and staining. As a result, cell segmentation can be made more resilient against such variables by converting the image from RGB to YCbCr. Contrast stretching was performed on the luminance intensity plane (Y channel) to improve details. After applying contrast stretching, the resulting image was found in greyscale, later converted back to YCbCr mode. Finally, the YCbCr color scheme was changed back to the samples’ original color scheme (RGB). Diffused-expectations-maximisation (DEM) approach to achieving segmentation requires two thresholds. The Gaussian mixture component determines the area class, and their parameters are approximated using the maximal feasibility approach. In addition, they used a sparse representation classifier to characterize the extracted features [24].
Initially, the researchers [18] improved the visual information quality of each input image using various pre-processing and augmentation techniques. They suggested a hybrid architecture built on pre-trained CNN models (MobileNet and VGG16) for disease classification.
The research has also converted RGB images into a CMYK color system. After that, images with updated color spaces are supplied to histogram equalization and thresholding. The method of segmentation was Zak’s algorithm. Before proceeding with Zak’s algorithm, intensity values are generated by histogram on the image dataset. After that, values of thresholding were produced by Zak’s algorithm. To classify microscopic images, They used K-NN, SVM-RBF, SVM-L, SVM-P, NB-G, NBK, and TREE in different scenarios, but K-NN achieved the best classification accuracy [25].
Some researchers have changed the color space from RGB to Greyscale, and further, they implemented median filtration to remove noise [26,27]. Global thresholding is applied to the blood samples to extract different objects at different pixel intensities. For classification, they tested multiple classifiers on microscopic images. They used support vector machines (SVM), smooth support vector machines (SSV), k-nearest neighbor, probabilistic neural network (PNN), and adaptive neuro-fuzzy inference (ANFI) system [26].
Researchers have changed the color space of resized RGB images to CMYK and applied the L*a*b color system. In segmentation, writers used two color space systems for the segmentation: CMYK and L*a*b of white blood [28].
After acquiring the sample images, the author transforms color space from RGB to CIE L*a*b, which helps reduce the color dimensions. Segmentation Sequential Neural Network was applied to increase the system’s performance. The authors proposed a Sequential Neural Network Architecture (SNN) because this technique is based on accuracy and time efficiency. Their proposed methodology [29] was based on two stages; however, the authors could not perform both stages due to a lack of input images.
Feature selection and an extreme learning machine were used to classify WBCs (ELM). To expand the number of images, data augmentation is conducted initially, followed by using a unique contrast stretching technique known as pixel stretch (PS). Color and grey level size zone matrix (GLSZM) features are generated from PS images and fused into a single vector based on a high similarity level in the next phase. However, there are a few redundant features that impact classification performance. A maximum relevance probability (MRP) based feature selection strategy is used to solve this challenge. All features with the greatest importance are added to ELM, and the process is repeated until the error rate is zero. Cubic SVM is used to classify the final selected features and attained the highest accuracy of 96.60 percent [30].
An automated method for detecting nuclei and extracting leukocytes from peripheral blood smear images with colour and illumination variations is described in the proposed study. Nuclei are detected using arithmetic and morphological processes, while leukocytes are detected using the active contours method. The findings show that the suggested approach successfully detects nuclei and leukocytes with Dice scores of 0.97 and 0.96, respectively. The method’s overall sensitivity is around 96 percent [6].
Scientists developed a strategy for classifying ALL into subtypes and reactive bone marrow in stained bone marrow pictures in this study. To get reliable classification results, the model is trained on bone marrow images using robust segmentation and deep learning approaches with the convolutional neural network. The findings of this experiment were compared to the results of different classifiers such as Nave Bayesian, KNN, and SVM. The proposed technique demonstrated 97.78 percent accuracy in diagnosing Acute Lymphoblastic Leukemia and its subtypes [31]. The numerical analysis of existing approaches is presented in Table 2.
Table 2.
Systematic comparison of existing approaches in terms of different morphological operators.
3. Proposed Methodology
In this paper, we propose a deep learning-based computer-aided method for detecting blood cancer using microscopic images. As seen in Figure 1, our proposed framework consists of the following stages: Pre-processing is done to increase the clarity and enhancement of the lesion region. Image segmentation is used to extract the area of interest. Later, hybrid CNN models are used on training images for feature extraction and selection. Finally, cancer classification is performed using conventional machine learning techniques. The overview of proposed framework is given in Figure 2.
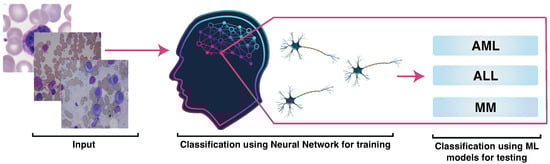
Figure 1.
Proposed Methodology.
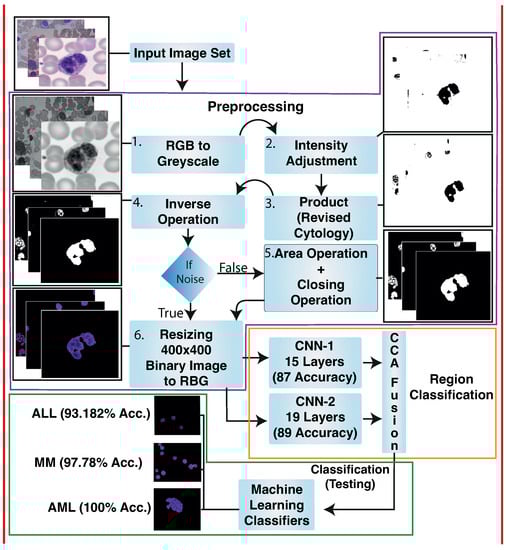
Figure 2.
Microscopic images of blood were gathered. Pre-processing is done to enhance the quality of images and increase visualization. Pre-processing took place in the following steps: RGB to Greyscale, image adjustment method and adaptive histogram equalization (AHE), multiplying binary image results with the output of image adjustment method and adaptive histogram equalization, and inverse operation to get a black background. The white-colored nucleus of blood, area operation, and closing operation to remove background noise. Finally, the output achieved by the last operation is multiplied by the source image to regenerate the colored images. Hybrid Deep Learning architecture is trained to classify lesions. We have proposed two individual blocks of Convolutional Neural Networks named CNN-1 and CNN-2. We applied CCA fusion to concatenate vectors features gained by CCN-1 and CNN-2 to get the most discriminative vectors. After that, discriminative vectors produced by CCA fusion are passed to traditional machine learning classifiers for classification.
3.1. Image Acquisitions
Microscopic images of blood gathered from Leukaemia Diagnostics at Munich University Hospital smear are acquired from blood samples of 118 patients identified by different sub-types of AML. Resolution of each image is 400 × 400 pixels. The file format is “TIFF” [10,39]. Moreover, we also use images from a public database of all challenge datasets of ISBI 2019 [40,41]. SN-AM Dataset: White Blood cancer dataset of B-ALL and MM for stain normalization. We use images of B-ALL and MM of around 55 and 5 subjects in this dataset, respectively. The image size is 2560 × 1920 pixels, and they all are in BMP format [42,43,44]. We also use third dataset from MiMM_SBILab Dataset: Microscopic Images of Multiple Myeloma of 5 subjects; these images are 2560 × 1920 pixels [42,43,44].
3.2. Pre-Processing
Pre-processing is a procedure adopted to enhance the quality of images and increase visualization. In medical imaging, image processing is a crucial phase that helps to improve the images quality. This can be one of the most critical factors in achieving good results and accuracy in next phases of proposed methodology. Medical images may contain a different issue that may lead to poor and low visualization of the image. If the images are poor or of low quality, it may lead to unsatisfactory results.
During preprocessing phase, we performed background elimination, elimination of non-essential blood supplies, image enhancement, and noise removal. The results of preprocessing on our sample images is shown in Figure 3a.
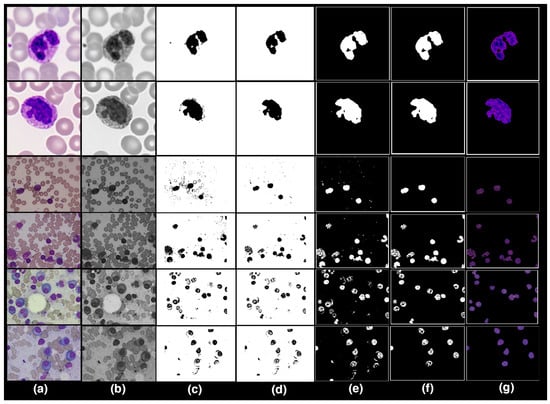
Figure 3.
Pre-processing: (a) RGB to Greyscale. (b) Image Adjustment Method and Adaptive. (c) Image Adjustment Method and Adaptive Histogram Equalisation. (d) Product of Binary image with Image Adjustment Method and AHE. (e) Inverse Operation. (f) Area Operation and Closing Operation. (g) Regenerate dataset into RGB colour scheme and Resizing.
3.2.1. RGB to Greyscale
The datasets uses consist of an RGB color model. The RGB color space was then transformed into the greyscale 8-bit format using MATLAB (see Figure 3b).
3.2.2. Image Adjustment Method and Adaptive Histogram Equalisation
After converting the images to binary, the images are enhanced using image adjustment and adaptive histogram equalization (AHE) methods. The contrast of the greyscale images is improved by using image intensity adjustment and adaptive histogram equalization (AHE). The lesion borders have become more contrasted and dominant, whereas context, noise, and non-essential components have faded, as seen in Figure 3c.
3.2.3. Product of Binary Image with Image Adjustment Method and AHE
After observing the outputs of the previous preprocessing phase, images are still slightly blurry, and the noise persists in the image. To improve the structure and sharpness of images, we multiplied binary images by the output of the last preprocessing phase, as shown in Figure 3d.
3.2.4. Inverse Operation
Output images produced by the previous step have a white background, and the color of a nucleus is black. Inverse operation is performed to restore original color of nuclei. The inverse operation alters the black color into white and vice versa, as shown in Figure 3e.
3.2.5. Area Operation and Closing Operation
Background noise is present in some image datasets. We use area and closing operations to eliminate background noise, which improves the lesion’s boundaries as shown in Figure 3f.
3.2.6. Regenerate Dataset into RGB Color Scheme and Resizing
Finally, we multiplied the output obtained by applying the area and closing operation with the source image to reconstruct the images dataset in RGB color space, and we also resize the dataset images to 400 × 400 pixels as seen in Figure 3g.
After applying the aforementioned preprocessing steps, we obtain less noisy, non-blurred, sharpened, and segmented lesion images.
3.3. Data Augmentation
In several tasks, CNNs proved to be the best classifier. However, the training data has a significant impact on CNN’s performance. Collecting adequate clinical images is difficult due to data privacy concerns in the medical field. We use different data augmentation approaches to enhance the CNN performance, as recommended in previous research [18,45], such as contrast and brightness correction, horizontal and vertical flips, intensity modifications, and rotation, to solve the issue of availability of lesser amounts of data causing over-fitting of the model. The class distributions before and after data augmentation is shown in Table 3 given below.
Table 3.
Data Augmentation.
3.4. Classification
Classification is a key step which distinguishes between cancerous and non-cancerous images. According to recent studies, various schemes for using CNN models have been proposed; the first is to train the model using a vast number of datasets, and the second is to use a pre-trained model that is achieved by transfer learning. A hybrid CNN model is used in our proposed approach. CNN-1 and CNN-2 are the two key blocks of CNN in a Hybrid Convolutional Neural Networks model. These CNN blocks train a huge dataset of images before transferring the knowledge to the proceeding blocks to diagnose the disease. The architecture is shown in Figure 4.
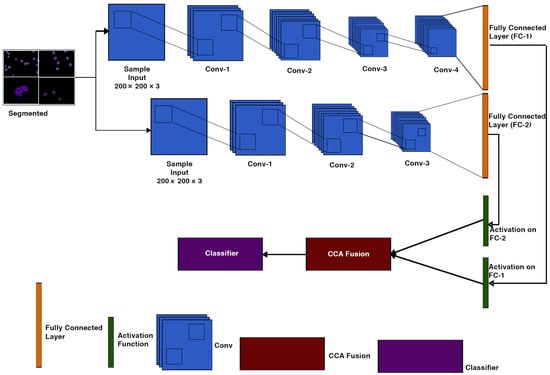
Figure 4.
CNN-1 & CNN-2 Architecture.
Both CNN-1 and CNN-2 convolution neural network models have 19 and 15 layers, respectively, which have an input layer, 2-Dimensional convolutional layers, batch normalization layers, and ReLU layers. Two-dimensional max-pooling layers, a fully connected layer, a soft-max layer, and a classification layer are all present. Table 4 shows the details of the layers for both CNN models.
Table 4.
Layers of CNN-1.
3.4.1. Feature Extraction
The extraction of features is a critical component of the model. We train a specific hybrid model for feature extraction. The applied models (CNN-1 and CNN-2) are developed on a convolutional layer sequence that includes 2-Dimensional convolutional layers, batch normalisation layers, ReLU layers, and 2-Dimensional max-pooling layers. Through adding filters, the dataset is transferred to each layer of convolution. Before the last max-pooling, each convolution layer extracts relevant information. Finally, feature extraction is performed on both networks via a fully connected layer.
3.4.2. Transfer Learning
Convolutional neural networks will take many days, even weeks, to train on a large dataset. We use transfer learning to reduce the time complexity of the above problem. Transfer Learning is the mechanism by which a trained model on one problem is used to assist to find the solution of another co-related problem [46] (Brownlee, 2019). As seen in Figure 4, we use softmax layer for activation function to achieve the goal of transfer learning for each CNN model in our architecture.
3.4.3. Feature Selection Using CCA Fusion
Feature fusion is the process of combining two feature vectors to create a single feature vector that is more discriminative than one of the input feature vectors [47]. There are some methods for integrating CCA. One method is to combine two sets of feature vectors into a single union-vector, and then extract features in a higher-dimensional real vector space. Another approach is to combine two feature vectors with a complex vector and then extract features from the complex vector space. Both feature fusion methods aim to improve prediction performance; the union vector approach is referred to as serial feature fusion. Parallel feature fusion is the name given to the approach based on the complex vector [48]. In this research, we use second method to combine the complex feature vectors CCN-1 and CNN-2.
3.4.4. Classification Using Traditional Machine Learning Models
The final stage is classification of testing images of cancer, which aims to predict the type of tumour (Ali et al., 2019; Bagasjvara et al., 2016). In our proposed solution, the multi-class classification method was used to define the input image based on the selected features.
We used machine learning algorithms to compute the classification; the reason to do this was to reduce computation time. Bagging Ensemble, Linear Programming Boost (LPBoost), Total Boost Ensemble, K-Nearest Neighbour (K-NN), Fine K-Nearest Neighbour (FK-NN), RUSBoost, Coarse K-Nearest Neighbour (CoarseK-NN), and Support Vector Machine (SVM) are some of the classifiers; we have used in our proposed methodology.
4. Results
The experimental findings of the proposed hybrid model classification methodology are presented in both qualitative and quantitative aspects. We placed the proposed method to the test using the data we gathered.
4.1. Dataset
We collected a dataset from a public directory of around 4150 images. Our dataset consists of 3 classes, namely acute lymphoblastic leukaemia (ALL), acute myeloid leukaemia (AML), and multiple myeloma (MM). Initially, the dataset contains 31 images of ALL, 4013 images of AML, and 114 images of MM. After performing data augmentation on ALL and MM to resolve the issue of data overfitting, we got 293 images of ALL and 301 images of MM for classification. Furthermore, the total number of images in AML class was too much compared to other classes, making class unbalancing problematic and possibly leading to biases in the results. To address the class unbalancing issue, we chose 307 random images of AML class. For classification, we divided datasets into 70 ratios 30, training and testing sets, which means we used 70% of the random images for training purposes and 30% of random images for testing purposes as shown in Table 5.
Table 5.
Samples used for classification.
The proposed classification algorithms are compared to state-of-the-art classification algorithms like ANN & SVM, CNN & SVM, Active Contours and Alexnet. Well-known performance parameters such as sensitivity, precision, accuracy, F1 score, false-negative rates (FNR), and false-positive rates (FPR) are used to evaluate these classifiers.
4.2. Experimental Setup
For this research, experiments were carried out on a Microsoft Azure Server running on a 64-bit version of Windows 10 in MATLAB 2020b. The computer had an Intel Xeon Processor, 16 GB of RAM, and 130 GB of storage.
4.3. Features Extraction Results Using CNN-1
This section will discuss the findings of feature extraction using the Convolutional Neural Network (CNN-1). We found that the accuracy achieved by CNN-1 for individual classes ALL, AML, and MM are 77.27%, 98.91% and 92.22%, respectively. The discrete statistics of CNN-1 upon ALL, AML and MM, are cited below in Table 6.
Table 6.
Statistics of CNN-1 Model of Individual Classes.
Overall accuracy achieved by CNN-1 on ALL, AML and MM was 89.63%. The overall statistics of CNN-1 are given below in Table 7.
Table 7.
Overall Statistics of CNN-1 Model of All Classes.
The confusion matrix of CNN-1 is shown in Figure 5.
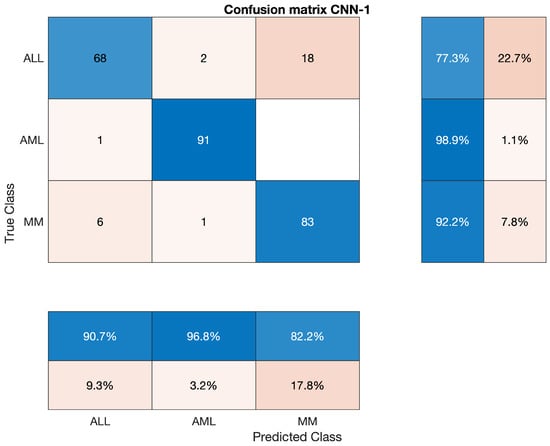
Figure 5.
Confusion Matrix of CNN-1.
4.4. Features Extraction Results Using CNN-2
In this section, we will discuss the findings of feature extraction using the Convolutional Neural Network (CNN-2). We discovered that CNN-2 achieves 77.27 percent, 98.91 percent, and 92.22 percent accuracy for individual classes ALL, AML, and MM, respectively. The statistics of CNN-2 upon ALL, AML, and MM, are mentioned below in Table 8.
Table 8.
Statistics of CNN-2 Model of Individual Classes.
Overall accuracy achieved by CNN-2 on ALL, AML and MM was 87.41%. The overall statistics of CNN-2 are given below in Table 9.
Table 9.
Overall Statistics of CNN-2 Model of All Classes.
The confusion matrix of CNN-2 is presented in Figure 6.
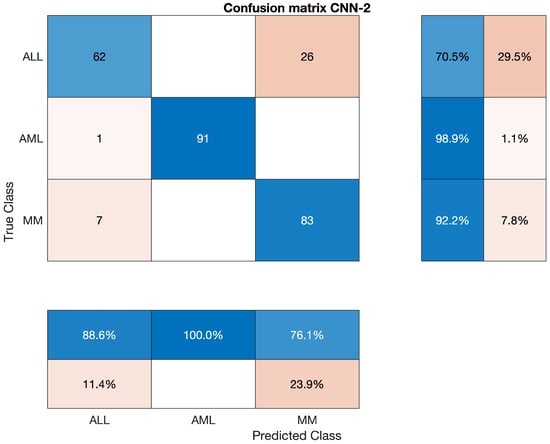
Figure 6.
Confusion Matrix of CNN-2.
4.5. Classification Results Using CCA Fusion
In the past chapter, we discussed the proposed methodology that the features extracted by CNN-1 and CNN-2 are concatenated into a single enhanced vector through Canonical Correlation Analysis (CCA) Fusion. After that, the fused vectors of enhanced features were passed out to the classifiers to classify the input images. Bagging Ensemble, Total Boost Ensemble, Fine K-Nearest Neighbour (FK-NN), RUSBoost, Coarse K-Nearest Neighbour (Coarse K-NN), and Support Vector Machine (SVM) are some of the classifiers; used in the proposed methodology. We have implemented multiple classifiers of machine learning in this step. The reason was to minimize the whole system’s execution time as much as possible.
4.5.1. Statistical Analysis of Bagging Ensemble on CCA Fusion
We have used the Bagging Ensemble classifier to classify the lesion on the vector of the fused feature. The statistics show that the AML class’s accuracy is 100 percent, ALL reached 93.182 percent, and MM’s accuracy is around 97.78 percent. Sensitivity, precision, F1-score, etc., are cited below in Table 10. The overall accuracy of this classifier was very efficient and reached 97.4 percent. The combined results of the three classes are also shown in Table 10, which is also given below; also, the confusion matrix is shown in Figure 7.
Table 10.
Statistics of Bagging Model using CCA Fusion.
Overall accuracy achieved by Bagging Ensembler on ALL, AML and MM was 97.04%. The overall statistics of Bagging Ensembler are given below in Table 11.
Table 11.
Overall Statistics of Bagging Ensembler Model of All Classes.
The confusion matrix of Bagging Ensemble is shown below.
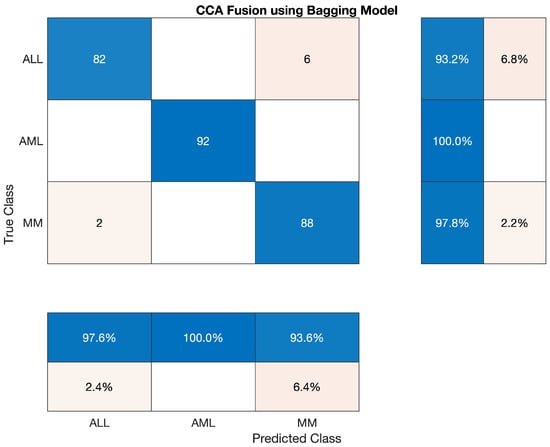
Figure 7.
Confusion Matrix of Bagging Ensemble.
4.5.2. Statistical Analysis of Total Boost Model on CCA Fusion
We have used the Total Boost classifier to classify the lesion on the vector of the fused feature. The statistics show that the accuracy of AML class is 100 percent, ALL reached 92.045 percent, and the accuracy of MM is around 97.78 percent. Sensitivity, precision, F1-score, etc., are cited below in Table 12 The overall accuracy of this classifier was very efficient and reached 96.67 percent. The combined results of the three classes are also shown in Table 12 which is also given below; also, confusion matrices are shown in Figure 8.
Table 12.
Statistics of Total Boost Model using CCA Fusion.
Overall accuracy achieved by Total Boost Model on ALL, AML and MM was 96.67%. The overall statistics of Total Boost Model are given below in Table 13.
Table 13.
Overall Statistics of Total Boost Model of All Classes.
The confusion matrix of Total Boost Model is shown below.

Figure 8.
Confusion Matrix of Total Boost Model.
4.5.3. Statistical Analysis of Fine-KNN on CCA Fusion
In this section, we tested Fine KNN classifier to classify the lesion on the vector of the fused feature. The statistics show that the accuracy of AML class is 100 percent, ALL reached 92.045 percent, and the accuracy of MM is around 95.56 percent. Sensitivity, precision, F1-score, etc., are cited below in Table 14 The overall accuracy of this classifier was very efficient and reached 95.93 percent. The overall combined results of the three classes are also shown in Table 14 which is also given below, as shown in Figure 9.
Table 14.
Statistical Analysis of Fine-KNN on CCA Fusion.
Overall accuracy achieved by Fine KNN on ALL, AML and MM was 95.93%. The overall statistics of Fine KNN are given below in Table 15.
Table 15.
Overall Statistics of Fine KNN Model of All Classes.
The confusion matrix of Fine KNN model is shown in Figure 9.
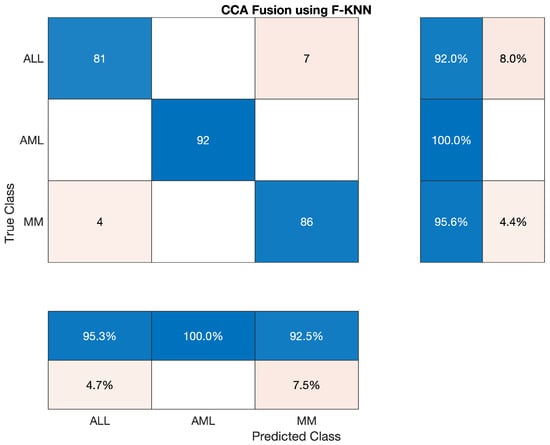
Figure 9.
Confusion Matrix of Fine KNN model.
4.5.4. Statistical Analysis of Medium-KNN on CCA Fusion
We also have tested Medium KNN classifier to classify the lesion on the vector of the fused feature. The statistics show that the AML class’s accuracy is 100 percent, ALL reached the accuracy of 92.045 percent, and MM’s accuracy is around 96.67 percent. Sensitivity, precision, F1-score, etc., are cited below in Table 16 The overall accuracy of this classifier was very efficient and reached 96.30 percent. The three classes’ overall combined results are also shown in Table 16, which is also given below; also, the confusion matrix is shown in Figure 10.
Table 16.
Statistics of Medium KNN using CCA Fusion.
Overall accuracy achieved by Medium KNN on ALL, AML and MM was 96.30%. The overall statistics of Medium KNN are given below in Table 17.
Table 17.
Overall Statistics of Medium KNN Model of All Classes.
The confusion matrix of Medium KNN model is shown in Figure 10.
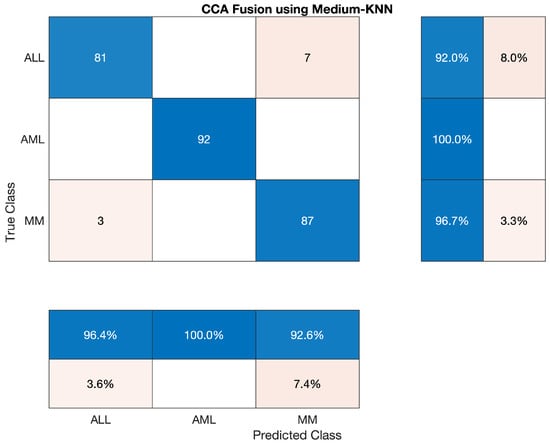
Figure 10.
Confusion Matrix of Medium KNN model.
4.5.5. Statistical Analysis of Coarse-KNN on CCA Fusion
We also have tested the Coarse KNN classifier to classify the lesion on the vector of the fused feature. The statistics show that the AML class’s accuracy is 96.739 percent, ALL reached 90.909 percent, and MM’s accuracy is around 97.778 percent. Sensitivity, precision, F1-score, etc., are cited below in Table 18. The overall accuracy of this classifier was very efficient and reached 95.19 percent. The three classes’ overall combined results are also shown in Table 19 which is also given below; the confusion matrix is shown in Figure 11.
Table 18.
Statistical Analysis of Coarse-KNN on CCA Fusion.
Table 19.
Overall Statistics of Coarse KNN Model of All Classes.
Overall accuracy achieved by Coarse KNN on ALL, AML and MM was 95.19%. The overall statistics of Coarse KNN are given below in Table 19.
The confusion matrix of Coarse KNN model is shown in Figure 11.
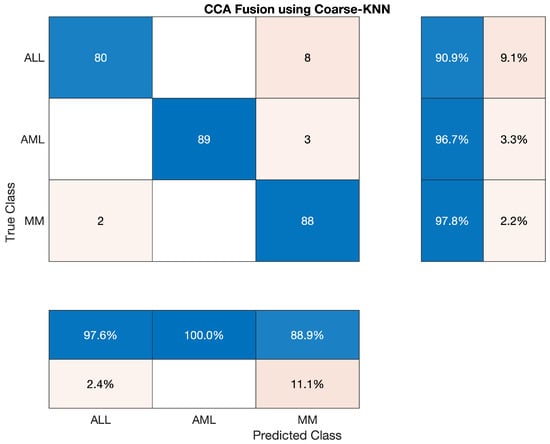
Figure 11.
Confusion Matrix of Coarse KNN model.
4.5.6. Statistical Analysis of SVM on CCA Fusion
In this section, we have discussed the reported statistics of the most famous traditional machine learning algorithm—support Vector Machine (SVM) classifier to classify the lesion on the vector of the fused feature. The statistics show that the accuracy of the AML class is 100 percent, ALL reached 90.909 percent, and MM’s accuracy is around 94.44 percent. Sensitivity, precision, F1-score, etc., are cited below in Table 20 The overall accuracy of this classifier was very efficient and reached 95.19 percent. The overall combined results of the three classes are also shown in Table 20, which is also given below; also, the confusion matrix is shown in Figure 12.
Table 20.
Statistical Analysis of SVM on CCA Fusion.
Overall accuracy achieved by SVM on ALL, AML and MM was 95.19%. The overall statistics of SVM are given below in Table 21.
Table 21.
Overall Statistics of SVM Model of All Classes.
The confusion matrix of SVM model is shown in Figure 12.
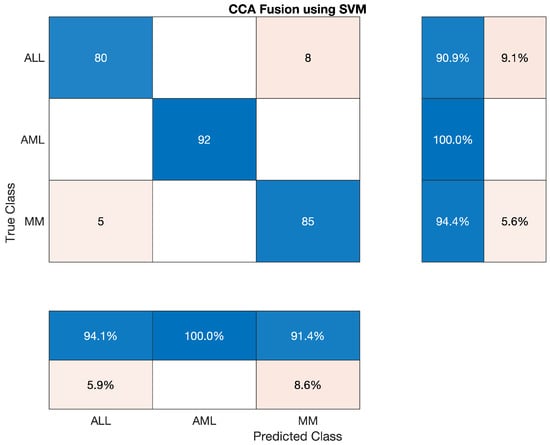
Figure 12.
Confusion Matrix of SVM model.
4.5.7. Statistical Analysis of LPBoost Model on CCA Fusion
This section has discussed the reported statistics of the most famous traditional machine learning algorithm, LPBoost model classifier, to classify the lesion on the vector of the fused feature. The statistics show that the accuracy of AML class is 100 percent, ALL reached the accuracy of 93.182 percent, and accuracy of MM is around 95.556 percent. Sensitivity, precision, F1-score, etc., are cited below in Table 22. This classifier’s overall accuracy was very efficient and reached 96.30 percent, which is also shown in Table 23 given below; also, the confusion matrix on CCA fusion is shown in Figure 13.
Table 22.
Statistical Analysis of LPBoost model on CCA Fusion.
Table 23.
Overall Statistics of LPBoost Model of All Classes.
Overall accuracy achieved by LPBoost on ALL, AML and MM was 96.30%. The overall statistics of LPBoost are given below in Table 23.
The confusion matrix of LPBoost model is shown in Figure 13.
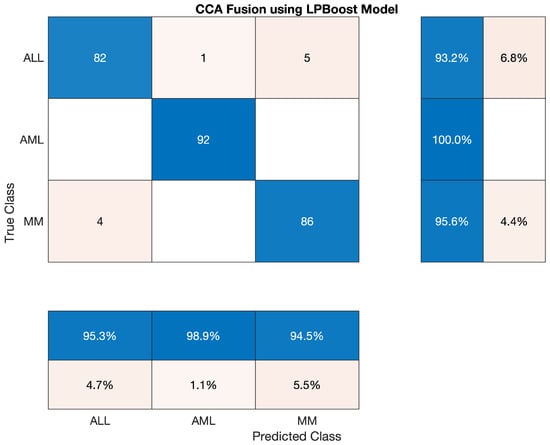
Figure 13.
Confusion Matrix of LPBoost model.
4.5.8. Statistical Analysis of RUSBoost on CCA Fusion
This section has discussed the reported statistics of the most famous traditional machine learning algorithm, RUSBoost classifier, to classify the lesion on the vector of the fused feature. The statistics show that the accuracy of AML class is 100 percent, ALL reached the accuracy of 90.909 percent, and accuracy of MM is around 94.45 percent. Sensitivity, precision, F1-score, etc., are cited below in Table 24. Also, the confusion matrix on CCA fusion is shown in Figure 14.
Table 24.
Statistical Analysis of RUSBoost on CCA Fusion.
Overall accuracy achieved by RUSBoost on ALL, AML and MM was 96.30 %. The overall statistics of RUSBoost are given below in Table 25.
Table 25.
Overall Statistics of RUSBoost of All Classes.
The confusion matrix of RUSBoost model is shown in Figure 14.
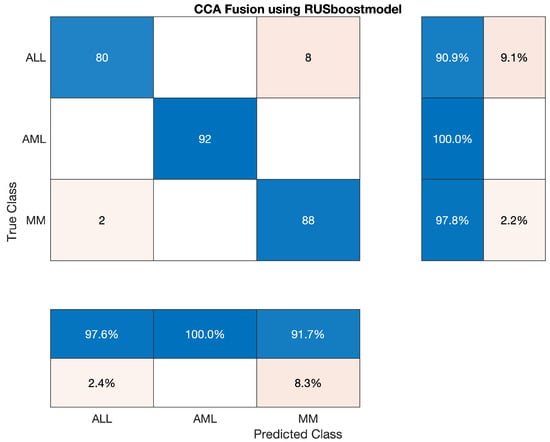
Figure 14.
Confusion Matrix of RUSBoost model.
4.6. Discussion and Comparison
In this section, we will be discussing the results of our proposed methodology with the past work. After acquisition of images, we performed pre-processing, which was used to enhance the image quality, removed noise and sharpen of image dataset. Moreover, in pre-processing we have also achieved the segmentation. No special model was trained to segment the image dataset. Segmentation itself has been performed in pre-processing. This helps us by reducing computation required for image dataset segmentation, and also involves reduced computation time. In the next step, we trained two models of CNN that work in parallel to extract features from the dataset. After performing activation on extracted vectors of feature, which was the output of each CNNs, we performed CCA fusion to extract and concatenate the most promising featured vector, which is also our contribution. We also have compared CCA fusion with Principal Component Analysis (PCA) and Serial Based Approach (SBA). Lastly, we use traditional machine learning models to train and test. The reason for using a traditional machine learning model was to minimise the computation of our network. Traditional machine learning models take a few minutes to train, but if we use a deep learning network in this step, it might take several hours or even few days. By using traditional machine learning algorithms, we observed that the best one on our proposed was Bagging ensemble model with CCA fusion. This gives us an accuracy of 97.04 percent overall. However, SVM and Coarse KNN gives us the worst result among used classifiers in our proposed methodology. The accuracy observed by both SVM and Coarse KNN was around 95%, which is not particularly bad.
Furthermore, comparison between CCA, PCA, and SBA was also performed to validate the comparative analysis between them. According to the experimental results performed on CCA, PCA, and SBA. LPBoost performed best by using SBA fusion technique with the accuracy of 96.67%. While using PCA fusing technique, medium KNN and RUSBoost maintained the accuracy of 96.67%. We concluded that CCA fusion produced the best results compared to feature concatenation techniques. The Bagging Ensemble Model computed an accuracy of 97.04% with CCA fusion. Moreover, the statistics of CCA, PCA, and SBA on traditional machine learning models are listed below in Table 26.
Table 26.
Comparison of CCA, SBA, and PCA on ML Models.
At the end, we discuss the statistics of our proposed methodology with the previous work. Our proposed methodology has improved the results significantly. An author [21] used ANN along with SVM to classify Acute Lymphoblastic Leukaemia (ALL). Their specificity was 95.31%. Another scientist used CNN and SVM to identify the leukaemia. Their dataset consists of only two types of leukaemia. They achieved the accuracy of 94.1% [22]. The authors of [6] proposed an active contours algorithm to identify the Leukocytes with accuracy of 96.5%. Lastly, we compared the adopted methods with the state of the art model in [11], which is an eight-layered a pre-trained convolutional neural network from the ImageNet database that has been trained on over a million photos. The network has been pre-trained to categorise photos into 1000 different item categories. Their methodology found an accuracy of 90.30%. The results are cited below in Table 27.
Table 27.
Comparison of Proposed Methodology.
Abbreviations used in this study are give in Table 28.
Table 28.
Abbreviations used in study.
5. Conclusions
Leukaemia is a form of blood cancer that affects adults and is widespread in children. Treatment for leukaemia is determined by the form of cancer and how far it has spread across the body. It is essential to detect this disorder as soon as possible to get appropriate treatment and recover. This research developed an automated diagnosis tool for ALL, AML, and MM. The dataset was pre-processed using the proposed methodology to minimize noise and blurriness and enhance image quality. During pre-processing, we found that the output images had already been segmented. The approach is practical and does not necessitate image segmentation. Following that, we trained two CCN models in parallel to extract features. The CCA Fused approach is used to concatenate these derived features. The classifier receives fused vectors (SVM, Bagging ensemble, total boost, RUSBoost, Fine KNN, etc.). Using the Bagging ensemble design, we achieved a 97.04 percent accuracy. As a result, pathologists may find that this procedure aids in effective diagnosis.
Author Contributions
Conceptualization, R.B., A.R.; Methodology, R.B., A.R., A.A. (Abdullah Almuhaimeed), A.A. (Abdulkareem Alzahrani) and H.T.R.; Software, R.B., A.R., A.A. (Abdullah Almuhaimeed), A.A. (Abdulkareem Alzahrani) and H.T.R.; Visualization, R.B.; Writing – original draft, R.B., A.R., A.A. (Abdullah Almuhaimeed), A.A. (Abdulkareem Alzahrani) and H.T.R.; Supervision, A.R. All authors have read and agreed to the published version of the manuscript.
Funding
This research received no external funding.
Institutional Review Board Statement
Not applicable.
Informed Consent Statement
Not applicable.
Data Availability Statement
Not applicable.
Conflicts of Interest
The authors declare no conflict of interest.
References
- Raphael, R.T.; Joy, K.R. Segmentation and Classification Techniques of Leukemia Using Image Processing: An Overview. In Proceedings of the 2019 International Conference on Intelligent Sustainable Systems (ICISS), Palladam, India, 21–22 February 2019; pp. 378–384. [Google Scholar] [CrossRef]
- WHO. International Agency for Research on Cancer. 2019. Available online: https://www.iarc.who.int/ (accessed on 13 May 2022).
- Subrajeet, M.; Dipti, P.; Satpathi, S. Image Analysis of Blood Microscopic Images for Acute Leukemia Detection. In Proceedings of the 2010 International Conference on Industrial Electronics, Control and Robotics, Rourkela, India, 27–29 December 2010. [Google Scholar]
- Society, A.C. What Is a Cancer? Available online: https://www.cancer.org/treatment/understanding-your-diagnosis/what-is-cancer.html (accessed on 13 May 2022).
- Goutam, D.; Sailaja, S. Classification of acute myelogenous leukemia in blood microscopic images using supervised classifier. In Proceedings of the 2015 IEEE International Conference on Engineering and Technology (ICETECH), Coimbatore, India, 20 March 2015; pp. 1–5. [Google Scholar] [CrossRef]
- Hegde, R.B.; Prasad, K.; Hebbar, H.; Singh, B.M.K.; Sandhya, I. Automated Decision Support System for Detection of Leukemia from Peripheral Blood Smear Images. J. Digit. Imaging 2019, 33, 361–374. [Google Scholar] [CrossRef]
- World Health Organization. Cancer Fact Sheet; WHO: Geneva, Switzerland, 2019. [Google Scholar]
- Agrawal, R.; Satapathy, S.; Bagla, G.; Rajakumar, K. Detection of White Blood Cell Cancer using Image Processing. In Proceedings of the 2019 International Conference on Vision Towards Emerging Trends in Communication and Networking (ViTECoN), Vellore, India, 30–31 March 2019; pp. 1–6. [Google Scholar]
- Al-jaboriy, S.S.; Sjarif, N.N.A.; Chuprat, S.; Abduallah, W.M. Acute lymphoblastic leukemia segmentation using local pixel information. Pattern Recognit. Lett. 2019, 125, 85–90. [Google Scholar] [CrossRef]
- Matek, C.; Schwarz, S.; Spiekermann, K.; Marr, C. Human-level recognition of blast cells in acute myeloid leukaemia with convolutional neural networks. Nat. Mach. Intell. 2019, 1, 538–544. [Google Scholar] [CrossRef]
- Shree, K.D.; Janani, B. Classification of Leucocytes for Leukaemia Detection. Res. J. Eng. Technol. 2019, 10, 59–66. [Google Scholar] [CrossRef]
- Society, A.C. Key Statistics for Leukemia. Available online: https://cancerstatisticscenter.cancer.org/#!/cancer-site/Leukemia (accessed on 1 January 2019).
- Hegde, R.B.; Prasad, K.; Hebbar, H.; Singh, B.M.K. Feature extraction using traditional image processing and convolutional neural network methods to classify white blood cells: A study. Australas. Phys. Eng. Sci. Med. 2019, 42, 627–638. [Google Scholar] [CrossRef] [PubMed]
- Jha, K.K.; Dutta, H.S. Mutual Information based hybrid model and deep learning for Acute Lymphocytic Leukemia detection in single cell blood smear images. Comput. Methods Programs Biomed. 2019, 179, 104987. [Google Scholar] [CrossRef]
- Gao, J.; Wang, W.; Liu, Z.; Billah, M.F.R.M.; Campbell, B. Decentralized Federated Learning Framework for the Neighborhood: A Case Study on Residential Building Load Forecasting. In Proceedings of the 19th ACM Conference on Embedded Networked Sensor Systems, Coimbra, Portugal, 15–17 November 2021; pp. 453–459. [Google Scholar]
- Saleem, N.; Gao, J.; Irfan, M.; Verdu, E.; Fuente, J.P. E2E-V2SResNet: Deep residual convolutional neural networks for end-to-end video driven speech synthesis. Image Vis. Comput. 2022, 119, 104389. [Google Scholar] [CrossRef]
- Khattak, M.I.; Saleem, N.; Gao, J.; Verdu, E.; Fuente, J.P. Regularized sparse features for noisy speech enhancement using deep neural networks. Comput. Electr. Eng. 2022, 100, 107887. [Google Scholar] [CrossRef]
- Kassani, S.H.; Wesolowski, M.J.; Schneider, K.A.; Deters, R. A Hybrid Deep Learning Architecture for Leukemic B-lymphoblast Classification. arXiv 2019, arXiv:1909.11866. [Google Scholar]
- Khan, S.; Sajjad, M.; Hussain, T.; Ullah, A.; Imran, A.S. A Review on Traditional Machine Learning and Deep Learning Models for WBCs Classification in Blood Smear Images. IEEE Access 2021, 9, 10657–10673. [Google Scholar] [CrossRef]
- Anwar, S.; Alam, A. A convolutional neural network–based learning approach to acute lymphoblastic leukaemia detection with automated feature extraction. Med. Biol. Eng. Comput. 2020, 58, 3113–3121. [Google Scholar] [CrossRef] [PubMed]
- Bodzas, A.; Kodytek, P.; Zidek, J. Automated detection of acute lymphoblastic leukemia from microscopic images based on human visual perception. Front. Bioeng. Biotechnol. 2020, 8, 1005. [Google Scholar] [CrossRef] [PubMed]
- Ruberto, C.D.; Loddo, A.; Puglisi, G. Blob Detection and Deep Learning for Leukemic Blood Image Analysis. Appl. Sci. 2020, 10, 1176. [Google Scholar] [CrossRef]
- Al-Tahhan, F.E.; Sakr, A.A.; Aladle, D.A.; Fares, M.E. Improved image segmentation algorithms for detecting types of acute lymphatic leukaemia. IET Image Process. 2019, 13, 2595–2603. [Google Scholar] [CrossRef]
- Sukhia, K.N.; Ghafoor, A.; Riaz, M.M.; Iltaf, N. Automated acute lymphoblastic leukaemia detection system using microscopic images. IET Image Process. 2019, 13, 2548–2553. [Google Scholar] [CrossRef]
- AbdelRaouf, A. A new FISH Signals Fusion Detection approach for diagnosing Chronic Myeloid Leukemia. In Proceedings of the 2019 14th International Conference on Computer Engineering and Systems (ICCES), Cairo, Egypt, 17 December 2019; pp. 328–335. [Google Scholar]
- Rawat, J.; Singh, A.; Hs, B.; Virmani, J.; Devgun, J.S. Computer assisted classification framework for prediction of acute lymphoblastic and acute myeloblastic leukemia. Biocybern. Biomed. Eng. 2017, 37, 637–654. [Google Scholar] [CrossRef]
- Rawat, J.; Singh, A.; Bhadauria, H.S.; Virmani, J. Computer aided diagnostic system for detection of leukemia using microscopic images. Procedia Comput. Sci. 2015, 70, 748–756. [Google Scholar] [CrossRef] [Green Version]
- Vogado, L.H.S.; Veras, R.M.S.; Araujo, F.H.D.; Silva, R.R.V.; Aires, K.R.T. Leukemia diagnosis in blood slides using transfer learning in CNNs and SVM for classification. Eng. Appl. Artif. Intell. 2018, 72, 415–422. [Google Scholar] [CrossRef]
- Vincent, I.; Kwon, K.; Lee, S.; Moon, K. Acute lymphoid leukemia classification using two-step neural network classifier. In Proceedings of the 2015 21st Korea-Japan Joint Workshop on Frontiers of Computer Vision (FCV), Mokpo, Korea, 28–30 January 2015; pp. 1–4. [Google Scholar] [CrossRef]
- Khan, M.A.; Qasim, M.; Lodhi, H.M.J.; Nazir, M.; Javed, K.; Rubab, S.; Din, A.; Habib, U. Automated design for recognition of blood cells diseases from hematopathology using classical features selection and ELM. Microsc. Res. Tech. 2021, 84, 202–216. [Google Scholar] [CrossRef]
- Rehman, A.; Abbas, N.; Saba, T.; ur Rahman, S.I.; Mehmood, Z.; Kolivand, H. Classification of acute lymphoblastic leukemia using deep learning. Microsc. Res. Tech. 2018, 81, 1310–1317. [Google Scholar] [CrossRef]
- Bhattacharjee, R.; Saini, L.M. Robust technique for the detection of Acute Lymphoblastic Leukemia. In Proceedings of the 2015 IEEE Power, Communication and Information Technology Conference (PCITC), Bhubaneswar, India, 15–17 October 2015; pp. 657–662. [Google Scholar] [CrossRef]
- Patel, N.; Mishra, A. Automated Leukaemia Detection Using Microscopic Images. Procedia Comput. Sci. 2015, 58, 635–642. [Google Scholar] [CrossRef] [Green Version]
- Basima, C.T.; Panicker, J.R. Enhanced leucocyte classification for leukaemia detection. In Proceedings of the 2016 International Conference on Information Science (ICIS), Kochi, India, 12–13 August 2016; pp. 65–71. [Google Scholar] [CrossRef]
- Jagadev, P.; Virani, H.G. Detection of leukemia and its types using image processing and machine learning. In Proceedings of the 2017 International Conference on Trends in Electronics and Informatics (ICEI), Tirunelveli, India, 11–12 May 2017; pp. 522–526. [Google Scholar] [CrossRef]
- Mishra, S.; Sharma, L.; Majhi, B.; Sa, P.K. Microscopic Image Classification Using DCT for the Detection of Acute Lymphoblastic Leukemia (ALL); Springer: Singapore, 2017; pp. 171–180. [Google Scholar]
- Zhao, J.; Zhang, M.; Zhou, Z.; Chu, J.; Cao, F. Automatic detection and classification of leukocytes using convolutional neural networks. Med. Biol. Eng. Comput. 2017, 55, 1287–1301. [Google Scholar] [CrossRef] [PubMed]
- Abdeldaim, A.M.; Sahlol, A.T.; Elhoseny, M.; Hassanien, A.E. Computer-aided acute lymphoblastic leukemia diagnosis system based on image analysis. In Advances in Soft Computing and Machine Learning in Image Processing; Springer: Cham, Switzerland, 2018; pp. 131–147. [Google Scholar]
- Clark, K.; Vendt, B.; Smith, K.; Freymann, J.; Kirby, J.; Koppel, P.; Moore, S.; Phillips, S.; Maffitt, D.; Pringle, M.; et al. The Cancer Imaging Archive (TCIA): Maintaining and Operating a Public Information Repository. J. Digit. Imaging 2013, 26, 1045–1057. [Google Scholar] [CrossRef] [Green Version]
- Mohajerani, P.; Ntziachristos, V. Classification of Normal Versus Malignant Cells in B-ALL Microscopic Images Based on a Tiled Convolution Neural Network Approach; Springer: Singapore, 2019; pp. 103–111. [Google Scholar]
- Shah, S.; Nawaz, W.; Jalil, B.; Khan, H.A. Classification of Normal and Leukemic Blast Cells in B-ALL Cancer Using a Combination of Convolutional and Recurrent Neural Networks; Springer: Singapore, 2019; pp. 23–31. [Google Scholar]
- Gupta, A.; Mallick, P.; Sharma, O.; Gupta, R.; Duggal, R. PCSeg: Color model driven probabilistic multiphase level set based tool for plasma cell segmentation in multiple myeloma. PLoS ONE 2018, 13, e0207908. [Google Scholar] [CrossRef] [PubMed]
- Gupta, A.; Duggal, R.; Gehlot, S.; Gupta, R.; Mangal, A.; Kumar, L.; Thakkar, N.; Satpathy, D. GCTI-SN: Geometry-inspired chemical and tissue invariant stain normalization of microscopic medical images. Med. Image Anal. 2020, 65, 101788. [Google Scholar] [CrossRef]
- Honomichl, N. MiMM_SBILab Dataset: Microscopic Images of Multiple Myeloma. 2019. Available online: https://wiki.cancerimagingarchive.net/pages/viewpage.action?pageId=52756988 (accessed on 13 May 2022).
- Pham, T.C.; Luong, C.M.; Visani, M.; Hoang, V.D. Deep CNN and Data Augmentation for Skin Lesion Classification; Springer: Berlin/Heidelberg, Germany, 2018; pp. 573–582. [Google Scholar]
- Brownlee, J. Transfer Learning in Keras with Computer Vision Models. Machine Learning Mastery. 2019. Available online: https://machinelearningmastery.com/how-to-use-transfer-learning-when-developing-convolutional-neural-network-models/ (accessed on 13 May 2022).
- Haghighat, M.; Abdel-Mottaleb, M.; Alhalabi, W. Fully automatic face normalization and single sample face recognition in unconstrained environments. Expert Syst. Appl. 2016, 47, 23–34. [Google Scholar] [CrossRef]
- Sun, Q.S.; Zeng, S.G.; Heng, P.A.; Xia, D.S. Feature fusion method based on canonical correlation analysis and handwritten character recognition. In Proceedings of the ICARCV 2004 8th Control Automation, Robotics and Vision Conference, Kunming, China, 6–9 December 2004; Volume 2, pp. 1547–1552. [Google Scholar] [CrossRef]
Publisher’s Note: MDPI stays neutral with regard to jurisdictional claims in published maps and institutional affiliations. |
© 2022 by the authors. Licensee MDPI, Basel, Switzerland. This article is an open access article distributed under the terms and conditions of the Creative Commons Attribution (CC BY) license (https://creativecommons.org/licenses/by/4.0/).