Article

Variability in the Solid Particle Density and Its Influence on the Corresponding Void Ratio and Dry Density: A Case Study Conducted on the MBT Reject Waste Stream from the MBT Plant in Marišćina, Croatia

Faculty of Geotechnical Engineering, University of Zagreb, 42000 Varaždin, Croatia
*
Author to whom correspondence should be addressed.
Appl. Sci. 2022, 12(12), 6136; https://doi.org/10.3390/app12126136
Submission received: 4 May 2022 / Revised: 13 June 2022 / Accepted: 14 June 2022 / Published: 16 June 2022

Abstract

:
In this study, a functional relationship between the solid particle density ( ρ s ) , void ratio e , and dry density ( ρ d ) of mechanically and biologically treated (MBT) municipal solid waste (MSW) was examined. In total, 60 waste specimens were tested with an air pycnometer device and corresponding triplets ( e ,   ρ d , and   ρ s ) of values were obtained. In addition, a long-term oedometer test with an allowed decomposition process was also conducted. Based on the obtained results, the variability in the solid particle density caused by heterogeneity and decomposition, as well as its influence on the corresponding void ratio and dry density values, were critically evaluated. The obtained results showed that the variability in the solid particle density caused by waste heterogeneity had a significant influence on the initial void ratio value. Furthermore, the obtained results also showed that the change in the solid particle density, caused by the degradation process, had a significant impact on the final void ratio and dry density values. In addition, an empirical relationship, ρ d = f e , was proposed. The proposed function allows a landfill operator to establish the corresponding dry density at an arbitrary chosen void ratio, and vice versa, without having the exact knowledge of the corresponding solid particle density value.

1. Introduction

Landfill settlement offers a significant opportunity for landfill operators to increase the potential disposal capacity of landfills. Because the majority of waste settlements occur very rapidly, a large settlement can be achieved during the filling process. Moreover, the decomposition process of organic components also increases landfill capacity. With a suitable model and the appropriate parameters, a landfill operator can estimate the actual remaining space of an existing landfill. In addition, the accurate estimation of the exact disposal capacity, including the extra volume achieved by the waste settlement, is also important for municipalities whose responsibility it is to develop an efficient waste management strategy for the local community [1].
Clearly, the prediction of a settlement cannot be more accurate than the data used in the corresponding settlement model. Therefore, in order to avoid inappropriate waste management strategies, the fundamental physical properties that govern landfill settlements (i.e., solid particle density and dry density) must be accurately established.
Solid particle density ( ρ s ) is a fundamental property which, in waste mechanics, is commonly used to determine the base phase relationships (i.e., void ratio, porosity, degree of saturation, and unit weight) of temporally stored or landfilled waste material [2]. Moreover, it is a fundamental property used in design calculations for predicting the behavior of sanitary landfills [3,4].
It is defined as the ratio between dry mass ( m s ) and the volume of solid particles ( V s ) as
ρ s = m s V s
Although the determination of mass particles ( m s ) is straightforward, the determination of particle volume ( V s ) is characterized by many difficulties. Specifically, an object such as a solid waste specimen is a multiphase material, which consists of various particles and voids. Voids that have a connection to the surface can be referred to as open pores, whereas the interior voids, inaccessible from the surface, can be considered to be closed pores. Consequently, various types of volumes can be defined, i.e., apparent particle volume and absolute volume. Although the apparent particle volume is defined as the total volume of all the particles, excluding the volume of open pores but including the volume of closed pores, the absolute volume is defined as the volume of solid matter after the exclusion of all the spaces [5].
Solid particle density is most commonly measured by a conical-topped pycnometer, in accordance with the ASTM D854 standard [6]. Although the mentioned method is capable of providing an accurate measurement of the solid particle density of soils, the application of this method to the measurement of the solid particle density of waste materials is overburdened with many difficulties. The particles with less specific gravity than water will float during the experiment. The heterogeneous nature of waste material, the relative specific gravity of individual waste particles, the size of waste particles, the amount of closed (intraparticle) voids, the compressibility, and the hydrophilic properties also have negative effects on the measurement accuracy. Air entrapment and various chemical and physical interactions between waste particles and measurement fluid (usually water) can also be anticipated.
Agnew et al. [7] showed that the solid particle density of waste materials was dependent on the moisture content. With increasing moisture content, the solid particle density decreased due to a swelling of solid particles and the consequent increase in the volume of said particles. Moreover, in some cases, increased moisture content could weaken the particle’s structure, causing the particle to collapse, which consequently reduced the solid particle’s volume. Stolz et al. [2] reported that solid particle density was poorly determined for municipal solid waste (MSW), because it was linked to the specific solid particle density of each component. Reddy et al. [8] investigated the relationship between the degree of decomposition and solid particle density. It was found that an increase in the degree of decomposition increased the solid particle density. This was caused by the loss of organic matter, which had high volume and low mass. Bareither et al. [4] also studied the correlation between the solid particle density and decomposition. They found that the studied quantities showed a strong positive linear correlation. Yesiller et al. [3] investigated the influence of particle size, compaction, and the degree of decomposition on solid particle density. The results they obtained showed that the solid particle density increased with a decrease in particle size, compaction, and increasing decomposition (aged waste). The authors attributed the increase in the solid particle density (with reduced particle size and compaction) to the potential exposure of previously occluded intraparticle voids and the access to these voids. For aged waste, the increasing solid particle density was attributed to the loss of biodegradable components (with low solid particle density values).
Therefore, the solid particle density of waste is a variable quantity, which depends on waste composition, the decomposition stage of organic content, the size of individual particles, the increase in vertical stress, and the moisture content.
Another physical quantity that has a significant impact on the available landfill capacity is the dry density ( ρ d ). By definition, dry density is the ratio between the dry mass ( m s ) and the total specimen volume ( V ). It is commonly associated with compaction/compression processes and the densification of waste material in response to the applied vertical stress [9,10]. The variation in the dry density associated with vertical stress can be established by Equation (2) [2]:
ρ d = ρ d 0 1 Δ e 1 + e 0
where ρ d 0 is the initial dry density, e 0 is the initial void ratio, and Δ e is the change in the void ratio caused by the vertical load. It is worth noting that the dry density of landfilled waste material is also a variable quantity, which depends on mass and volume changes caused by the vertical load and the decomposition process.
Finally, the theoretical correlation between the solid particle density, dry density, and the corresponding measure of volume change (i.e., void ratio e ) is commonly expressed using:
e = ρ s ρ d 1
where e is the current void ratio, defined as the ratio between the volume of pores ( V v ) and the volume of solid particles ( V s ).
A closer inspection of Equation (3) reveals that, in the case of the constant solid particle density and increasing dry density, a hyperbolic function with an asymptote parallel to the horizontal axis at e = 1 is obtained. Such a case can be typically observed in soils for which the solid particle density is commonly assumed to have a constant value. Thus, for soils, the void ratio is a function of only one variable: dry density. However, the strong heterogeneous nature of MSW prevents the approximation of the solid particle density of waste materials with a constant value. Therefore, it is reasonable to assume that a set of hyperbolic curves for waste materials should exist, wherein each curve is defined with a unique solid particle density value. Therefore, for waste materials, the void ratio is a function of two variables: solid particle density and dry density.
The second case that arises from Equation (3) is that, although the solid particle density varies, the dry density remains constant. In such a scenario, Equation (3) reveals that a linear relationship between the solid particle density and void ratio should exist.
In many cases, the validity of Equation (3) for waste materials is tacitly assumed. Therefore, the main research hypothesis to be experimentally verified within the present manuscript is whether mechanically and biologically treated (MBT) waste material shows the behavior that is anticipated with Equation (3). In addition, the variability in the solid particle density, which is due to heterogeneity and the decomposition process, raises additional questions: (a) How does the variability in the solid particle density, caused by waste heterogeneity, affect the initial void ratio, e 0 ? (b) How does the variability in the solid particle density, caused by the decomposition process, affect the final void ratio, e 1 , and the corresponding dry density?
To find the answers to these questions, a comprehensive experimental program was carried out. The validity of Equation (3) for MBT waste material was checked using the air pycnometer method. The same method was also applied in order to examine the variability in the solid particle density caused by waste heterogeneity and its influence on the initial void ratio. The variability in the solid particle density caused by waste decomposition and its impact on the final void ratio was examined with the long-term oedometer test. The experimental program was carried out on the MBT reject waste specimens obtained from the MBT plant in Marišćina, Croatia. In the end, a one-dimensional ρ d = f e correlation, applicable to the tested waste material, was proposed. The main advantage of the proposed correlation is its ability to establish the corresponding dry density at an arbitrary chosen void ratio, without the exact knowledge of the solid particle density, as in the case of Equation (3).

2. Materials and Methods

2.1. Origin of Waste Specimens

The waste specimens were taken from the waste management center (WMC) in Marišćina, Istria, Croatia [11]. The center comprises an MBT plant, a bioreactor landfill, a WWT plant, and infrastructure that includes administrative buildings, two weighbridges, internal roads, etc. The center primarily accepts mixed MSW, with a maximum daily capacity of 400 t/day.
Prior to landfilling, the accepted mixed MSW is transferred to the MBT plant to undergo biological and mechanical treatment processes. The treatment process consists of the following steps: shredding, biodrying, recovering recyclables (ferrous and non-ferrous metals), producing refuse-derived fuel (RDF), and separating reject fraction into heavy and fine (organically rich) reject fractions. Because fine reject fraction has a high organic content, it is suitable for energy recovery purposes once disposed of in the WMC Marišćina bioreactor landfill. Currently, fine reject fraction is landfilled in the dry state of the material. The dry density of the landfilled reject fraction is close to 380 kg/m3, as reported by the Marišćina landfill operator. Only after the closure of the Marišćina landfill will the fine reject fraction be submitted to the wetting process in order to maximize gas production and methane recovery.
The required waste specimens were obtained immediately after the treatment process was finished and before the specimens were sent to the landfill. To prevent decomposition, the specimens were stored in hermetically sealed vacuum bags in the dry state of the material.

2.2. Experimental Program

For the purposes of this research, two experimental methods were applied, namely, the air pycnometry method and the oedometer test. With the air pycnometer method, the specimens were tested under atmospheric pressure and at low dry density values. In the oedometer device, the material was tested under higher vertical stresses in the dry and wet states of the material in order to simulate the following operational conditions of the Marišćina landfill: (a) the early operational stage, when the material is landfilled in its dry state, and (b) the post-closure operational stage, when the material is moistened with the aim of inducing the decomposition process.
In addition, basic geotechnical properties, i.e., the as-received moisture content, organic content, and particle size, were also determined. In [12], more details can be found about the testing procedure that was applied in order to establish the basic geotechnical properties of the tested waste material.

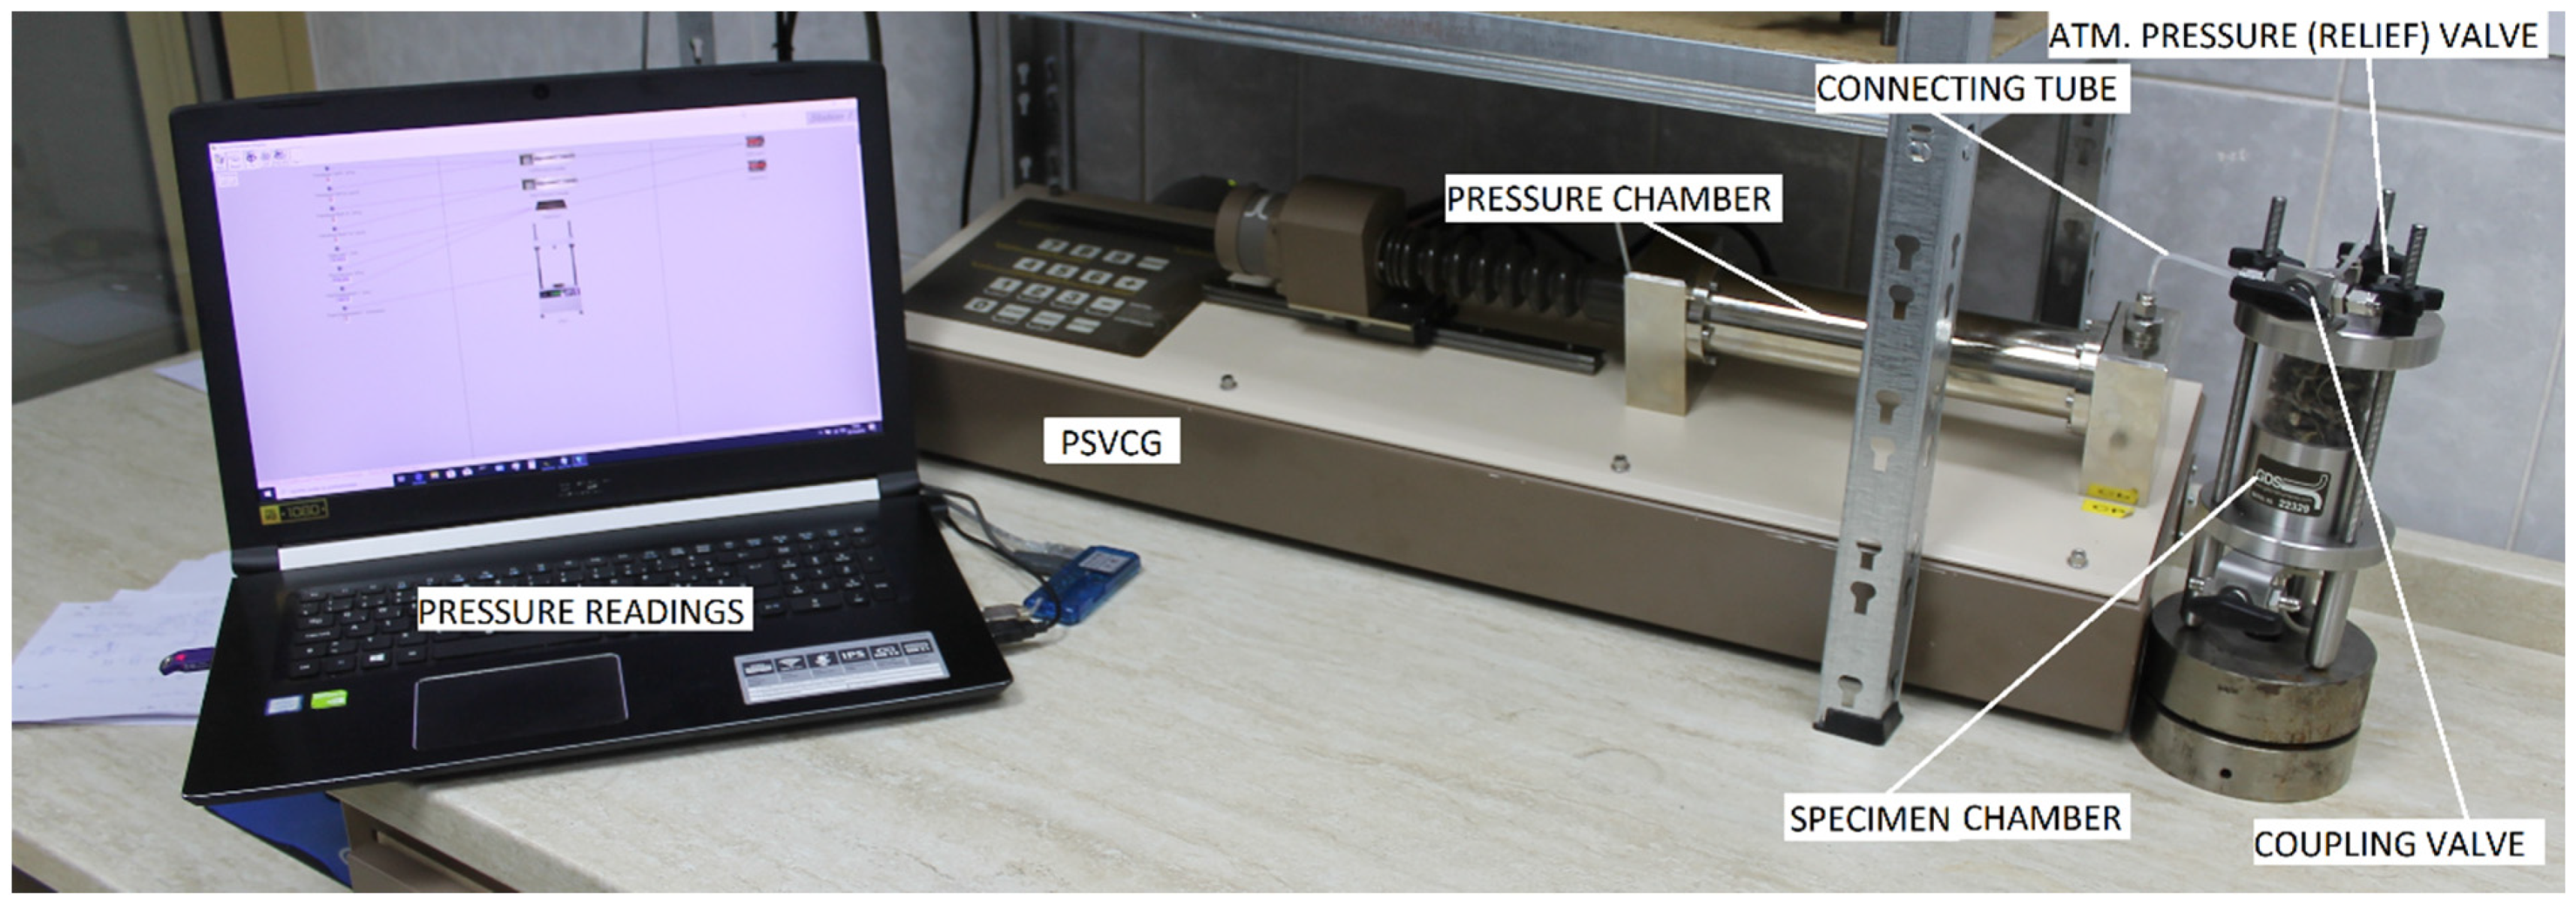
2.2.1. Air Pycnometry Method

According to [13], the most suitable and accurate technique for obtaining reliable measures of the void ratio is the air pycnometry method. The authors also reported that existing commercial air pycnometers are costly and too small to analyze representative specimens of solid waste. Thus, in order to measure the void ratio and solid particle density of sampled waste material, a constant-volume air pycnometer was mimicked using standard geotechnical equipment. A constant-volume air pycnometer consists of pressure and specimen chambers, connected with a tube and a coupling valve. For the pressure chamber, a general-purpose fluid pressure source and volume change gauge (PSVCG) was used for the precise regulation and measurement of fluid pressure and volume change. For the specimen chamber, a toxic interface unit cell was used [14]. A photograph of the mimicked air pycnometer device is shown in Figure 1. More details about the proposed air pycnometer setup, its calibration, and its accuracy can be found in [15].
In total, 60 waste specimens were tested in the air pycnometer device. The specimens were poured into the top of the specimen chamber in the dry state of the material, as can be observed in Figure 1. The specimens were divided into six groups, with ten specimens per group. Each group, denoted as #1, #2, #3, #4, #5, and #6, had designated constant mass values of 0.0260 kg, 0.0375 kg, 0.0486 kg, 0.0596 kg, 0.0706 kg, and 0.0817 kg, respectively. The volume of the specimen chamber was 220.683 × 10⁻³ m3. Consequently, each designated group of specimens had constant dry density values of 118 kg/m3, 170 kg/m3, 220 kg/m3, 270 kg/m3, 320 kg/m3, and 370 kg/m3, respectively. For each tested specimen, corresponding triplets of values e , ρ d ,   and   ρ s were recorded.

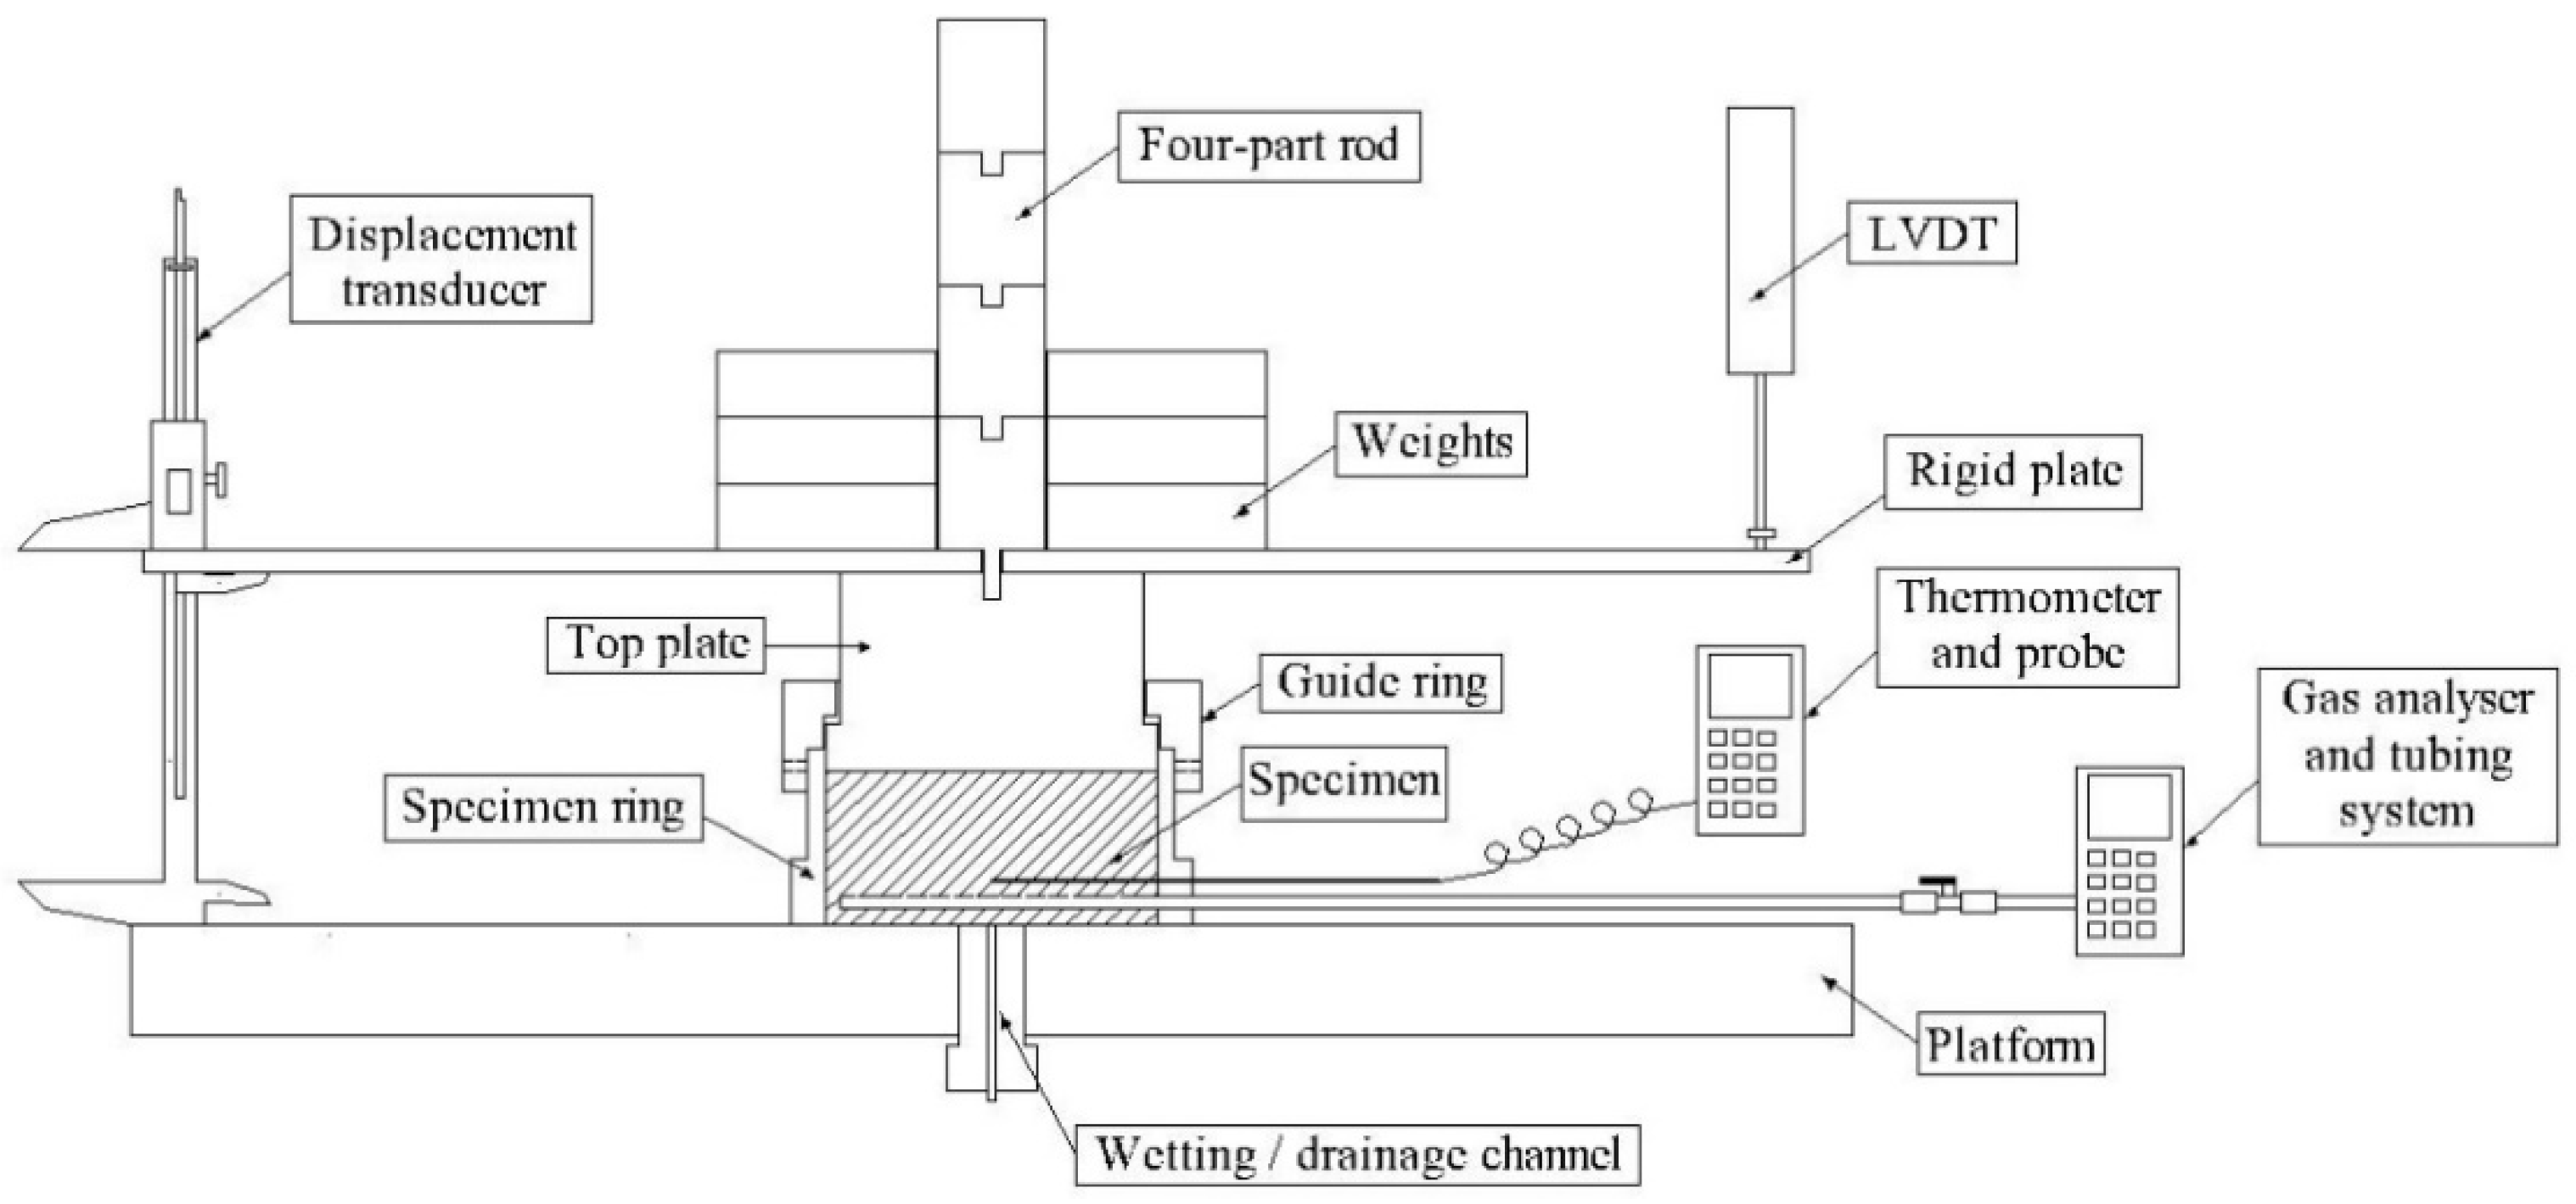
2.2.2. Oedometer Method

The oedometer device used in this study consisted of a specimen cell (d = 150 mm; h = 80 mm), top platen, sliding rail, displacement transducers (two calipers and one LVDT), weights, and a four-part steel rod. The cross-section of the used oedometer device is shown in Figure 2. The vertical stress was applied as a “dead” load using squared metal weights. The purpose of the steel rod was to keep the weights in the center of mass.
The sitting pressure caused by the top platen was 5.39 kPa. To reduce the friction between the top platen and the oedometer cell, talc powder and silicone spray were applied. The differential settlements and tilting of the top plate were prevented with a sliding rail. The absence of tilting was verified with three displacement transducers positioned in a triangular shape.
With the described oedometer device, a single long-term oedometer test was conducted. The tested waste specimen was installed in the oedometer cell in the material’s dry state. The initial dry mass of the installed specimen was 0.42 kg and the final specimen height was 0.0629 m. Based on the specimen size and its dry mass, the determined dry density of the installed specimen was 380 kg/m3. The mean solid particle density of the installed specimen, as determined by the air pycnometer, was 1820 kg/m3, with a standard deviation (SD) of ±190 kg/m3. The initial void ratio of the installed specimen, as established with Equation (3), was 3.79.
The compression procedure consisted of four consecutive vertical stress increments in the following order: 11.78 kPa, 11.21 kPa, 22.94 kPa, and 22.88 kPa. Each stress increment was kept for 24 h. Before the first vertical stress increment was applied, the specimen was submitted to a sitting pressure of 5.39 kPa and the corresponding initial settlements were recorded. The maximum vertical stress applied on the specimen was 74.2 kPa.
At a vertical stress of 74.2 kPa, the specimen was submitted to the wetting procedure. Initially, 2 × 10⁻⁴ m3 of water was added through the bottom of the specimen (Figure 2). After the completion of the wetting process, the specimen was left under the same vertical stress for the next 354 days. In the following days, the settlements caused by wetting, mechanical creep, and the decomposition process were continuously monitored. The landfill gas (i.e., CH4) was measured once per week with a GA 5000 gas analyzer (Figure 2). In order to support the microbiological activities, additional amounts of water (1 × 10⁻⁴ m3) were occasionally added to the specimen through the oedometer’s wetting channel (Figure 2).
Based on the measured data, the dry density and corresponding void ratio were calculated after each stress increment. In addition, after the completion of the test, the final solid particle density and final dry mass of the tested specimen were also established.

3. Results and Discussion

3.1. Basic Geotechnical Properties of the Tested Waste Material

The average as-received moisture content and organic content of the tested waste material were 10.13% and 55.3%, respectively. The granulometric analysis showed that the tested waste can be characterized as coarse-grained material. Additional information about the established basic geotechnical properties of the tested MBT waste material can be found in [12].

3.2. Air Pycnometer Test Results

Figure 3a,b show the experimental data obtained with the air pycnometer device for all six consecutive groups of specimens. The presence of strong variability in the solid particle densities within each tested group of specimens is noticeable in both subfigures. The observed variability can be explained by the strong heterogeneous nature of the tested waste. Clearly, contrary to what might be expected, the treatment process did not significantly reduce the heterogeneity of the tested waste material.
The percentage ranges within which the solid particle densities varied for each consecutive group were 19%, 20%, 6%, 13%, 9%, and 21%, respectively. Consequently, the void ratio of each consecutive group also varied within the similar percentage limits. The obtained percentage ranges notably differed among the tested groups, indicating that each tested group had different levels of heterogeneity. The obtained SD values of the solid particle density and void ratio (Figure 3a) revealed that group #3 contained the fewest heterogenous specimens, whereas groups #1 and #2 consisted of the most heterogeneous specimens. Moreover, it is interesting to observe that, even though groups #1 and #6 shared similar solid particle density SD values, the corresponding void ratio SD values significantly differed. Clearly, the SD void ratio value of group #6 was much smaller than the SD void ratio value of group #1. This finding indicates that a strong variation in the solid particle density does not necessarily provide a strong variation in the corresponding void ratio. However, further research is necessary to better understand this anomaly.
In addition, Figure 3a also presents the theoretical curve obtained with Equation (3), with a constant solid particle density set to 1600 kg/m3. Clearly, these particular specimens, for which the measured solid particle densities lie close to 1600 kg/m3, strongly resemble the theoretical curve.
These results are a strong indication that, for waste materials, a set of ρ d   vs .   e hyperbolic curves, in which each curve is defined with a unique solid particle density value, do exist.
Figure 3b shows the measured ρ s   vs .   e relationship of each consecutive group of specimens. The presented results confirm that, for the tested waste material, a strong positive linear correlation between the solid particle density and void ratio under constant dry density, does exist. Clearly, the obtained gradients presented in Figure 3b correspond to dry density values.
During the experiment, the mass and total volume ( V = V v + V s ) of all the specimens were kept constant. Therefore, the increase in the solid particle density was conditioned exclusively by the decrease in the solid particle volume ( V s ). This implies that the size, shape, and orientation of individual solid particles also played a significant role in the formation of the waste specimen skeleton and its total volume.

Variability in the Solid Particle Density Caused by Waste Heterogeneity and Its Influence on the Estimation of The Initial Void Ratio

In practice, it is not so uncommon that the solid particle density of waste material is estimated based on the values obtained from the available literature. This approach is the legacy from soil mechanics, in which it is customary to estimate the solid particle density of soils. However, because the solid particle density of soils varies within the small range of values, the estimated value does not introduce significant errors into the further calculations.
With respect to the waste materials, such an approach should be avoided. Table 1 presents the solid particle densities of MBT waste gathered from the published literature. As expected, the collected values lie in a very wide range from 1260 kg/m3 to 2210 kg/m3. Clearly, a significant scatter of solid particle density values among the various types of MBT waste can be anticipated. Moreover, although Table 1 shows the solid particle densities of MBT waste, none of the collected values are an exact match for the solid particle density of the waste material considered within this research. This finding clearly reveals that the estimation of the solid particle density of MBT waste material based on published data is not feasible. Such an approach will most certainly end up with an incorrect estimate of the solid particle density, and consequently lead to the incorrect prediction of the initial void ratio.
In addition, Figure 3a,b reveal that even in single MBT waste material, strong variability in the solid particle density among the tested specimens can be anticipated. For example, the measured solid particle density of group #1 was in the range from 1666 kg/m3 to 2055 kg/m3. Such a wide range of solid particle density values will have a significant influence on the initial void ratio estimate because, as Figure 3b clearly demonstrates, the increase in the solid particle density is followed by a corresponding increase in the initial void ratio. Thus, the solid particle density of any kind of waste material under consideration has to be established experimentally.
In the case of the necessity to estimate the solid particle density of waste material, the authors recommend using Equation (4), as proposed by [2]:
ρ s = 1 i μ i ρ s i
where ρ s i and μ i are the solid particle density and mass fraction of each waste component ( i ), respectively. For a precise estimation of the solid particle density in accordance with Equation (4), a thorough compositional analysis of waste has to be conducted. In addition, the accurate values of the solid particle densities of each waste component must also be known. More details about the solid particle density of the individual waste components can be found in [3,24].

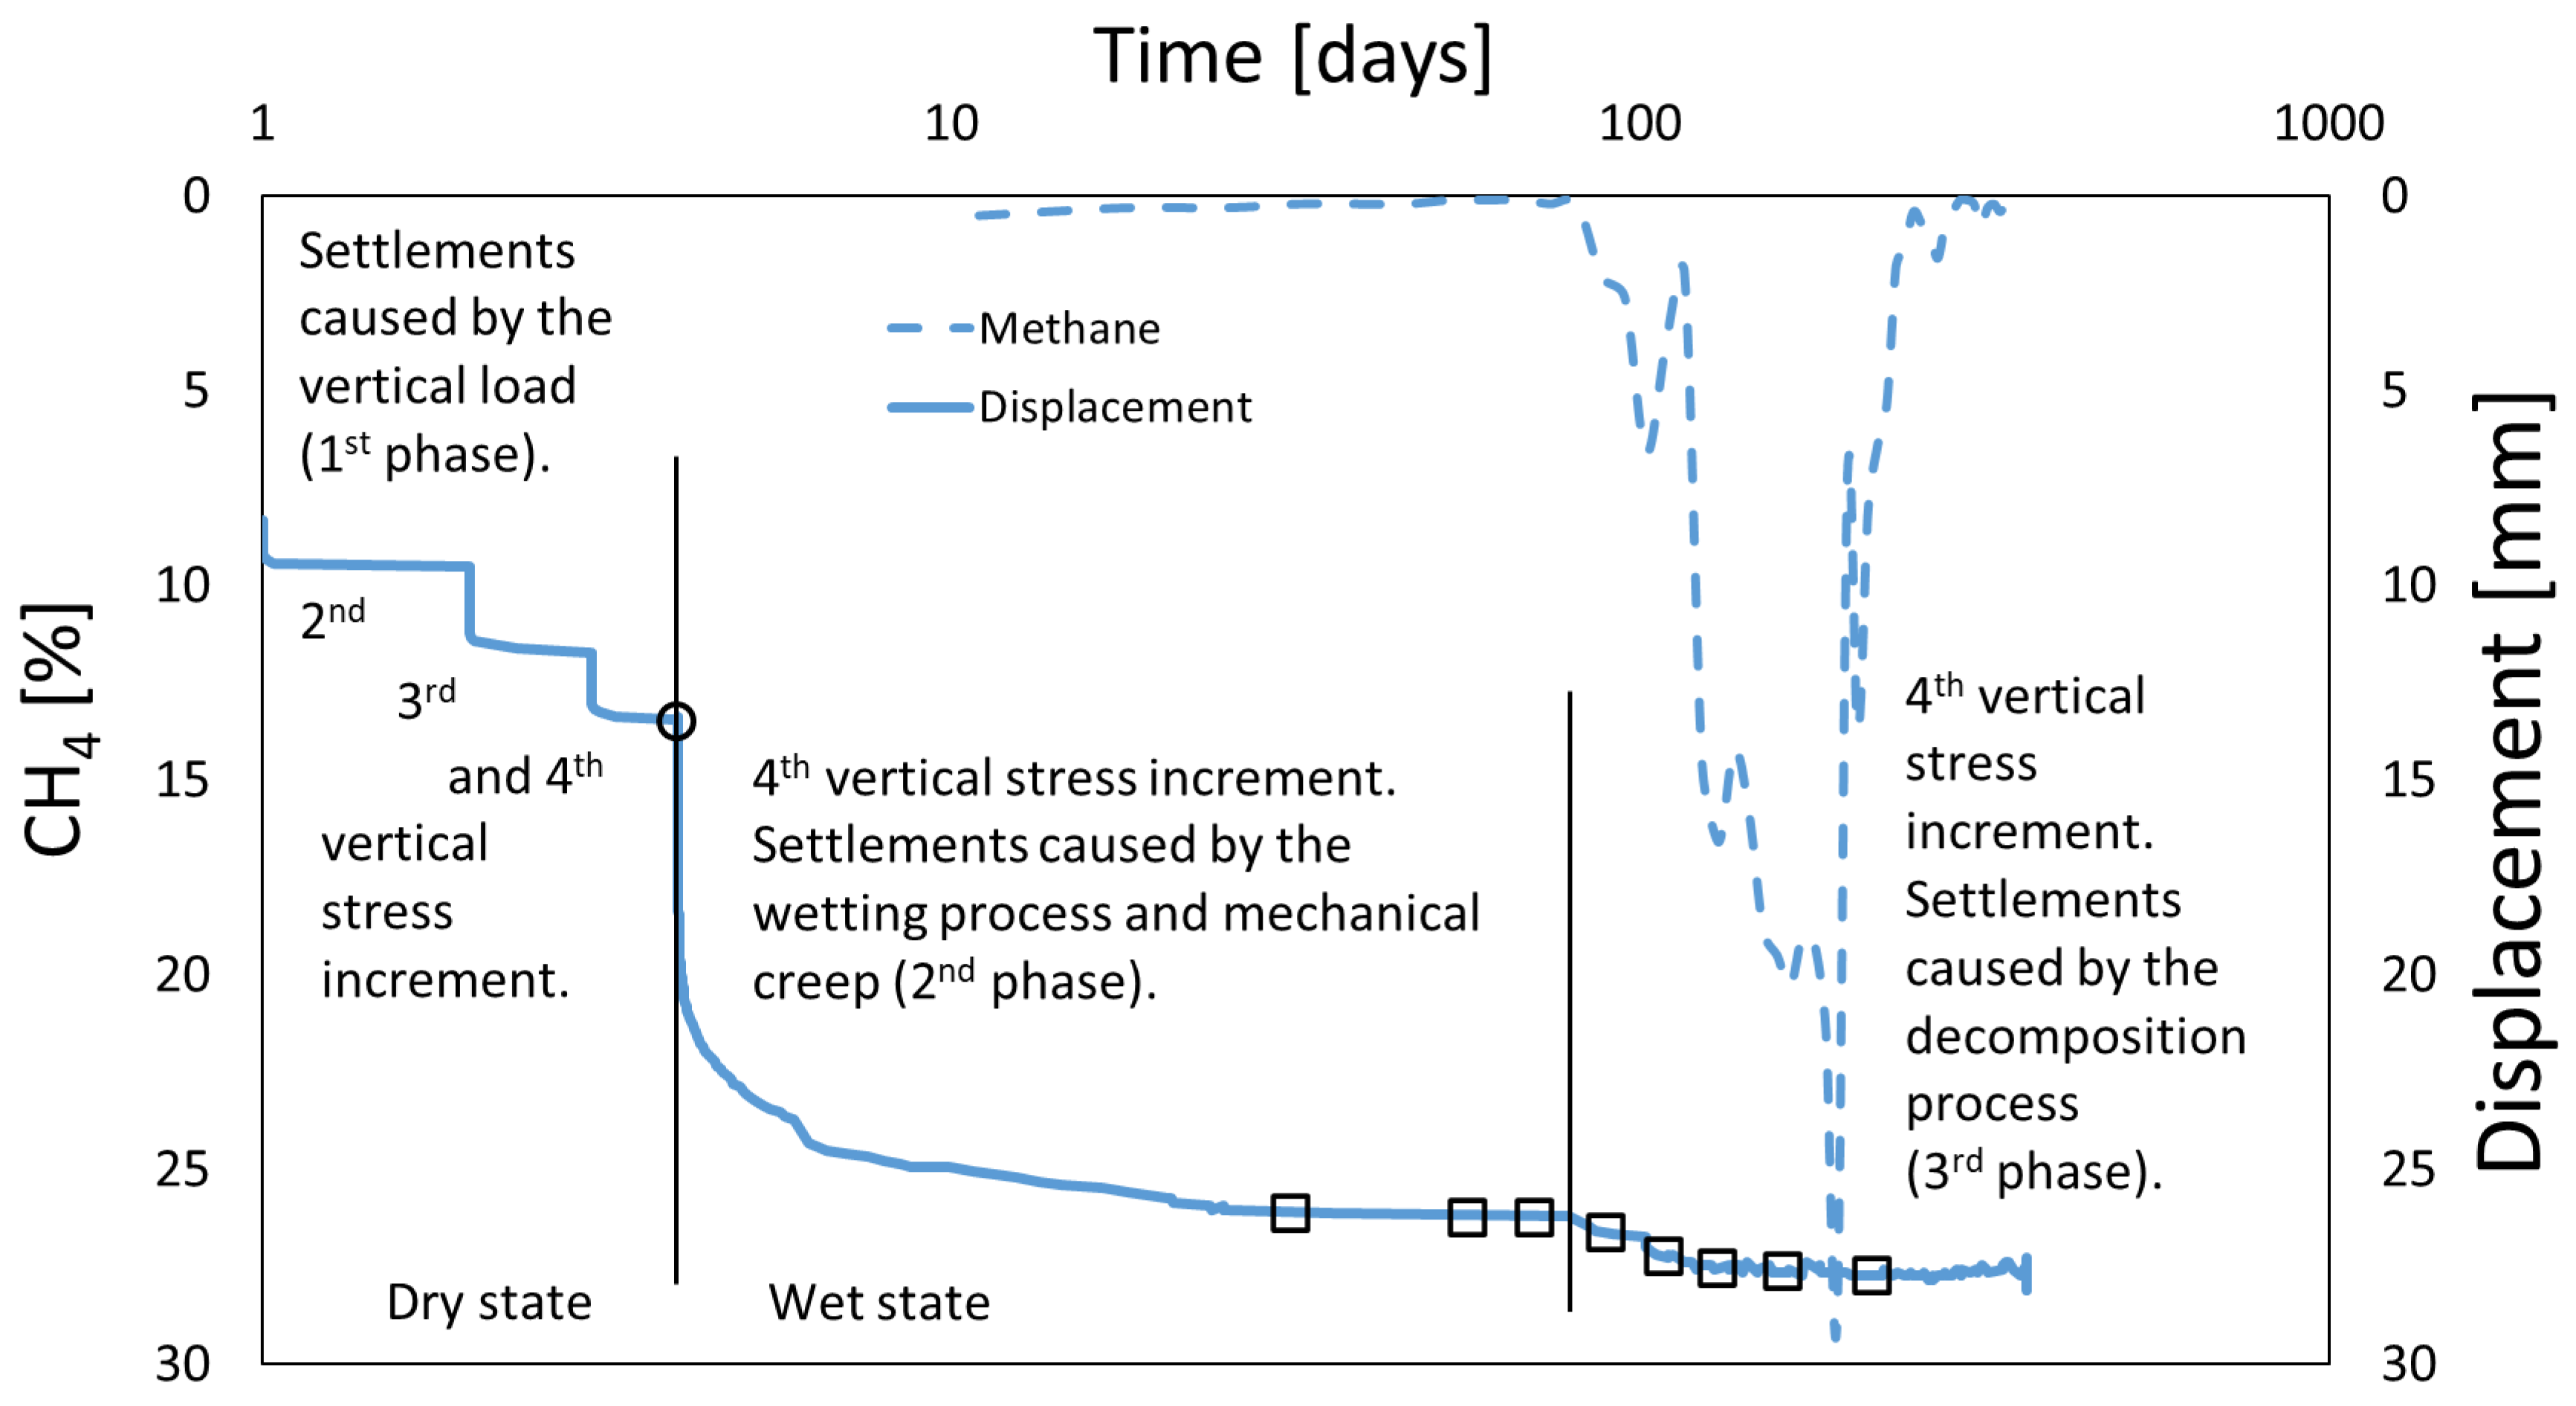
3.3. Oedometer Test Results

Figure 4 shows the results obtained from the oedometer test, namely the displacements and the generated CH4 gas over the time of the experiment. From Figure 4, three distinctive phases can be distinguished.
The first phase is related to the increase in the vertical stress while the specimen was in the dry state of the material. Such a condition reflects the current operational stage of the Marišćina landfill. The second phase denotes the beginning of the post-closure landfill state when the wetting process is going to be initiated. The initial wetting point is denoted in Figure 4 with a white circle and subsequent wetting points are denoted with white squares. Clearly, immediately after the wetting process was initiated, a significant amount of settlement took place. It is also interesting to observe that subsequent wetting did not produce additional settlement caused by wetting. Therefore, settlement that took place approximately 24 h after the initial wetting process can mostly be attributed to mechanical creep and, to a minor extent, to aerobic decomposition. The third phase denotes the anaerobic decomposition phase, which has a high methane yield rate.
Figure 4 reveals that in the first operational phase of the Marišćina landfill, only 50% of the total settlement will occur. The majority of the remaining 50% will take place in the second phase when the wetting process will be initiated. A minor degree of additional settlement will occur in the third phase due to the anaerobic decomposition of the organic content.
Figure 5 presents the coupled experimental results obtained with air pycnometer and oedometer tests. The lower half of Figure 5 shows the results obtained with the air pycnometer, whereas the upper half of Figure 5 presents the results obtained with the oedometer device. The results obtained with the oedometer device in Figure 5 are denoted with the following symbols: the black triangles represent the dry state of the material and the densification caused by the vertical load; the red triangle corresponds to the wet state of the material and the compaction caused by the wetting procedure, mechanical creep, and aerobic decomposition; and the blue triangle depicts the “compaction” caused by the anaerobic decomposition process. For comparison, the theoretical curve, obtained with Equation (3) at a constant solid particle density set to 1820 kg/m3, is also presented in Figure 5. In addition, Figure 5 also shows black lines, which represent the void ratio boundaries attained with Equation (3) at a solid particle density of 1820 kg/m3 ± SD of 190 kg/m3. Once again, the particular air pycnometer specimens, which measured the solid particle density, lie close to 1820 kg/m3, strongly resembling the theoretical curve.
Obviously, the oedometer data also resemble the theoretical curve because the initial void ratio of the tested specimen was also calculated at a mean solid particle density of 1820 kg/m3. Consequently, subsequent changes in the void ratio, caused by the vertical load, wetting process, and mechanical creep, also show a good fit with the theoretical curve. However, due to the strong heterogenous nature of the tested waste material and the strong variability in the solid particle density, it is more realistic to expect that the void ratio varies within the limits denoted with black lines. From Figure 5, it can be seen that only one oedometer point (denoted with a blue triangle) significantly deviated from the theoretical curve. This is the point where the decomposition process ended. The observed deviation was caused by the decomposition process, which increased the solid particle density and simultaneously decreased the dry density of the tested specimen.

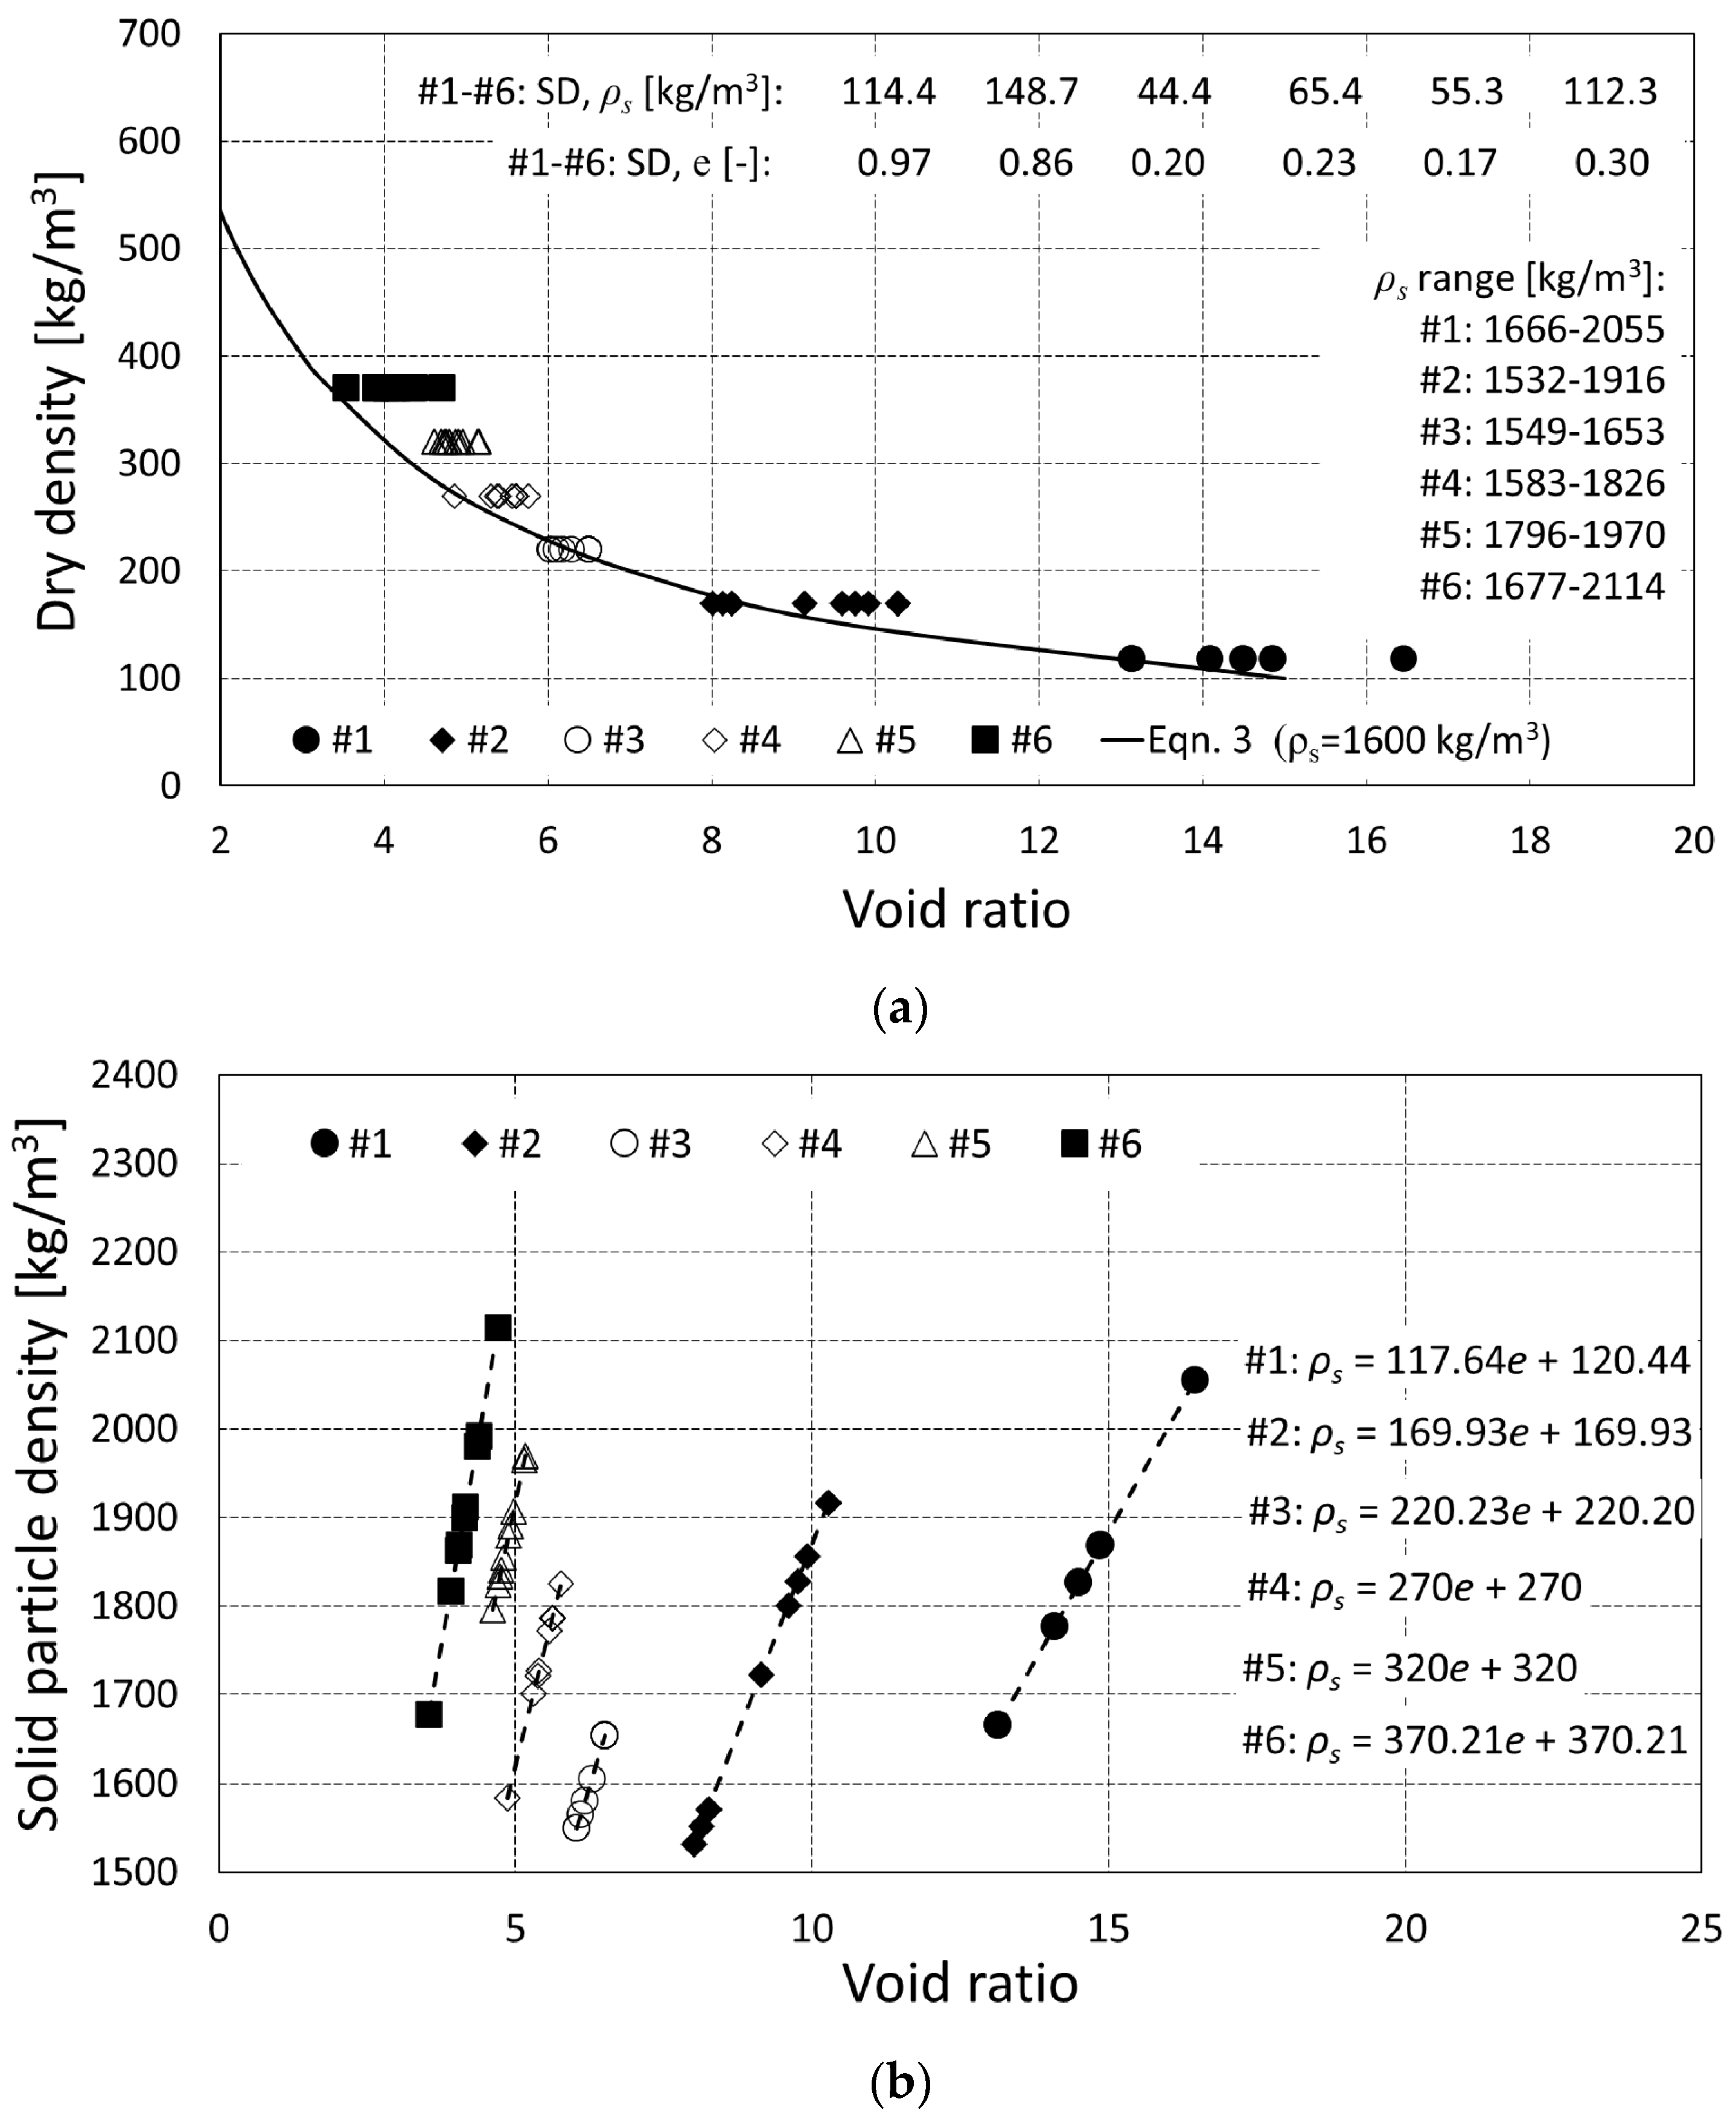
Variability in the Solid Particle Density Caused by the Decomposition Process and Its Influence on the Final Void Ratio and Dry Density Values

During the anaerobic decomposition phase, the specimen’s dry mass and height decreased by 0.084 kg and 1.89 mm, respectively. With respect to the initial value, the specimen’s dry mass decreased by 20%. Evidently, the loss of the organic particles reduced the dry mass and opened additional void space, while at the same time, the compaction of the sample caused by the overburdened pressure took place.
Moreover, the solid particle density of the tested specimens, which was measured with the air pycnometer, also increased to 2053.7 kg/m3 (or 11%) with respect to the initial solid particle density value. Both the decrease in the dry mass and the increase in the solid particle density can be solely attributed to the loss of biodegradable organic matter. It is worth noting that other researchers [3,8] also confirmed that the solid particle density of organic waste materials increased with the progression of the decomposition process.
Except for decomposition, the solid particle density of waste materials also increased with the increase in the applied vertical stress [25,26]. However, for the MBT waste material considered within this research, the compaction process increased the solid particle density only by a negligible amount [15]. Therefore, the increase in the solid particle density in the present research was solely attributed to the decomposition process.
As can be seen from Figure 5, the void ratio and corresponding dry density at the beginning of the anaerobic decomposition phase were 1.79 and 641.4 kg/m3, respectively. At the end of the anaerobic decomposition phase, the recorded dry density and corresponding void ratio were 540 kg/m3 and 2.80, respectively. Therefore, with respect to the initial values, the final dry density decreased by 16%, while the final void ratio increased by 36%. From the definition of dry density, it becomes obvious that the loss of mass caused by the degradation process had a greater impact on the final dry density than did the simultaneous decrease in the sample volume due to the applied vertical stress. Clearly, the amount of settlement caused by the decomposition process was not sufficient to reduce the sample volume to such an extent that it could efficiently compensate for mass loss. Consequently, the final void ratio and final dry density did not exceed their values from the beginning of the decomposition process, as might be anticipated when considering only the short-term oedometric test results.
Although additional settlements caused by the decomposition process would act beneficially to the total landfill capacity, it would also decrease the dry density values and produce a more porous material.

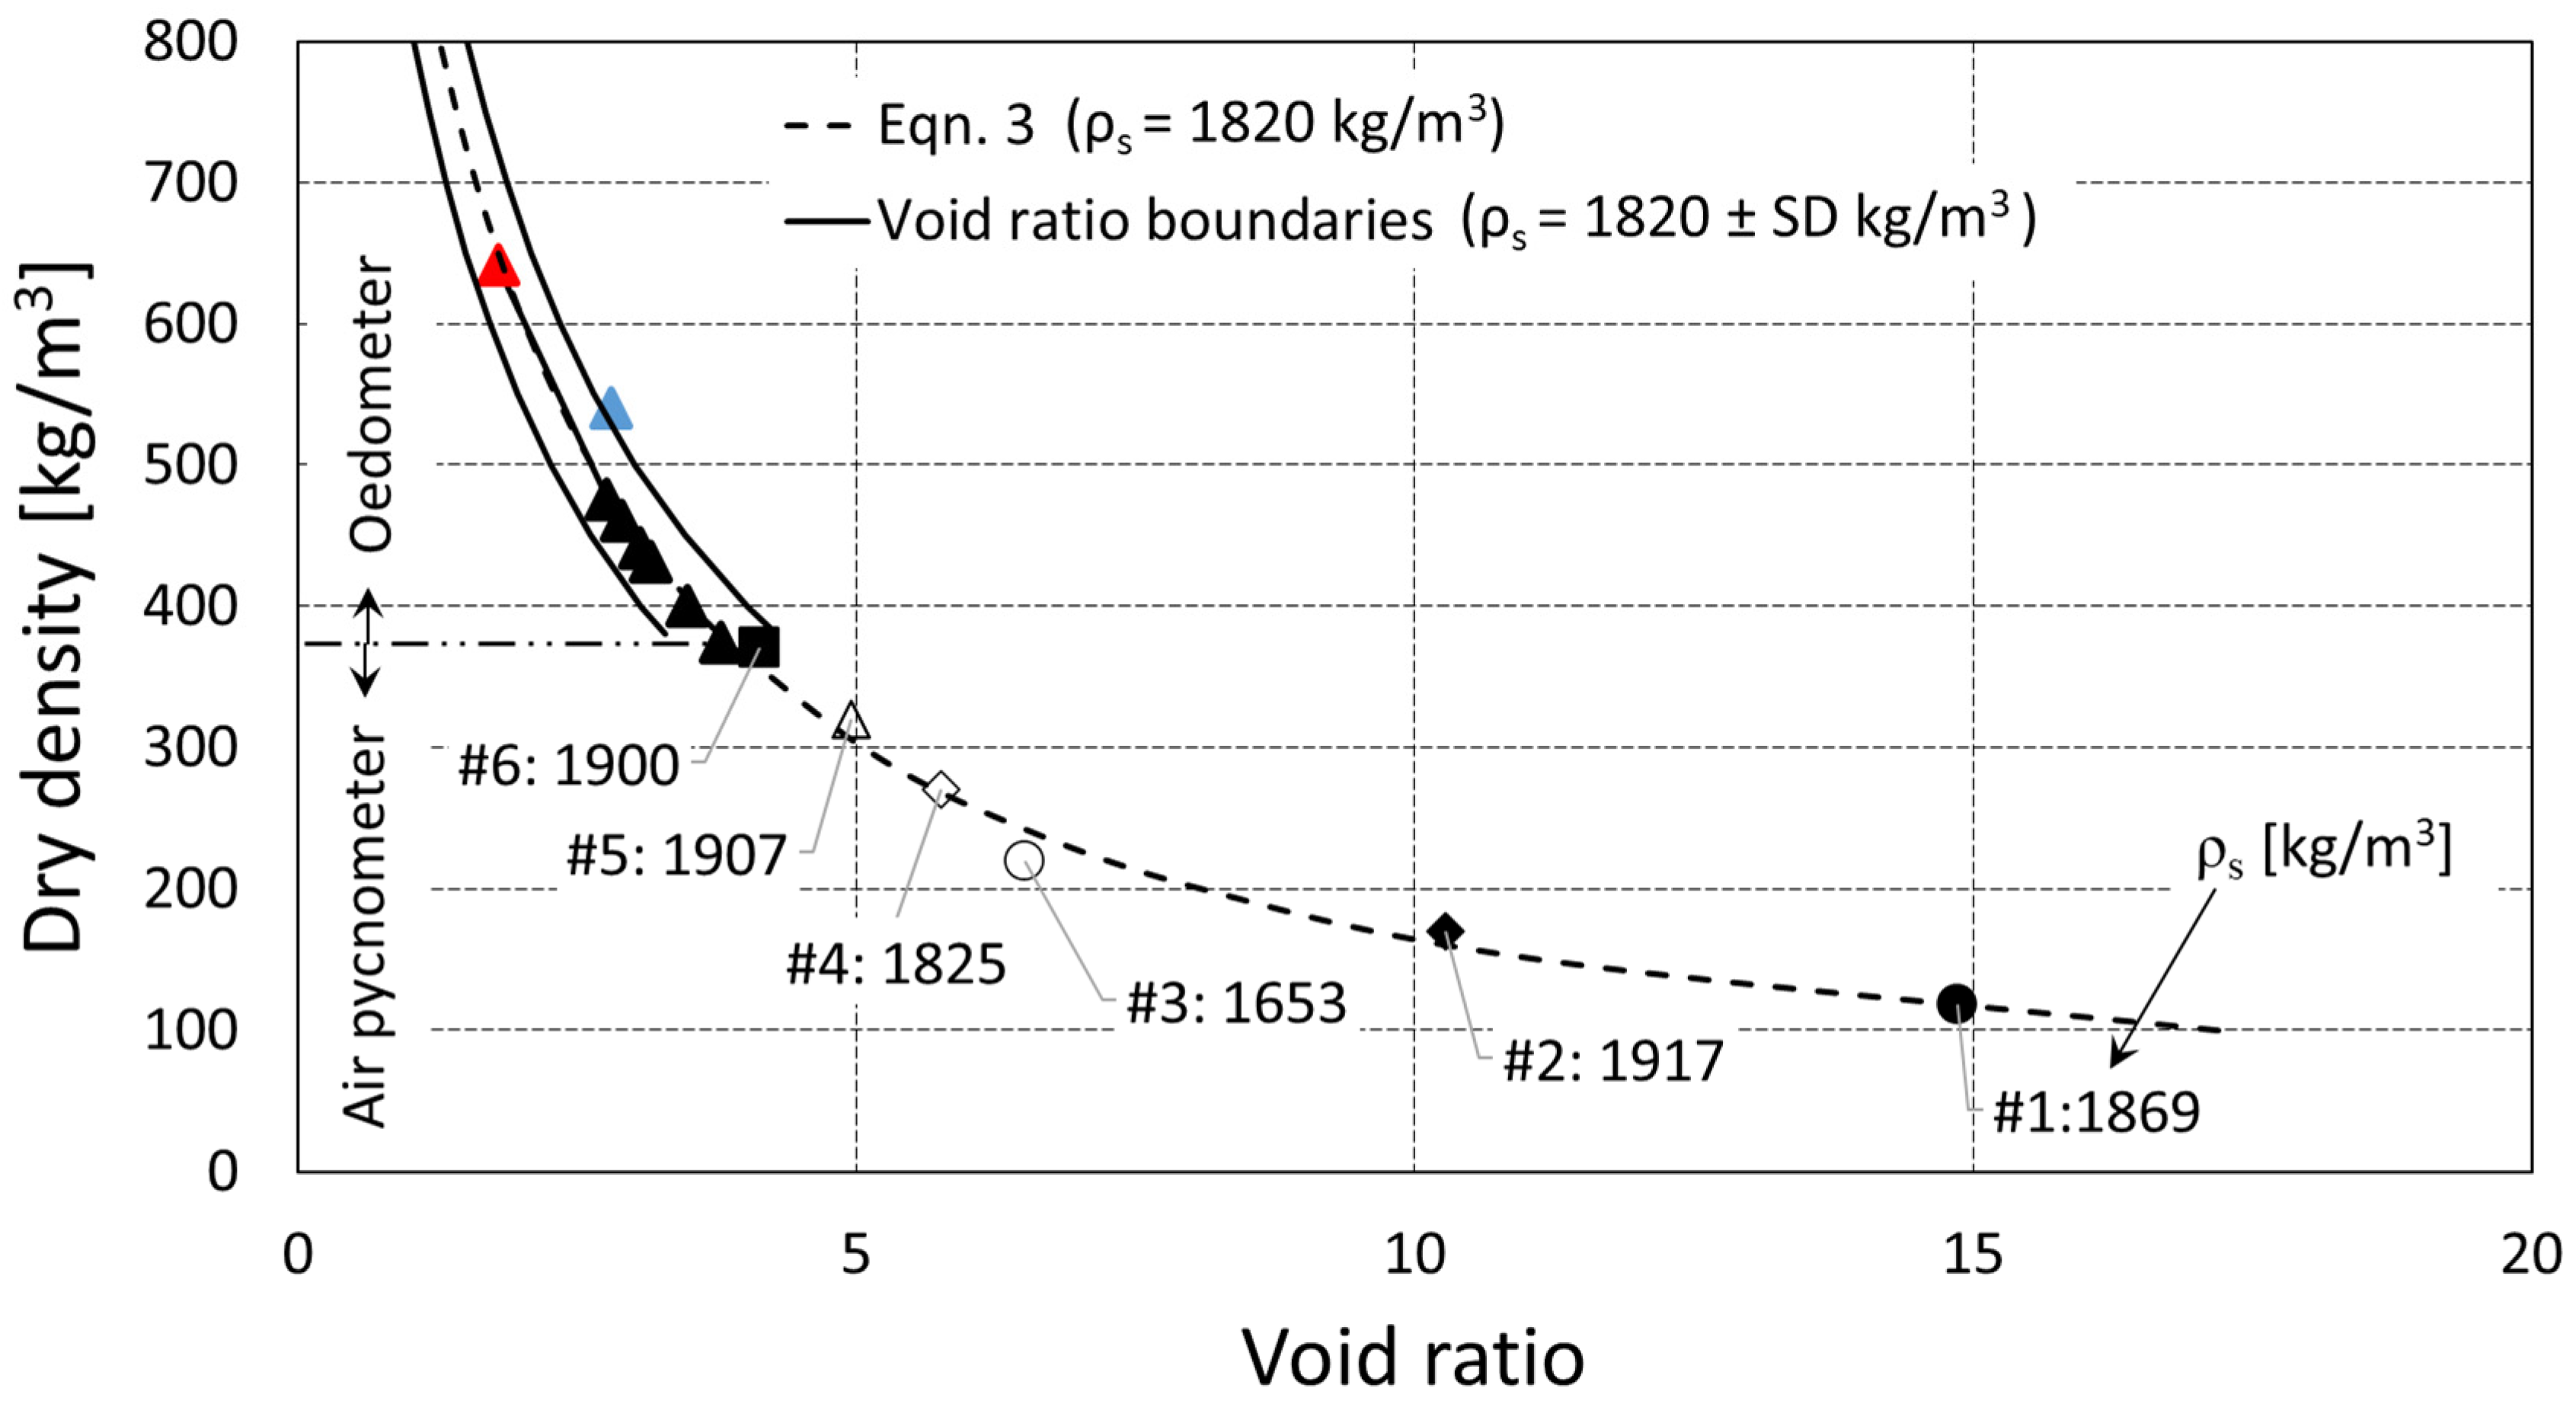
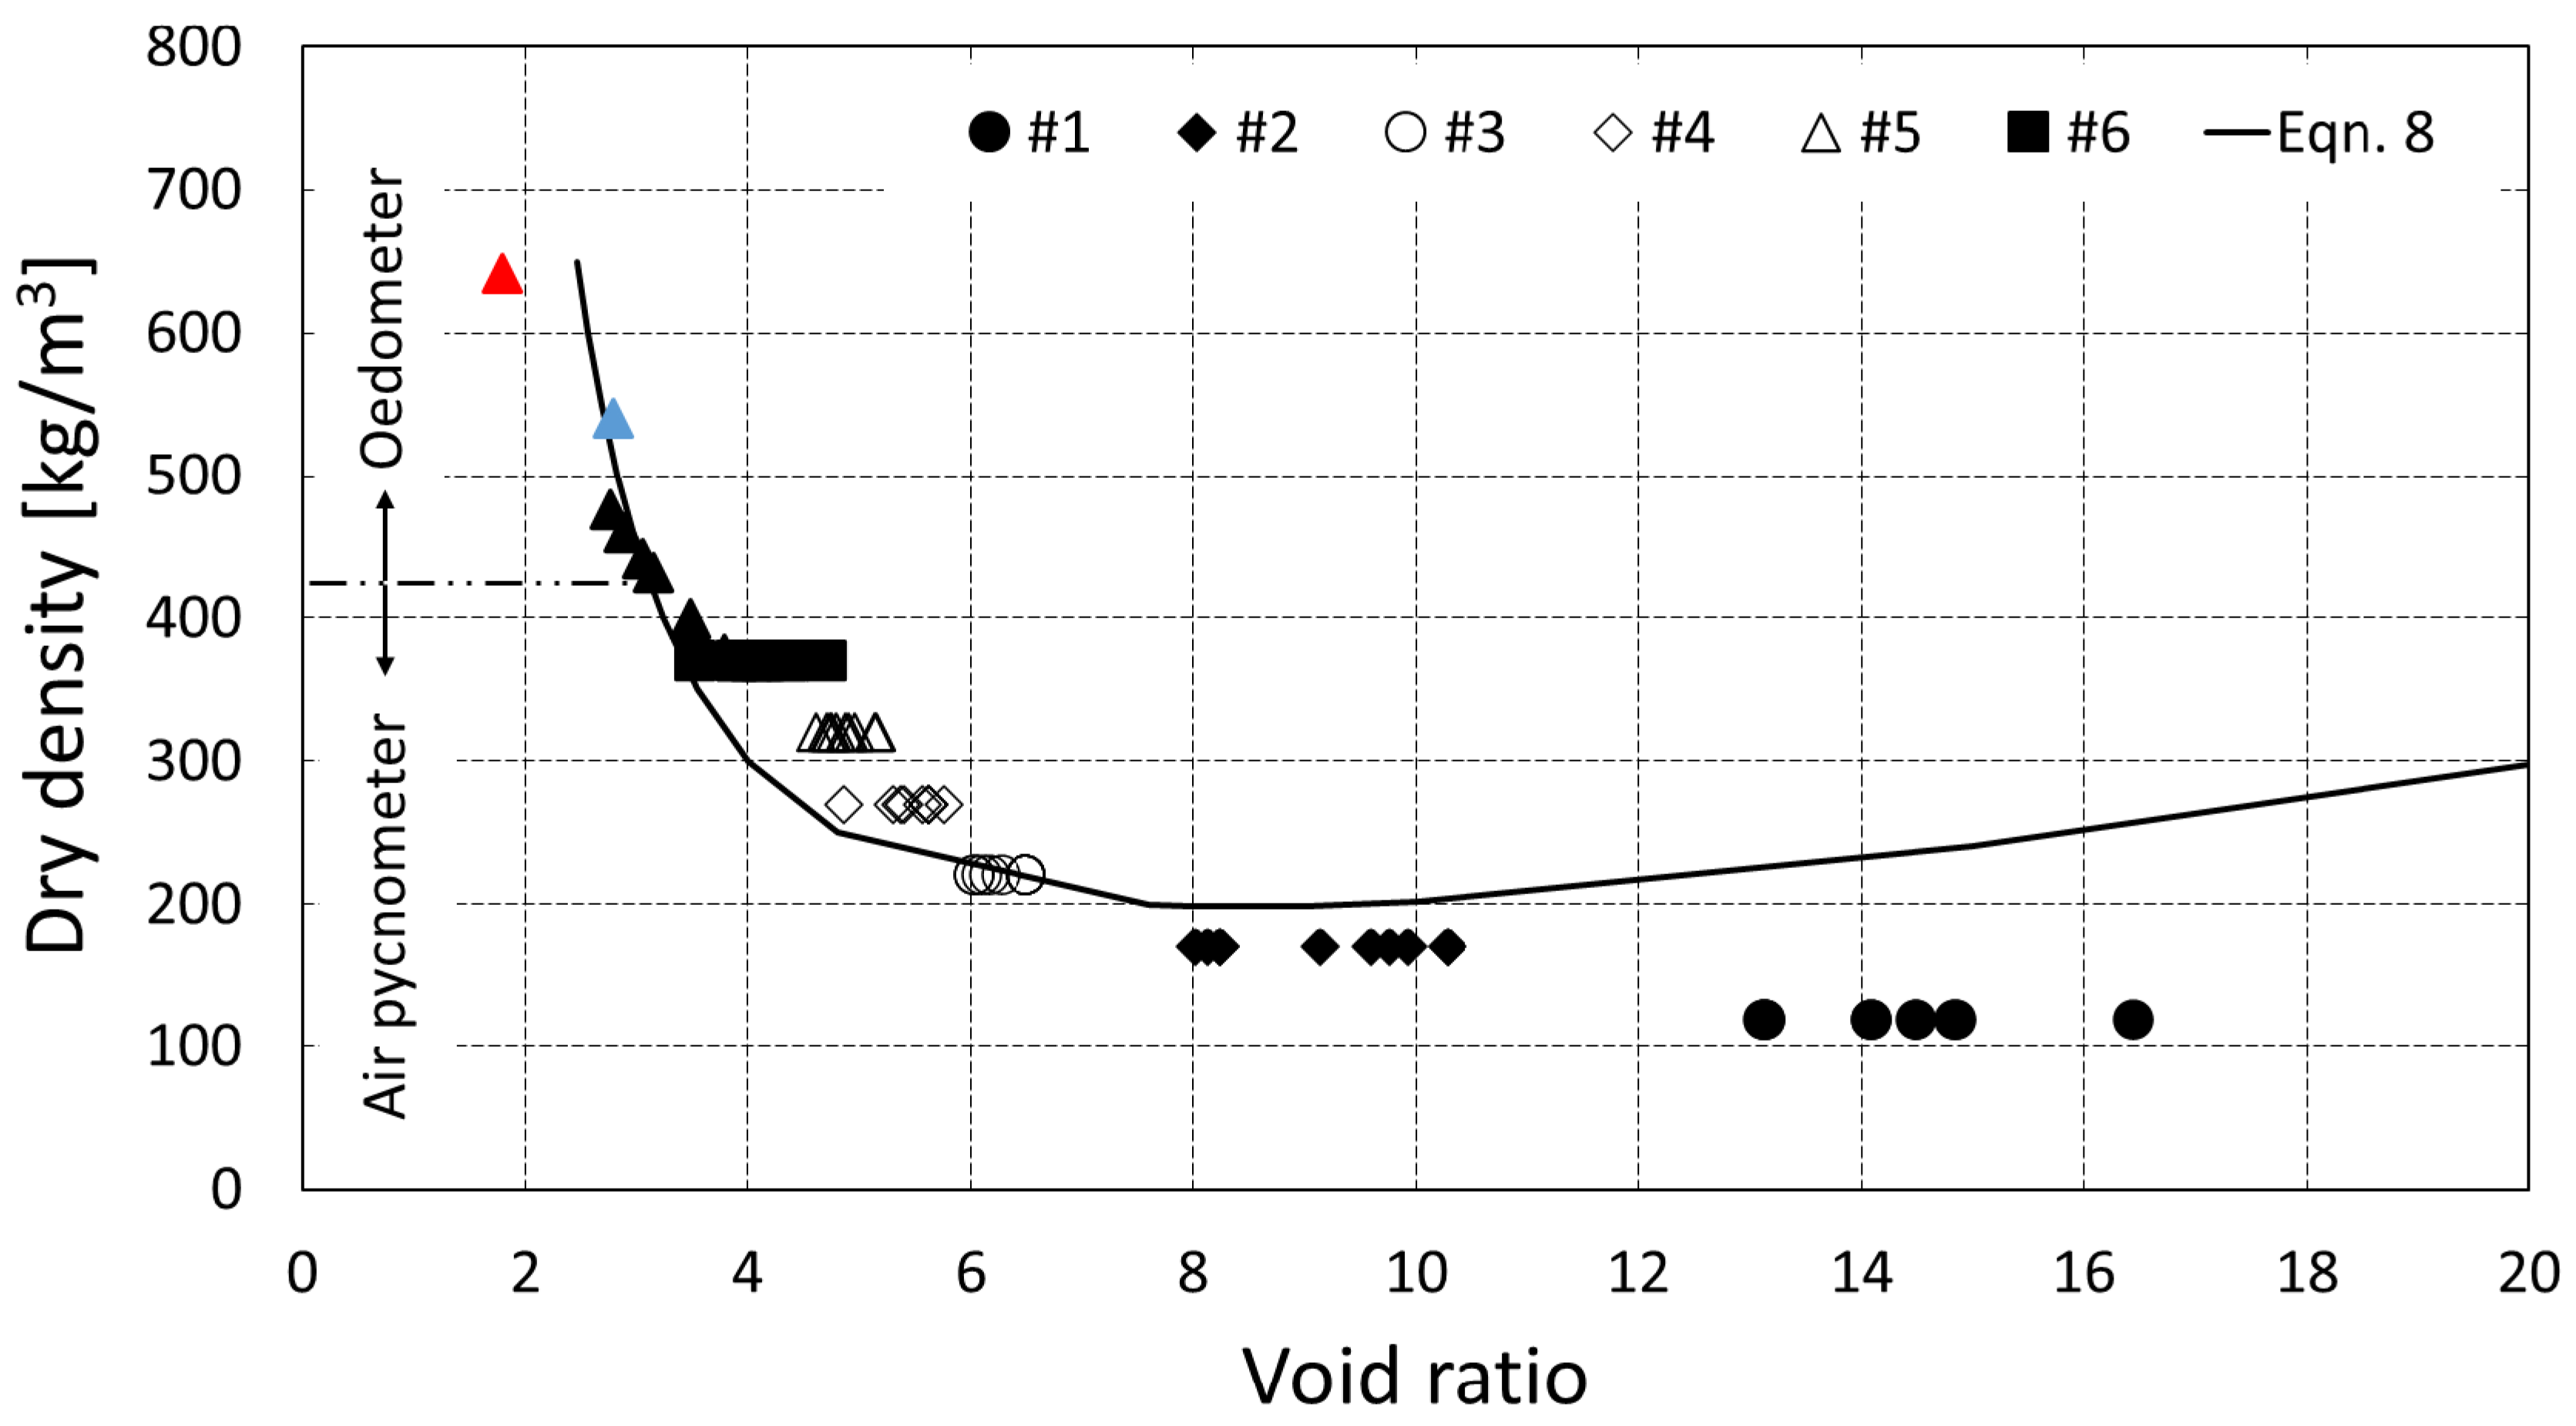
3.4. Empirical Correlations between the Solid Particle Density, Dry Density, and Void Ratio

Based on the measured triplets of data e , ρ d , and   ρ s obtained with the air pycnometer, an empirical correlation between the solid particle density, dry density, and void ratio can be obtained. Equation (5) shows the mathematical expression of the best fit correlation obtained using XLSurfFit 3D surface fitting software:
e = ρ s b ρ d c a  
where a, b, and c are the following coefficients: a = 0.966128 ;   b = 1.003598 ;   c = 1.005804 . The resemblance between Equations (3) and (5) is obvious. The coefficient a represents the asymptote at e = 0.966128 , while coefficients b and c represent the correction factors with respect to the measured solid particle density and dry density values. The resemblance between Equations (3) and (5) reveals that the theoretical Equation (3) is fully applicable to the MBT waste materials for which closed pores are removed due to a heavy treatment process.
Although there is no significant advantage of the proposed Equation (5) over the theoretical Equation (3), it is interesting to note that Equations (3) and (5) can be rearranged
ρ s = e + 1 ρ d
ρ s = e + a ρ d c b
Now, by equating Equations (7) and (8) and solving for ρ d , a direct correlation between the dry density and the corresponding void ratio can be obtained.
ρ d = 10 L o g e + a b · L o g 1 + e b + c
The advantage of Equation (8) in comparison with Equation (3) is its ability to evaluate the ρ d   vs .   e relationship of MBT waste material without needing to know the exact solid particle density value. However, the proposed Equation (8) can only be used in cases in which the waste material in question shares similar geotechnical properties and MBT processes as the waste material from which the Equation (8) is derived. Figure 6 reveals that the ρ d   vs .   e relationship obtained with Equation (8) coincides reasonably well with the oedometer test results. It should also be noted that the proposed equation for void ratios larger than 7.6 provides erroneous estimates of dry density values. Therefore, Equation (8) cannot be used for void ratios higher than 7.6 and dry density values below 200 kg/m3. However, the practical limitations of the proposed Equation (8) are irrelevant because the dry density of waste materials is commonly much higher than the 200 kg/m3.

4. Conclusions

The ability to predict the amount of settlement in sanitary landfills requires accurate knowledge of the solid particle density, bulk density, and void ratio of the landfilled waste material. Within this research, we demonstrated a strong dependence between the void ratio and the variability in the solid particle density caused by heterogeneity and decomposition. It is crucial that the solid particle density is accurately determined because false estimations of the solid particle density will most certainly lead to the erroneous prediction of landfill settlements. As a consequence, landfill capacity cannot be accurately assessed and an inefficient waste management strategy might be applied.
In order to overcome the difficulties related to the accurate assessment of the solid particle density, a one-dimensional ρ d = f e functional relationship was proposed. With the proposed relationship, it is possible to estimate the void ratio of landfilled MBT waste material without needing to know the corresponding solid particle density of the landfilled waste. However, it should also be noted that the proposed relationship was verified on MBT waste material for which closed voids were removed during the heavy treatment process. It is reasonable to assume that a similar relationship should exist for other kinds of waste materials that do not contain closed voids, or that only contain a small number of closed voids. To verify this assumption, further research on various types of waste materials is necessary. For the waste materials that contain large amounts of closed pores (for example, untreated municipal solid waste material), the proposed equation should not be used, nor should it be used in cases in which the waste in question does not share similar geotechnical properties to the waste from which the one-dimensional ρ d = f e functional relationship was obtained.

Author Contributions

Conceptualization, I.P.; methodology, I.P.; validation, N.K., N.H. and D.B.; investigation, N.K., N.H. and D.B.; writing—original draft preparation, I.P.; writing—review and editing, I.P.; supervision, I.P.; project administration, I.P.; funding acquisition, I.P. All authors have read and agreed to the published version of the manuscript.

Funding

This work was supported in part by the Croatian Science Foundation under the project number UIP-2017-05-5157.

Institutional Review Board Statement

Not applicable.

Informed Consent Statement

Not applicable.

Data Availability Statement

Not applicable.

Acknowledgments

We express thanks to Ivan Hip for his work in the early stage of this study.

Conflicts of Interest

The funders had no role in the design of the study, in the collection, analyses, or interpretation of data, in the writing of the manuscript, or in the decision to publish the results.

References

  1. Qian, X.; Koerner, R.M.; Gray, D.H. Geotechnical Aspects of Landfill Design and Construction, 1st ed.; Prentice-Hall Inc.: Upper Saddle River, NJ, USA, 2002. [Google Scholar]
  2. Stoltz, G.; Gourc, J.-P.; Oxarango, L. Characterization of the physico-mechanical properties of MSW. Waste Manag. 2010, 30, 1439–1449. [Google Scholar] [CrossRef] [PubMed]
  3. Yesiller, N.; Hanson, J.L.; Cox, J.T.; Noce, D.E. Determination of specific gravity of municipal solid waste. Waste Manag. 2014, 345, 848–858. [Google Scholar] [CrossRef] [PubMed] [Green Version]
  4. Bareither, C.A.; Benson, C.H.; Edil, T.B. Compression Behavior of municipal solid waste: Immediate compression. J. Geotech. Geoenviron. Eng. 2012, 138, 1047–1062. [Google Scholar] [CrossRef]
  5. Volume and Density Determinations for Particle Technologists. Available online: https://www.micromeritics.com/Repository/Files/Volume_and_Density_determinations_for_Particle_Technologists_0.pdf (accessed on 24 April 2022).
  6. Standard Test Methods for Specific Gravity of Soil Solids by Water Pycnometer (D854-14); ASTM International: West Conshohocken, PA, USA, 2016.
  7. Agnew, J.M.; Leonard, J.J.; Feddes, J.; Feng, Y. A modified air pycnometer for compost volume and density determination. Can. Biosyst. Eng. 2003, 45, 27–34. [Google Scholar]
  8. Reddy, K.R.; Hettiarachchi, H.; Gangathulasi, J.; Bogner, J.E. Geotechnical properties of municipal solid waste at different phases of biodegradation. Waste Manag. 2011, 31, 2275–2286. [Google Scholar] [CrossRef] [PubMed]
  9. Entenmann, W.; Wendt, P. Placement and compaction of treated municipal solid waste in modern landfills, results of geotechnical and hydraulic tests and monitoring. In Proceedings of the 11th International Waste Management and Landfill Symposium, Cagliary, Italy, 1–5 October 2007. [Google Scholar]
  10. Pulat, H.F.; Yukselen-Aksoy, Y. Factors affecting the shear strength behaviour of municipal solid wastes. Waste Manag. 2017, 69, 215–224. [Google Scholar] [CrossRef] [PubMed]
  11. The Environmental Protection and Energy Efficiency Fund. Available online: https://www.fzoeu.hr/en/wmc-mariscina/7765 (accessed on 24 April 2022).
  12. Kaniski, N.; Gavez, B.; Hrncic, N.; Petrovic, I. Shear strength of biodried municipal solid waste. In Proceedings of the 18th International Symposium on Waste Management and Sustainable Landfilling, Cagliary, Italy, 11–15 October 2021. [Google Scholar]
  13. Ruggieri, L.; Gea, T.; Artola, A.; Sanchez, A. Air filled porosity measurements by air pycnometry in the composting process: A review and a correlation analysis. Bioresour. Technol. 2009, 100, 2655–2666. [Google Scholar] [CrossRef] [PubMed]
  14. GDS Instruments. Available online: https://www.gdsinstruments.com/gds-products/toxic-interface-unit (accessed on 24 April 2022).
  15. Petrovic, I.; Kaniski, N.; Hrncic, N.; Hip, I. Correlations between field capacity, porosity, solid particle density and dry density of a mechanically and biologically (biodried) treated reject waste stream. Bioresour. Technol. Rep. 2022, 17, 100996. [Google Scholar] [CrossRef]
  16. Heiss-Ziegler, C.; Fehrer, K. Geotechnical behaviour of mechanically-biologically pretreated municipal solid waste (MSW). In Proceedings of the 9th International Waste Management and Landfill Symposium (CD-ROM), Cagliari, Italy, 6–10 October 2003. [Google Scholar]
  17. Hudson, A.P.; White, J.K.; Beaven, R.P.; Powrie, W. Modelling the compression behaviour of landfilled domestic waste. Waste Manag. 2004, 24, 259–269. [Google Scholar] [CrossRef] [PubMed]
  18. Rose, J.L.; Izzo, R.L.S.; Mahler, C.F. Effect of MSW compost-soil mixtures in compaction and permeability tests. In Proceedings of the 12th International Waste Management and Landfill Symposium, Cagliary, Italy, 5–9 October 2009. [Google Scholar]
  19. Fernando, V.I.; Sudarshana, C.K. Strength Characteristics of Mechanically Biologically Treated (MBT) Waste. Ph.D. Thesis, University of Southampton, Southampton, UK, November 2011. [Google Scholar]
  20. Velkushanova, K. Characterization of Wastes towards Sustainable LandfiLling by Some Physical and Mechanical Properties with an Emphasis on Solid Particles Compressibility. Ph.D. Thesis, University of Southampton, Southampton, UK, November 2011. [Google Scholar]
  21. Petrovic, I.; Stuhec, D.; Kovacic, D. Large oedometer for measuring stiffness of MBT waste. Geotech. Test. J. 2014, 37, 296–310. [Google Scholar] [CrossRef]
  22. Sivakumar Babu, G.L.; Lakshmikanthan, P.; Santhosh, L.G. Shear strength characteristics of mechanically biologically treated municipal solid waste (MBT-MSW) from Bangalore. Waste Manag. 2015, 39, 63–70. [Google Scholar] [CrossRef] [PubMed]
  23. Zhang, Z.; Fang, Y.; Wang, Y.; Xu, H. Compression behaviors of mechanically biologically treated wastes of Tianziling landfill in Hangzhou, China. Environ. Sci. Pollut. Res. 2020, 27, 43970–43986. [Google Scholar] [CrossRef] [PubMed]
  24. The Engineering Toolbox. Available online: https://www.engineeringtoolbox.com/density-solids-d_1265.html (accessed on 24 April 2022).
  25. Beaven, P.R. The Hydrogeological and Geotechnical Properties of Household Waste in Relation to Sustainable Landfilling. Ph.D. Thesis, University of London, London, UK, May 1999. [Google Scholar]
  26. Powrie, W.; Beaven, R.P. Hydraulic properties of household waste and implications for landfills. Proc. Inst. Civ. Eng. Geotech. Eng. 1999, 137, 235–247. [Google Scholar] [CrossRef]
Figure 1. Used air pycnometer setup.
Applsci 12 06136 g001
Figure 2. Used oedometer device.
Applsci 12 06136 g002
Figure 3. (a) Hyperbolic ρ d   vs .   e relationship under constant solid particle densities. (b) Linear ρ s   vs .   e relationship under constant dry densities.
Applsci 12 06136 g003
Figure 4. Displacements and methane yield measured in the oedometer test.
Applsci 12 06136 g004
Figure 5. Coupled air pycnometer and oedometer test results.
Applsci 12 06136 g005
Figure 6. ρ d   vs .   e relationship as predicted with Equation (8).
Applsci 12 06136 g006
Table 1. Solid particle densities of the MBT waste collected from the published literature.
Ref. ρ s
[kg/m3]
Measurement MethodAdditional Information
[9]1580–1980Capillary pycnometerVarious waste mixtures
[16]2210-Particle size ≤ 25 mm; waste was treated together with sewage sludge in a two-step process over a period of >20 weeks.
[17]880–1300-The waste was processed using the DANO technique prior to testing. The evolution of the solid particle density with the vertical load. The vertical stress range went from 34 to 463 kPa.
[18]1900Water pycnometryMSW compost, test method NBR 7181/1984 (ABNT (a), 1984).
[19]1690Gas jar method0–10 mm fraction size, average value.
1930Gas jar method0–20 mm fraction size, average value.
[20]1630Gas jar methodBS1377-2
[21]2150Water pycnometryD 854-02, maximum particle size was 4.75 mm.
[22]1260Density bottle method and pycnometer methodMechanically and biologically treated compost reject collected from the Mavallipura landfill site.
[23]1580 ± 60Water pycnometryMBT waste, Tianziling landfill, Hangzhou, China—winter specimen.
1380 ± 80MBT waste, Tianziling landfill, Hangzhou, China—summer specimen.
Publisher’s Note: MDPI stays neutral with regard to jurisdictional claims in published maps and institutional affiliations.

