
How Do Cardiovascular Biomarkers Behave in Patients with Severe Aortic Valve Stenosis with and without Echocardiographically Proven Pulmonary Hypertension?—A Retrospective Study of Biomarker Trends before and after Transcatheter Aortic Valve Replacement

 ,
,  ,
, 
Abstract
1. Introduction
2. Material & Methods
2.1. Study Population
2.2. Transthoracic Echocardiography
2.3. TAVR Procedure
2.4. Biomarker Analysis
2.5. Statistical Analysis
3. Results
3.1. Study Cohort
3.2. Baseline Characteristics of the Study
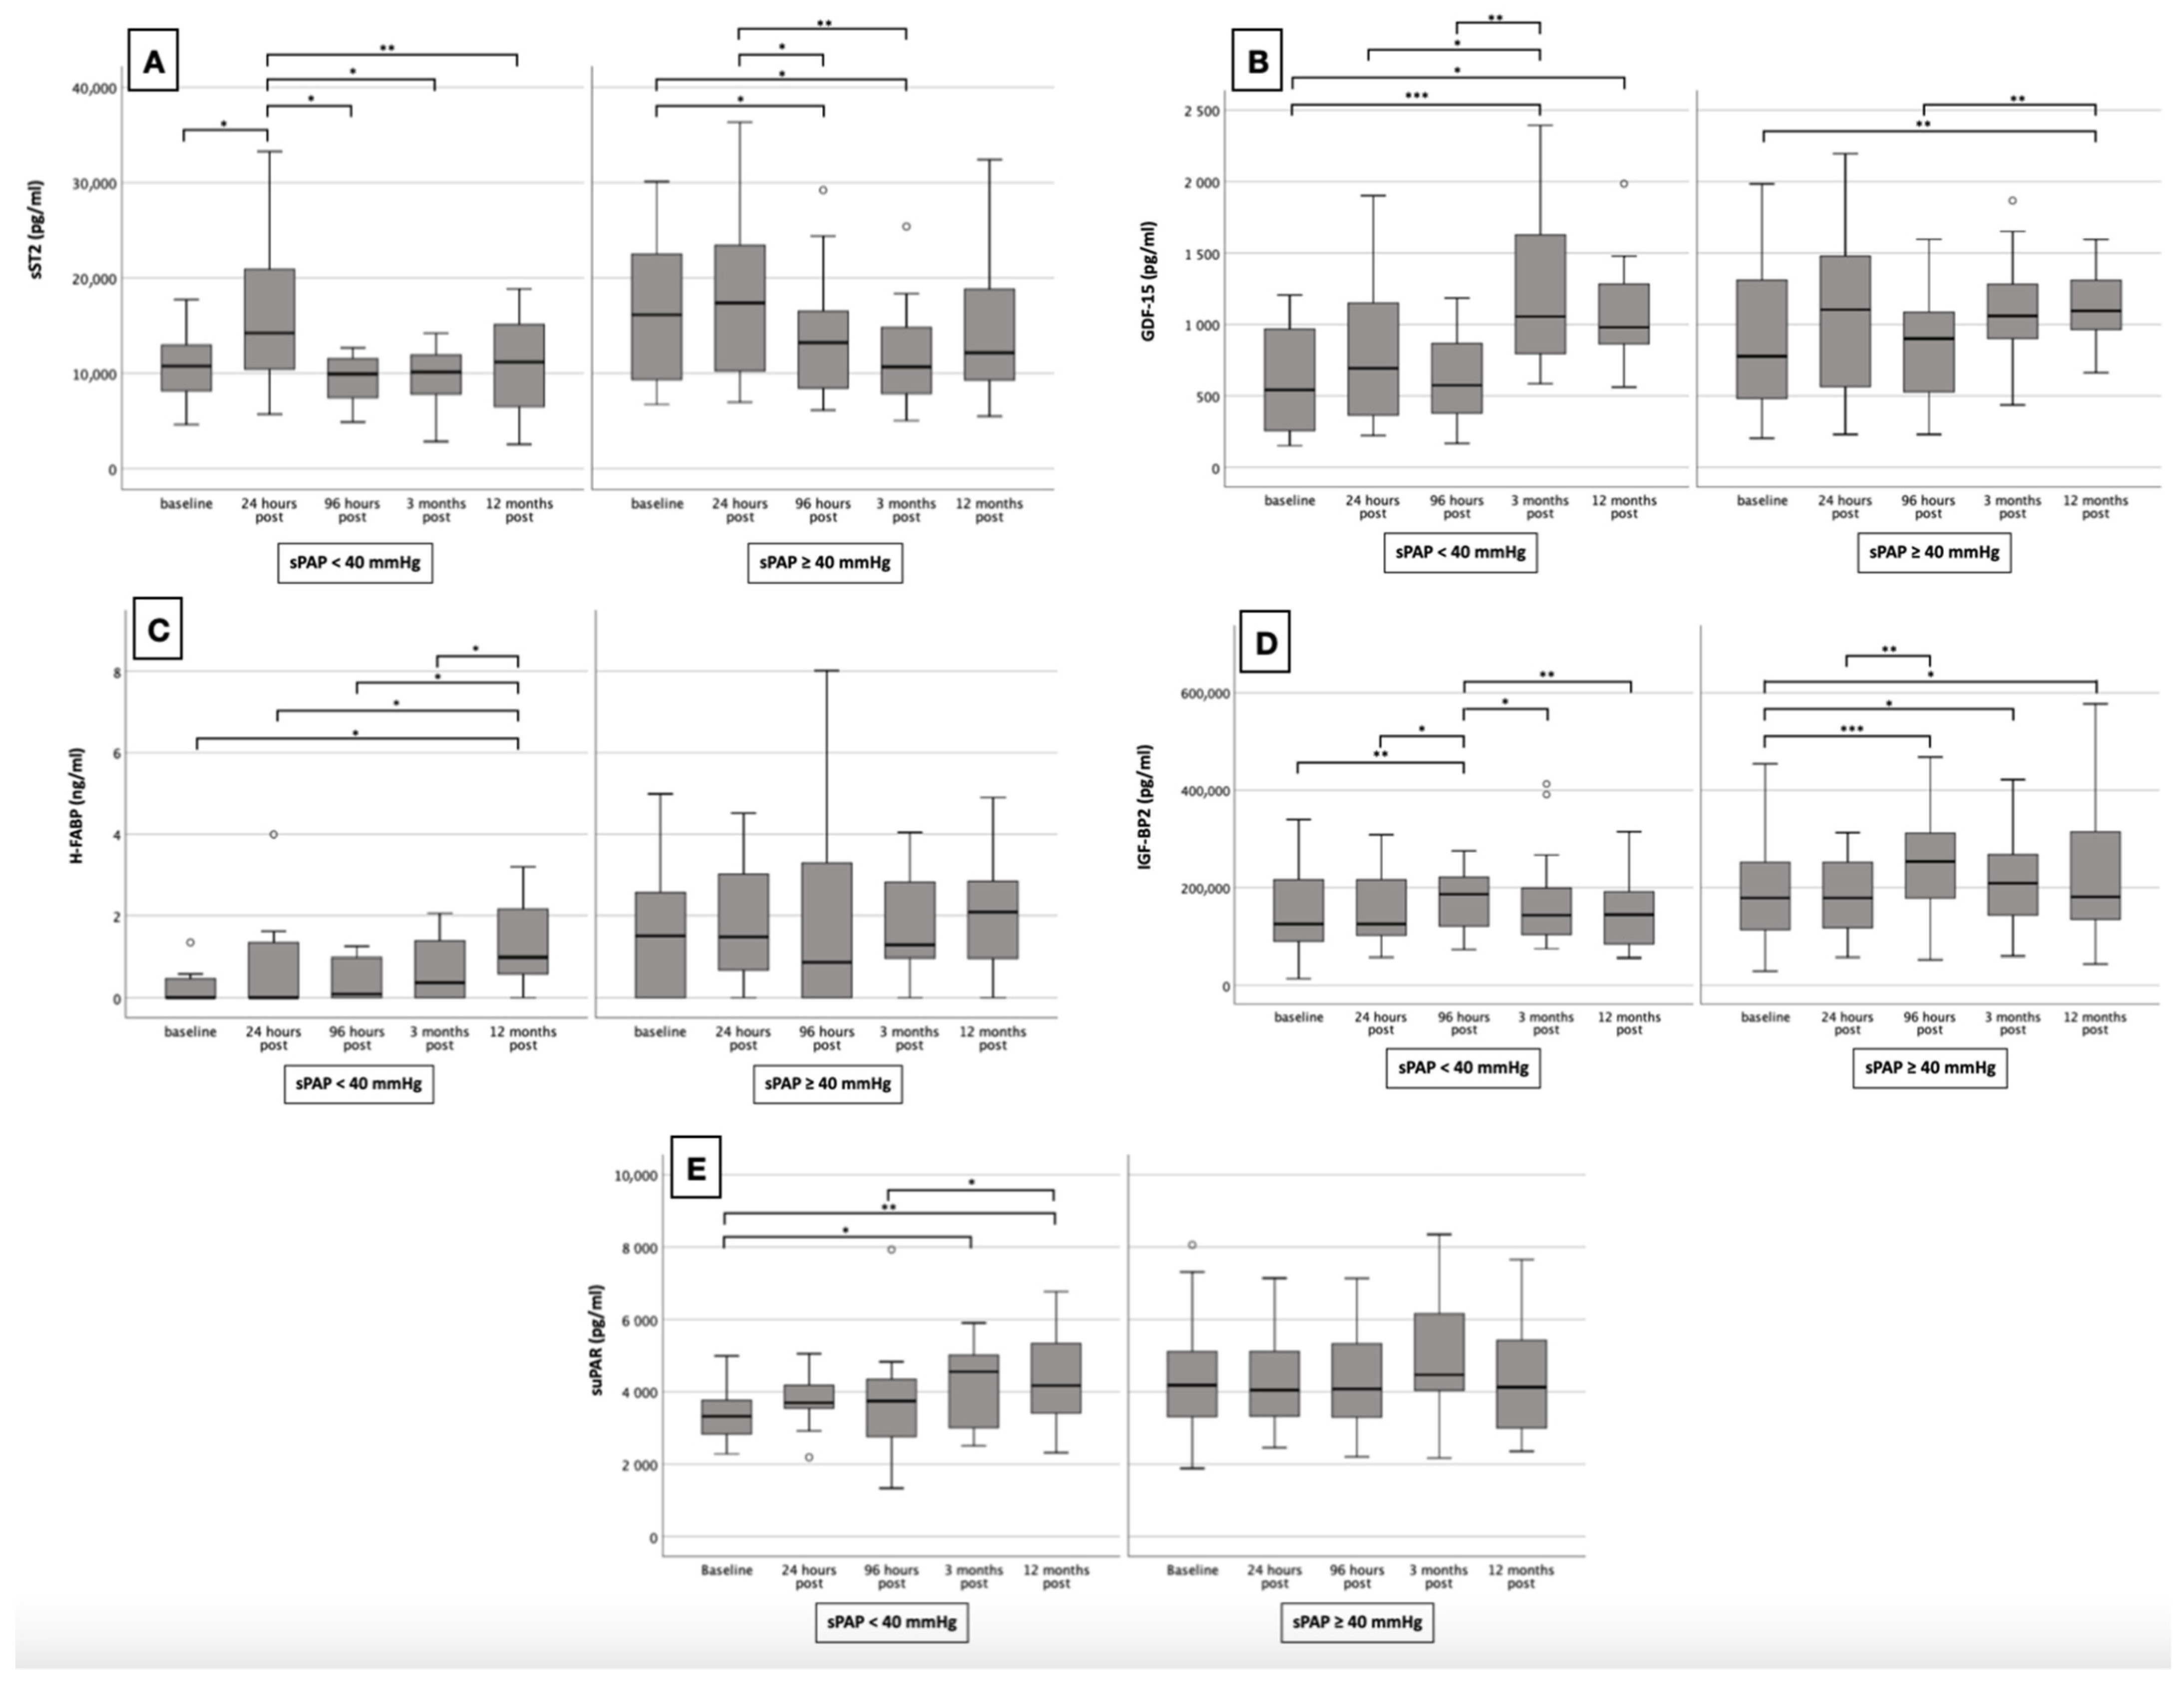
3.3. Biomarker Concentrations
3.3.1. sST2
3.3.2. GDF-15
3.3.3. H-FABP
3.3.4. IGF-BP2
3.3.5. suPAR
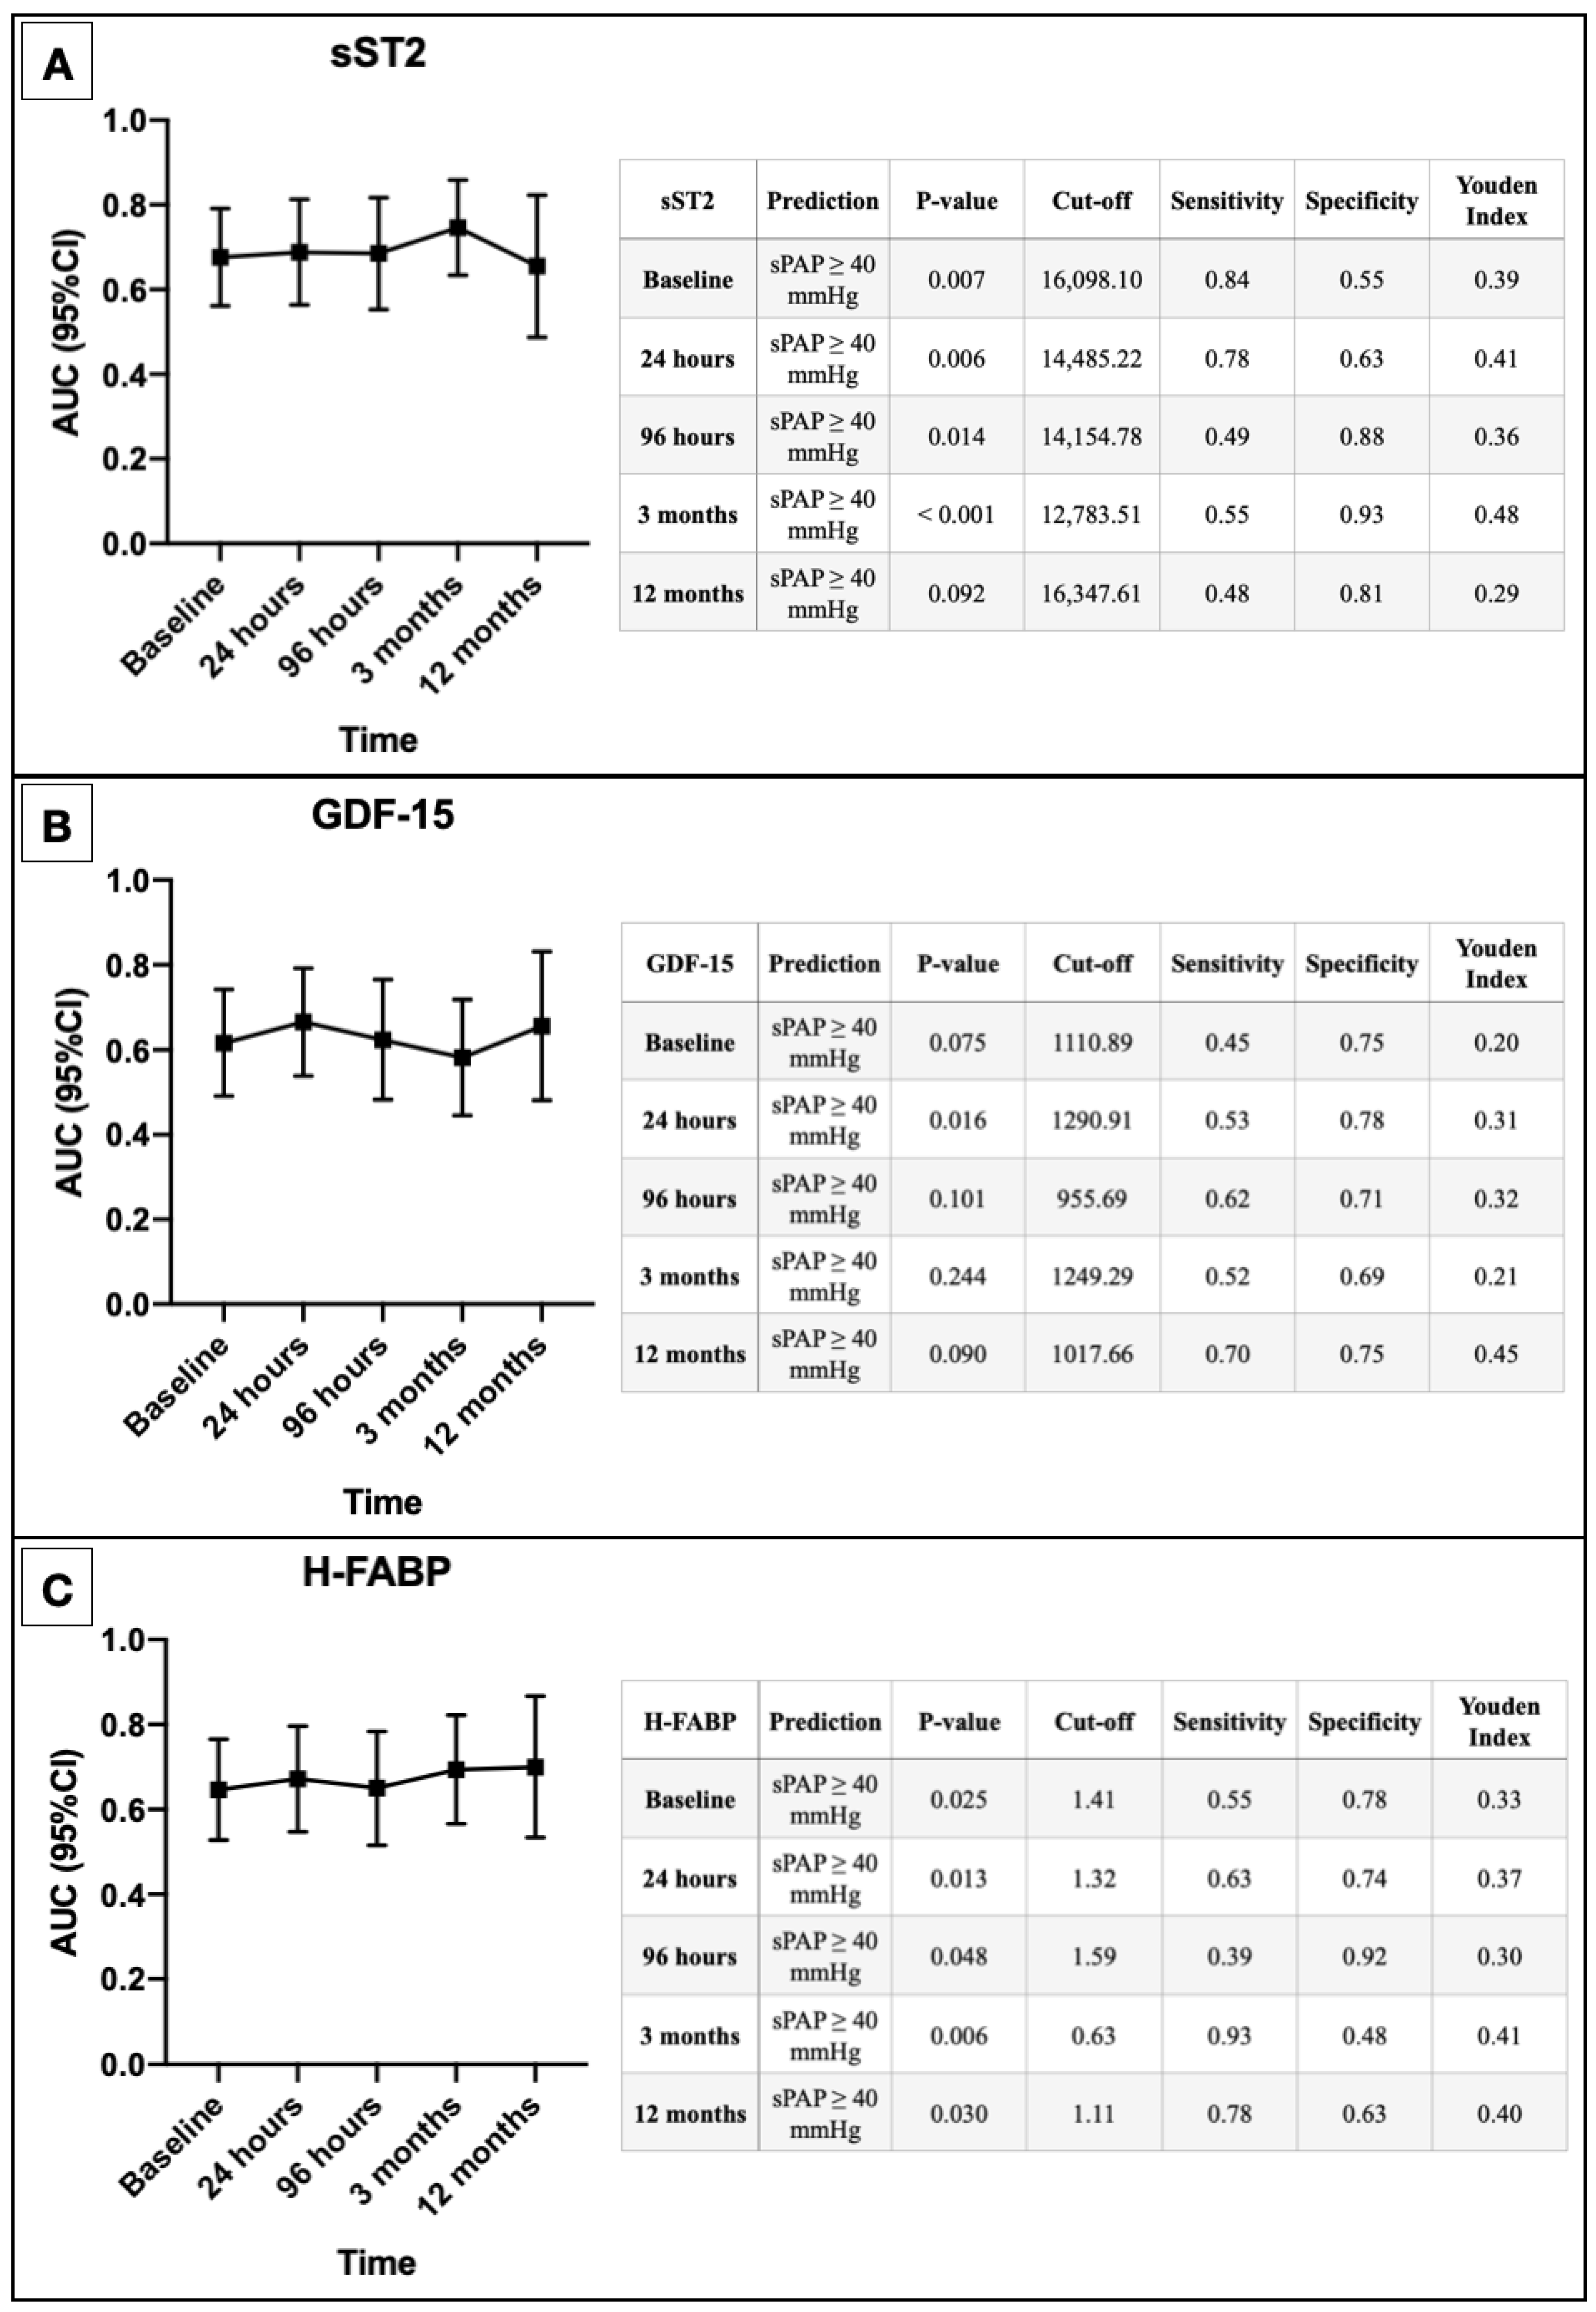
3.4. AUROC Results
3.5. Binary Logistic Regression
4. Discussion
4.1. sST2
4.2. GDF-15
4.3. H-FABP
4.4. IGF-BP2
4.5. suPAR
5. Conclusions
6. Limitation
7. Outlook
Author Contributions
Funding
Institutional Review Board Statement
Informed Consent Statement
Data Availability Statement
Acknowledgments
Conflicts of Interest
References
- Slagman, A.; von Recum, J.; Möckel, M.; Holert, F.; Meyer Zum Büschenfelde, D.; Müller, C.; Searle, J. Diagnostic performance of a high-sensitive troponin T assay and a troponin T point of care assay in the clinical routine of an Emergency Department: A clinical cohort study. Int. J. Cardiol. 2017, 230, 454–460. [Google Scholar] [CrossRef]
- Galli, C.; Lippi, G. High-sensitivity cardiac troponin testing in routine practice: Economic and organizational advantages. Ann. Transl. Med. 2016, 4, 257. [Google Scholar] [CrossRef] [PubMed]
- Weber, M.; Hamm, C. Role of B-type natriuretic peptide (BNP) and NT-proBNP in clinical routine. Heart 2006, 92, 843–849. [Google Scholar] [CrossRef] [PubMed]
- Toutouzas, K.; Stathogiannis, K.; Latsios, G.; Synetos, A.; Drakopoulou, M.; Penesopoulou, V.; Michelongona, A.; Tsiamis, E.; Tousoulis, D. Biomarkers in Aortic Valve Stenosis and their Clinical Significance in Transcatheter Aortic Valve Implantation. Curr. Med. Chem. 2019, 26, 864–872. [Google Scholar] [CrossRef] [PubMed]
- Martinez-Selles, M.; Bayes-Genis, A. Asymptomatic severe aortic stenosis: Biomarkers are welcome. Heart 2019, 105, 355–356. [Google Scholar] [CrossRef]
- Osnabrugge, R.L.; Mylotte, D.; Head, S.J.; Van Mieghem, N.M.; Nkomo, V.T.; LeReun, C.M.; Bogers, A.J.; Piazza, N.; Kappetein, A.P. Aortic Stenosis in the Elderly: Disease Prevalence and Number of Candidates for Transcatheter Aortic Valve Replacement: A Meta-Analy- sis and Modeling Study. J. Am. Coll. Cardiol. 2013, 62, 1002–1012. [Google Scholar] [CrossRef]
- Vahanian, A.; Beyersdorf, F.; Praz, F.; Milojevic, M.; Baldus, S.; Bauersachs, J.; Capodanno, D.; Conradi, L.; De Bonis, M.; De Paulis, R.; et al. 2021 ESC/EACTS Guidelines for the management of valvular heart disease. Eur. Heart J. 2022, 43, 561–632. [Google Scholar] [CrossRef]
- Melby, S.J.; Moon, M.R.; Lindman, B.R.; Bailey, M.S.; Hill, L.L.; Damiano, R.J. Impact of pulmonary hypertension on outcomes after aortic valve replacement for aortic valve stenosis. J. Tho- Racic Cardiovasc. Surg. 2011, 141, 1424–1430. [Google Scholar] [CrossRef]
- Gilard, M.; Eltchaninoff, H.; Iung, B.; Donzeau-Gouge, P.; Chevreul, K.; Fajadet, J.; Leprince, P.; Leguerri- er, A.; Lievre, M.; Prat, A.; et al. Registry of Transcatheter Aortic-Valve Implantation in High- Risk Patients. Surv. Anesthesiol. 2013, 57, 62–63. [Google Scholar] [CrossRef]
- O’Sullivan, C.J.; Wenaweser, P.; Ceylan, O.; Rat-Wirtzler, J.; Stortecky, S.; Heg, D.; Spitzer, E.; Zanchin, T.; Praz, F.; Tuller, D.; et al. Effect of pulmonary hypertension hemodynamic presentation on clinical outcomes in patients with severe symptomatic aortic valve stenosis undergoing transcatheter aortic valve implantation insights from the new proposed pulmonary hypertension classification. Circ. Cardiovas Cular Interv. 2015, 8, e002358. [Google Scholar] [CrossRef] [PubMed]
- Saraiva, R.M.; Matsumura, Y.; Yamano, T.; Greenberg, N.; Thomas, J.D.; Shiota, T. Relation of left atrial dysfunction to pulmonary artery hypertension in patients with aortic stenosis and left ventricular systolic dysfunction. Am. J. Cardiol. 2010, 106, 409–416. [Google Scholar] [CrossRef] [PubMed]
- Ahn, H.S.; Chang, S.A.; Kim, H.K.; Kim, S.J.; Lee, S.P.; Park, S.J.; Kim, Y.J.; Cho, G.Y.; Sohn, D.W.; Oh, J.K. Determinants of pulmonary hypertension development in moderate or severe aortic stenosis. Int. J. Cardiovasc. Imaging 2014, 30, 1519–1528. [Google Scholar] [CrossRef]
- D’Ascenzo, F.; Conrotto, F.; Salizzoni, S.; Rossi, M.L.; Nijhoff, F.; Gasparetto, V.; Barbanti, M.; Mennuni, M.; Omedè, P.; Grosso Marra, W.; et al. Incidence, predictors, and impact on prognosis of systolic pulmonary artery pressure and its improvement after transcatheter aortic valve implantation: A multicenter registry. J. Invasive Cardiol. 2015, 27, 114–119. [Google Scholar]
- Schewel, J.; Schlüter, M.; Schmidt, T.; Kuck, K.H.; Frerker, C.; Schewel, D. Correlation between Doppler echocardiography and right heart catheterization assessment of systolic pulmonary artery pressure in patients with severe aortic stenosis. Echocardiography 2020, 37, 380–387. [Google Scholar] [CrossRef] [PubMed]
- Ruparelia, N.; Prendergast, B.D. TAVI in 2015: Who, where and how? Heart 2015, 101, 1422–1431. [Google Scholar] [CrossRef] [PubMed]
- Zhang, T.; Xu, C.; Zhao, R.; Cao, Z. Diagnostic Value of sST2 in Cardiovascular Diseases: A Systematic Review and Meta-Analysis. Front. Cardiovasc. Med. 2021, 8, 697837. [Google Scholar] [CrossRef]
- Ciccone, M.M.; Cortese, F.; Gesualdo, M.; Riccardi, R.; Di Nunzio, D.; Moncelli, M.; Iacoviello, M.; Scicchitano, P. A novel cardiac bio-marker: ST2: A review. Molecules 2013, 18, 15314–15328. [Google Scholar] [CrossRef] [PubMed]
- Cai, A.; Miyazawa, A.; Sunderland, N.; Piper, S.E.; Gibbs, T.G.J.; Wang, D.; Redding, S.; Amin-Youseff, G.; Wendler, O.; Byrne, J.; et al. ST2 in patients with severe aortic stenosis and heart failure. Cardiol. J. 2021, 28, 129–135. [Google Scholar] [CrossRef]
- Mirna, M.; Wernly, B.; Paar, V.; Jung, C.; Jirak, P.; Figulla, H.R.; Kretzschmar, D.; Franz, M.; Hoppe, U.C.; Lichtenauer, M.; et al. Multi-biomarker analysis in patients after transcatheter aortic valve implantation (TAVI). Biomarkers 2018, 23, 773–780. [Google Scholar] [CrossRef]
- Boxhammer, E.; Mirna, M.; Bäz, L.; Bacher, N.; Topf, A.; Sipos, B.; Franz, M.; Kretzschmar, D.; Hoppe, U.C.; Lauten, A.; et al. Soluble ST2 as a Potential Biomarker for Risk Assessment of Pulmonary Hypertension in Patients Undergoing TAVR? Life 2022, 12, 389. [Google Scholar] [CrossRef]
- Wesseling, M.; de Poel, J.H.C.; de Jager, S.C.A. Growth differentiation factor 15 in adverse cardiac remodelling: From biomarker to causal player. ESC Heart Fail. 2020, 7, 1488–1501. [Google Scholar] [CrossRef]
- George, M.; Jena, A.; Srivatsan, V.; Muthukumar, R.; Dhandapani, V.E. GDF 15-A Novel Biomarker in the Offing for Heart Failure. Curr. Cardiol. Rev. 2016, 12, 37–46. [Google Scholar] [CrossRef] [PubMed]
- Wischhusen, J.; Melero, I.; Fridman, W.H. Growth/Differentiation Factor-15 (GDF-15): From Biomarker to Novel Targetable Immune Checkpoint. Front. Immunol. 2020, 11, 951. [Google Scholar] [CrossRef] [PubMed]
- Assadi, A.; Zahabi, A.; Hart, R.A. GDF15, an update of the physiological and pathological roles it plays: A review. Pflug. Arch. Eur. J. Physiol. 2020, 472, 1535–1546. [Google Scholar] [CrossRef]
- Gumauskienė, B.; Krivickienė, A.; Jonkaitienė, R.; Vaškelytė, J.J.; Siudikas, A.; Ereminienė, E. Impact of Left Ventricular Diastolic Dysfunction and Biomarkers on Pulmonary Hypertension in Patients with Severe Aortic Stenosis. Medicina 2018, 54, 63. [Google Scholar] [CrossRef]
- Fabiani, I.; Santoni, T.; Angelillis, M.; Petricciuolo, S.; Colli, A.; Pellegrini, G.; Mazzei, D.; Pugliese, N.R.; Petronio, A.S.; De Caterina, R. Growth differentiation factor 15 in severe aortic valve stenosis: Relationship with left ventricular remodeling and frailty. J. Clin. Med. 2020, 9, 2998. [Google Scholar] [CrossRef]
- Chen, K.; Chen, Q.J.; Wang, L.J.; Liu, Z.H.; Zhang, Q.; Yang, K.; Wang, H.B.; Yan, X.X.; Zhu ZBin Du, R.; Zhang, R.Y.; et al. Increment of HFABP Level in Coronary Artery In-Stent Restenosis Segments in Diabetic and Nondiabetic Minipigs: HFABP Overexpression Promotes Multiple Pathway-Related Inflammation, Growth and Migration in Human Vascular Smooth Muscle Cells. J. Vasc. Res. 2016, 53, 27–38. [Google Scholar] [CrossRef] [PubMed]
- Pyati, A.K.; Devaranavadagi, B.B.; Sajjannar, S.L.; Nikam, S.V.; Shannawaz, M.; Sudharan. Heart-type fatty acid binding protein: A better cardiac biomarker than CK-MB and myoglobin in the early diagnosis of acute myocardial infarction. J. Clin. Diagn. Res. 2015, 9, BC08–BC11. [Google Scholar] [CrossRef]
- Renaud, B.; Ngako, A. Heart-type fatty acid-binding proteins (H-FABP): A reliable tool for initial risk stratification of pulmonary embolism? Eur. Heart J. 2007, 28, 146–147. [Google Scholar] [CrossRef][Green Version]
- Dellas, C.; Lobo, J.L.; Rivas, A.; Ballaz, A.; Portillo, A.K.; Nieto, R.; Del Rey, J.M.; Zamorano, J.L.; Lankeit, M.; Jiménez, D. Risk stratification of acute pulmonary embolism based on clinical parameters, H-FABP and multidetector CT. Int. J. Cardiol. 2018, 265, 223–228. [Google Scholar] [CrossRef]
- Mirna, M.; Rohm, I.; Jirak, P.; Wernly, B.; Bäz, L.; Paar, V.; Kretzschmar, D.; Hoppe, U.C.; Schulze, P.C.; Lichtenauer, M.; et al. Analysis of Novel Cardiovascular Biomarkers in Patients With Pulmonary Hypertension (PH). Heart Lung Circ. 2020, 29, 337–344. [Google Scholar] [CrossRef] [PubMed]
- Troncoso, R.; Ibarra, C.; Vicencio, J.M.; Jaimovich, E.; Lavandero, S. New insights into IGF-1 signaling in the heart. Trends Endocrinol. Metab. TEM 2014, 25, 128–137. [Google Scholar] [CrossRef] [PubMed]
- Lee, W.S.; Kim, J. Insulin-like growth factor-1 signaling in cardiac aging. Biochimica et biophysica acta. Mol. Basis Dis. 2018, 1864 5 Pt B, 1931–1938. [Google Scholar] [CrossRef] [PubMed]
- Gustafsson, T.; Andersson, P.; Chen, Y.; Magnusson, J.O.; Arnqvist, H.J. Interaction of angiotensin II and the insulin-like growth factor system in vascular smooth muscle cells. Am. J. Physiol. Heart Circ. Physiol. 1999, 277, 499–507. [Google Scholar] [CrossRef]
- Haywood, N.J.; Slater, T.A.; Matthews, C.J.; Wheatcroft, S.B. The insulin like growth factor and binding protein family: Novel therapeutic targets in obesity & diabetes. Mol. Metab. 2019, 19, 86–96. [Google Scholar] [CrossRef] [PubMed]
- Yang, J.; Griffiths, M.; Nies, M.K.; Brandal, S.; Damico, R.; Vaidya, D.; Tao, X.; Simpson, C.E.; Kolb, T.M.; Mathai, S.C.; et al. Insulin-like growth factor binding protein-2: A new circulating indicator of pulmonary arterial hypertension severity and survival. BMC Med. 2020, 18, 268. [Google Scholar] [CrossRef]
- Velissaris, D.; Zareifopoulos, N.; Koniari, I.; Karamouzos, V.; Bousis, D.; Gerakaris, A.; Platanaki, C.; Kounis, N. Soluble Urokinase Plasminogen Activator Receptor as a Diagnostic and Prognostic Biomarker in Cardiac Disease. J. Clin. Med. Res. 2021, 13, 133–142. [Google Scholar] [CrossRef]
- Thunø, M.; MacHo, B.; Eugen-Olsen, J. suPAR: The molecular crystal ball. Dis. Markers 2009, 27, 157–172. [Google Scholar] [CrossRef]


| Overall Cohort n = 85 | sPAP < 40 mmHg n = 32 | sPAP ≥ 40 mmHg n = 53 | |||||
|---|---|---|---|---|---|---|---|
| Clinical Data | p-value | ||||||
| Age (years)—mean ± SD | 82.34 | 5.41 | 81.50 | 5.48 | 83.25 | 5.09 | 0.140 |
| Gender (male)—% (n) | 50.60 | (43) | 50.00 | (16) | 50.90 | (27) | 0.933 |
| Weight (kg)—mean ± SD | 72.39 | 12.50 | 73.09 | 14.77 | 70.59 | 8.44 | 0.556 |
| Height (cm)—mean ± SD | 165.75 | 8.07 | 165.14 | 9.19 | 166.75 | 6.02 | 0.518 |
| BMI (kg/m2)—mean ± SD | 26.30 | 4.09 | 27.08 | 4.49 | 25.14 | 3.03 | 0.122 |
| NYHA—median ± IQR | 3.00 | 0.75 | 3.00 | 1.00 | 3.00 | 1.00 | 0.624 |
| STSScore—mean ± SD | 3.08 | 1.62 | 2.56 | 1.29 | 3.29 | 1.51 | 0.025 |
| Concomitant Disease | p-value | ||||||
| Diabetes mellitus—% (n) | 24.70 | (21) | 21.90 | (7) | 26.40 | (14) | 0.638 |
| Arterial Hypertension—% (n) | 77.60 | (66) | 78.10 | (25) | 83.00 | (44) | 0.576 |
| CVD—% (n) | 61.20 | (52) | 59.40 | (19) | 62.30 | (33) | 0.791 |
| CVD—1 vessel—% (n) | 14.10 | (12) | 15.60 | (5) | 13.20 | (7) | 0.756 |
| CVD—2 vessels—% (n) | 12.90 | (11) | 9.40 | (3) | 15.1 | (8) | 0.447 |
| CVD—3 vessels—% (n) | 23.50 | (20) | 21.90 | (7) | 24.50 | (13) | 0.780 |
| Myocardial infarction—% (n) | 4.70 | (4) | 3.10 | (1) | 5.70 | (3) | 0.593 |
| Atrial fibrillation—% (n) | 32.90 | (28) | 12.50 | (4) | 45.30 | (24) | 0.002 |
| Malignancy—% (n) | 22.40 | (19) | 21.90 | (7) | 22.60 | (12) | 0.943 |
| Stroke—% (n) | 9.40 | (8) | 9.40 | (3) | 9.40 | (5) | 0.993 |
| PAD—% (n) | 9.40 | (8) | 3.10 | (1) | 13.20 | (7) | 0.123 |
| COPD—% (n) | 8.20 | (7) | 9.40 | (3) | 7.50 | (4) | 0.766 |
| Pacemaker—% (n) | 3.50 | (3) | 0.00 | (0) | 5.70 | (3) | 0.171 |
| Echocardiography | p-value | ||||||
| LVEF (%)—mean ± SD | 53.42 | 9.99 | 55.25 | 6.17 | 52.00 | 11.50 | 0.099 |
| LVEDD (mm)—mean ± SD | 4.69 | 0.61 | 4.63 | 0.71 | 4.66 | 0.53 | 0.838 |
| IVSd (mm)—mean ± SD | 13.36 | 2.50 | 13.23 | 2.28 | 13.54 | 2.04 | 0.523 |
| AV Vmax (m/s)—mean ± SD | 4.43 | 0.55 | 4.34 | 0.61 | 4.43 | 0.52 | 0.535 |
| AV dPmean (mmHg)—mean ± SD | 49.55 | 11.52 | 46.55 | 11.39 | 50.61 | 11.83 | 0.147 |
| AV dPmax (mmHg)—mean ± SD | 81.61 | 20.15 | 77.59 | 19.49 | 82.67 | 21.00 | 0.299 |
| sPAP (mmHg)—mean ± SD | 46.36 | 17.49 | 31.75 | 6.86 | 54.42 | 15.10 | <0.001 |
| TAPSE (mm)—mean ± SD | 22.25 | 3.78 | 23.12 | 3.21 | 20.95 | 4.06 | 0.017 |
| AVI ≥ II—% (n) | 16.50 | (14) | 21.90 | (7) | 13.20 | (7) | 0.561 |
| MVI ≥ II—% (n) | 41.20 | (35) | 34.40 | (11) | 45.30 | (24) | 0.304 |
| TVI ≥ II—% (n) | 29.40 | (25) | 12.50 | (4) | 39.60 | (21) | 0.007 |
| Laboratory data | p-value | ||||||
| Creatinine (mg/dL)—median ± IQR | 1.00 | 0.37 | 0.95 | 0.30 | 1.10 | 0.50 | 0.002 |
| BNP (pg/mL)—median ± IQR | 1599.50 | 3117.45 | 1122.50 | 1017.53 | 3162.00 | 4440.00 | 0.001 |
| cTnI (pg/mL)—median ± IQR | 21.00 | 21.00 | 16.00 | 15.50 | 31.00 | 41.00 | 0.002 |
| Hkt (%)—median ± IQR | 39.60 | 7.18 | 41.20 | 5.75 | 37.40 | 8.50 | 0.037 |
| Hb (g/dL)—median ± IQR | 12.95 | 2.53 | 13.05 | 1.78 | 12.30 | 3.40 | 0.052 |
| CK (U/L)—median ± IQR | 67.50 | 74.75 | 77.00 | 115.50 | 59.00 | 71.00 | 0.492 |
| sPAP < 40 mmHg n = 32 | sPAP ≥ 40 mmHg n = 53 | ||||
|---|---|---|---|---|---|
| sST2 (pg/mL) | p-value | ||||
| sST2 baseline—median ± IQR | 10,750.80 | 5894.78 | 16,134.67 | 13,351.82 | 0.007 |
| sST2 24 h—median ± IQR | 14,220.25 | 11,628.33 | 17,372.76 | 13,826.10 | 0.006 |
| sST2 96 h—median ± IQR | 9919.84 | 4239.27 | 13,217.80 | 8591.19 | 0.014 |
| sST2 3 months—median ± IQR | 10,120.52 | 4258.88 | 10,671.73 | 7354.71 | <0.001 |
| sST2 12 months—median ± IQR | 11,179.72 | 9233.51 | 12,142.09 | 10,029.74 | 0.092 |
| GDF-15 (pg/mL) | p-value | ||||
| GDF-15 baseline—median ± IQR | 541.45 | 763.12 | 777.43 | 857.02 | 0.075 |
| GDF-15 24 h—median ± IQR | 692.60 | 843.94 | 1104.17 | 943.32 | 0.016 |
| GDF-15 96 h—median ± IQR | 573.67 | 519.41 | 901.27 | 696.17 | 0.101 |
| GDF-15 3 months—median ± IQR | 1055.32 | 920.54 | 1060.02 | 420.61 | 0.244 |
| GDF-15 12 months—median ± IQR | 980.16 | 498.64 | 1095.39 | 445.38 | 0.090 |
| H-FABP (ng/mL) | p-value | ||||
| H-FABP baseline—median ± IQR | 0.00 | 0.51 | 1.50 | 2.86 | 0.022 |
| H-FABP 24 h—median ± IQR | 0.00 | 1.48 | 1.48 | 2.77 | 0.012 |
| H-FABP 96 h—median ± IQR | 0.09 | 1.05 | 0.87 | 3.40 | 0.037 |
| H-FABP 3 months—median ± IQR | 0.34 | 1.41 | 1.28 | 2.07 | 0.006 |
| H-FABP12 months—median ± IQR | 0.99 | 1.62 | 2.09 | 1.95 | 0.030 |
| IGF-BP2 (pg/mL) | p-value | ||||
| IGF-BP2 baseline—median ± IQR | 125,163.32 | 128,179.49 | 178,630.35 | 146,366.21 | 0.029 |
| IGF-BP2 24 h—median ± IQR | 125,163.32 | 115,595.66 | 178,630.35 | 143,275.97 | 0.012 |
| IGF-BP2 96 h—median ± IQR | 186,473.04 | 104,689.81 | 253,454.40 | 141,091.62 | 0.001 |
| IGF-BP2 3 months—median ± IQR | 143,038.18 | 103,202.90 | 208,982.19 | 125,501.54 | 0.015 |
| IGF-BP2 12 months—median ± IQR | 144,259.45 | 115,646.78 | 180,755.50 | 185,500.31 | 0.022 |
| suPAR (pg/mL) | p-value | ||||
| suPAR baseline—median ± IQR | 3322.47 | 1106.45 | 4180.44 | 2243.84 | 0.003 |
| suPAR 24 h—median ± IQR | 3694.77 | 940.29 | 4045.97 | 2221.08 | 0.041 |
| suPAR 96 h—median ± IQR | 3742.90 | 1813.56 | 4076.90 | 2396.88 | 0.127 |
| suPAR 3 months—median ± IQR | 4553.73 | 2176.08 | 4469.58 | 2225.77 | 0.006 |
| suPAR 12 months—median ± IQR | 4171.91 | 2364.61 | 4127.91 | 2706.40 | 0.477 |
| sPAP ≥ 40 mmHg Binary Logistic Regression | Univariate | Multivariate | ||
|---|---|---|---|---|
| Hazard Ratio (95%) | p-Value | Hazard Ratio (95%) | p-Value | |
| Age | 1.066 (0.978—1.161) | 0.145 | ||
| Gender (male) | 0.963 (0.400—2.316) | 0.933 | ||
| Weight | 0.980 (0.924—1.039) | 0.490 | ||
| Height | 1.032 (0.940—1.133) | 0.507 | ||
| BMI | 0.862 (0.709—1.048) | 0.135 | ||
| NYHA | 1.756 (0.525—5.876) | 0.361 | ||
| STSScore | 1.498 (1.038—2.163) | 0.031 | 1.357 (0.794—2.317) | 0.264 |
| Diabetes mellitus | 1.282 (0.455—3.616) | 0.639 | ||
| Arterial Hypertension | 1.369 (0.454—4.125) | 0.577 | ||
| Cardiovascular Disease (all) | 1.129 (0.460—2.771) | 0.791 | ||
| CVD—1 vessel | 0.822 (0.237—2.846) | 0.757 | ||
| CVD—2 vessels | 1.719 (0.421—7.015) | 0.451 | ||
| CVD—3 vessels | 1.161 (0.408—3.303) | 0.780 | ||
| Myocardial infarction | 1.860 (0.185—18.684) | 0.598 | ||
| Atrial fibrillation | 5.793 (1.782—18.834) | 0.003 | 9.361 (1.175—74.576) | 0.035 |
| Malignancy | 1.045 (0.363—3.007) | 0.935 | ||
| Stroke | 1.007 (0.224—4.530) | 0.993 | ||
| PAD | 4.717 (0.553—40.265) | 0.156 | ||
| COPD | 0.789 (0.165—3.777) | 0.767 | ||
| LVEF | 0.963 (0.915—1.014) | 0.152 | ||
| LVEDD | 1.085 (0.504—2.335) | 0.835 | ||
| IVSd | 1.074 (0.864—1.335) | 0.518 | ||
| AV Vmax | 1.323 (0.553—3.163) | 0.529 | ||
| AV dPmean | 1.031 (0.989—1.075) | 0.149 | ||
| AV dPmax | 1.013 (0.989—1.037) | 0.299 | ||
| TAPSE | 0.853 (0.744—0.977) | 0.022 | 0.698 (0.529—0.922) | 0.011 |
| AVI ≥ II | 0.696 (0.204—2.372) | 0.562 | ||
| MVI ≥ II | 1.616 (0.645—4.049) | 0.306 | ||
| TVI ≥ II | 4.725 (1.439—15.515) | 0.010 | 3.333 (0.616—18.020) | 0.162 |
| Creatinine (baseline) | 2.548 (1.203—5.395) | 0.015 | 0.855 (0.187—3.902) | 0.839 |
| BNP (baseline) | 8.402 (1.878—37.596) | 0.005 | 1.130 (0.146—8.738) | 0.907 |
| cTnI (baseline) | 3.907 (1.018—14.998) | 0.047 | 0.852 (0.151—4.817) | 0.856 |
| Hkt (baseline) | 1.144 (0.654—2.001) | 0.638 | ||
| Hb (baseline) | 0.602 (0.374—0.969) | 0.037 | 1.833 (0.544—6.174) | 0.328 |
| CK (baseline) | 1.036 (0.671—1.600) | 0.872 | ||
| sST2 (baseline) | 2.080 (1.223—3.537) | 0.007 | 6.021 (1.793—20.219) | 0.004 |
| GDF-15 (baseline) | 1.475 (0.901—2.414) | 0.122 | ||
| H-FABP (baseline) | 2.964 (1.208—7.270) | 0.018 | 0.503 (0.081—3.120) | 0.460 |
| IGF-BP2 (baseline) | 2.273 (0.955—5.413) | 0.064 | 1.799 (0.274—11.812) | 0.541 |
| suPAR (baseline) | 1.518 (0.904—2.548) | 0.114 | ||
Publisher’s Note: MDPI stays neutral with regard to jurisdictional claims in published maps and institutional affiliations. |
© 2022 by the authors. Licensee MDPI, Basel, Switzerland. This article is an open access article distributed under the terms and conditions of the Creative Commons Attribution (CC BY) license (https://creativecommons.org/licenses/by/4.0/).
Share and Cite
Boxhammer, E.; Schmidbauer, L.; Mirna, M.; Paar, V.; Hammerer, M.; Hoppe, U.C.; Lichtenauer, M. How Do Cardiovascular Biomarkers Behave in Patients with Severe Aortic Valve Stenosis with and without Echocardiographically Proven Pulmonary Hypertension?—A Retrospective Study of Biomarker Trends before and after Transcatheter Aortic Valve Replacement. Appl. Sci. 2022, 12, 5765. https://doi.org/10.3390/app12125765
Boxhammer E, Schmidbauer L, Mirna M, Paar V, Hammerer M, Hoppe UC, Lichtenauer M. How Do Cardiovascular Biomarkers Behave in Patients with Severe Aortic Valve Stenosis with and without Echocardiographically Proven Pulmonary Hypertension?—A Retrospective Study of Biomarker Trends before and after Transcatheter Aortic Valve Replacement. Applied Sciences. 2022; 12(12):5765. https://doi.org/10.3390/app12125765
Chicago/Turabian StyleBoxhammer, Elke, Lukas Schmidbauer, Moritz Mirna, Vera Paar, Matthias Hammerer, Uta C. Hoppe, and Michael Lichtenauer. 2022. "How Do Cardiovascular Biomarkers Behave in Patients with Severe Aortic Valve Stenosis with and without Echocardiographically Proven Pulmonary Hypertension?—A Retrospective Study of Biomarker Trends before and after Transcatheter Aortic Valve Replacement" Applied Sciences 12, no. 12: 5765. https://doi.org/10.3390/app12125765
APA StyleBoxhammer, E., Schmidbauer, L., Mirna, M., Paar, V., Hammerer, M., Hoppe, U. C., & Lichtenauer, M. (2022). How Do Cardiovascular Biomarkers Behave in Patients with Severe Aortic Valve Stenosis with and without Echocardiographically Proven Pulmonary Hypertension?—A Retrospective Study of Biomarker Trends before and after Transcatheter Aortic Valve Replacement. Applied Sciences, 12(12), 5765. https://doi.org/10.3390/app12125765