Article

Different Transport Behaviors between Asian Dust and Polycyclic Aromatic Hydrocarbons in Urban Areas: Monitoring in Fukuoka and Kanazawa, Japan

1
Data Management Department, Asia Center for Air Pollution Research, Niigata City 950-2144, Japan
2
Department of Hygiene and Public Health, Faculty of Medicine, Institute of Medical, Pharmaceutical and Health Sciences, Kanazawa University, Kanazawa City 920-8640, Japan
3
Division of Atmospheric Environmental Studies, Institute of Nature and Environmental Technology, Kanazawa University, Kanazawa City 920-1192, Japan
4
Department of Pediatrics, National Hospital Organization Fukuoka National Hospital, Fukuoka City 811-1394, Japan
5
Low-Level Radioactivity Laboratory, Institute of Nature and Environmental Technology, Kanazawa University, Nomi City 923-1224, Japan
*
Author to whom correspondence should be addressed.
Appl. Sci. 2022, 12(11), 5404; https://doi.org/10.3390/app12115404
Submission received: 6 May 2022 / Revised: 25 May 2022 / Accepted: 25 May 2022 / Published: 26 May 2022

Abstract

:
To clarify different effects of Asian dust (AD), long-range transported from Asian continent, on total suspended particles (TSP) and polycyclic aromatic hydrocarbons (PAHs) in Japan, TSP were simultaneously collected during AD periods (from 1 March to 31 May 2020 and 2021) in Fukuoka and Kanazawa. During AD days, decided by Light Detection and Ranging and Japan Meteorological Agency, TSP concentrations increased significantly (p < 0.001) at two sampling sites. PAH concentrations increased in Kanazawa (p < 0.001) but not in Fukuoka on AD days. Correlation coefficients (r) between daily TSP and total PAHs concentrations were weak in Kanazawa: 0.521 (non-AD) and 0.526 (AD) (p < 0.01), and in Fukuoka: 0.321 (non-AD) and 0.059 (AD). However, correlation between seasonal (average monthly) TSP and total PAH concentrations were stronger: 0.680 (Kanazawa) and 0.751 (Fukuoka). The reasons might be that seasonal variations of TSP and total PAHs in two cities depend equally on planetary scale westerly, while daily TSP and total PAHs variations in each city varied by different transportation distances from AD and PAHs sources in the Asian continent to Japan. Different local sources and meteorological conditions were considered. These results are important for elucidating the causes of chronic and acute respiratory diseases.

1. Introduction

Long-range transported (LRT) air pollution indicates the atmospheric movement of pollutants for more than 100 km, affecting neighboring countries’ air quality across national boundaries. It is well known that Japan has suffered from LRT air pollution such as Asian dust (AD) and acid rain from the Asian continent [1,2,3,4,5]. However, different patterns of LRT may vary air pollutant concentrations in monitoring areas.
Asian dust (AD), swirling sand from western China and Mongolia deserts to great heights by a turbulent wind, is long-range transported by westerlies towards Japan and the western United States [6,7,8]. During its transport, the air mass adopts large amounts of anthropogenic air pollutants, such as sulfur oxides (SOx), nitrogen oxides (NOx), polycyclic aromatic hydrocarbons (PAHs), and nitro-polycyclic aromatic hydrocarbons (NPAHs), emitted from industrial and metropolitan regions in China. Among these pollutants, SOx and NOx cause acid precipitate (rain and snow) on the west coasts of Japan and AD suppresses its acidification. Several NPAHs are secondarily formed from PAHs in the presence of OH and NOx radicals and a high concentration of AD [9]. It has been considered that these organic and inorganic pollutants were simultaneously long-range transported to Japan by westerly winds. They are thought to be common causes of hospital admission for respiratory, cerebrovascular, and cardiovascular diseases [10], cough prevalence [11,12,13], itchy eyes [14], asthma exacerbation [15], and seasonal allergic rhinitis [7,16].
On the other hand, long-range transportation of PAHs from China was sensitively detected at several remote sites or cities on the west coasts of Japanese islands: Noto peninsula [4,17,18,19], Fukue [4,19,20], Okinawa [20], and Kanazawa [2,21]. However, PAH concentrations did not always show the same variation as AD in the downstream areas [4,13,19,22]. Our speculation is that particulate matters (PM) and PAHs in Japan are from different sources. Therefore, to clarify the different transportation mechanisms between AD and PAHs, the present study monitored PM and PAHs simultaneously in AD seasons in two Japanese cities, Fukuoka and Kanazawa, at a distance of 660 km. The results would benefit for investigating the cause of pollutant-related diseases (respiratory diseases, etc.) at different locations under weather phenomena similar to AD.

2. Materials and Methods

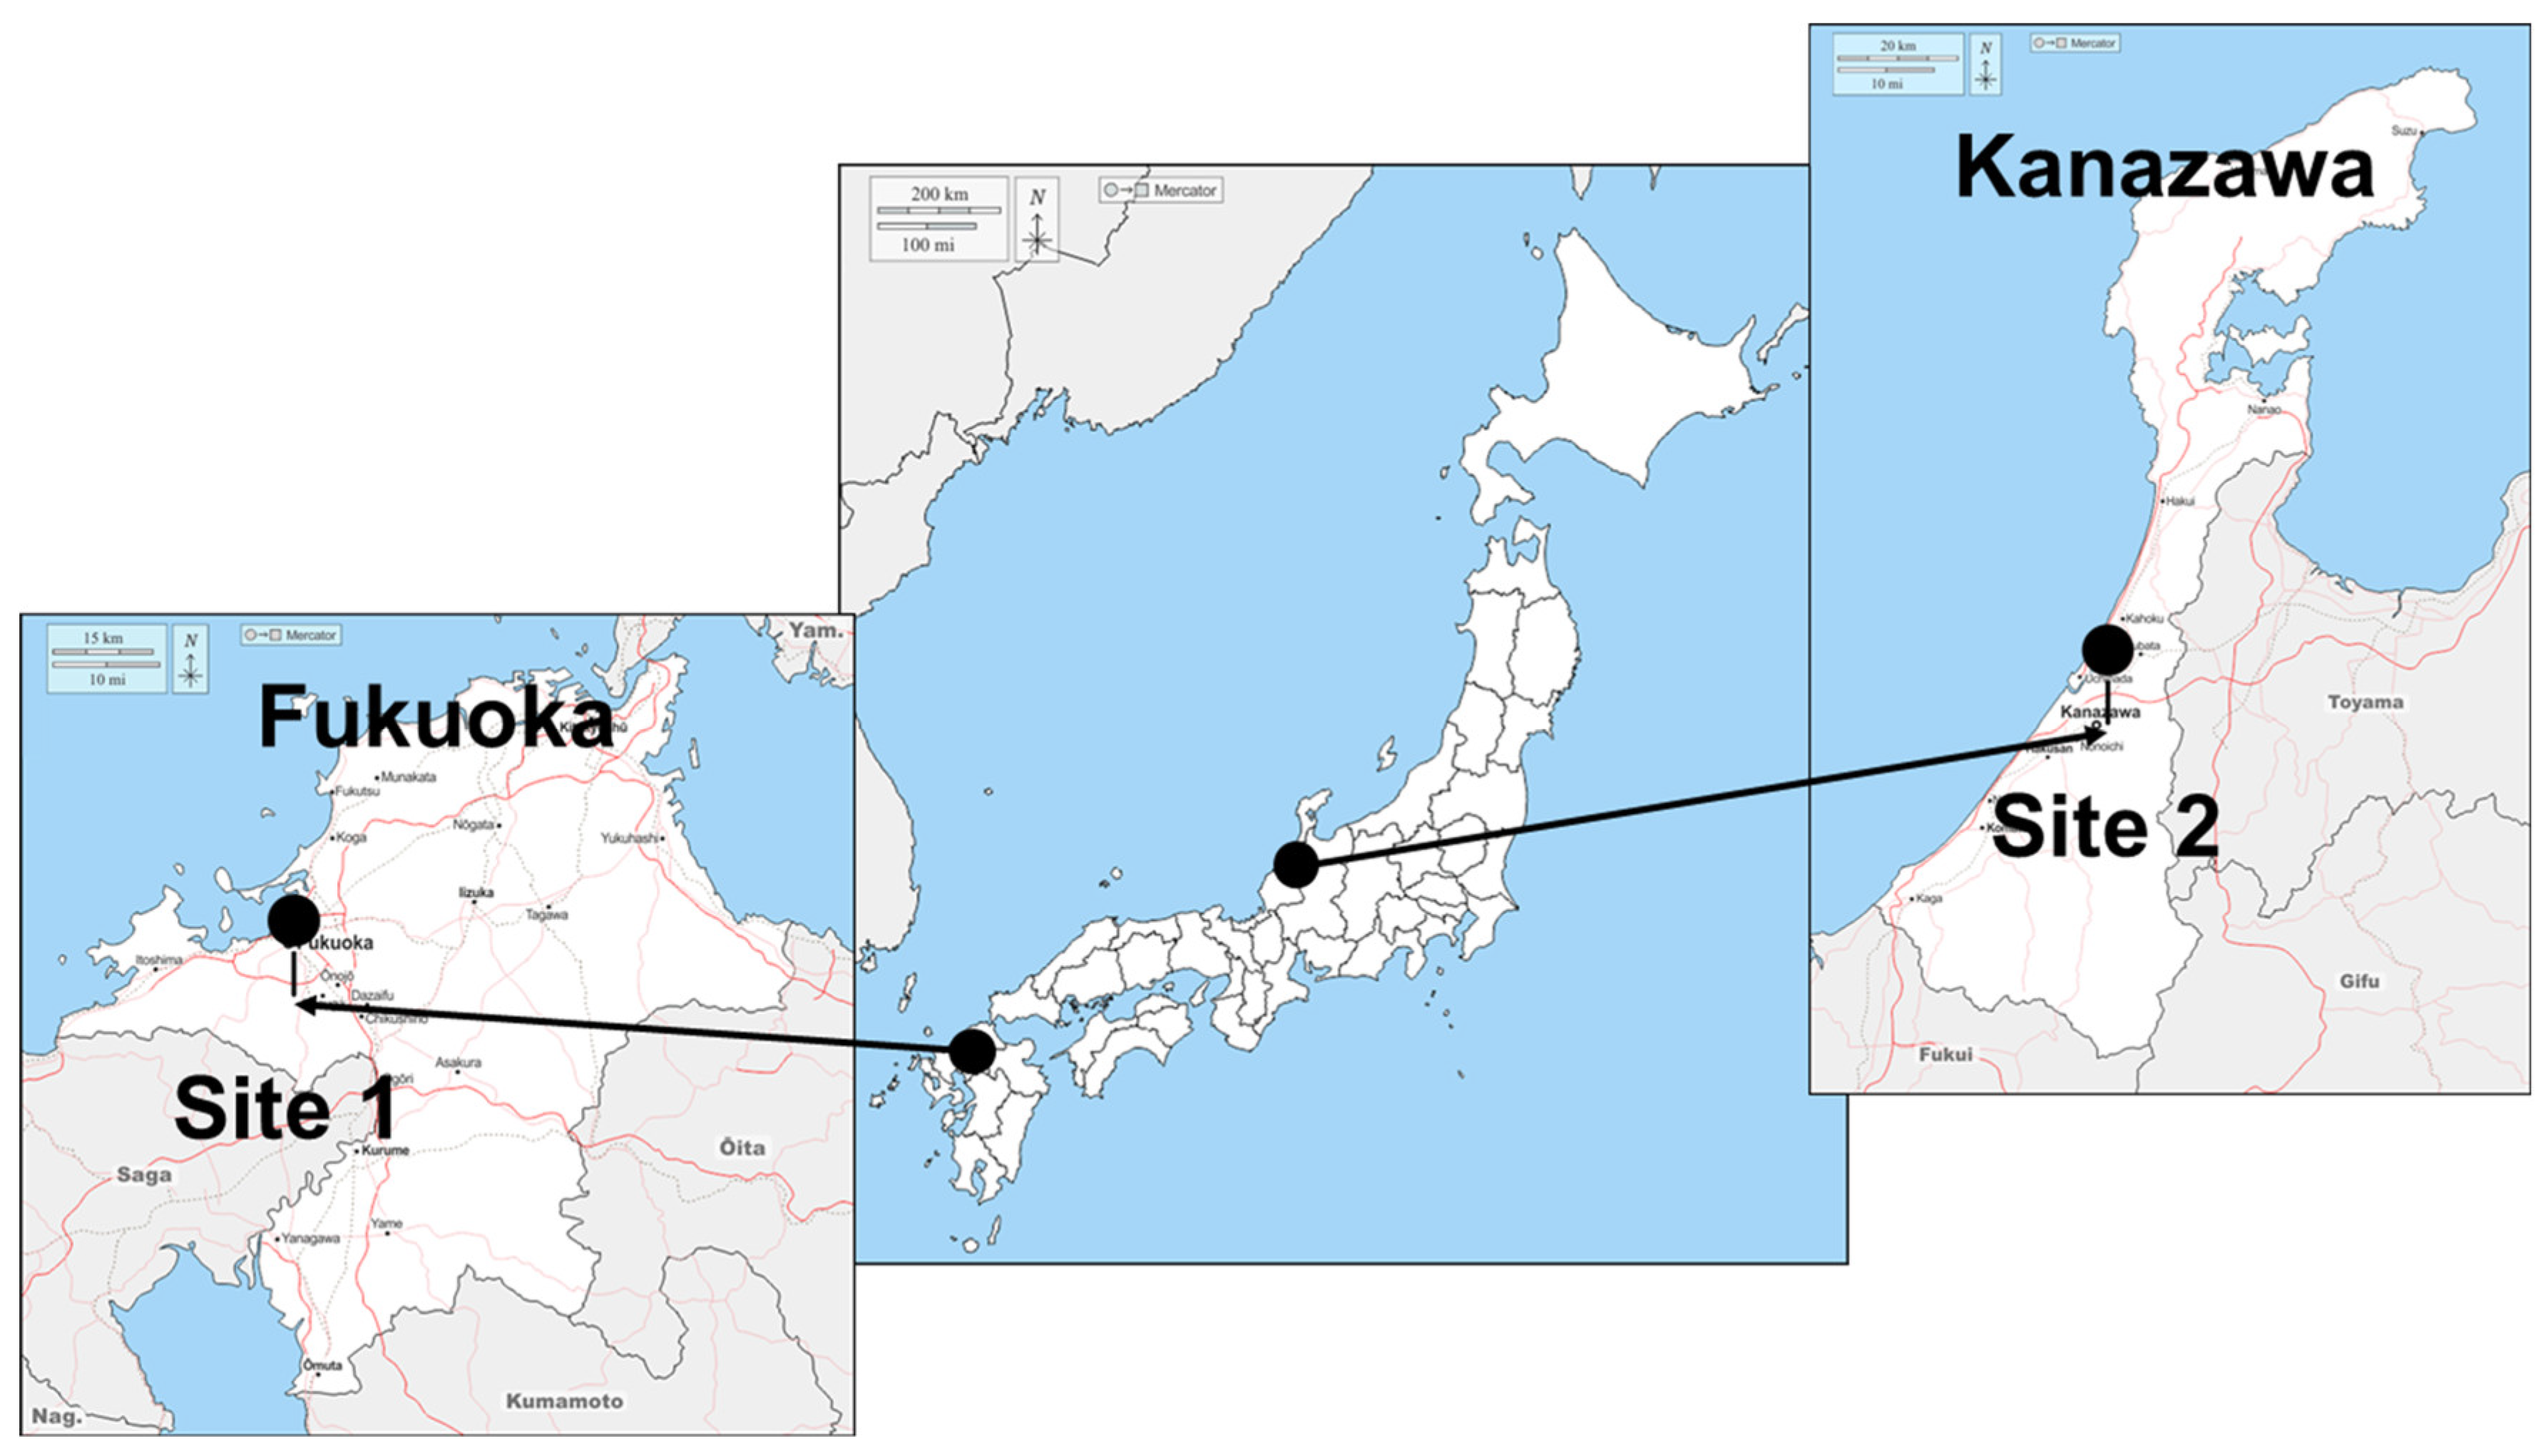
2.1. Sampling Sites and Method

Total suspended particulate matter (TSP) samples were collected on the roofs of two buildings in residential areas: National Fukuoka Hospital, Fukuoka (33.53° N, 130.41° E), and the Graduate school of Medical Science of Kanazawa University, Kanazawa (36.55° N, 136.67° E) (Figure 1 and Figure S1). Fukuoka City (population of 1,620,000), the capital of Fukuoka prefecture, is a commercial port city located on the Japan Sea coast side of Kyushu. Kanazawa City (population of 461,000), the capital of Ishikawa prefecture, is a commercial city located on the Japan Sea coast side of the central Honshu Island, Japan. TSP samples were collected daily using high-volume air samplers (HR-RW, Shibata, Japan), equipped with glass fiber filters at a flow rate of 1000 L min−1 from 1 March to 31 May in 2020 and 2021. Filters were covered in aluminum foil and balanced in a dark desiccator at least 24 h before and after the sampling. TSP concentration was calculated from filter weights before and after sampling. Details of the sampling sites and method were described in Text S1.

2.2. Chemicals: Organic Solvent and Standards

Nine PAHs, fluoranthene (Flt), pyrene (Pyr), benz[a]anthracene (BaA), chrysene (Chr), benzo[b]fluoranthene (BbF), benzo[k]fluoranthene (BkF), benzo[a]pyrene (BaP), benzo[ghi]perylene (BghiP) and indeno [1,2,3-cd]pyrene (IcdP) in SS EPA 610 PAH Mix (Supelco, Bellefonte, PA, USA) were quantified using high-performance liquid chromatography (HPLC) equipped with fluorescence detection. Sample treatment and detailed HPLC conditions are described in Text S2.

2.3. Asian Dust Observation

AD events in Japan were determined by the Japan Meteorological Agency (JMA) at one or more of 11 stations across Japan (http://www.data.jma.go.jp/gmd/env/kosahp/kosa_data_index.html, accessed on 15 October 2021) and by Light Detection and Ranging (LIDAR) (https://www-lidar.nies.go.jp/AD-Net, accessed on 15 October 2021) [23].

2.4. Backward Trajectory and Weather Map

The 72-h backward trajectories at 6-h intervals were calculated during the sampling period using the Hybrid Single-Particle Lagrangian Integrated Trajectory (HYSPLIT) model v5 (https://www.ready.noaa.gov/HYSPLIT_traj.php, accessed on 15 October 2021) provided by National Oceanic and Atmospheric Administration, U.S. Department of Commerce [24,25]. The Global Data Assimilation System (1° longitude × 1° latitude resolution) produced by the National Centers for Environmental Prediction was used as the input meteorological data for the HYSPLIT v5 analysis.

3. Results and Discussion

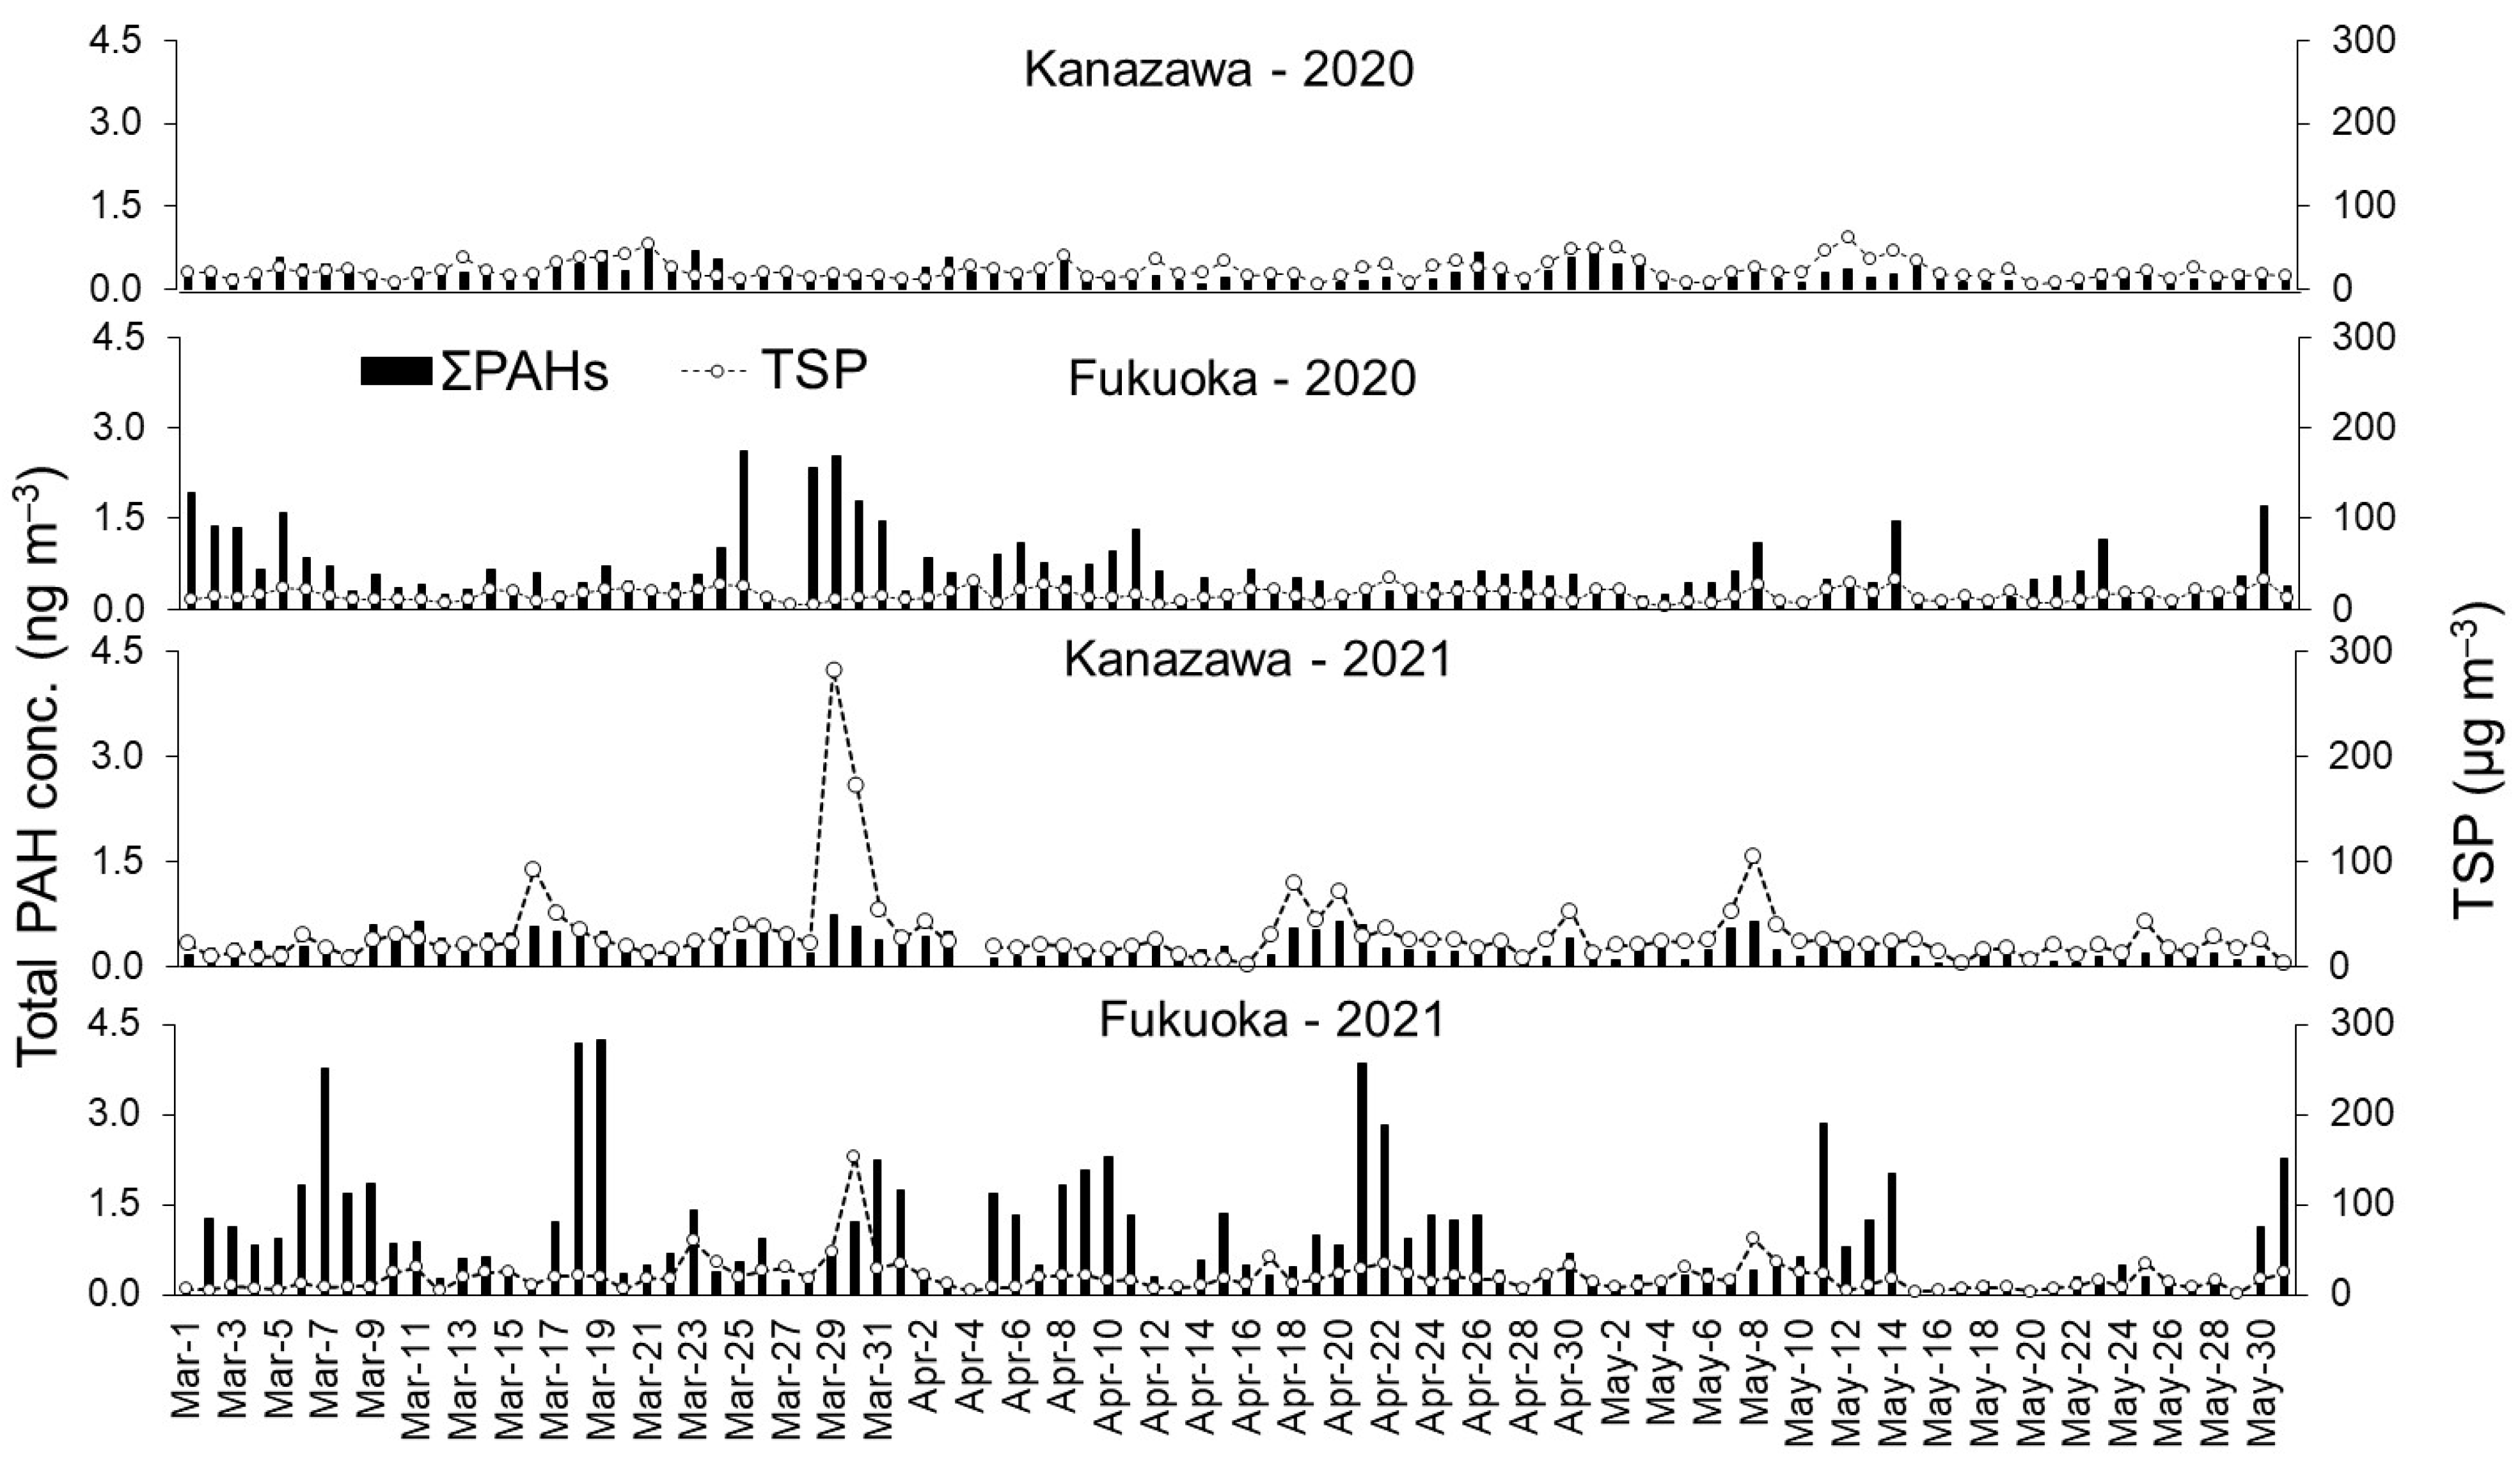
3.1. TSP and PAH Concentrations in Fukuoka and Kanazawa

Figure 2 shows the daily and average concentrations of TSP and PAHs in Fukuoka and Kanazawa from 1 March to 31 May in 2020 and 2021. During the monitoring period, AD events were identified in 41 and 33 days in Fukuoka and Kanazawa, respectively, by either JMA or LIDAR (Table S1). These results showed that profiles of daily TSP and PAHs were different between the two cities, and there were more AD days in Fukuoka than in Kanazawa. Average TSP concentrations of the monitoring periods in Fukuoka (15.6 μg m−3 in 2020, 19.2 μg m−3 in 2021) were lower than those in Kanazawa (22.9 μg m−3 in 2020, 30.1 μg m−3 in 2021). However, the average total PAH concentrations of the monitoring periods in Fukuoka (0.64 ng m−3 in 2020, 0.92 ng m−3 in 2021) were much higher than those in Kanazawa (0.30 ng m−3 in 2020 and 0.31 ng m−3 in 2021). It should be emphasized that the concentration ratio of total PAHs to TSP was much larger in Fukuoka (0.04 in 2020, 0.05 in 2021) than that in Kanazawa (0.01 in 2020 and 2021).
The monthly average concentrations were calculated in Table 1 to investigate the seasonal variation of TSP and PAHs. The total PAH concentration was in the decreasing order Mar > Apr > May in both cities. However, the average concentration was higher in 2021 than in 2020 in Fukuoka, while it was comparable in two years. The TSP concentration did not show such a clear monthly tendency. The results suggested that the seasonal variations of PAHs in Japan were influenced by long-range transported PAHs (LRT-PAHs) controlled by the synoptic-scale of meteorology [13].
The relationship between daily variations of TSP and total PAHs was weak in Fukuoka (non-AD: r = 0.321, AD: r = 0.059) and Kanazawa (non-AD: r = 0.521, AD: r = 0.526) (Table 2). As the reason for this, the different origins of TSP and PAHs are considered. TSP was affected by AD from deserts in the Asian continent on a planetary scale: moving within the upper layer of the planetary boundary layer and the free atmosphere [22]. On the other hand, LRT-PAHs emitted from Chinese cities closer to Japan than AD sources influenced PAH concentrations at monitoring sites on a synoptic scale: moving horizontally near the surface layer [13]. The difference in transportation of LRT-PAHs and AD will be discussed further in Section 3.2 and Section 3.3.

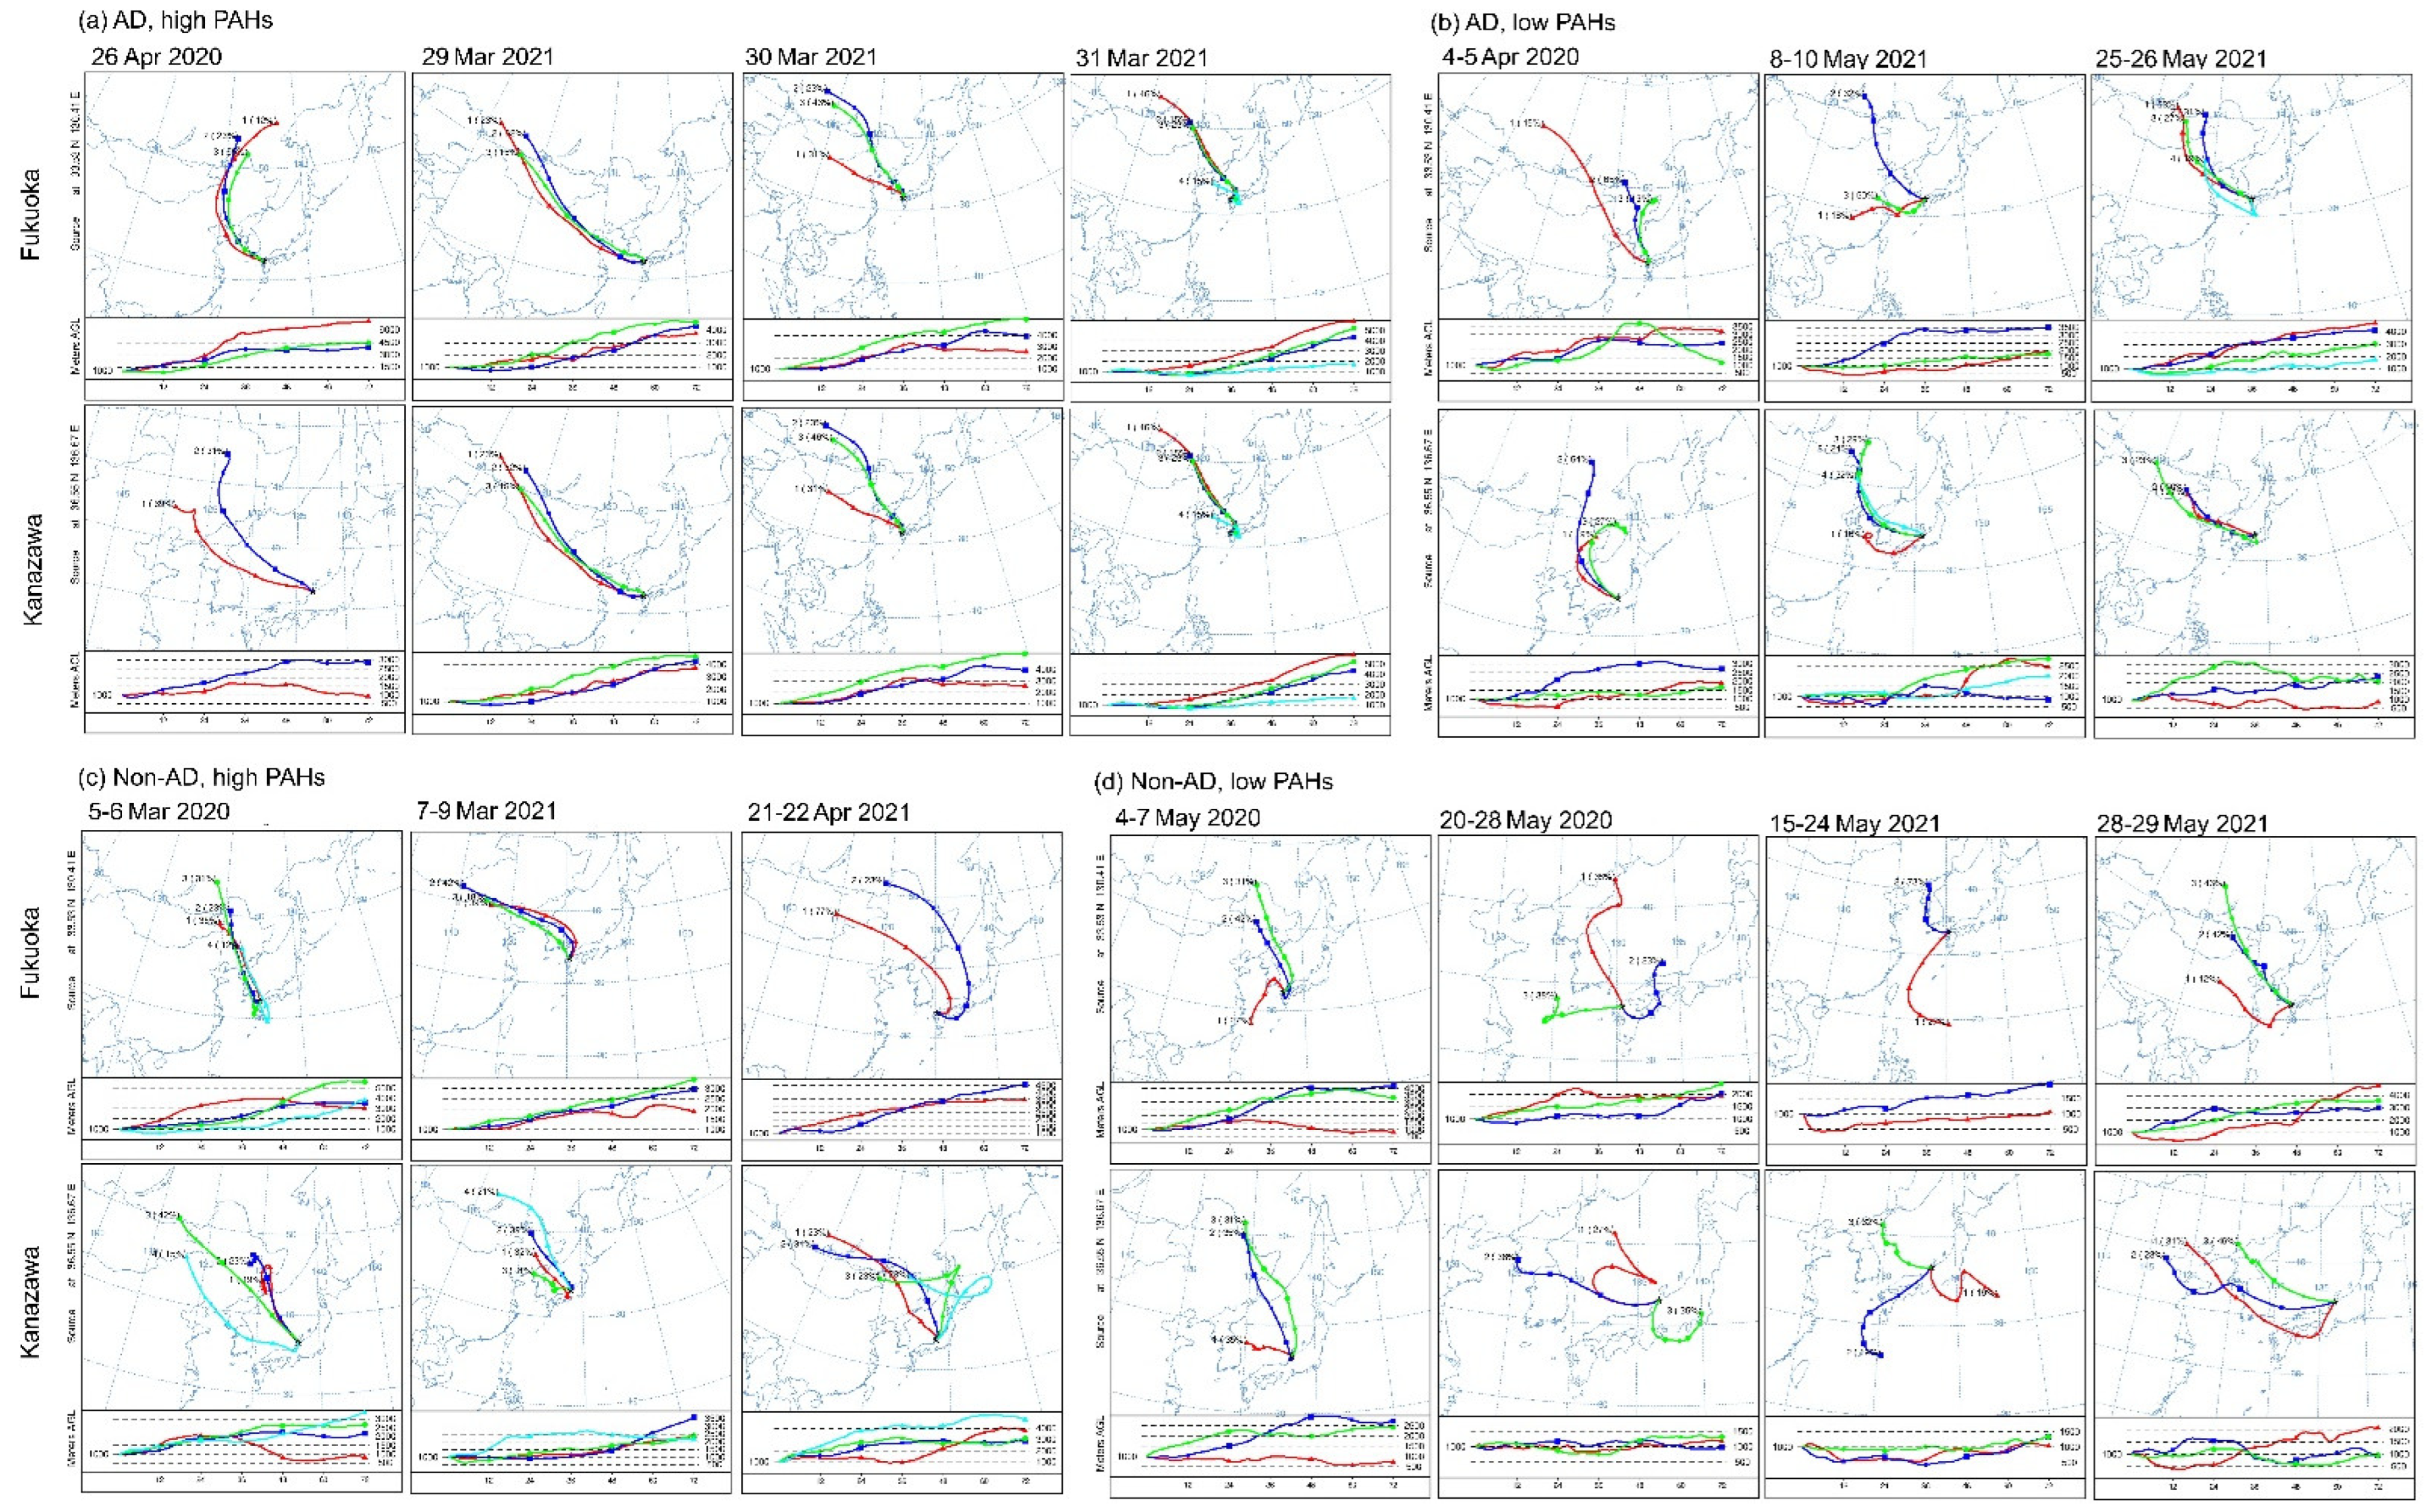
3.2. Backward Trajectory

The individual PAH concentrations significantly differed between non-AD and AD days in Kanazawa (p < 0.001), while the difference was not significant in Fukuoka (Table 3). Backward trajectories from Fukuoka and Kanazawa were compared for AD and LRT-PAHs (Figure 3). AD is transformed from Northwest and Central China or Mongolia deserts. It travels more than 6000 km to arrive in Japan. On the other hand, large amounts of PAHs are emitted from industrial and city areas near or on the east coast of China, which are less than 2000 km away from Japan. LRT-PAHs in Kanazawa mostly came from northeastern China areas above 35° N latitude, while it was from above and below 35° N latitude in Fukuoka. The northeast China areas above 35° N latitude include the Manchurian industrial region with the steel industry, coal, lubricating oil, chemicals, machinery, tools production, mills and shipyards, and Bohai Economic Rim with coal, steel and machinery production. On the other hand, LRT-PAHs in Fukuoka come from the northeast China areas below 35° N latitude are the Yangtze River Delta with shipyards, oil refineries, flour mills, steel plants, metal works, and light industries. Differences in emission sources and concentration in those areas might result in different PAH concentrations at sampling sites. Further studies on their effect should be conducted.
To find the reason for the lesser relationship between Fukuoka and Kanazawa for the PAH variation than for the TSP variation, we divided transporting routes of air mass into four patterns illustrated in Figure S2. During AD days, the TSP concentration is high because AD is from West and Central China to the sampling site. The PAH concentrations are high because the sampling site in Japan is on the LRT-PAH route (Figure S2a). On the other hand, the LRT-PAH route from Northeast China is narrower and shorter than AD. In this case, the PAH concentrations are low because the sampling site in Japan is not on the LRT-PAH route (Figure S2b). During non-AD days, TSP is low. However, the PAH concentrations are high when LRT-PAHs arrived at the sampling site in Japan (Figure S2c). The last pattern is that domestic sources only affect the PAH concentrations (Figure S2d).

3.3. Effect of Local Characteristics on PAH Concentrations

The above results show that local sources might also impact the PAH concentrations differently depending on the location of the sampling site. Kanazawa does not have major industrial areas and is substantially influenced by automobile emissions [21]. On the other hand, Fukuoka might be affected by the nearby heavy industrial area, Kita-Kyushu [26]. As an example, from 7–9 March in 2021, the PAH concentrations decreased in Kanazawa, while they increased in Fukuoka due to the different local air mass (Figure 2).
Besides the geology, different topographic sampling sites might affect the air pollution level. The Kanazawa sampling site was on a hill in the residential area, while the Fukuoka sampling site was in the valley bound to downtown. Valley topography can cause temperature inversion, which traps air pollutants emitted from downtown [27,28]. These considerations can explain the difference in daily and seasonal variations of TSP and PAHs between Fukuoka and Kanazawa.

4. Conclusions

In conclusion, the air mass of AD from Northwest and Central China strongly influenced TSP, but did not consistently affect PAH concentrations in Fukuoka and Kanazawa. Backward trajectories showed that the AD originated from Northwest and Central China or Mongolia deserts for a long distance (more than 6000 km) at a planetary weather scale with transporting heights of 1000–6000 m. In comparison, the LRT-PAHs came from industrial and city areas near/on the east coast of China with a short distance (800–2000 km) on a synoptic weather scale (transporting height: 500–4000 m). The LRT-PAH from above 35° N latitude areas (Manchurian industrial area and Bohai Economic Rim) impacted Fukuoka and Kanazawa. In contrast, LRT-PAH from below 35° N latitude areas (Yangtze River Delta) affected mainly Fukuoka. In addition, local emissions presented different effects from city to city in Japan. The major PAH source is traffic in Kanazawa, while it is the mixed source of industrial and traffic emissions in Fukuoka.
This is the first report to clarify the daily and seasonal effects of TSP and PAHs on long-distant sites in Japan during the AD period, which is important for studying chronic and acute respiratory disease mechanisms. The following study will analyze NPAHs in the same air samples and estimate source contributions of TSP, PAHs, and NPAHs in Fukuoka and Kanazawa by the NP-method, which uses 1-nitropyrene and Pyr as markers [2,21,26].

Supplementary Materials

The following supporting information can be downloaded at: https://www.mdpi.com/article/10.3390/app12115404/s1, Figure S1: High-volume air samplers at Fukuoka and Kanazawa; Figure S2: Illustration of possible LRT-PAH sources and routes from China to Japan from March to May; Table S1: Dates of AD events and their TSP and PAH concentrations in Fukuoka and Kanazawa in 2020 and 2021.

Author Contributions

Conceptualization, K.-O.P. and K.H.; methodology, K.-O.P., J.Z., K.H. and H.N.; software, K.S.; validation, K.H.; formal analysis, K.-O.P.; investigation, K.-O.P.; resources, H.M., H.O., A.H., H.N. and A.M.; data curation, A.H. and H.N.; writing—original draft preparation, K.-O.P.; writing— revising and editing, K.-O.P., K.S., A.M., Y.I. and K.H.; visualization, K.-O.P. and K.H.; supervision, H.N. and K.H.; project administration, H.N.; funding acquisition, H.N. All authors have read and agreed to the published version of the manuscript.

Funding

This research was funded by the Environment Research and Technology Development Fund (JPMEERF20195051) of the Environmental Restoration and Conservation Agency of Japan.

Institutional Review Board Statement

Not applicable.

Informed Consent Statement

Not applicable.

Data Availability Statement

The data presented in this study are available on request from the corresponding author. The data are not publicly available due to privacy.

Acknowledgments

The authors are grateful to Atsushi Shimizu at NIES for providing LIDAR data.

Conflicts of Interest

The authors declare no conflict of interest. The funders had no role in the design of the study; in the collection, analyses, or interpretation of data; in the writing of the manuscript, or in the decision to publish the results.

References

  1. Coulibaly, S.; Minami, H.; Abe, M.; Hasei, T.; Oro, T.; Funasaka, K.; Asakawa, D.; Watanabe, M.; Honda, N.; Wakabayashi, K.; et al. Long-range transport of mutagens and other air pollutants from mainland East Asia to western Japan. Genes Environ. 2015, 37, 25. [Google Scholar] [CrossRef] [Green Version]
  2. Hayakawa, K.; Tang, N.; Xing, W.; Oanh, P.K.; Hara, A.; Nakamura, H. Concentrations and Sources of Atmospheric PM, Polycyclic Aromatic Hydrocarbons and Nitropolycyclic Aromatic Hydrocarbons in Kanazawa, Japan. Atmosphere 2021, 12, 256. [Google Scholar] [CrossRef]
  3. Kubo, T.; Bai, W.; Nagae, M.; Takao, Y. Seasonal fluctuation of polycyclic aromatic hydrocarbons and aerosol genotoxicity in long-range transported air mass observed at the western end of japan. Int. J. Environ. Res. Public Health 2020, 17, 1210. [Google Scholar] [CrossRef] [PubMed] [Green Version]
  4. Yang, L.; Tang, N.; Matsuki, A.; Takami, A.; Hatakeyama, S.; Kaneyasu, N.; Nagato, E.G.; Sato, K.; Yoshino, A.; Hayakawa, K. A comparison of particulate-bound polycyclic aromatic hydrocarbons long-range transported from the Asian continent to the Noto Peninsula and Fukue Island, Japan. Asian J. Atmos. Environ. 2018, 12, 369–376. [Google Scholar] [CrossRef]
  5. Zhang, H.; Zhang, L.; Yang, L.; Zhou, Q.; Zhang, X.; Xing, W.; Hayakawa, K.; Toriba, A.; Tang, N. Impact of COVID-19 outbreak on the long-range transport of common air pollutants in KUWAMS. Chem. Pharm. Bull. 2021, 69, 237–245. [Google Scholar] [CrossRef]
  6. Oh, H.R.; Ho, C.H.; Kim, J.; Chen, D.; Lee, S.; Choi, Y.S.; Chang, L.S.; Song, C.K. Long-range transport of air pollutants originating in China: A possible major cause of multi-day high-PM10 episodes during cold season in Seoul, Korea. Atmos. Environ. 2015, 109, 23–30. [Google Scholar] [CrossRef]
  7. Sternberg, T.; Edwards, M. Desert dust and health: A central Asian review and steppe case study. Int. J. Environ. Res. Public Health 2017, 14, 1342. [Google Scholar] [CrossRef] [Green Version]
  8. Zhang, K.; Chai, F.; Zhang, R.; Xue, Z. Source, route and effect of Asian sand dust on environment and the oceans. Particuology 2010, 8, 319–324. [Google Scholar] [CrossRef]
  9. Kameda, T.; Azumi, E.; Fukushima, A.; Tang, N.; Matsuki, A.; Kamiya, Y.; Toriba, A.; Hayakawa, K. Mineral dust aerosols promote the formation of toxic nitropolycyclic aromatic compounds. Sci. Rep. 2016, 6, 24427. [Google Scholar] [CrossRef] [Green Version]
  10. Kashima, S.; Yorifuji, T.; Suzuki, E. Are People With a History of Disease More Susceptible to a Short-term Exposure to Asian Dust? A Case-Crossover Study Among the Elderly in Japan. Epidemiology 2017, 28, S60–S66. [Google Scholar] [CrossRef]
  11. Anyenda, E.O.; Higashi, T.; Kambayashi, Y.; Nguyen, T.T.T.; Michigami, Y.; Fujimura, M.; Hara, J.; Tsujiguchi, H.; Kitaoka, M.; Asakura, H.; et al. Associations of cough prevalence with ambient polycyclic aromatic hydrocarbons, nitrogen and sulphur dioxide: A longitudinal study. Int. J. Environ. Res. Public Health 2016, 13, 800. [Google Scholar] [CrossRef] [PubMed] [Green Version]
  12. Anyenda, E.O.; Higashi, T.; Kambayashi, Y.; Thao, N.T.T.; Michigami, Y.; Fujimura, M.; Hara, J.; Tsujiguchi, H.; Kitaoka, M.; Asakura, H.; et al. Exposure to daily ambient particulate polycyclic aromatic hydrocarbons and cough occurrence in adult chronic cough patients: A longitudinal study. Atmos. Environ. 2016, 140, 34–41. [Google Scholar] [CrossRef]
  13. Inomata, Y.; Takeda, M.; Thao, N.; Kajino, M.; Seto, T.; Nakamura, H.; Hayakawa, K. Particulate PAH transport associated with adult chronic cough occurrence closely connected with meteorological conditions: A modelling study. Atmosphere 2021, 12, 1163. [Google Scholar] [CrossRef]
  14. Nguyen, T.T.T.; Higashi, T.; Kambayashi, Y.; Anyenda, E.O.; Michigami, Y.; Hara, J.; Fujimura, M.; Tsujiguchi, H.; Kitaoka, M.; Asakura, H.; et al. A longitudinal study of association between heavy metals and itchy eyes, coughing in chronic cough patients: Related with non-immunoglobulin E mediated mechanism. Int. J. Environ. Res. Public Health 2016, 13, 110. [Google Scholar] [CrossRef] [PubMed] [Green Version]
  15. Honda, A.; Sawahara, T.; Hayashi, T.; Tsuji, K.; Fukushima, W.; Oishi, M.; Kitamura, G.; Kudo, H.; Ito, S.; Yoshida, S.; et al. Biological factor related to Asian sand dust particles contributes to the exacerbation of asthma. J. Appl. Toxicol. 2017, 37, 583–590. [Google Scholar] [CrossRef]
  16. Fussell, J.C.; Kelly, F.J. Mechanisms underlying the health effects of desert sand dust. Environ. Int. 2021, 157, 106790. [Google Scholar] [CrossRef]
  17. Tang, N.; Hakamata, M.; Sato, K.; Okada, Y.; Yang, X.; Tatematsu, M.; Toriba, A.; Kameda, T.; Hayakawa, K. Atmospheric behaviors of polycyclic aromatic hydrocarbons at a Japanese remote background site, Noto peninsula, from 2004 to 2014. Atmos. Environ. 2015, 120, 144–151. [Google Scholar] [CrossRef] [Green Version]
  18. Zhou, Q.; Zhang, L.; Yang, L.; Zhang, X.; Xing, W.; Hu, M.; Chen, B.; Han, C.; Toriba, A.; Hayakawa, K.; et al. Long-term variability of inorganic ions in TSP at a remote background site in Japan (Wajima) from 2005 to 2015. Chemosphere 2021, 264, 128427. [Google Scholar] [CrossRef]
  19. Yang, L.; Zhang, L.; Zhang, H.; Zhou, Q.; Zhang, X.; Xing, W.; Takami, A.; Sato, K.; Shimizu, A.; Yoshino, A.; et al. Comparative analysis of PM2.5-bound polycyclic aromatic hydrocarbons (PAHS), nitro-pahs (NPAHS), and water-soluble inorganic ions (WSIIS) at two background sites in Japan. Int. J. Environ. Res. Public Health 2020, 17, 8224. [Google Scholar] [CrossRef]
  20. Shimada, K.; Nohchi, M.; Yang, X.; Sugiyama, T.; Miura, K.; Takami, A.; Sato, K.; Chen, X.; Kato, S.; Kajii, Y.; et al. Degradation of PAHs during long range transport based on simultaneous measurements at Tuoji Island, China, and at Fukue Island and Cape Hedo, Japan. Environ. Pollut. 2020, 260, 113906. [Google Scholar] [CrossRef]
  21. Hayakawa, K.; Tang, N.; Matsuki, A.; Inomata, Y.; Toriba, A.; Nagato, E.G. Calculating source contributions to urban atmospheric polycyclic aromatic hydrocarbons and nitropolycyclic aromatic hydrocarbons using 1-nitropyrene and pyrene: An application to an Asian dust event. Chemosphere 2021, 280, 130662. [Google Scholar] [CrossRef] [PubMed]
  22. Hara, Y.; Yumimoto, K.; Uno, I.; Shimizu, A.; Sugimoto, N.; Liu, Z.; Winker, D.M. Asian dust outflow in the PBL and free atmosphere retrieved by NASA CALIPSO and an assimilated dust transport model. Atmos. Chem. Phys. 2009, 9, 1227–1239. [Google Scholar] [CrossRef] [Green Version]
  23. Shimizu, A.; Sugimoto, N.; Matsui, I.; Arao, K.; Uno, I.; Murayama, T.; Kagawa, N.; Aoki, K.; Uchiyama, A.; Yamazaki, A.A. Continuous observations of Asian dust and other aerosols by polarization LIDARS in China and Japan during ACE-Asia. J. Geophys. Res. D Atmos. 2004, 109, 1–14. [Google Scholar] [CrossRef]
  24. Rolph, G.; Stein, A.; Stunder, B. Real-time Environmental Applications and Display sYstem: READY. Environ. Model. Softw. 2017, 95, 210–228. [Google Scholar] [CrossRef]
  25. Stein, A.F.; Draxler, R.R.; Rolph, G.D.; Stunder, B.J.B.; Cohen, M.D.; Ngan, F. Noaa’s hysplit atmospheric transport and dispersion modeling system. Bull. Am. Meteorol. Soc. 2015, 96, 2059–2077. [Google Scholar] [CrossRef]
  26. Hayakawa, K.; Tang, N.; Toriba, A.; Nagato, E.G. Calculating sources of combustion-derived particulates using 1-nitropyrene and pyrene as markers. Environ. Pollut. 2020, 265, 114730. [Google Scholar] [CrossRef]
  27. McNider, R.T.; Pour-Biazar, A. Meteorological modeling relevant to mesoscale and regional air quality applications: A review. J. Air Waste Manage. Assoc. 2020, 70, 2–43. [Google Scholar] [CrossRef]
  28. Wallace, J.; Corr, D.; Kanaroglou, P. Topographic and spatial impacts of temperature inversions on air quality using mobile air pollution surveys. Sci. Total Environ. 2010, 408, 5086–5096. [Google Scholar] [CrossRef]
Figure 1. Map of sampling sites. Site 1: Fukuoka National Hospital (33.53° N, 130.41° E). Site 2: Kanazawa University (36.55° N, 136.67° E).
Applsci 12 05404 g001
Figure 2. The concentrations of total PAH (ng m−3) and TSP (μg m−3) from March to May in 2020 and 2021 in Fukuoka and Kanazawa.
Applsci 12 05404 g002
Figure 3. The backward trajectory and cluster analysis of four patterns: (a) AD days with high PAH concentration (≥mean PAH concentration in AD days: 0.85 ng m−3 in Fukuoka and 0.43 ng m−3 in Kanazawa), (b) AD days low PAH concentration (<mean PAH concentration in AD days), (c) non-AD with high PAH concentration (≥mean PAH concentration in non-AD days: 0.76 ng m−3 in Fukuoka and 0.28 ng m−3 in Kanazawa), and (d) non-AD days with low PAH concentrations (<mean PAH concentration in non-AD days).
Applsci 12 05404 g003
Table 1. Total PAHs (ng m−3) and TSP (μg m−3) in Fukuoka and Kanazawa from March to May in 2020 and 2021 (Mean ± SD).
PlaceTimeTotal PAHs (ng m−3)TSP (μg m−3)
FukuokaMar 20200.89 ± 0.7215.0 ± 5.9
Apr 20200.58 ± 0.2616.7 ± 7.0
May 20200.45 ± 0.4015.2 ± 8.1
Avg of 20200.64 ± 0.5315.6 ± 7.0
Mar 20211.17 ± 1.1123.7 ± 27.3
Apr 20211.07 ± 0.8918.3 ± 9.3
May 20210.53 ± 0.6815.5 ± 12.5
Ave of 20210.92 ± 0.9419.2 ± 18.3
Avg of total0.78 ± 0.7717.4 ± 14.0
KanazawaMar 20200.37 ± 0.1622.6 ± 10.2
Apr 20200.28 ± 0.1422.4 ± 9.9
May 20200.25 ± 0.1523.6 ± 14.5
Avg of 20200.30 ± 0.1622.9 ± 11.6
Mar 20210.42 ± 0.1539.6 ± 54.8
Apr 20210.30 ± 0.1626.7 ± 17.7
May 20210.21 ± 0.1424.0 ± 18.3
Avg of 20210.31 ± 0.1730.1 ± 35.5
Avg of total0.30 ± 0.1626.5 ± 26.5
SD: standard deviation.
Table 2. Correlation coefficient (r) between total PAH and TSP in Fukuoka and Kanazawa in non-AD and AD days.
rFukuokaKanazawa
Monthly0.7510.680
DailyNon-ADADNon-ADAD
0.321 **0.0590.521 **0.526 **
**. Correlation is significant at the 0.01 level (2-tailed).
Table 3. Difference between individual PAH and TSP in Fukuoka and Kanazawa in non-AD and AD days.
Air PollutantsFukuoka Kanazawa p-Value b
(Fukuoka vs. Kanazawa)
Non-AD
(n = 143)
AD (n = 41)p-Value b
(Non-AD vs. AD)
Non-AD
(n = 150)
AD (n = 33)p-Value b
(Non-AD vs. AD)
MeanSDMeanSDMeanSDMeanSD
Flt0.160.180.180.250.4140.060.030.090.04<0.001<0.001
Pyr0.120.120.140.160.4310.050.020.070.03<0.001<0.001
BaA0.030.040.030.040.5250.010.010.010.010.002<0.001
Chr0.080.080.090.110.4270.020.010.040.02<0.001<0.001
BbF0.120.110.130.130.5340.040.020.060.03<0.001<0.001
BkF0.040.040.040.040.7910.010.010.020.01<0.001<0.001
BaP0.060.060.060.060.8700.020.010.030.01<0.001<0.001
BghiP0.100.080.110.090.4920.040.020.060.02<0.001<0.001
IcdP0.060.050.070.050.7810.030.020.040.02<0.001<0.001
ΣPAHs a0.760.730.850.920.5030.280.150.430.18<0.001<0.001
TSP14.17.128.823.2<0.00120.39.154.651.20.001<0.001
p-value less than 0.05 is shown in bold. a Total PAHs, b p-value was from independent t-test.
Publisher’s Note: MDPI stays neutral with regard to jurisdictional claims in published maps and institutional affiliations.

