Article

Flue Gas Composition and Treatment Potential of a Waste Incineration Plant

1
Department of Waste and Resource Management, Faculty of Agricultural and Environmental Sciences, University of Rostock, D-18059 Rostock, Germany
2
Deutsches Biomasseforschungszentrum GmbH, D-04347 Leipzig, Germany
*
Author to whom correspondence should be addressed.
Appl. Sci. 2022, 12(10), 5236; https://doi.org/10.3390/app12105236
Submission received: 11 March 2022 / Revised: 9 May 2022 / Accepted: 13 May 2022 / Published: 22 May 2022

Abstract

:

Featured Application

Authors are encouraged to provide a concise description of the specific application or a potential application of the work. This section is not mandatory.

Abstract

Waste-to-energy (WtE) incineration is an important technique in waste management systems and waste hierarchy. It is used to treat approximately 63% of the waste in European countries. The flue gas volumetric rate and its composition are essential to determine and monitor the emissions from waste incineration plants. This paper presents two methodologies used to evaluate the emissions from incinerators during the design phase. The first consists of a set of equations applicable in Excel (calculation model), while the second is the built-in components in Ebsilon 13.2 software which simulates the emissions from a furnace. This paper also proposes a comprehensive flue gas cleaning system for a simulated waste incineration plant in Jordan. According to Ebsilon, the results showed that for a 25 kg/s loading rate, there was 258,514 mg/Nm3, 749.90 mg/Nm3, 890.20 mg/Nm3, and 717 mg/Nm3 of CO2, NO2, SO2, and HCL, respectively. It was noted that these values relate to 1.5 of excess air ratio, where the effect of excess air ratio as the main driver for any combustion process was examined. The calculation method (set of equations) evaluated the flue gas volumetric rate, the CO2 emissions, and N2O and SO2 levels. Ebsilon allows for simulation of the treatment stages and calculates the amount of materials required. Selective non-catalytic reduction (SNCR) (a built-in component in the Ebsilon library) was used to treat the NO2 emissions. For 1.5 of excess air ratio, those emissions were reduced from 749 mg/Nm3 to 180 mg/Nm3, while the Ca(OH)2 injector used to treat the SO2 and HCL emissions reduced emissions from 890.20 mg/Nm3 and 717 mg/Nm3 to 44 mg/Nm3 and 7.16 mg/Nm3, respectively. Regarding the reduction in CO2, the spherical carbon absorption concept was simulated using 9.4 kg/s of carbon which was adequate to verify a 91% reduction rate of CO2. Furthermore, the calculation model was validated and approved as a valuable model to predict the flue gas volume, the oxygen required, and flue gas emissions at the design stage.

1. Introduction

Combustion is defined as a chemical reaction during which the fuel combustible elements are rapidly oxidized and a large quantity of energy is released [1]. The purpose of burning organic fuels in combustion plants is to obtain hot combustion gases which are the primary heating agent in the boiler [2]. The combustion of organic fuels is an exothermic process in which fuel and combustion air are consumed, generating combustion gases and solid products (ash–slag) [1]. Fuels are defined as substances that produce significant amounts of heat by combustion. To be considered as fuel, a substance must meet the following criteria [1]:
  • It should react exothermically with oxygen (air) at high speed and temperature.
  • The resulting combustion products must be non-toxic (due to the importance of air pollution cleaning systems and CO2 capture).
  • It should be widespread in nature. Therefore, it must be cost-effective with no other cheaper alternative uses (this is exactly applied for municipal solid waste (MSW)).
  • The resulting combustion products should not be corrosive when they come into contact with any exposed surface (this can be achieved by applying a SO2 reduction system).
Solid fuels such as MSW and coal contain varying amounts of carbon, oxygen, hydrogen, nitrogen, sulfur, moisture, and ash, making an exact mass analysis difficult. Combustible mass and ballast are the main fractions in any kind of solid fuel. Combustible mass denotes combustible materials while ballast is the ash–slag.
To scale-up the mass of each component (kg component/kg fuel), it is essential to know the elementary chemical composition. Sulfur is an unwanted presence, as it reacts with the moisture in the flue gas, resulting in sulfuric acid, which is extremely corrosive to the metal elements of the combustion plant. As air is free and easy to obtain, it is the main element used for oxidation to burn the fuel and achieve the chemical combustion process. Oxy-fuel combustion technology, where air is replaced by a mixture of pure oxygen and recirculated combustion gases, is one of the most promising techniques for CO2 capture and CO2 emission reduction [3]. Depending on the type of combustion (excess air coefficient), the combustion gases may contain:
-
For incomplete combustion (lambda < 1): CO, CO2, SO2, H2O, and N2.
-
For theoretical or stoichiometric combustion (lambda = 1): CO2, SO2, H2O, and N2.
-
For excedentary combustion (lambda > 1): CO2, SO2, H2O, N2, and O2.
In general, an inadequate air ratio and poor mixing of air and fuel produces high energy wastage and high pollutant emissions [4,5].
The cumulative emission of CO2 affects the climate and is the greatest single contributor to the greenhouse effect [6]. The Kyoto Protocol and the Paris Agreement aim to control greenhouse gas emissions under the United Nations Framework Convention on Climate Change (UNFCCC), in which CO2 is listed as a major greenhouse gas that needs to be mitigated or recycled [7,8]. However, waste incineration is much better than landfilling in terms of emissions and the effect on the climate. It should be noted that in many countries, the main method of waste treatment is landfill. In the Middle East and North Africa (MENA) region countries, more than 95% of municipal waste goes to landfill [9,10,11]. In our previous work [12], a waste incineration plant was simulated using Ebsilon (a specific software package serving as a multi-functional engineering system analysis). Jordan was chosen for the case study, and a 4 kg sample was collected from a 52-ton heap of waste in the waste-converting station in Amman city, which receives waste from six regions, and therefore was considered a representative sample for Jordan. The sample was shredded and prepared for analysis in the laboratory to ascertain its characterization and its element constitution.
This paper presents analyses of the proposed emission system and adopted flue gas emission system in relation to the emission requirements for incineration plants specified by the European Commission (EC) [13]. There are many studies in the literature that discuss emissions from flue gas in a range of different facilities, such as Ciobanu et.al [14]. The main objective of their work was to determine the level of emissions of the resulting pollutants (total dust and flue gases: NOx, SO2, and CO) at the outlet of the chimney of the clinker kiln. It was found that co-incineration of waste was more environmentally efficient and that acid gases could be neutralized by using an oven heat exchanger. Zhu et al. [15] examined how to reduce the effect of NH4HSO4 on the activity of the selective catalytic reduction (SCR) catalyst at low temperatures in industrial applications. Kosowska M. et al. [16] studied in laboratory-scale the CO2, NOx, and SO2 emissions from biomass combustion and the emissions from a coal reference plant. They concluded that biomass is a unique source of renewable energy because of its low emission concentration in comparison with coal. Dong J. et al. [17] modelled 12 scenarios of the available flue gas cleaning system technologies. The results showed that a dry system using sodium bicarbonate and selective non-catalytic reduction (SNCR) was the best option for 7 out of 18 impacts, including climate change (37.1 kg CO2 eq./t MSW), while the wet systems had higher impacts than the dry alternatives. Technologies for the removal of acid gases were examined by Dal Pozzo et al. [18] to identify a better design solution for dry, semi-dry, and wet systems. The benefits and limits of each alternative technology were discussed from both environmental and economic perspectives. Biganzoli et al. [19] evaluated the impact of using a high-temperature dolomitic sorbent as a preliminary stage for treatment of acid gases. They considered removal of atypical dry acid gases based on sodium bicarbonate (NaHCO3), and the results showed that the production of the reagent and treatment of solid residues were the key environmental factors. However, it can be said that flue gas emissions and cleaning systems is an unlimited research topic in which critical points are made as it is connected to the environment and climate phenomena.

2. Methods and Materials

As previously mentioned, a sample of MSW collected from Jordan was analyzed and prepared to ascertain the elementary constitution of the waste (see Table 1). These results were analyzed using two different models. The first model predicted and calculated the mass flow of the flue gas and the distribution of each emitted gas included in the volumetric flow of the gas itself. The second was Ebsilon, which was used to design the flue gas emission cleaning system (see Figure 1).

2.1. Element Interaction and Influence of Air

In the combustion process, the total mass of the products must be equal to the total mass of the reactants. In addition, the total mass of each chemical element was conserved during the process. Normally, air consists of three elements; oxygen, nitrogen, and water vapor. Dry air consists of 21% O2 and 79% N2. As a molar basis, each kmol of O2 introduced into the furnace corresponds to 3.76 kmol of N2 (0.79/0.21) [1].
Two main elements, C and H2, in the composition of MSW had to be illustrated in a chemical reaction to conclude its potentiality in the flue gas constitution according to [20].
For Carbon C:
C   +   O 2 + 3.76 N 2 CO 2 + 3.76 N 2
The third row in Table 2 shows the atomic weight of each element multiplied by the number of moles in each element in the equation to find the molecular weight. The fourth row is the required weight (amount of kg) of each material element related to 1 kg of carbon. The weight of the elements is determined by dividing the molecular weight of each element by the molecular weight of carbon. This provides the material weight related to the carbon weight.
The chemical reaction (shown above) represents the interaction of carbon with air (air is considered as dry air when it consists of 0.21 oxygen and 0.79 nitrogen) and stoichiometric air (without excess air). It can be seen that 1 kg of carbon produces 3.66 kg of CO2. The volume of CO2 in the output of the reaction can be analyzed as follows:
Total output material weight (CO2 and N2) of the reaction:
3.66 + 8.77 = 12.43 kg
CO 2   volume   in   the   output = 3.66 12.43 = 0.29 = 29 %
This means that the volume of CO2 for this combustion process was 29% of the total output (note that this is for stoichiometric conditions).
If 20% of excess air is assumed, then in this case, more air is inserted into the reaction as follows:
C   + 1.2 O 2 + 1.2 + 3.76 N 2 CO 2 + 1.23.76 N 2 + 0.2 O 2
Total output material weight (CO2, N2, and O2) of the reaction:
3.66 + 11.57 + 0.53 = 15.76 kg
CO 2   volume   in   the   output = 3.66 15.76 = 0.23 = 23 %
This means that the volume of CO2 for this combustion process was 23% of the total output (note that this is for excess air conditions). As shown in Table 3, it could be concluded that increasing the mass flow of air required for combustion decreases the CO2 emissions. However, this reaction was only for carbon, whereas in reality, a mixture of materials is loaded into the furnace and it is difficult to specify all the chemical compounds. The elemental reaction is a good option to illustrate or to imagine the nature of the interaction in the furnace, especially for carbon.
The same steps were repeated for hydrogen [20], which is the responsible element of the water content in the flue gas volume. It is summarized as follows:
H 2 +   O 2 + 3.76 N 2 2 H 2 O + 3.76 N 2
The reaction following the stoichiometric air conditions shows that 1 kg of hydrogen is responsible for 8.92 kg of water generation in the flue gas (see Table 4).

2.2. Flue Gas Volume as a Function of LCV

The volume of flue gas for stoichiometric conditions can be assessed as a function of the lower calorific value (LCV) of the MSW itself. Flue gas consists of dry gas fraction and water vapor fraction divisions. Due to the dense experience, the typical values of those divisions are available as a function of the energy content of the waste (LCV) (see Table 5).
LCV 7 MJ/kg was used for this study. The flue gas volume consisted of 0.36 kg/MJ dry flue gas and 0.026 kg/MJ water vapor. The total amount of thermal energy released from the furnace depends on the waste incineration plant capacity. As the capacity of the proposed system was 25 kg/s (90,000 kg/h) [12], then:
  • the total thermal energy released from this system = 90,000 (kg/h) × 7 (MJ/kg) = 630,000 (MJ/h).
  • The dry flue gas portion was 630,000 (MJ/h) × 0.36 (kg/MJ) = 226,800 kg/h.
  • The water vapor flue gas portion was 630,000 (MJ/kg) × 0.026 (kg/MJ) = 16,380 kg/h.
  • The total mass flow of flue gas was 243,180 kg/h.
The design temperature of the flue gas (the minimum temperature must be reached) was taken as 850 °C. At this temperature, the flue gas density was around 0.31 kg/m3, and the density of the flue gas was specified from the flue gas property tables available in [20,22] as function of its temperature. Note that the design temperature plays a major role in minimizing and reducing polychlorinated dibenzo-p-dioxins (PCDDs) and polychlorinated dibenzo-furans (PCDFs) as explained later.
The volumetric flue gas flow was 243,180 (kg/h)/0.31 (kg/m3) = 784,451.6 m3/h = 218 m3/s.
This was the volumetric flue gas flow rate subjected to stoichiometric conditions and at 850 °C for the flue gas design temperature. Of course, in the Ebsilon simulation results, the flue gas volumetric flow is greater than the design value due to the higher temperature of flue gas (see Figure 2). According to the available results (values) related to the flue gas aspects harvested from the simulation process in Ebsilon, for the same MSW parameters in terms of LCV, temperature, pressure, and mass flow, different flue gas properties were raised due to the direct effect of excess air. This governing parameter (excess air) is controllable in Ebsilon to moderate the combustion inside the furnace component and to control the temperature of the flue gas (see Figure 2).
For 1.5 of excess air ratio, the flue gas temperature reached 1146 °C and a mass flowrate of 75.7 kg/s (this temperature ensures complete combustion and reduces the potentiality of PCDD and PCDF formation). When the excess air was increased to 2 (which means that the stoichiometric air required is doubled), the flue gas temperature reached 998 °C and the mass flow rate was 93.5 kg/s. This makes sense, as increments in the amounts of air pumped into the furnace increase the convection effect inside the furnace and affect the temperature of the flue gas, causing it to drop. At the same time, the mass flowrate of flue gas is already increasing due to the increments in the air blowing inside the furnace. It should be noted that the CO2 fraction was decreased when the excess air increased to 2, and it occupied around 11% of the flue gas volume. However, CO2 emissions were around 14% when the excess air ratio was 1.5. These results emphasize the theoretical analysis outlined above regarding the prediction of emissions.

2.3. Stoichiometric Air and Oxygen Required for Combustion (Excel Model)

The ideal combustion process is known as a stoichiometric or theoretical combustion where a fuel is completely burned using the least quantity of air. The probability of fuel element atoms meeting all oxygen atoms (air) is implausible due to the combustion of fuel working with an excess amount of air (for excedentary combustion [lambda > 1]) to increase the chance of complete combustion or to control the temperature of the combustion chamber. The ratio between the real air volume introduced into the burning chamber is Va, and the stoichiometric air volume, where V a 0   is the air ratio or excess air coefficient, is denoted by λ.
The following model was used to calculate the required amount of air for the combustible fraction of the MSW. A further amount of air (excess air) was required for the combustion of water content inside the fuel itself (waste). This air requirement can be modeled according to a total heat release concept from the designed loading rate of the fuel. The air fraction required for the combustible materials of the fuel can be found according to the model in [1]. The results of the laboratory analysis of the elementary analysis were found as follows:
The stoichiometric volume of oxygen required for combustion N m 3 o f   O 2 k g   o f   f u e l is:
V O 2 0 = 22.41 100   C 12 + H 4 + S O 32  
Oxygen has a volume participation in air of 21%, and for this reason, the stoichiometric volume of dry air required to burn one kilogram of fuel N m 3 o f   a i r k g   o f   f u e l   is:
V a   d r y 0 = V O 2 0 / 0.21
Air flow rate:
V ˙ a   d r y 0 = V a   d r y 0 B
where B is the fuel flow rate (kg/h).
To find the dry air mass flow required for the designed MSW mass flow and excess air:
r e q u i r e d   a i r = V a   d r y 0 M S W   m a s s   f l o w ρ a i r   E x c e s s   a i r   r a t i o
where, ⍴air [1.29 kg/m3] at standard conditions was taken. It should be noted that the previous equations are applicable to dry air. These equations can be modified to insert the moisture existing within the air; the stoichiometric volume of wet air is N m 3 o f   a i r k g   o f   f u e l :
V a   m o i s t 0 = 1 + 1.61 X   V a 0
where X is the absolute humidity [kg H2O/kg dry air] of air which depends on its temperature and its relative humidity φ. The usual value considered in the calculations was X = 10 g H2O/kg, and it corresponds to the air parameters: ta = 25 °C and φ = 50% [1]. Note that the factor 1.61 is the quotient of the density of air under normal conditions (1.29 Kg/Nm3) divided by the density of water vapor under normal conditions (0.804 Kg/Nm3).

2.4. Theoretical Flue Gas Volume (Emission Volumes)

For the excess air combustion process which is beyond the stoichiometric, the flue gas volume mainly comprises CO2, SO2, H2O, N2, and O2. The gas volume of the gases can be found as part of the flue gas depending on the elementary analysis of the laboratory results, and following the model can be found in [1].
Volume of carbon dioxide   N m 3 o f   C O 2 k g   o f   f u e l :
V C O 2 = 22.41 12   C 100
The water vapor in the flue gases has two sources; the volume of water vapor from the combustion of hydrogen in the fuel (waste) and the volume of water vapor due to the combustion air humidity, which can be found as follows N m 3 o f   H 2 O k g   o f   f u e l :
V H 2 O = 22.41 100 H 2 + W 18 H y d r o g e n   c o m b u s t i o n + 1.61 λ X   V a 0 a i r   h u m i d i t y
where W is the water content of the fuel and λ is the air ratio (excess air which is in the range between 1.2–1.7 for waste incineration plants) [1,20].
Due to an excess amount of air loaded into the furnace in the excess air combustion process, a new component in the flue gas volume appeared which does not exist in the flue gas volume compared with the stoichiometric conditions:
The volume of free oxygen introduced in excess air that appeared in the flue gas is N m 3 o f   O 2 k g   o f   f u e l
V O 2 = 0.21   λ 1 V a 0
The volume of nitrogen which also has two parts, fuel source and air source, is N m 3 o f   N 2 k g   o f   f u e l
V N 2 = 22.41 28   N 100 + 0.79   λ V a 0
The volume of sulfur dioxide is N m 3 o f   S O 2 k g   o f   f u e l :
V S O 2 = 22.41 32   S 100
The total volume of wet flue gas for combustion with excess air is N m 3 o f   f l u e   g a s k g   o f   f u e l :
V f l u e   g a s = V C O 2 + V S O 2 + V N 2 + V H 2 O + V O 2
Flue gas flow rate (m3/h) is:
V ˙ f l u e   g a s = B   V f l u e   g a s
This model provides the mass flow rate of the flue gas for each kg of fuel. However, this methodology does not consider flue gas generation as a function of its energy content. Furthermore, the calculated fraction of each gas existing in the constitution of the flue gas represents the amount of this gas in each cubic meter emitted from 1 kg of the fuel (MSW). In other words, the calculated CO2 and SO2 volumes are functions of the carbon and sulfur content in the waste composition. In this model, N2 was treated as inert material. It can be said that this model is useful to calculate the mass flow rate of air required to accomplish the combustion process and to calculate the oxygen volume which is essential for the CO2 specification.

2.5. Prediction of the Real CO2 Volume in the Flue Gas

According to [23], there are three methods for predicting and calculating CO2 emissions. As is well known, it is the CO2 emissions that are of concern due to their effect on the climate and atmosphere. Therefore, it is essential to predict the amount of CO2 emitted from a waste incineration plant at the design stage. Such predictions require specific data about the volume of flue gas generated, the gas fractions in the flue gas, the excess air, and the composition of the waste. These days, such data are widely available as waste composition is being thoroughly investigated. For example, there are reports from the Intergovernmental Panel on Climate Change (IPCC) [24] and the EC which specify regulations for waste incineration [13,25]. With more than 500 installations for treating around 25–30% of the EU’s municipal waste as well as other types of waste such as hazardous waste or sewage sludge [26], there are plenty of data accessible directly from the websites or from the environmental ministry of each candidate country. The prediction of CO2 emissions as a function of the oxygen fraction in flue gas constitution was one of the three methods chosen for this research, and the other two can be found in [23]. The selected method depends on the elementary fraction of the composition of the MSW and its energy content (calorific value) in addition to the oxygen fraction, as shown:
F = 227.2 H % + 95.5 C % + 35.6 S % + 8.7 N % 28.7 O % G C V
F c = 2 C   % G C V
C O 2 % = 100   F c   F   20.9   % O 2 % 20.9   %
where, F is the fraction of flue gas flow per unit of energy [m3/MJ]. Fc is the fraction of carbon flow per unit of energy [m3/MJ]. GCV is the higher calorific value [MJ/kg].
The percentage of the volumetric flow of oxygen in the flue gas can be calculated depending on the calculation of the theoretical flue gas volume or based on the data available from real waste incineration plants. Some of the available data shown were adapted from [23].
Regarding the gross calorific value (GCV), this can be found in two ways; either by laboratory analysis using the bomb calorimeter, or by using the available equations model to calculate the value. Both were used here, and it was found that the value was in the range 17,000–24,000 kJ/kg. The equation used to calculate this value is as follows [27]:
G C V = 19.2880 0.2135   V M F C 1.9584   A C V M + 0.0234   F C A C
where, VM is the volatile matter (%), AC is the ash content (%), and FC is the fixed carbon (%). Table 6 shows the CO2 emissions from real incinerators.
Waste normally includes oxygen and different organic compounds such as cellulose (C6H10O5)), which is the main component of paper. In the previous calculations for burning 1 kg of carbon, the required air was all used for the complete combustion of carbon. No excess air was discharged from the interaction, (this amount of air is known as stoichiometric air), and as a result, 11.43 kg of air was required as stoichiometric air for burning 1 kg of carbon. The fraction of air considered as stoichiometric air implies a burning process of 100% efficiency, which means that air is in full contact with the waste surface such that none of it is wasted. In reality, the amount of stoichiometric air is not sufficient to achieve the complete burning process, and therefore, the amount of air must be increased. For burning solid waste, excess air of 100 to 200% stoichiometric air is required [20]. The chemical equation for the cellulose combustion process is shown below (according to [20]):
C 6 H 10 O 5 + 6 O 2 + 6 3.76 N 2 6 CO 2 + 5 H 2 O + 22.56 N 2
As can be seen in Table 7, 5.09 kg of air is required to burn 1 kg of cellulose. This amount is less than the required amount of air for elementary carbon in the previous explanation, and is due to the existence of oxygen in the composition of cellulose. This led to a reduction in the amount of CO2 emissions produced from cellulose. It illustrates the effect of the diversity of the chemical compounds that exist in the MSW on CO2 emissions and how difficult it is to predict the CO2 emissions from waste.

2.6. Nitrogen Oxide (Nox) Emissions and Reduction

Nitrogen oxides (NOxs) are the main cause of acid rain and smog and are formed by a burning process known as oxidation. NOx is formed in two ways, either by oxidation of fuel-bound nitrogen compounds called fuel NOx, or by oxidation of the nitrogen present in the air at high temperatures, known as thermal NOx. Consequently, the NOx produced by combustion remains in the range of 250–450 mg/Nm3 at 11% dry O2 [13,24]. See Table 8 for the new directives regarding NOx emissions, where the average NOx for new and old plants is around 135 mg/Nm3. Normally, NOx emissions are reduced by reaction with ammonia by using the selective non-catalytic reduction (SNCR) DeNOx type. The ammonia comes from an aqueous ammonia solution or from the thermal decomposition of a solid or aqueous urea solution. The following reduction reactions take place in the temperature range of 850–1050 °C [28]:
4NO + 4NH3 + O2 → 4N2 + 6H2O
2NO2 + 4NH3 + O2 → 3N2+ 6H2O
It should be noted that the maximum reduction in NOx emissions is limited to between 60 and 70%. This is because of the NH3 slip at the stack prevention. Ammonia is usually dosed at a maximum molecular ratio (β) of between 1 and 1.25 [28].
Sometimes, the SNCR technique is not adequate to raise the concentration of NOx emissions to the required level of the BAT; therefore, an advance reduction phase is required by adding a selective catalytic reduction (SCR). In the SCR, the DeNOx reactions take place with a high efficiency on the surface of the catalyst, at a lower temperature range of around 350 °C. To increase the required oxygen atoms, vanadium pentoxide (V2O5) is used as a catalyst because it can recover oxygen from the flue gas content. As mentioned, SCR working with a low temperature field can be erected either at the end-tail of the flue gas treatment and filtering unit or in an in-between position (between a filter unit and electrostatic precipitator [ESP]) (as shown in Figure 3).
For the SCR tail-end arrangement, there are two possible options; hot, 220–260 °C, or cold, 190 °C. These two options provide some flexibility for working in different temperature profiles of the flue gas treatment stream. The working environment for this technology depends on different factors which must be considered. The hot tail-end scenario depends on the SO3 concentration, and when the temperature of the flue gas drops, it needs to be reheated by using a gas burner or steam heat exchanger. In such cases, operational costs increase. For the cold tail-end scenario, sodium bisulfate or a high specific surface (HSS) is required to eliminate bisulfate and sulfate ammonium salt deposits. The in-between option requires a reheating process and risks the formation of dioxin in the ESP due to its high operating temperature. These SCRs are disadvantaged by their high capital costs, due to the cost of the catalyst and the volume and complexity of the implementation. It is for these reasons that in this study, the SNCR concept was adapted.

2.7. Post-Combustion Flue Gas Cleaning Technology

Dry sorbent injection is an approved technology that can be applied to the controlling system. A reactive sorbent is injected into the upper part of the furnace (high temperature) or in the duct downstream from the boiler (low temperature) to react directly with the products of combustion. This technology has economic advantages including lower equipment costs (first cost) as well as decreases in the ongoing operation and maintenance costs. It also has a lower life-cycle cost than other technologies. Many gas pollutants can be removed depending on the sorbent use. Commonly used sorbents in dry sorbent injection systems include [29]:
  • Calcium hydroxide to mitigate HCl, HF, SO2, SO3, and Se.
  • Sodium bicarbonate to capture HCl, SO2, and SO3, and to some extent, HF.
  • Powdered activated carbon to adsorb heavy metals and organics compounds.
Reaction products are gathered in a downstream particulate control device together with the fly ashes and unreacted sorbent, which can be used as feedstock to cement plants or for stabilization of earthen structures, and can achieve 90% removal efficiency [29].
The development of emission restrictions for acidic gases from 2010 until the updated regulations in 2018 is shown in Table 9. The regulations have become more restrictive with requirements for increased concentrations of cleaning and reducing pollutants.
The selected sorbent to reduce acidic gases can be directly injected in the boiler at a temperature range of between 850–1000 °C. Many operating plants (in operation mode) have been developed to adapt and meet the requirements of the new regulations for acidic gases by using the method of directly injecting sorbent using silo, a screw for injection needs, and a dosing control system, after scaling-up the concentration of gases at the stack effluent for a precise dosing process.

2.8. CO2 Emissions and Capturing

A comprehensive economy requires an enormous amount of energy, which is primarily produced by the combustion of fossil fuels. Many different chemical compounds are released accompanied by the synthesis gas produced from the combustion of fuel, the most concerning of which is CO2. Carbon dioxide emissions are considered a significant negative side effect of this activity. The cumulative emission of CO2 contributes to climate change and is considered to be the greatest single contributor to the greenhouse effect [6]. Waste incineration plants are definitely emitting CO2. Ebsilon’s intensive numerical model measures the emissions generated according to the designed MSW flow rate capacity of plants. It is worth mentioning here that the average concentration of CO2 in the Earth’s atmosphere in 2018 was 407 ppm, which is about 40% higher than in the preindustrial age [30]. Therefore, worldwide efforts to reduce CO2 emissions are important for both the global economy and the environment. In the past decades, many technologies and methodologies appear to have helped to achieve this goal. A summarized definition of three technologies with the highest maturity levels is shown in Appendix A.
However, in this study, it was assumed that carbon particles were already activated and injected in the stream flow of the flue gas of the simulated plant. It must be remembered that the temperature of the flue gas has to be decreased as much as possible before it enters the separation process of the CO2 unit. It was noticed from the available data in [30] that the adsorption efficiency of CO2 emissions increased by decreasing the temperature. The adsorption process decreased by 25–30% for each gram of activated carbon when the temperature of the reaction increased from 0 °C to 25 °C at constant pressure.
MSW landfilling is also a major source of methane emissions in the form of landfill gas. Methane is 25 times more potent of a greenhouse gas than CO2. WtE plants avoid the formation of landfill gas by incinerating the organic methane-producing compounds in MSW and can, therefore, improve net emissions savings.
According to the inserted data in Ebsilon regarding the MSW composition and combustion chamber properties, the flue gas volumetric flow was around 760 m3/s, and the CO2 emissions was around 117,715 ppm, equivalent to 0.2 kg/m3, which means that there was approximately 152 kg/s for the mass flow of CO2. It could be concluded that each kg of incinerated MSW generates 30 m3 of flue gas and that this volumetric flow holds around 6 kg of CO2. This amount is directly related to the combustion chamber zone.

3. Results

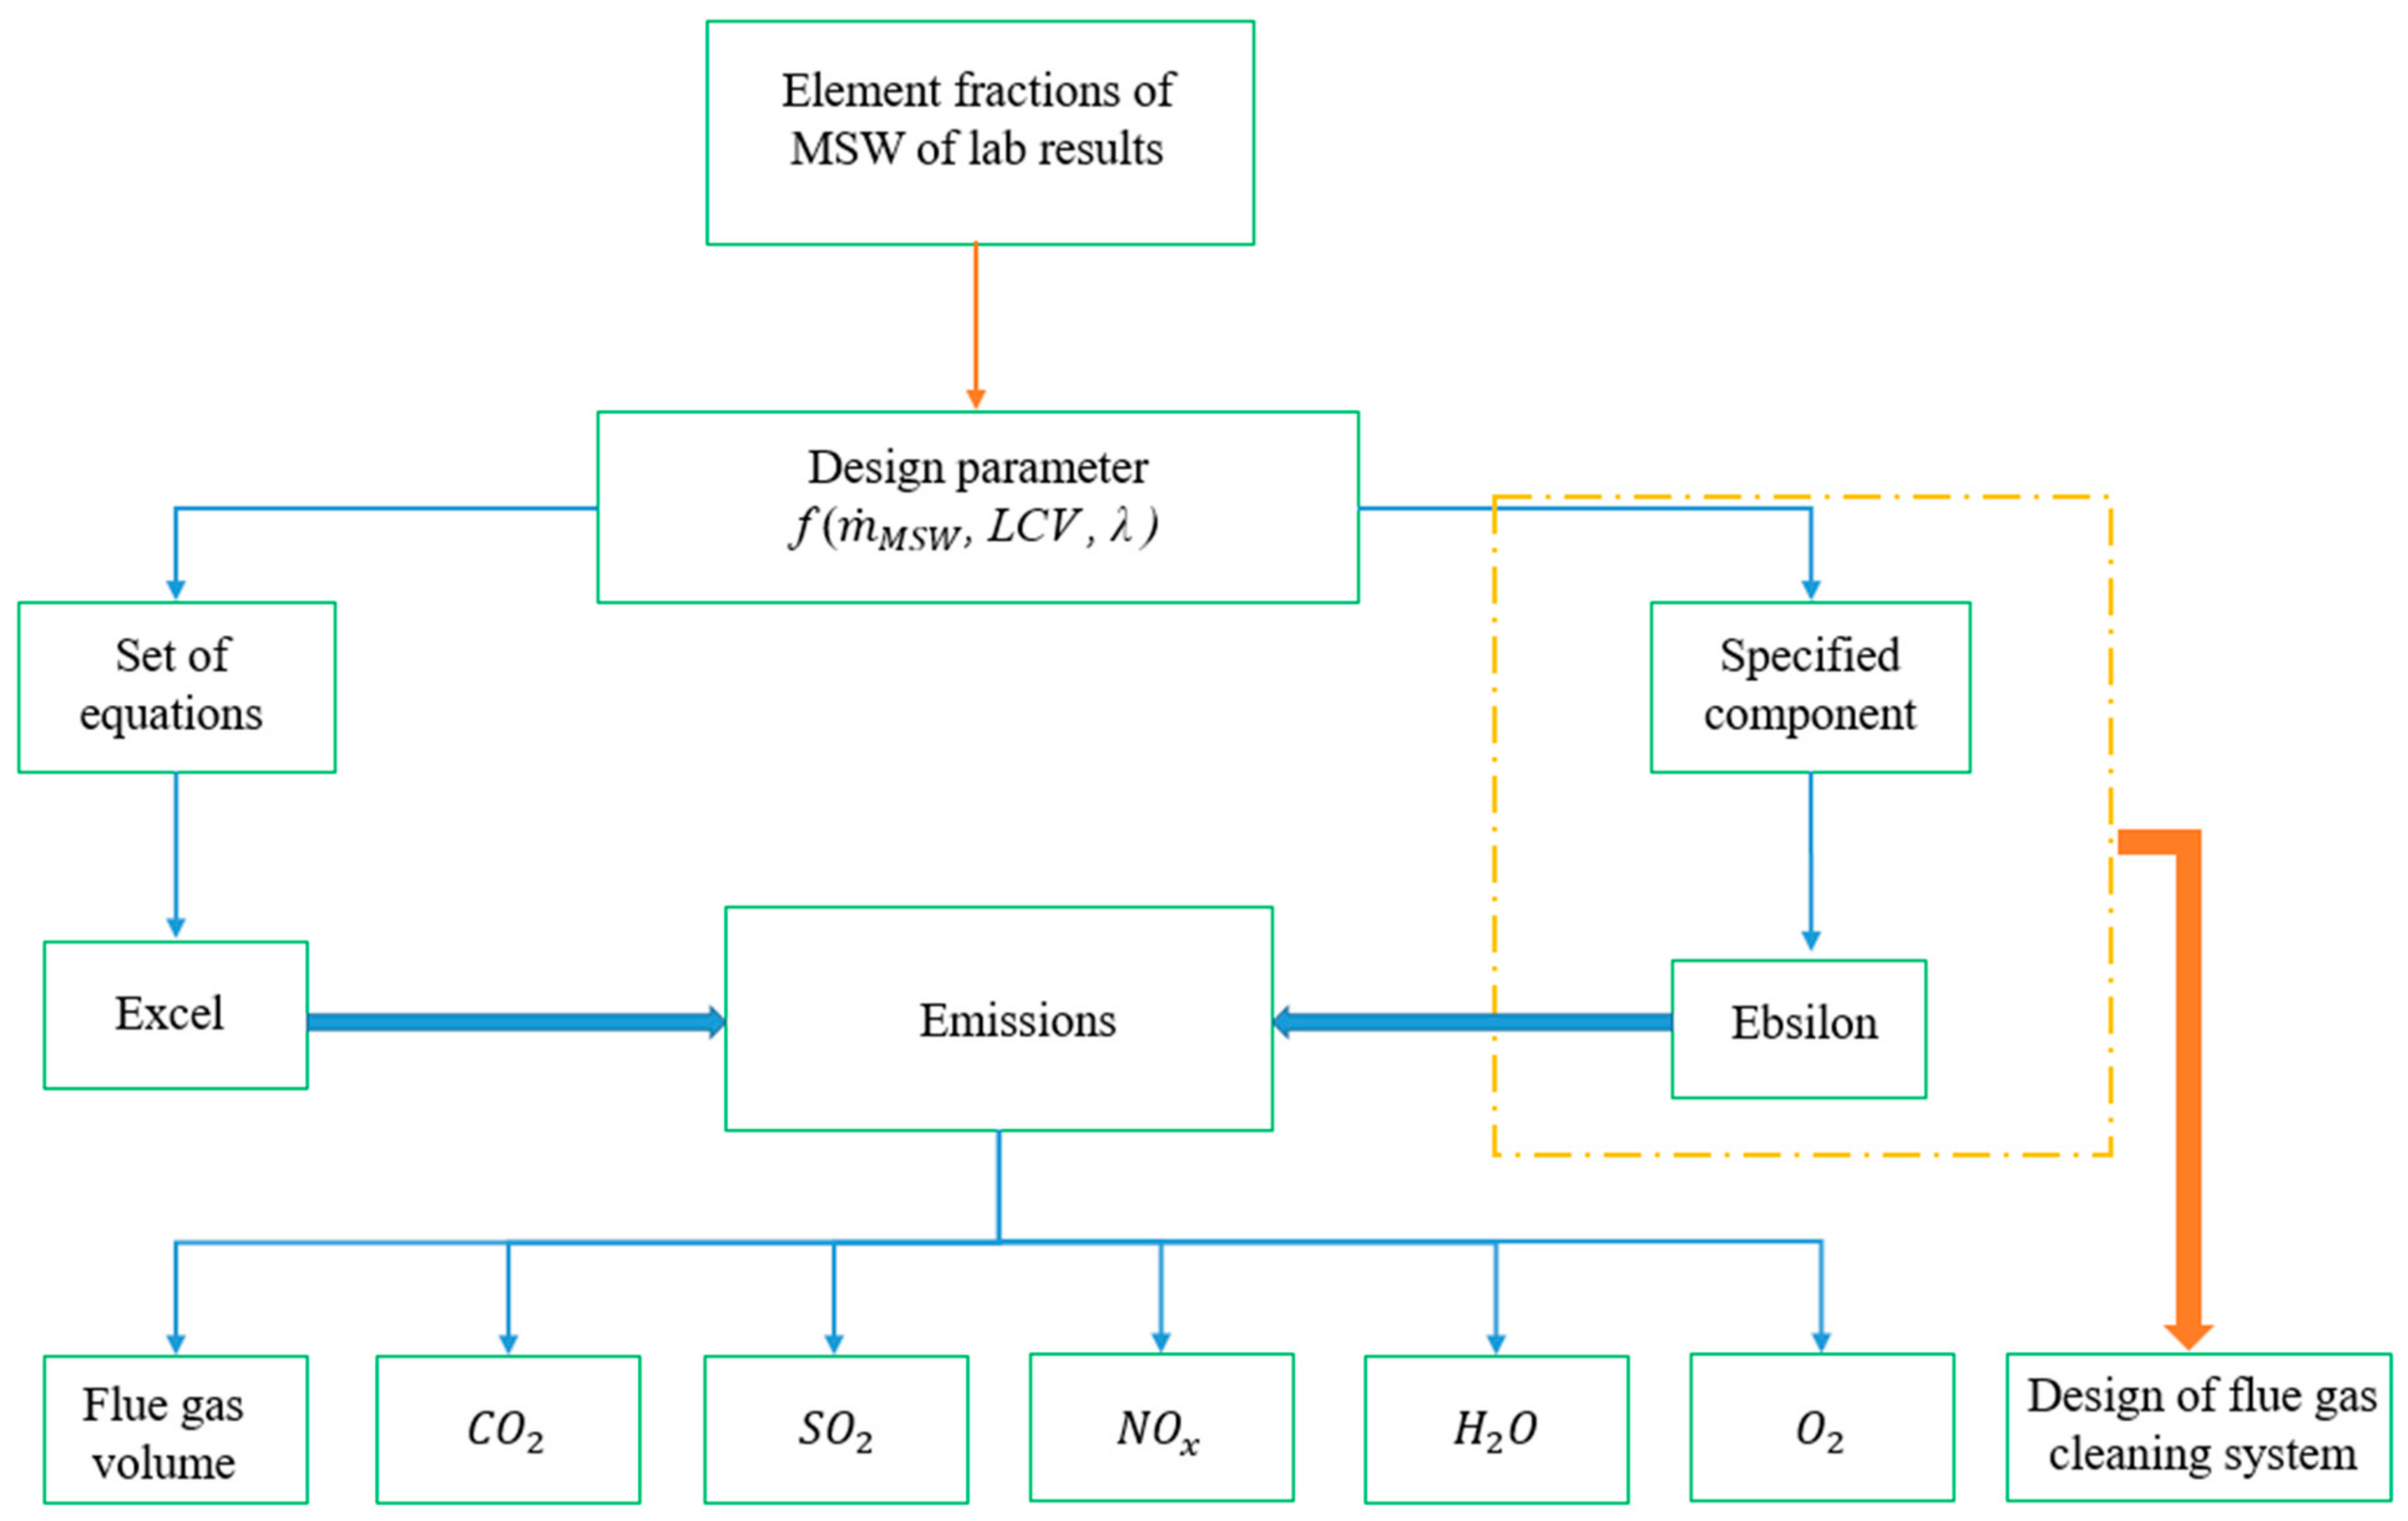
3.1. Model Calculations

A set of the model equations was used to find the volumetric flow rate of the flue gas, the excess air needed, and the gas fractions forming the flue gas itself. The results from this model were compared with the results achieved by Ebsilon as a first step in the design of the proposed flue gas cleaning system. The reason for using this equation model and inserting the governing parameters of the suggested waste incineration plant was to validate Ebsilon’s results and to build a comprehensive emission calculation model that can be used easily and for free. However, careful consideration must be given to specifying the constitution of the elements of the waste and the capacity of the incineration facility. The findings showed that the results from the equations model were close to Ebsilon’s. Furthermore, Equations (2) and (4) perfectly matched the mass flowrate of air in Ebsilon’s and could be considered for the calculation of air mass flow required for the incineration of MSW. The CO2 specification methodology also matched Ebsilon’s results, where the percentage of CO2 was calculated as a function of O2. These matches were validated for different values of excess air ratios and different MSW mass flows. In all cases, the results from the calculated air mass flow, oxygen volume, and CO2 percentage matched Ebsilon’s results.
Note: O2 volume must still be divided by the calculated flue gas volumetric flowrate to get the percentage of O
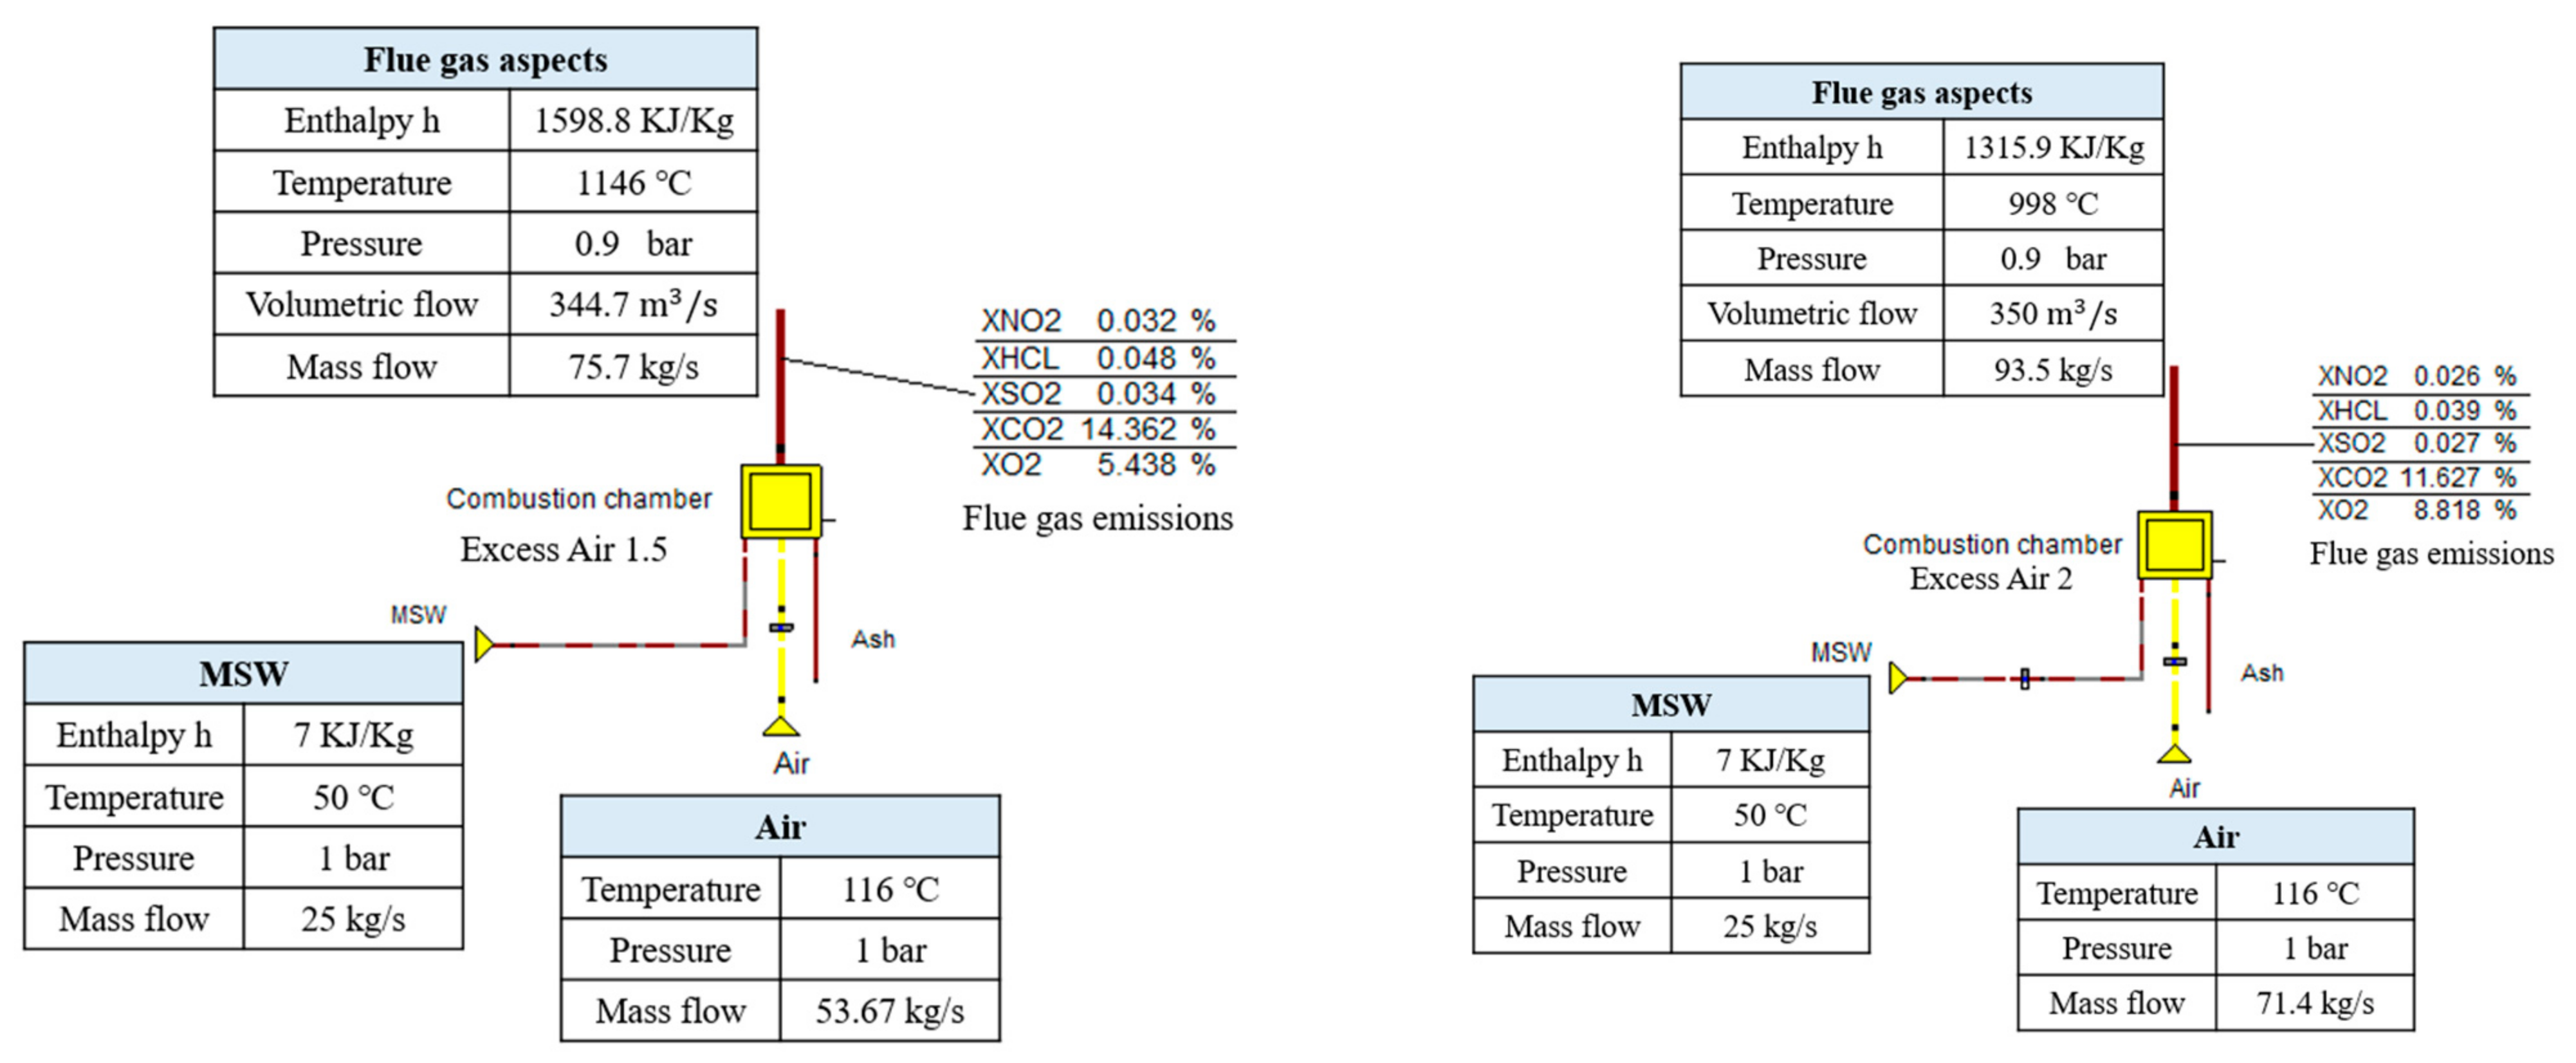
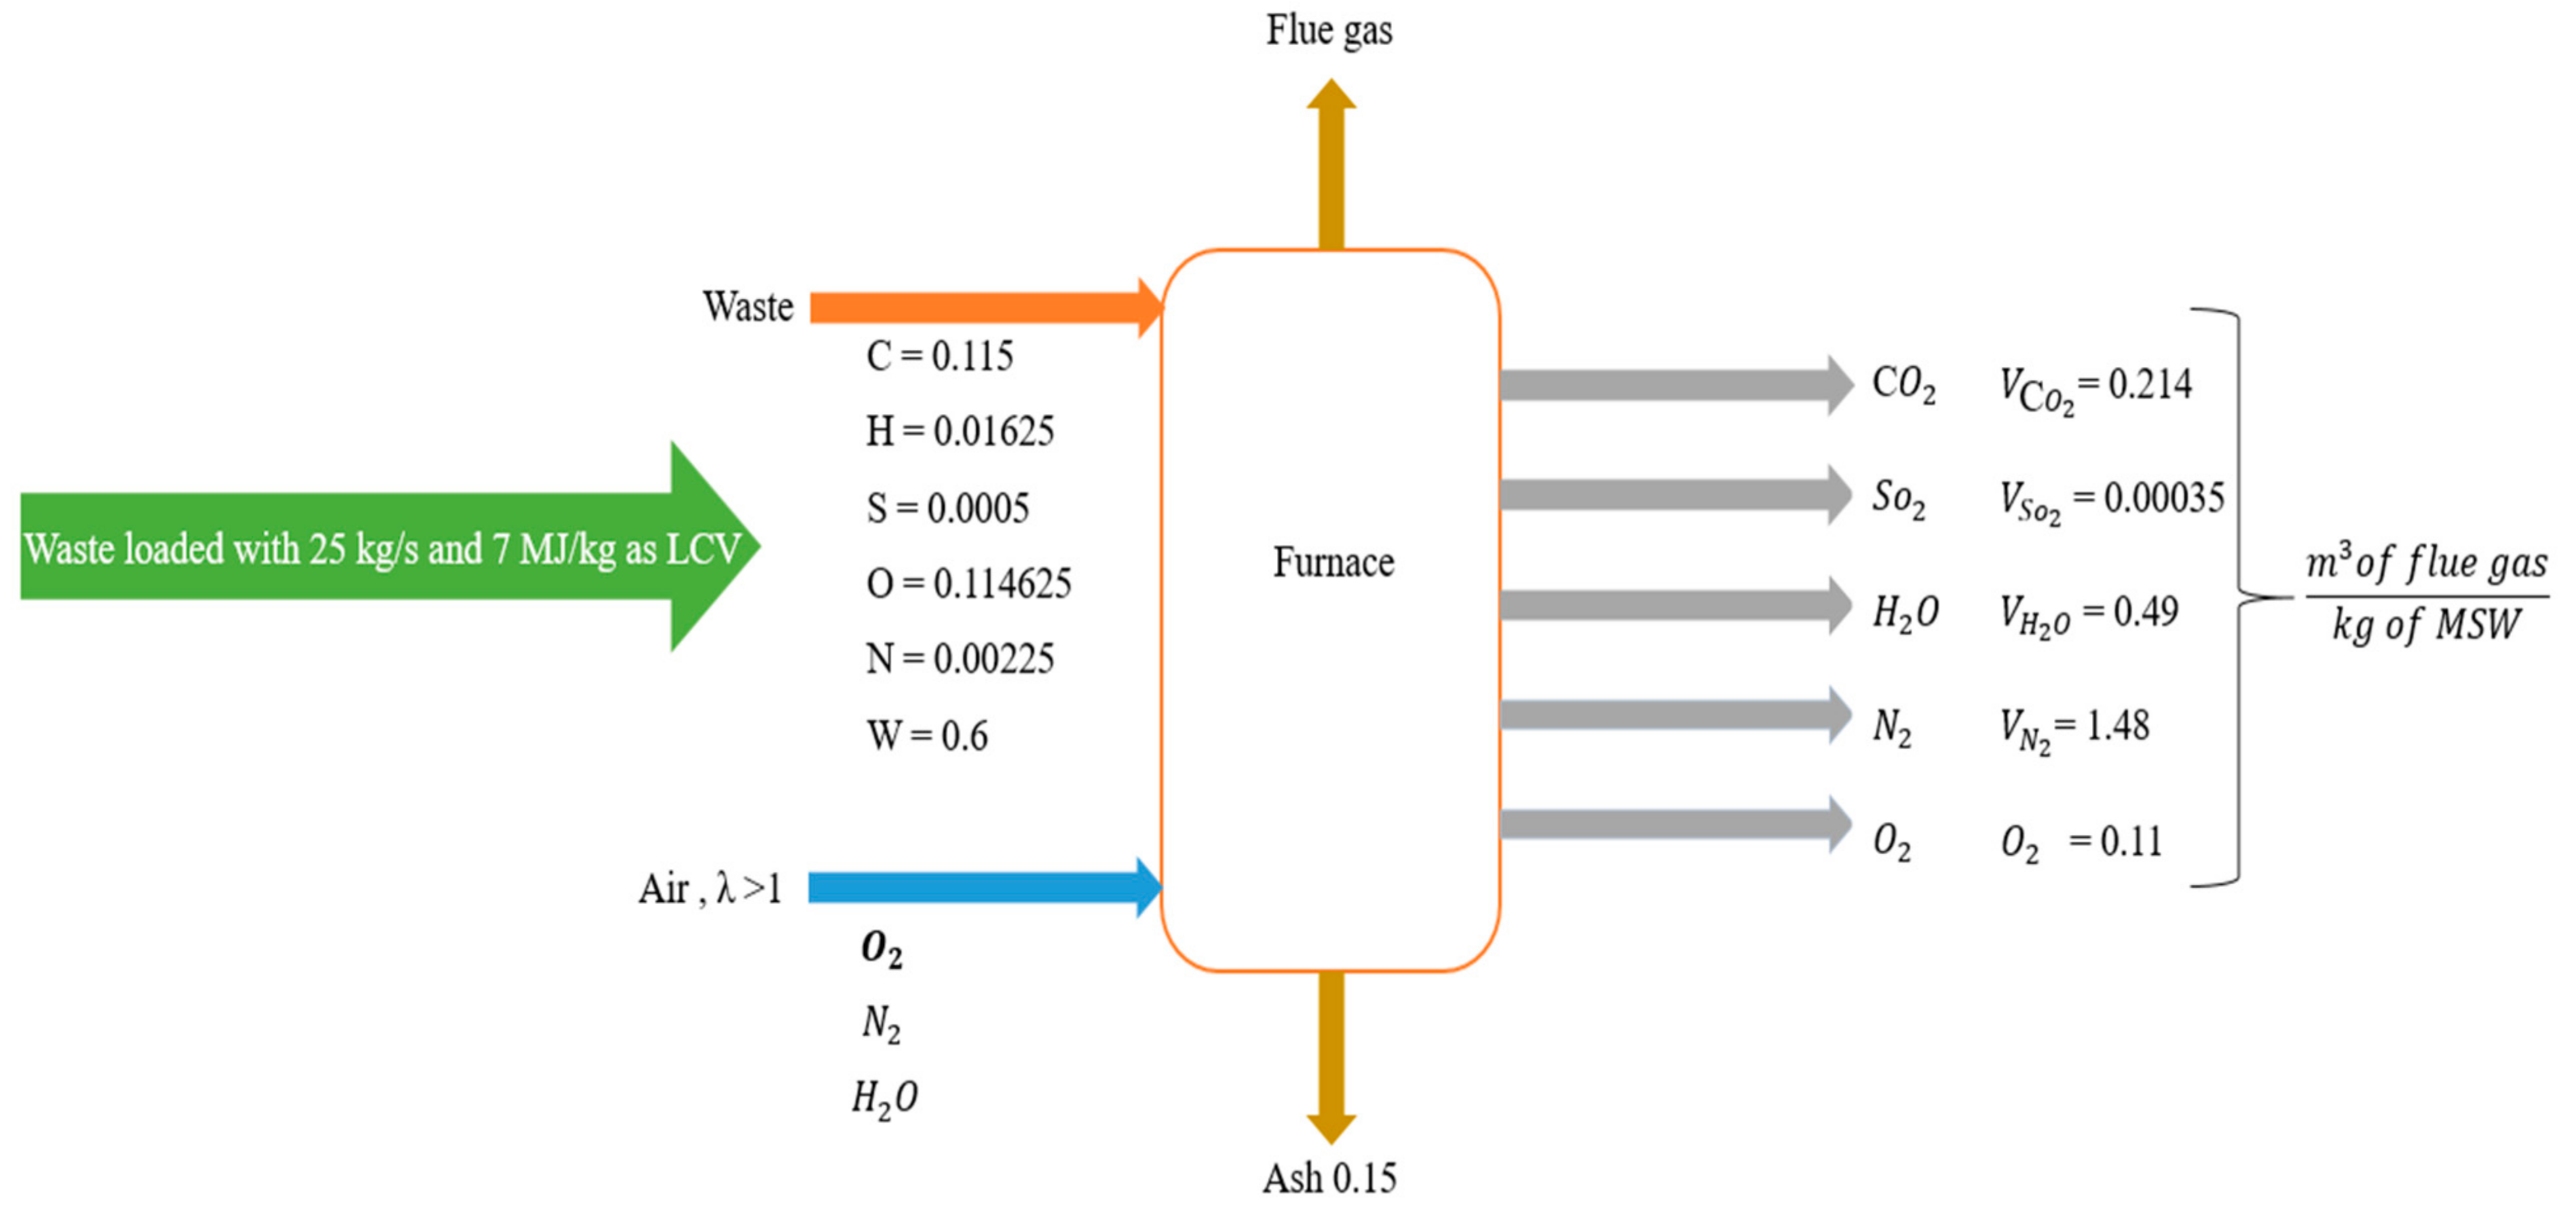
2. According to the calculation model, the theoretical flue gas volumetric flow rate was 2.55 m3/kg for 25 kg/s with MSW mass flow and an excess air ratio of 1.5. Thus, the percentage of O
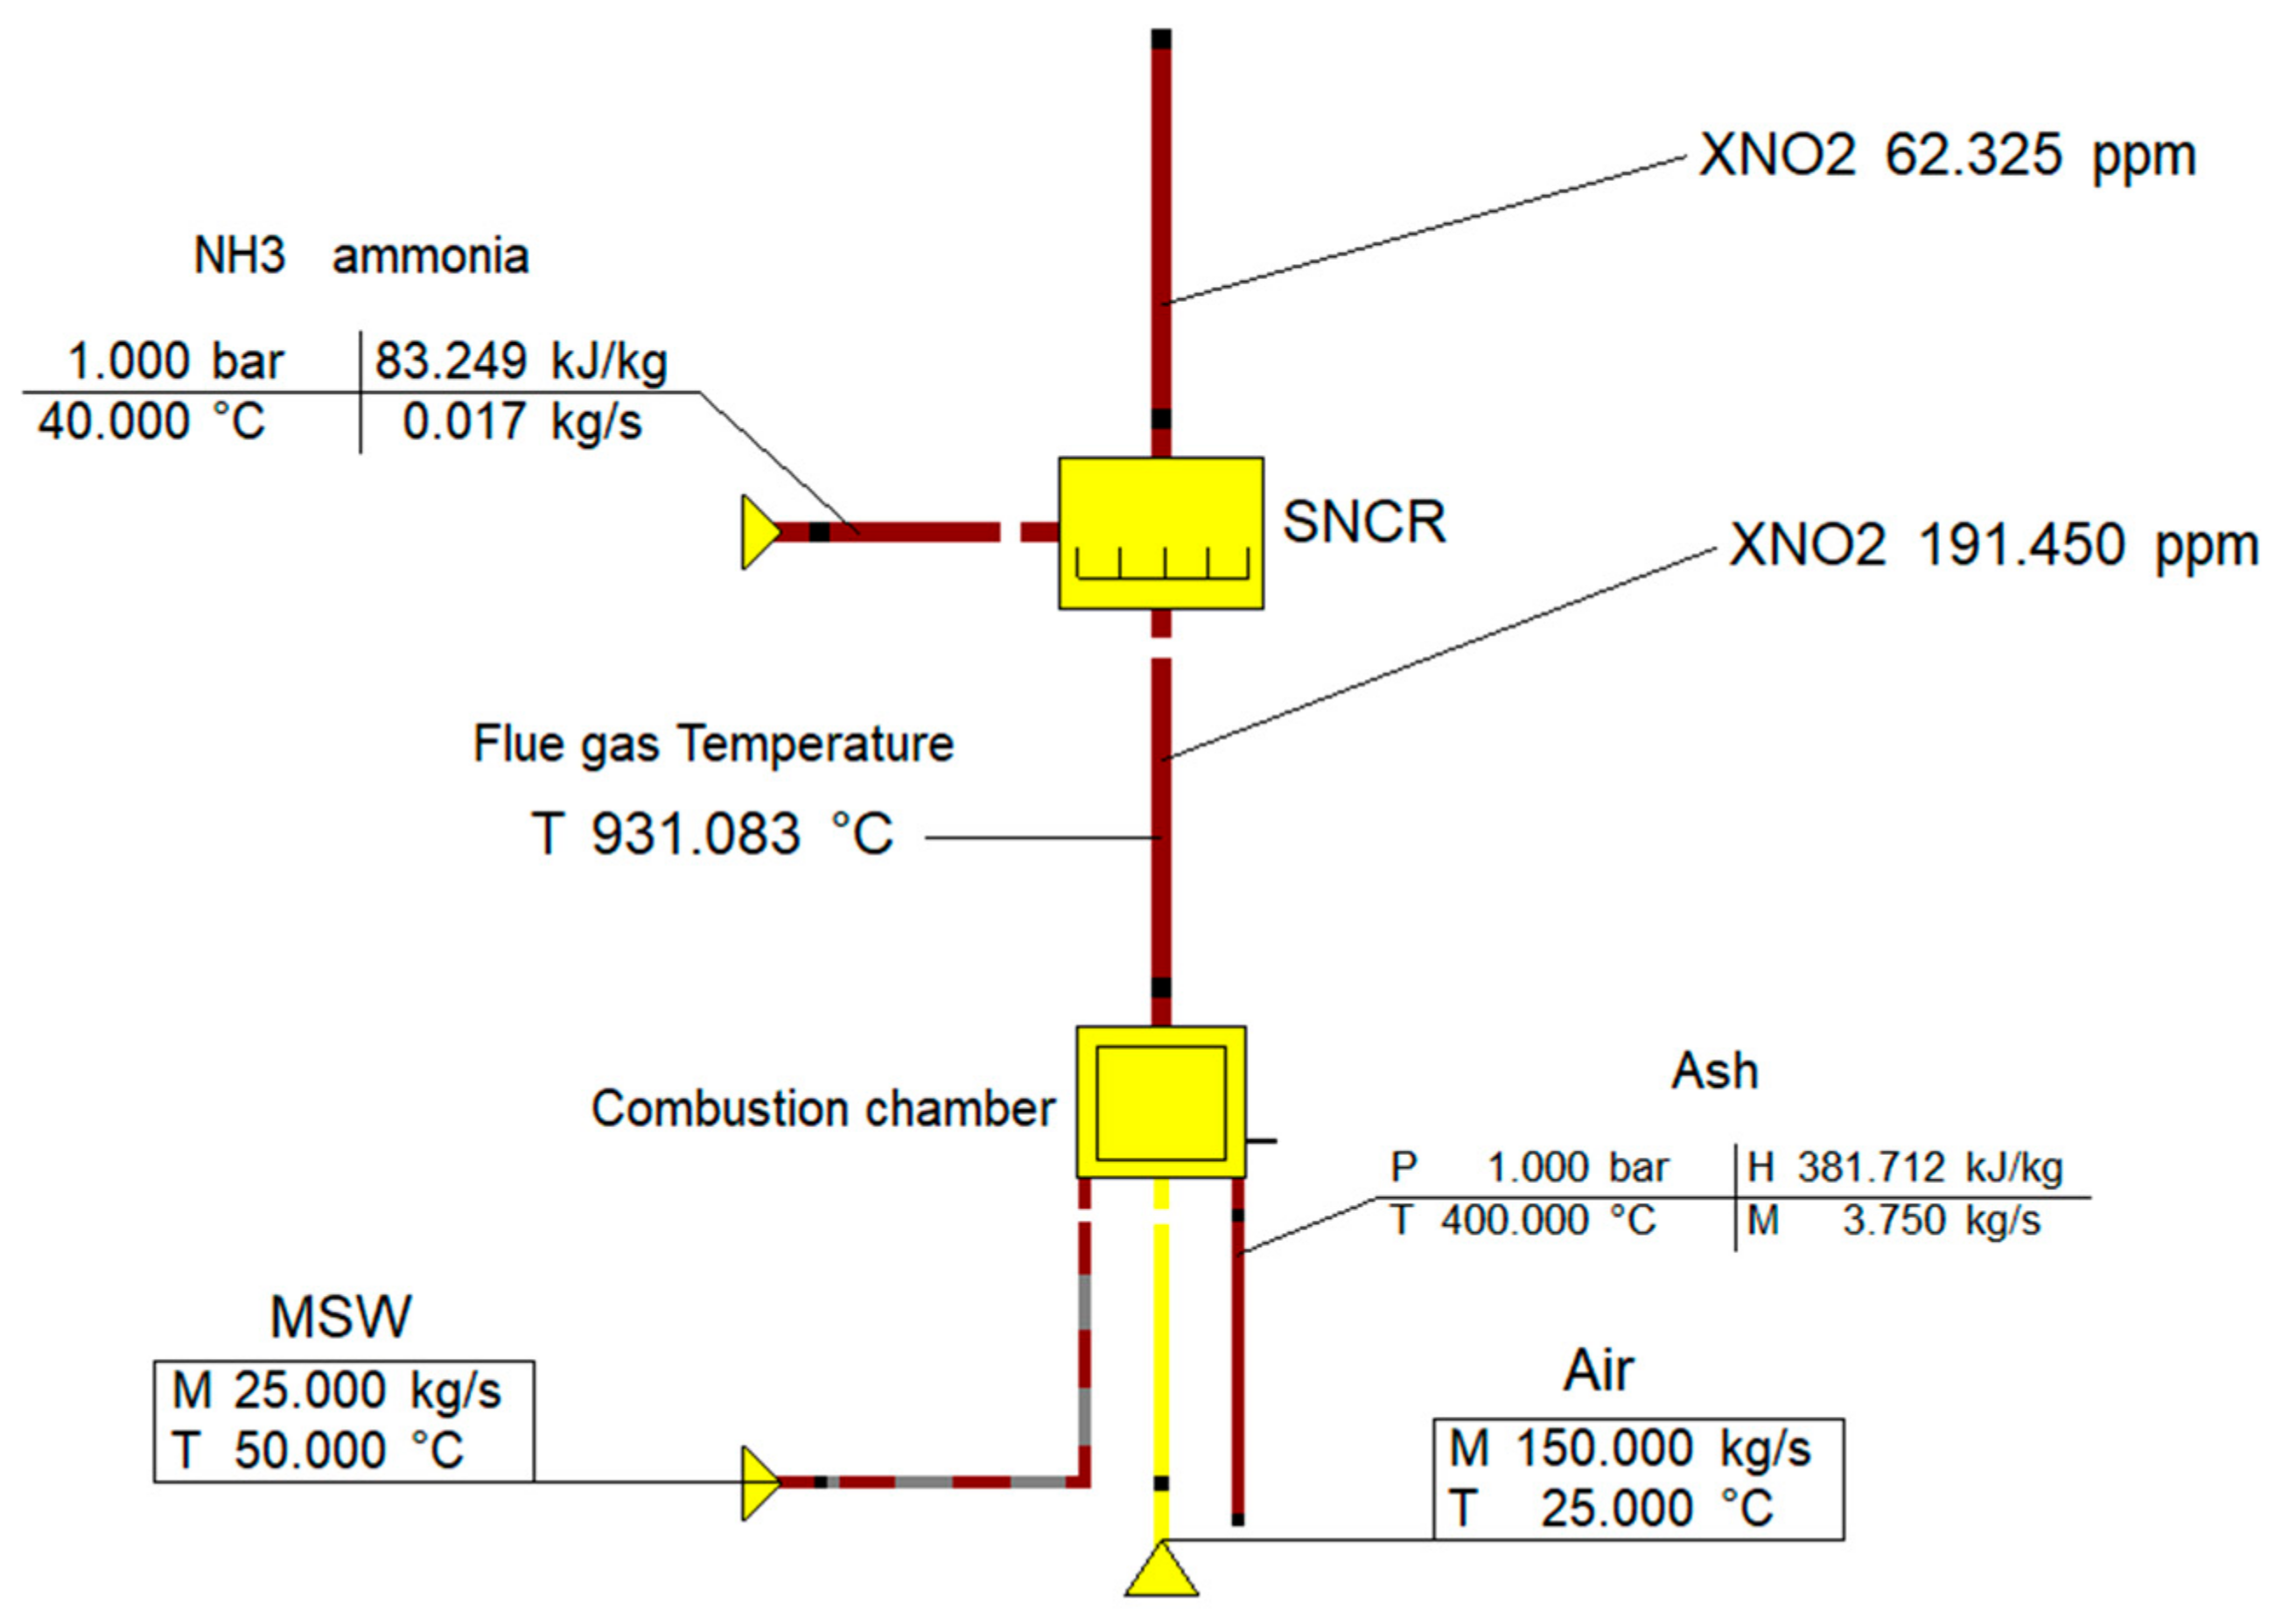
2 in the flue gas volume was around 5%. The source of water vapor in the flue gas was attributed to the presence of water content in the MSW, meaning that dry air was considered (see Figure 4). To validate this calculation model with the results from Ebsilon, the governing parameters of the emission fractions (mass flow of MSW and excess air ratio) were checked for each step change as seen in Table 10. As can be seen from the model calculations, the CO2 volume had the major fraction of the flue gas volume constitution at around 21%, which makes sense since carbon formed around 11% of the combustible fraction of the analyzed sample of MSW taken in Jordan. At the same time, the SO2 volume and N2 had the lowest contribution in the flue gas volume with 0.00035 and 1.48%, respectively.
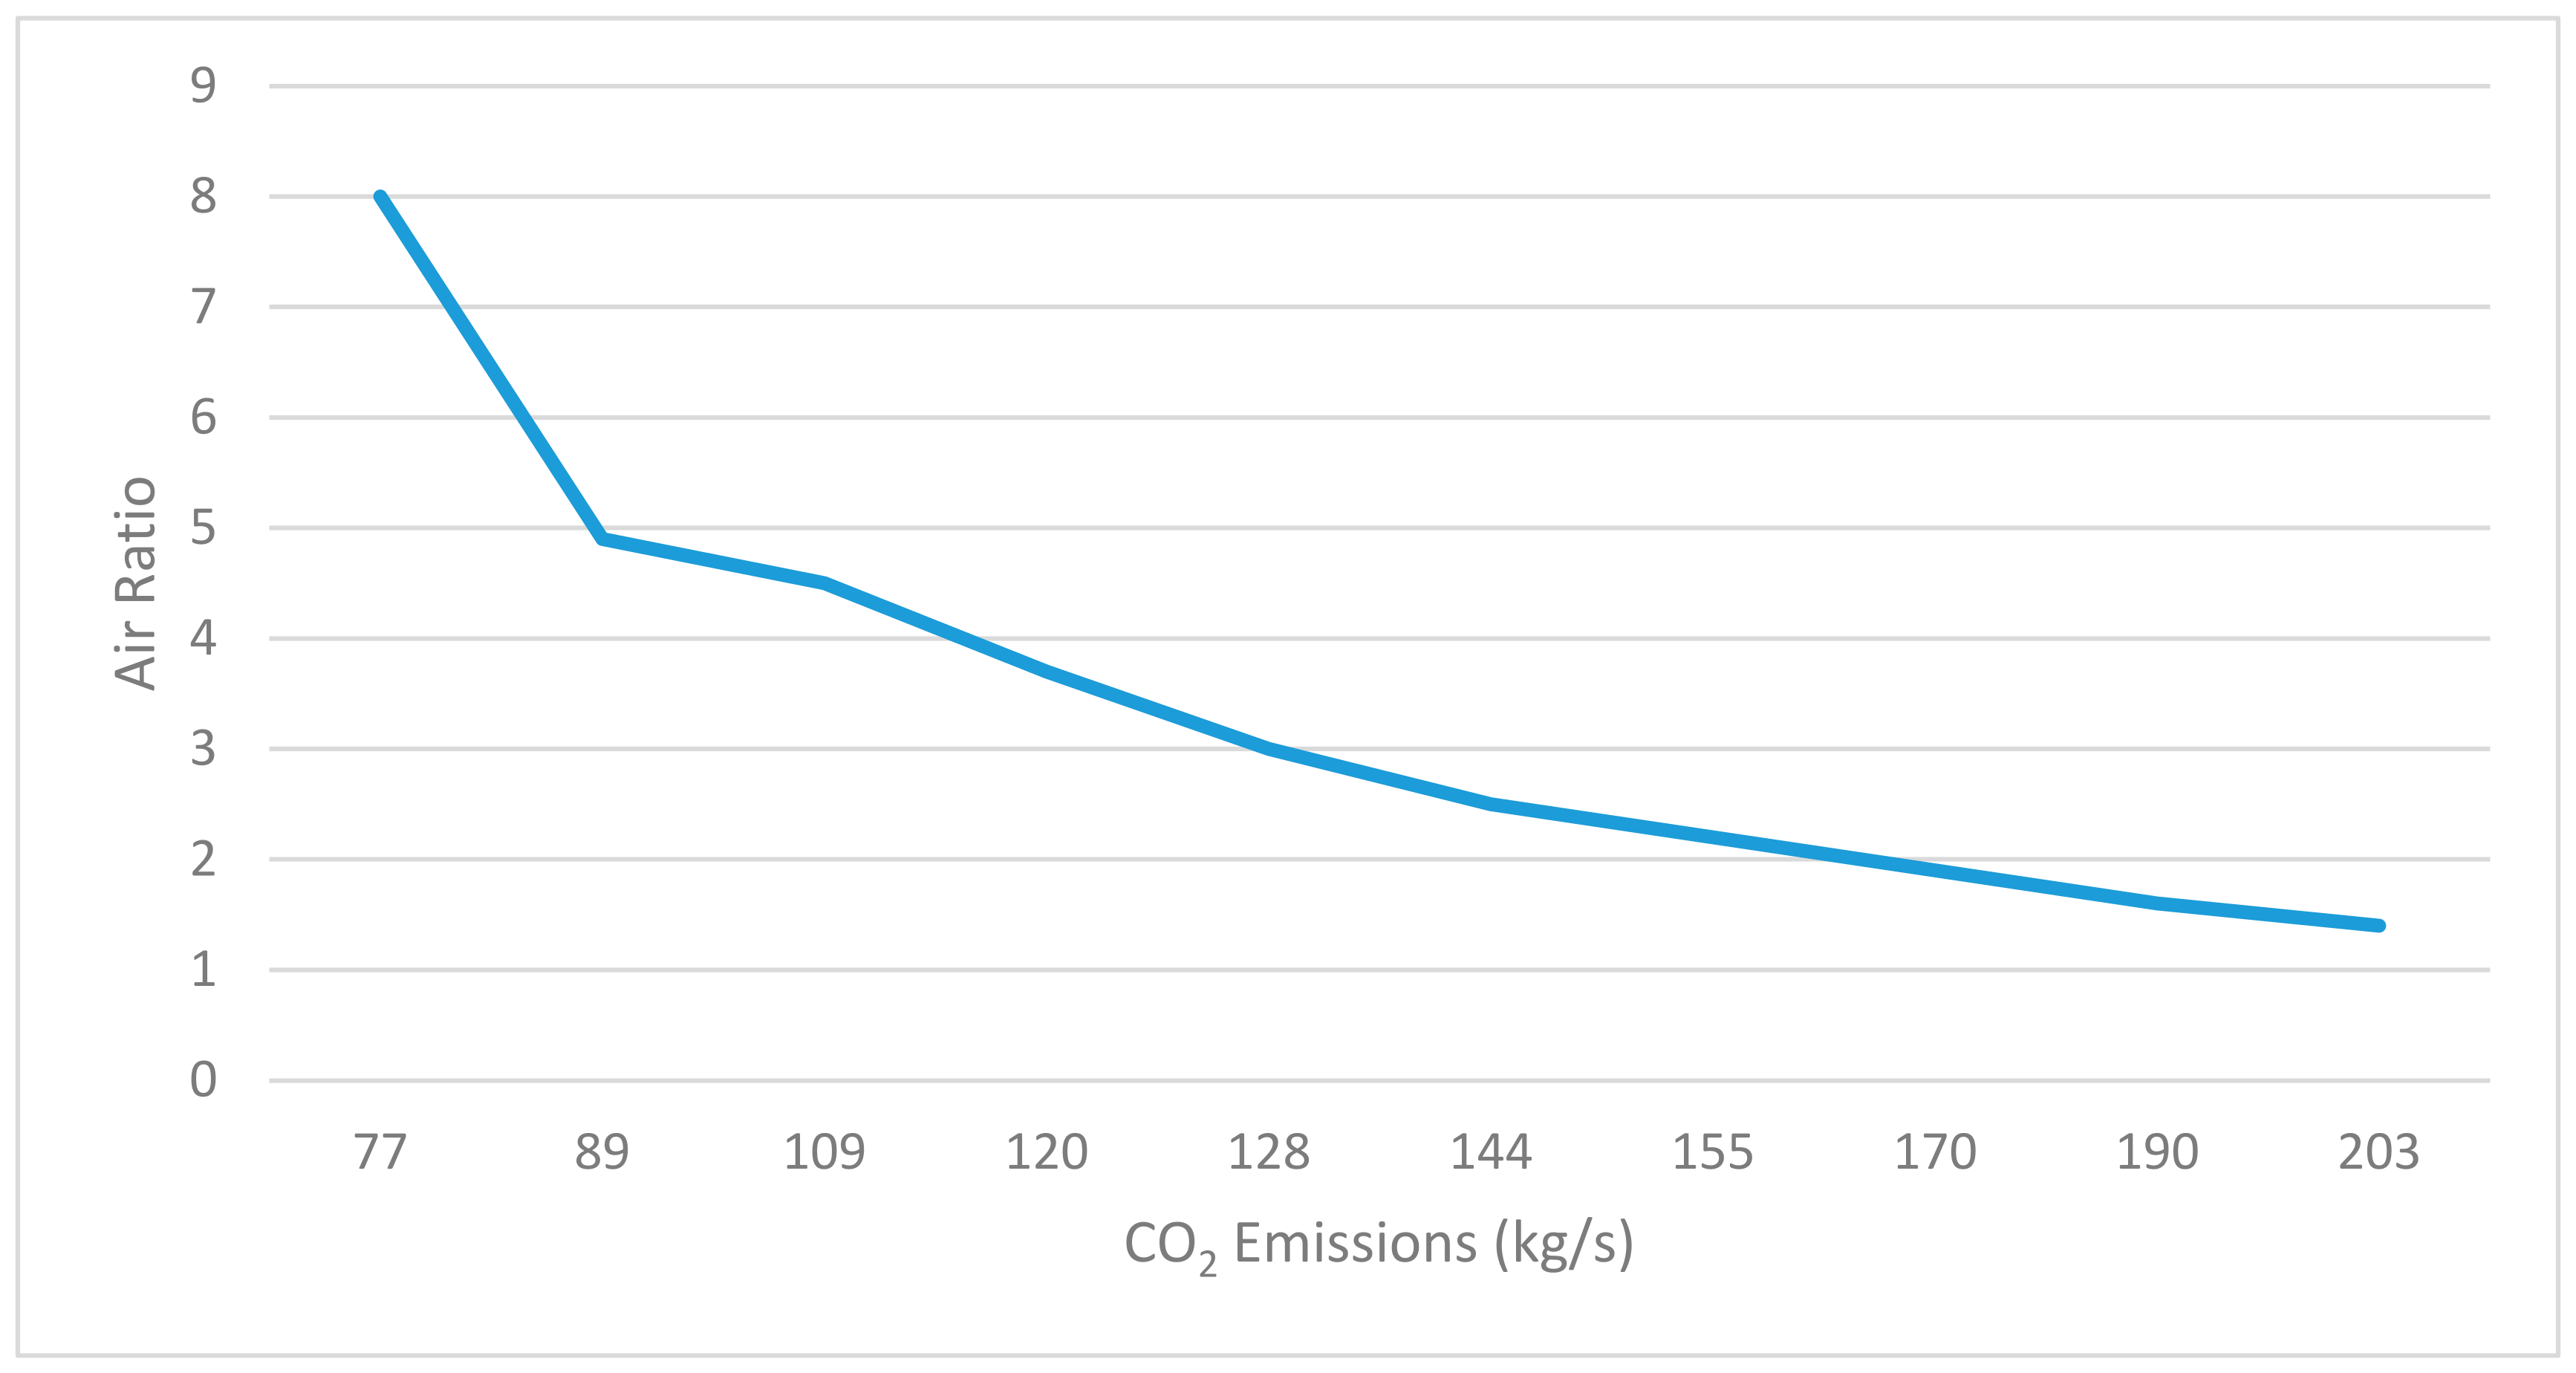
The findings from both methodologies (model equations and Ebsilon) showed approximately the same results for O2, CO2, volumes in flue gas, and air mass flow as required in the furnace. Any deviations in the results were small. The volume portions of O2 and CO2 were not affected by the change in the mass flow of the MSW, but did change with the excess air ratio. The volume of CO2 decreased when the excess air ratio increased, and as previously mentioned, this is what should happen. The mass flow rate of air required to achieve the combustion process in the furnace was affected by both the excess air ratio and the MSW mass flow. The air mass flow rate was proportional to the excess air ratio and the MSW mass flow. This makes sense, as increasing the mass flow of MSW requires more excess air to match the increment in the MSW loaded into the furnace which requires an increase in the amount of air pumped into the furnace (air mass flow) and vice versa. The results from the model equations can be considered and adapted for the pre-design steps of any waste incineration plant to be erected when the MSW composition (elementary analysis), LCV, and plant capacity are specified.

3.2. Flue Gas Density Effect (Checked by Ebsilon)

The effect of flue gas density is important for the specification of the amount of CO2 emissions. It is well-known that the density of flue gas decreases with increases in its temperature, which leads to an increase in CO2 emissions (see Figure 5). This has a direct effect on the air ratio (excess air/stoichiometric air) in the combustion chamber (furnace), where the emissions decrease when the air ratio is increased. It can be said for any waste incineration process that working at 800 °C is better than working at 1000 °C in terms of emissions, specifically CO2 emissions; on the other hand, it is preferable to work with higher temperatures in terms of energy.
The results showed that when the temperature of the flue gas was around 70 °C, its density was 1.3 kg/m3, while the CO2 emissions were at a minimum value of 77 kg/s. On the other hand, when the flue gas temperature reached 1200 °C, the density was 0.24 kg/m3 and the CO2 emission was at 203 kg/s.
Figure 6 is a theoretical illustration of how when the air ratio was increased to 8, the CO2 emissions reached their lowest value of 77 kg/s, and the highest of 203 kg/s was reached when the air ratio was around 1.2. The optimum air ratio for the operation of a real waste incineration plant is 2–2.5 to keep the flue gas temperature at around 900 °C in the furnace, which is the ideal temperature value required to meet regulations.
A waste incineration plant in Klemetsrud (Oslo, Norway) was used as the bench mark when analyzing the results. This plant works with three lines of grate firing technology; two emit different compositions of flue gas to the third. The mixture entering the treatment facility consisted of 23% of flue glass for two lines and 54% for the third line [31].

3.3. NOx Emission Reduction Using SNCR Technology (Simulated in Ebsilon)

The available elementary analysis from the waste sample data taken in Jordan was inserted in Ebsilon to simulate the NOx emissions (and other emissions such as CO2, Sox, etc. (each is explained in its related part)). All the inserted parameters are shown in Figure 7 and Table 11.
The concentration of NOx was around 360 mg/Nm3. The results of the simulation showed that it is possible to meet BAT requirements with SNCR technology where the NO2 concentration was reduced to 62 ppm (which is equal to 116 mg/Nm3 and is a little bit less than the target BAT value). This depended on the mass flow of injected ammonia NH3 in the flue gas treatment stream, where 116 mg/Nm3 was reached by injecting 0.02 kg/s of ammonia into the flue gas, and where approximately 0.8 kg/Ton of MSW was required.

3.4. Adopted Flue Gas Cleaning System for the Proposed Plant

Two main categories are available for flue gas cleaning; either dry or wet [27]. The main issue which must be considered if using the wet cleaning facility is water usage. For example, if NaOH suspension is applied, the scrubber system must have an additional water treatment plant in which the sulfate ions of the Na2SO4 solution are precipitated as gypsum. As the MENA region is one of the most water-scarce areas in the world [32,33], the dry cleaning system would be much better than the wet system despite the corresponding increase in operational costs because of the increased consumption of chemicals.
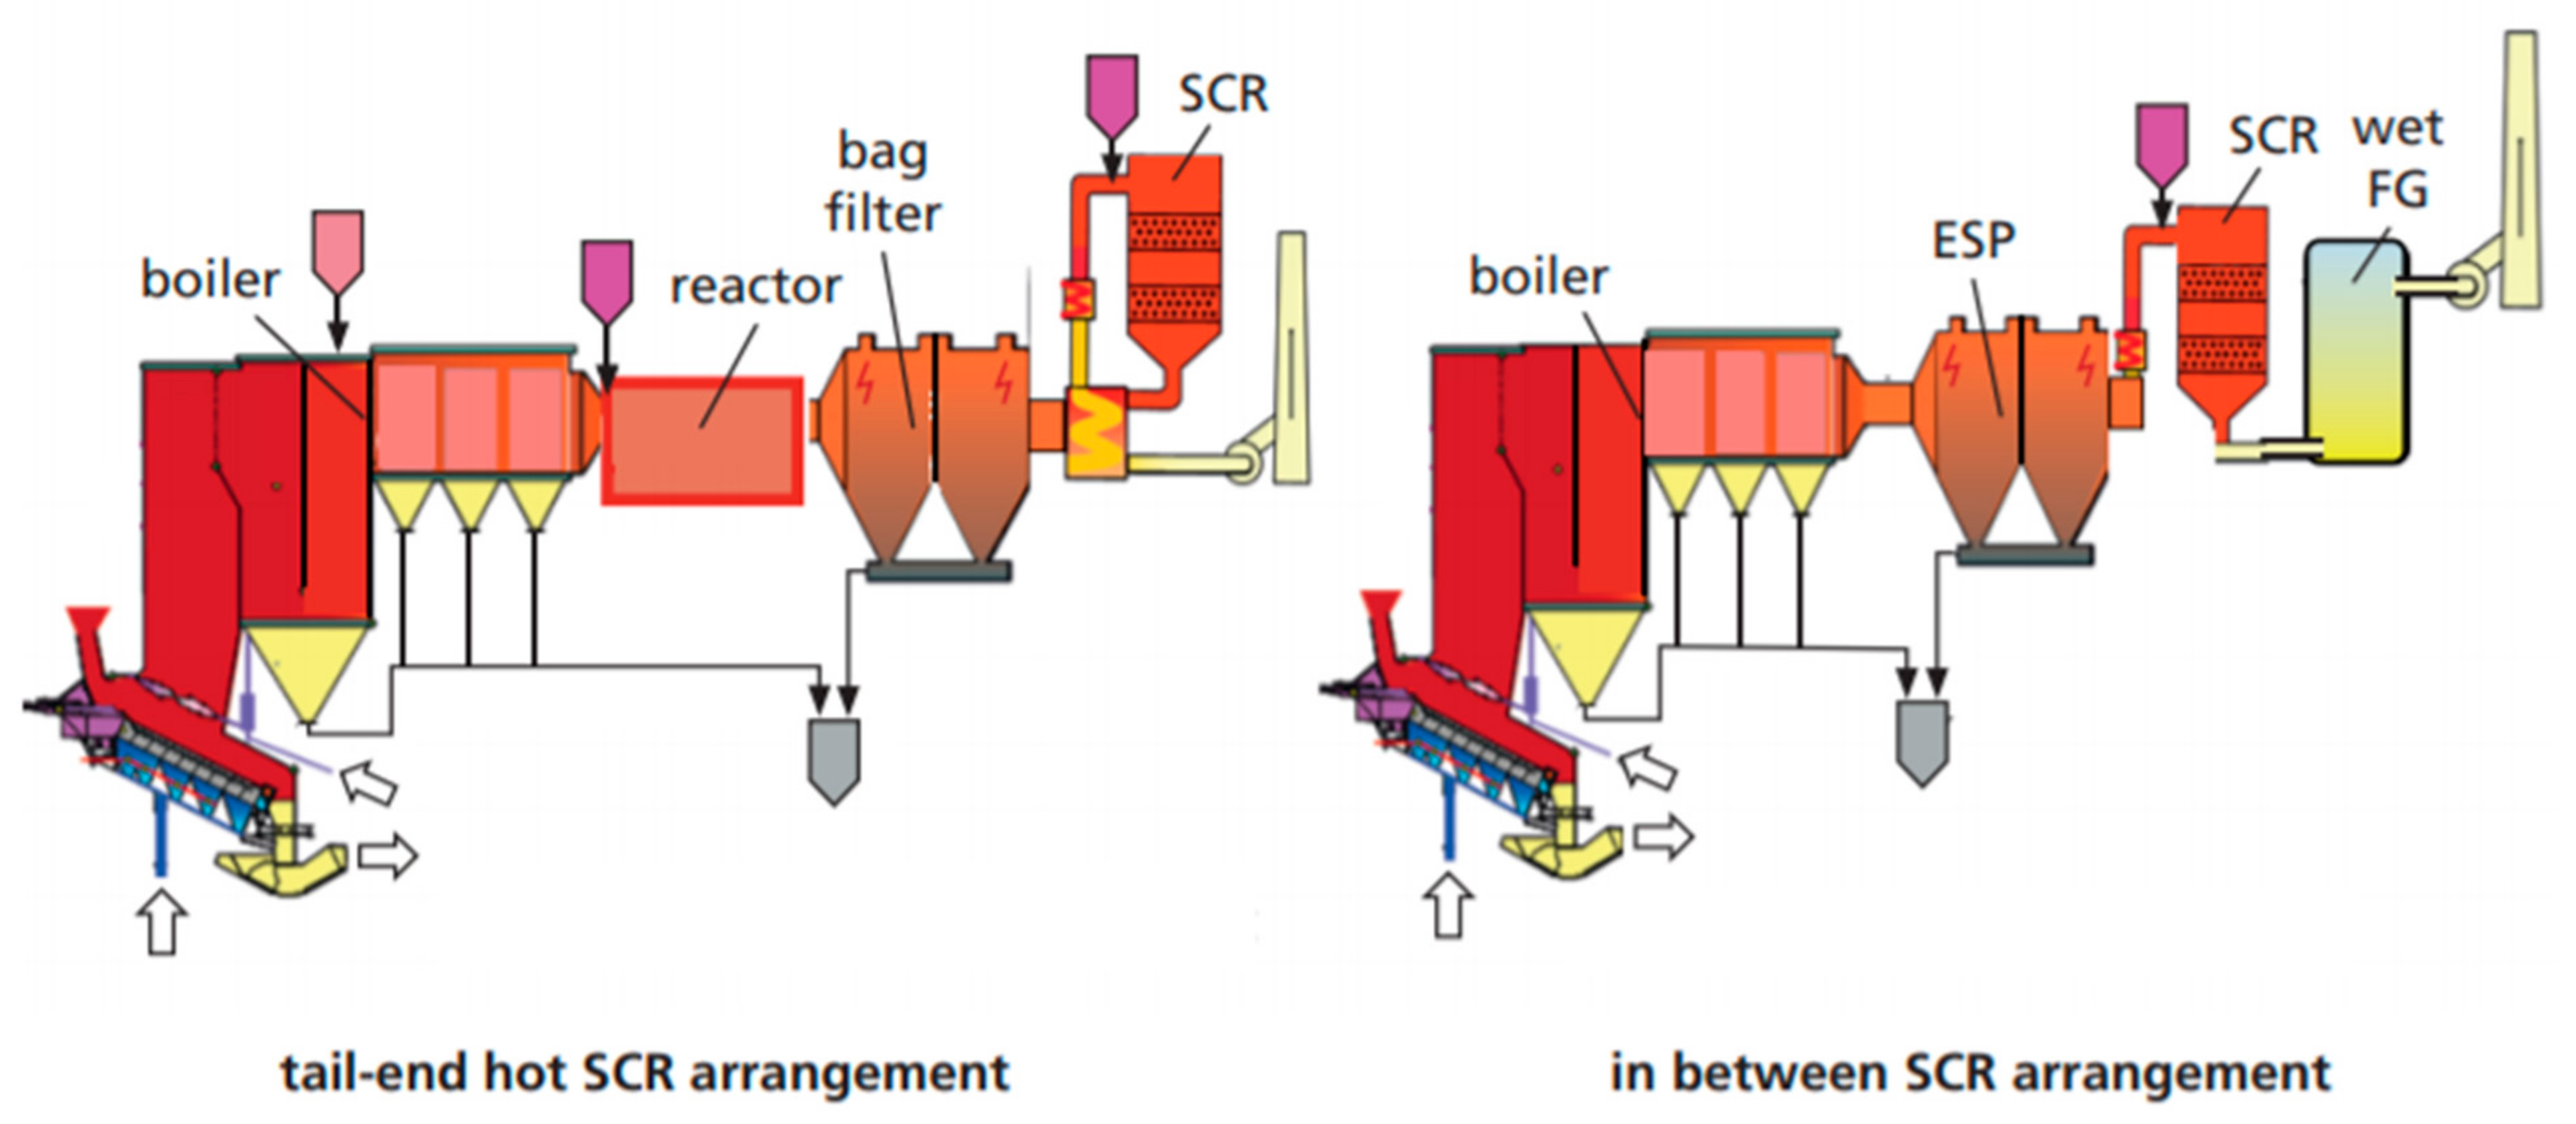
Dry and semi-dry flue gas cleaning systems are similar. In both systems, the acid gases react with hydrated lime (Ca(OH)2). In this process, the gases are converted to solid substances such as calcium chloride, calcium sulfite, and calcium fluoride. The reaction products are precipitated in a subsequent bag house filter. The difference between the two systems is that in dry flue gas cleaning, the lime is injected in a solid form, whereas in semi-systems, it is injected in the form of an aqueous suspension.
To calculate the amount of lime required to interact with the emitted amount of acids and sulfate emissions (HCl, SO2, and HF), the molar weight of these compounds was used. According to [34], hydrated lime and one mole of Ca(OH)2 captures two moles of HCl and one mole of Ca(OH)2 captures one mole of SO2 (see the chemical equations below).
Ca(OH)2 + 2HCl → CaCl2 + H2O
SO2 + Ca(OH)2 → CaSO3 + H2O
According to the simulated results in Ebsilon for emissions and the molar weights of the related compounds, the amount of lime required to reach a certain level of emissions (see 
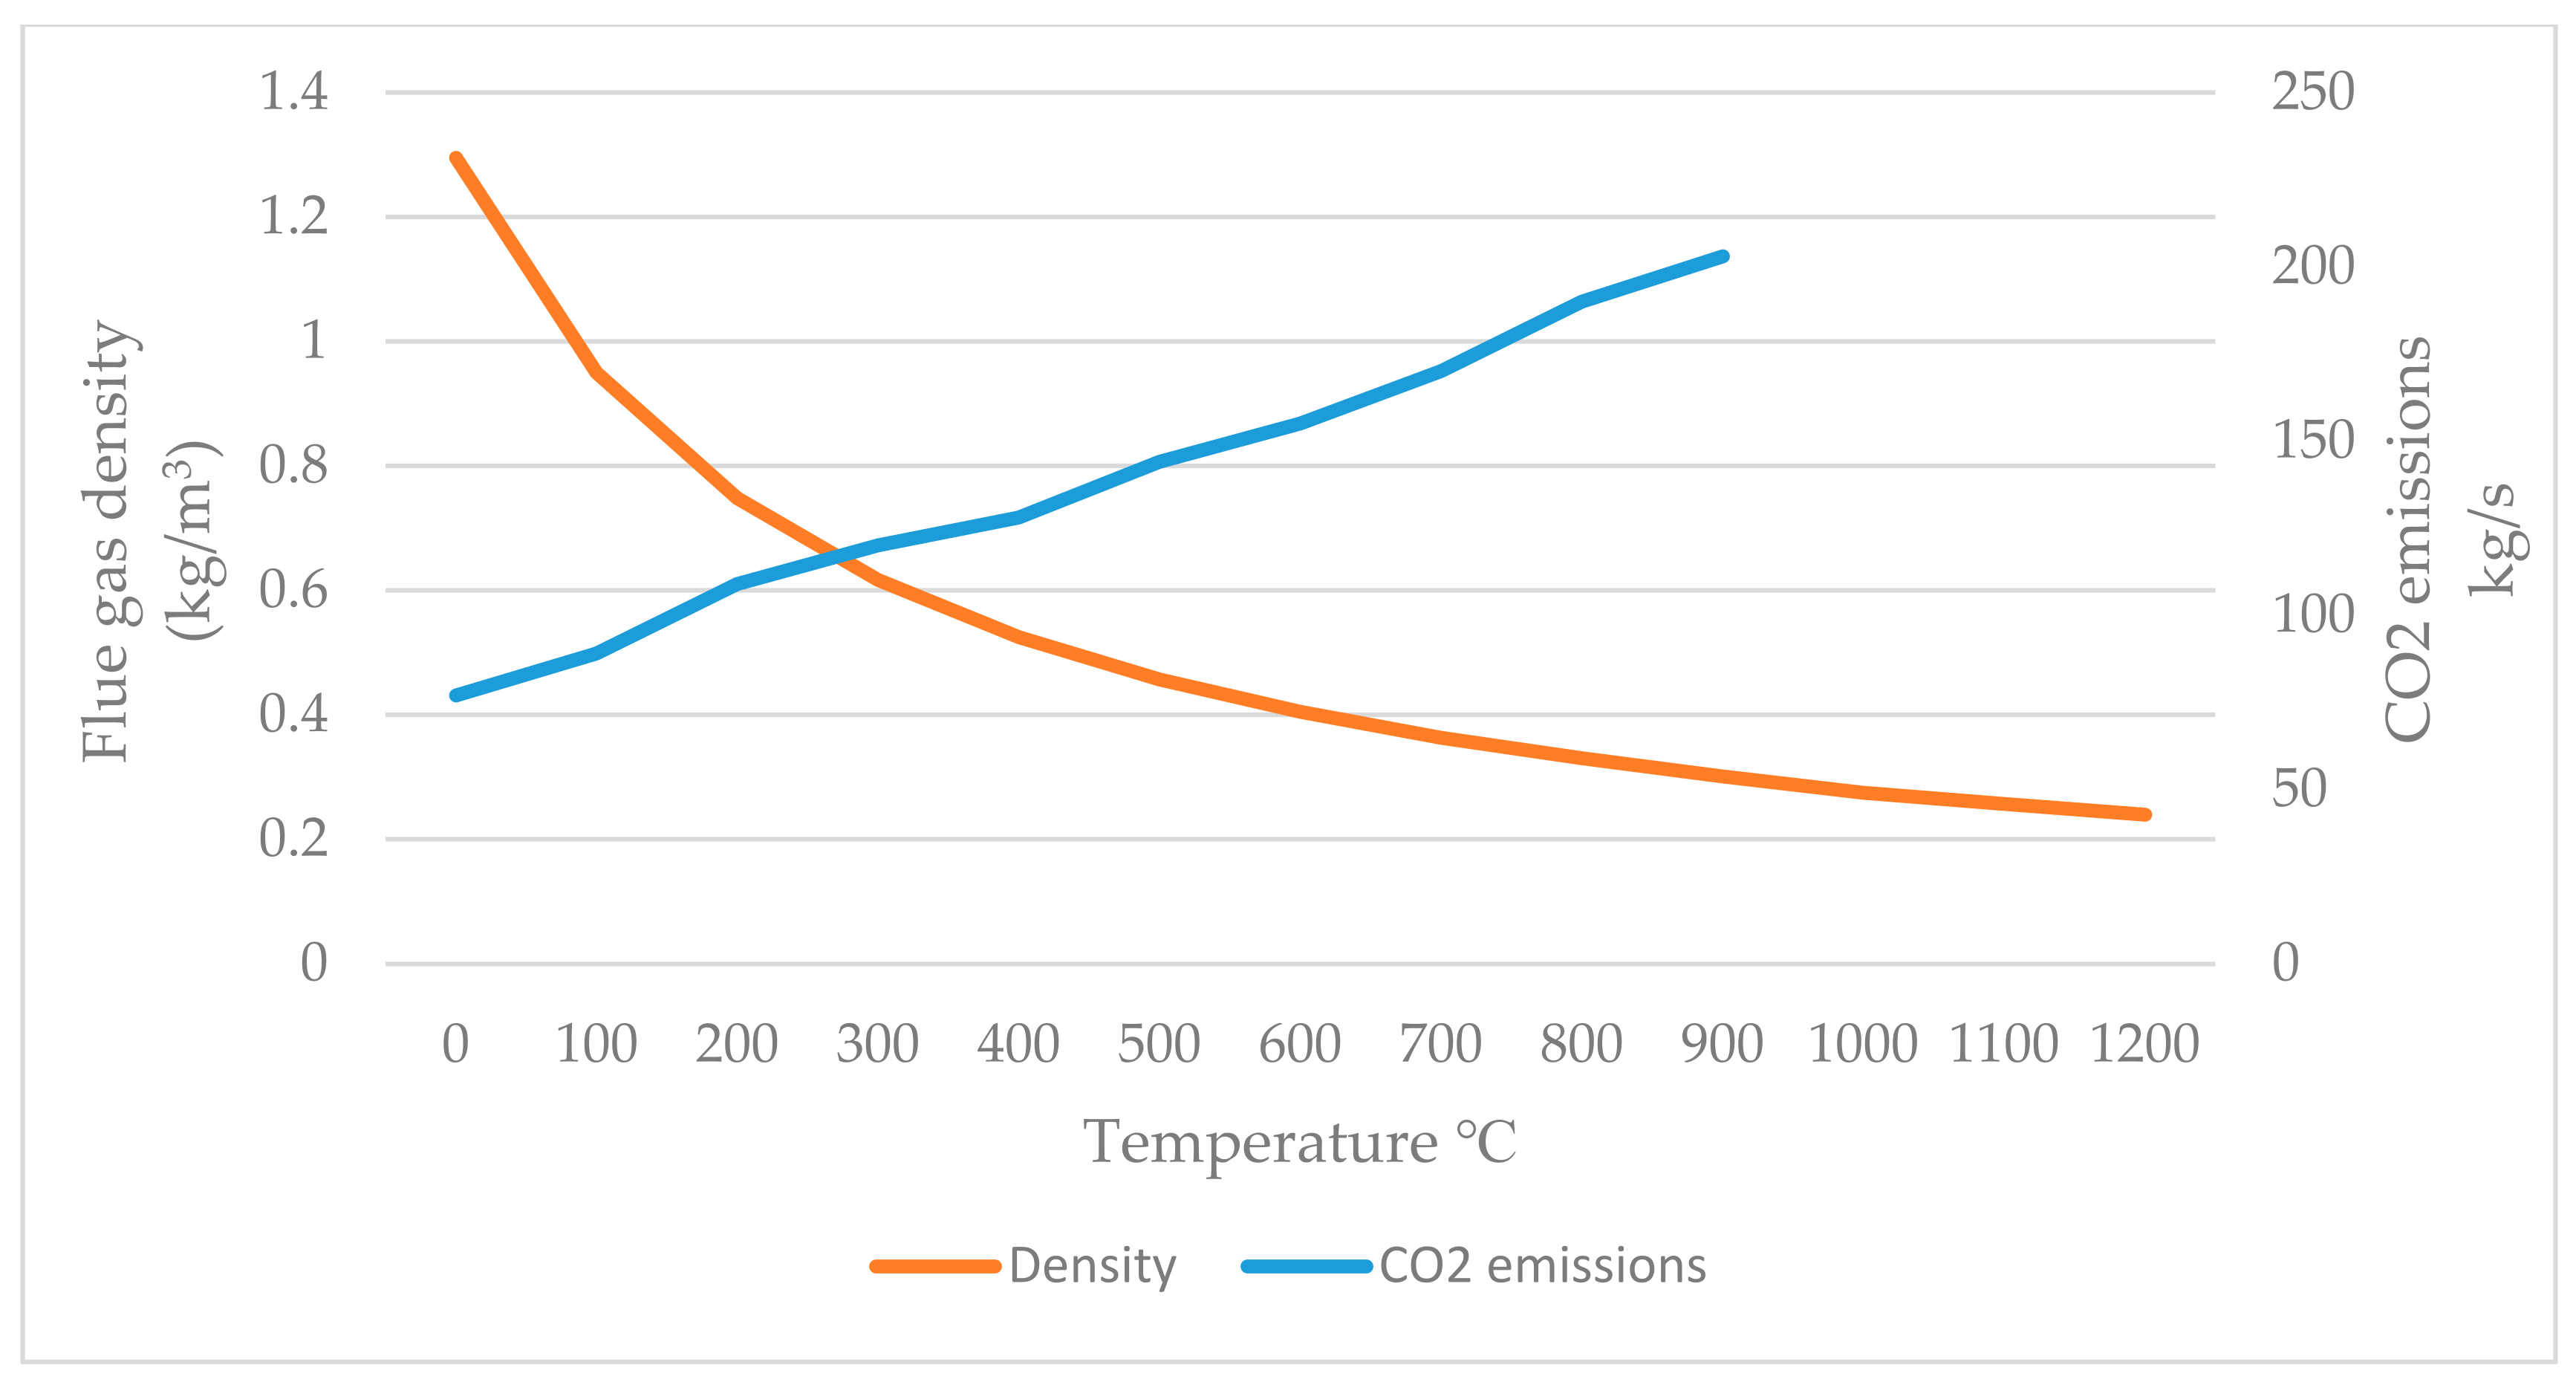
Table 12) matched the limitations on emissions stated in the 2018 BREF, which is 293 g of lime. The lime is injected as dry material into the flue gas stream in the reactors. It should be noted that the flue gas mass flow rate was around 340 m3/s where the temperature of the flue was around 1000 °C, which decreases the flue gas density and increases its mass flow.
In recent years, the international community has paid more attention to climate change. It has promoted the study of technologies to reduce the emission of greenhouse gases such as CO2, SO2, HCl, and HF, among others, which is said to be responsible for contamination of the atmosphere and climate change. The increase in CO2 has been generated by the growth in demand for energy, which makes it difficult to reduce. In the short term, one of the most viable options to reduce emissions is capture and storage, as agreed by the IPCC, which has set an ambitious objective of reducing CO2 emissions by 50% by 2050 [35].
There are three main technologies currently available on the market to treat and reduce CO2 emissions (an explanation about each of them can be found in Appendix A). Post-combustion technology was chosen to be simulated in Ebsilon and to ascertain the results of any potential CO2 reduction. It is most important when using this technology to select an efficient sorbent, so in this model, spherical nano carbon materials were used.
The governing chemical equation for the interaction between the solid spherical carbon materials and CO2 gas is as follows:
CO2(g) + C(s) → 2CO(g)
As can be seen, the chemical molar equality states that each mole of carbon grabs one mole of carbon dioxide, and as a result, this interaction produces two moles of carbon monoxide (CO). It is important to mention that carbon monoxide does not directly contribute to global climate change, but it does react in the atmosphere to produce methane and ozone [30]. Methane and ozone are similar to carbon dioxide in the contribution they make to human-caused climate change. Despite this, carbon monoxide was not identified in the suite of greenhouse gases addressed by the Kyoto Protocol or in most other international agreements aimed at reducing climate change. Carbon monoxide has not been targeted as a greenhouse gas in part because its effects on the climate depend on the locations from which it is emitted.
The generated carbon monoxide can reproduce carbon dioxide by interacting with the oxygen in the atmosphere, and while CO is both formed and oxidized in the upper atmosphere, the rate of oxidation of CO in the dense lower atmosphere is not known with certainty [36]. It has been indicated that no direct chemical oxidation of CO by oxygen in sunlight has ever been observed. The concentrations of atomic oxygen (O) and the rate coefficients, particularly in the lower atmosphere, are too low to cause appreciable loss. Carbon monoxide is chemically oxidized slowly by molecular oxygen in the lower atmosphere via the process:
CO + O2 → CO2 + O
Additionally, via the water gas reaction:
CO + H2O ↔ CO2 + H2
As can be seen, the reaction of carbon monoxide with water vapor is a reversible and unfixed reaction. Both the above-mentioned reactions require a massive amount of energy to be accomplished in nature (atmosphere), where 213,384 KJ/mol of energy is required for interacting carbon monoxide with oxygen and 280,328 KJ/mol is required to react with water vapor [36]. The enormous amount of energy required is the main barrier to achieving these reactions in the atmosphere, due to which reproducing carbon dioxide by oxidation of carbon monoxide seems to be difficult in the lower part of the atmospheric wrap.
In nature, many sinks probably exist for carbon monoxide gas, and large-scale atmospheric mixing is sufficient to move the CO to an upper atmospheric sink. Another possible sink is when the CO is in contact with soil that may be oxidized and converted by commonly found specific anaerobic methane-producing soil microorganisms. The ocean may also serve as a potential sink for CO. Carbon monoxide is soluble to a degree in sea water to the order of 0.032 to 0.017 (volume of gas, absorbed by a unit volume of water when the pressure of the gas equals 1 atm) at a temperature range of −2 to 30 °C [36].
Table 13 shows the results from the simulated spherical carbon injection to reduce the CO2 emissions of the flue gas in Ebsilon.
As can be seen in Table 13, the CO2 emissions before the reactor were 180.9 g/m3 which is equivalent to 35 kg/s, where the mass flow rate of the flue gas according to Ebsilon’s results was 195.25 m3/s. This means that there are around 1.4 tons of CO2 emissions generated from this facility, which matches the values for CO2 emissions in the literature [37], where the range is around 0.7–1.7 tons for each ton of waste burned in WtE systems. It should be noted that before the obligated abatement stated by the IPCC, the Kyoto Protocol, and other agreements, laws, and regulations issued to reduce the amount of CO2 emissions, which make a direct contribution to climate change, this amount of pollution (CO2 emissions) was directly released into the atmosphere. All European countries and those that have waste incineration techniques are now issuing regulations to reduce the amount of emissions from or with flue gas. For example, the waste incineration plant in Oslo in Norway (klemetsrud) was the source of 385,000 tons of CO2 emissions each year, and therefore, Oslo’s goal of a 95% reduction in emissions by 2030 is necessary [38].
A successful pilot project in 2011 to capture 90% of the CO2 from a small flue gas stream is now a full-scale carbon capture project [38]. The project will capture 400,000 tons of CO2 every year in an amine-based absorption capture plant. Although this is an early example of large-scale capture of WtE, the capture process is well understood and has been tested in other capture applications [39].
According to the simulation results, 9.4 kg/s of spherical carbon was required to verify 91% of CO2 reduction (as shown in Table 13). This means the equivalent CO2 for each ton of waste is to be reduced to 0.03 tons for each ton of waste.
The results of the model calculations for CO2 and O2 were validated by comparing them with Ebsilon’s results and the available data from the literature which were adapted from real incineration plants. The model is viable to be used in the design phase and to predict the amount or percentage of CO2 emissions in the generated volumetric flue gas. An integrated flue gas cleaning system was also simulated in this study. The results depended on an elementary analysis of the data which was prepared to build a comprehensive model (simulated) of a waste incineration plant with its related emission cleaning system. The proposed cleaning system for flue gas starts with SNCR to control and reduce the emission of NO2 and ends with the reduction process for CO2. The model is illustrated in
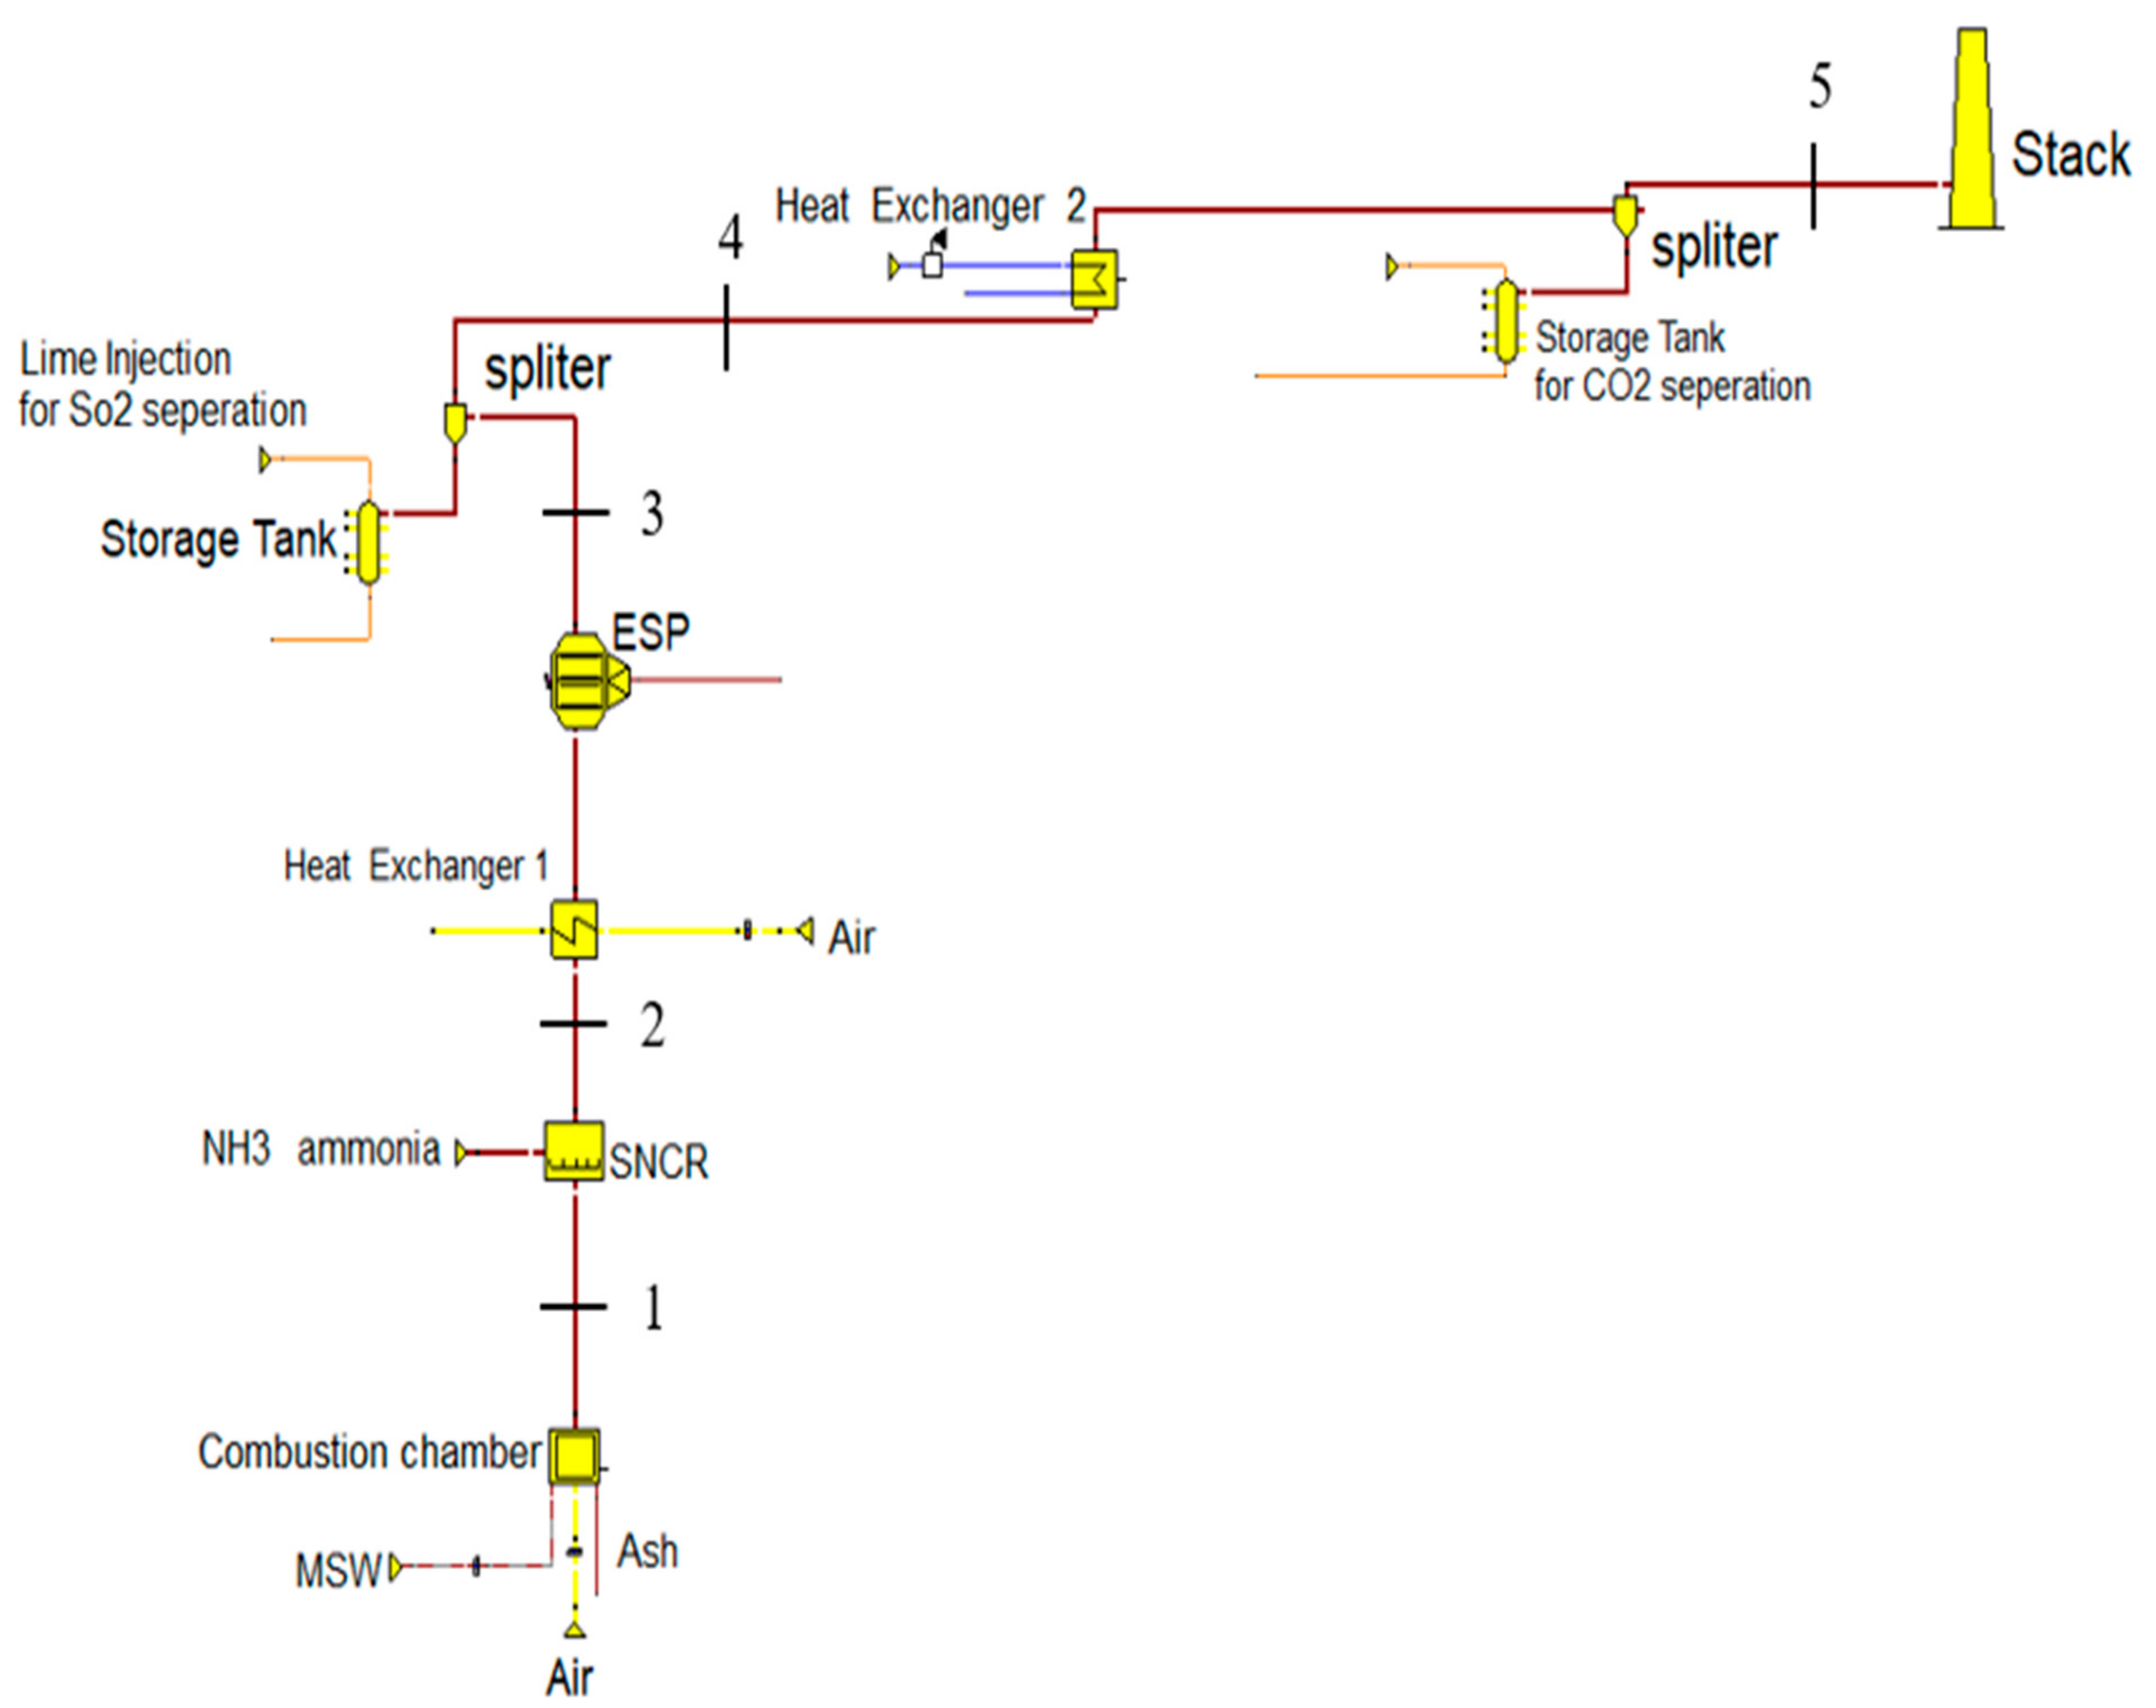
 Figure 8.
Five points were made on the stream line of the flue gas to illustrate the important stages that the flue gas passes through during the cleaning process (see Figure 8). The heat exchangers 1 and 2 have the same role as the boiler in the simulated facility. Point 1 is the effluent from the combustion chamber where the flue gas holds the total amount of thermal energy and the whole volume of gas emissions. Point 2 gives the data for the flue gas emissions just after the SNCR to scale-up the NO2. Point 3 is after the first heat exchanger (the first stage of the boiler) and electrostatic precipitator (which works to reduce the amount of the particulate matters in the flue gas). Point 4 is after lime injection to measure the reduction in SO2 and HCl. Point 5 is the most important, and comes after the injection of carbon (spherical carbon material) to capture CO2 and reduce its concentration in the flue gas stream.
Splitter is a component of Ebsilon which is used to separate compounds and materials. Two different mass flowrates of MSW (25 and 30 kg/s) were inserted in the simulated model of the cleaning system. This produced the same emission values for both mass flowrates loaded into the furnace, and as they were the same, only the results for the 25 kg/s MSW are presented in 
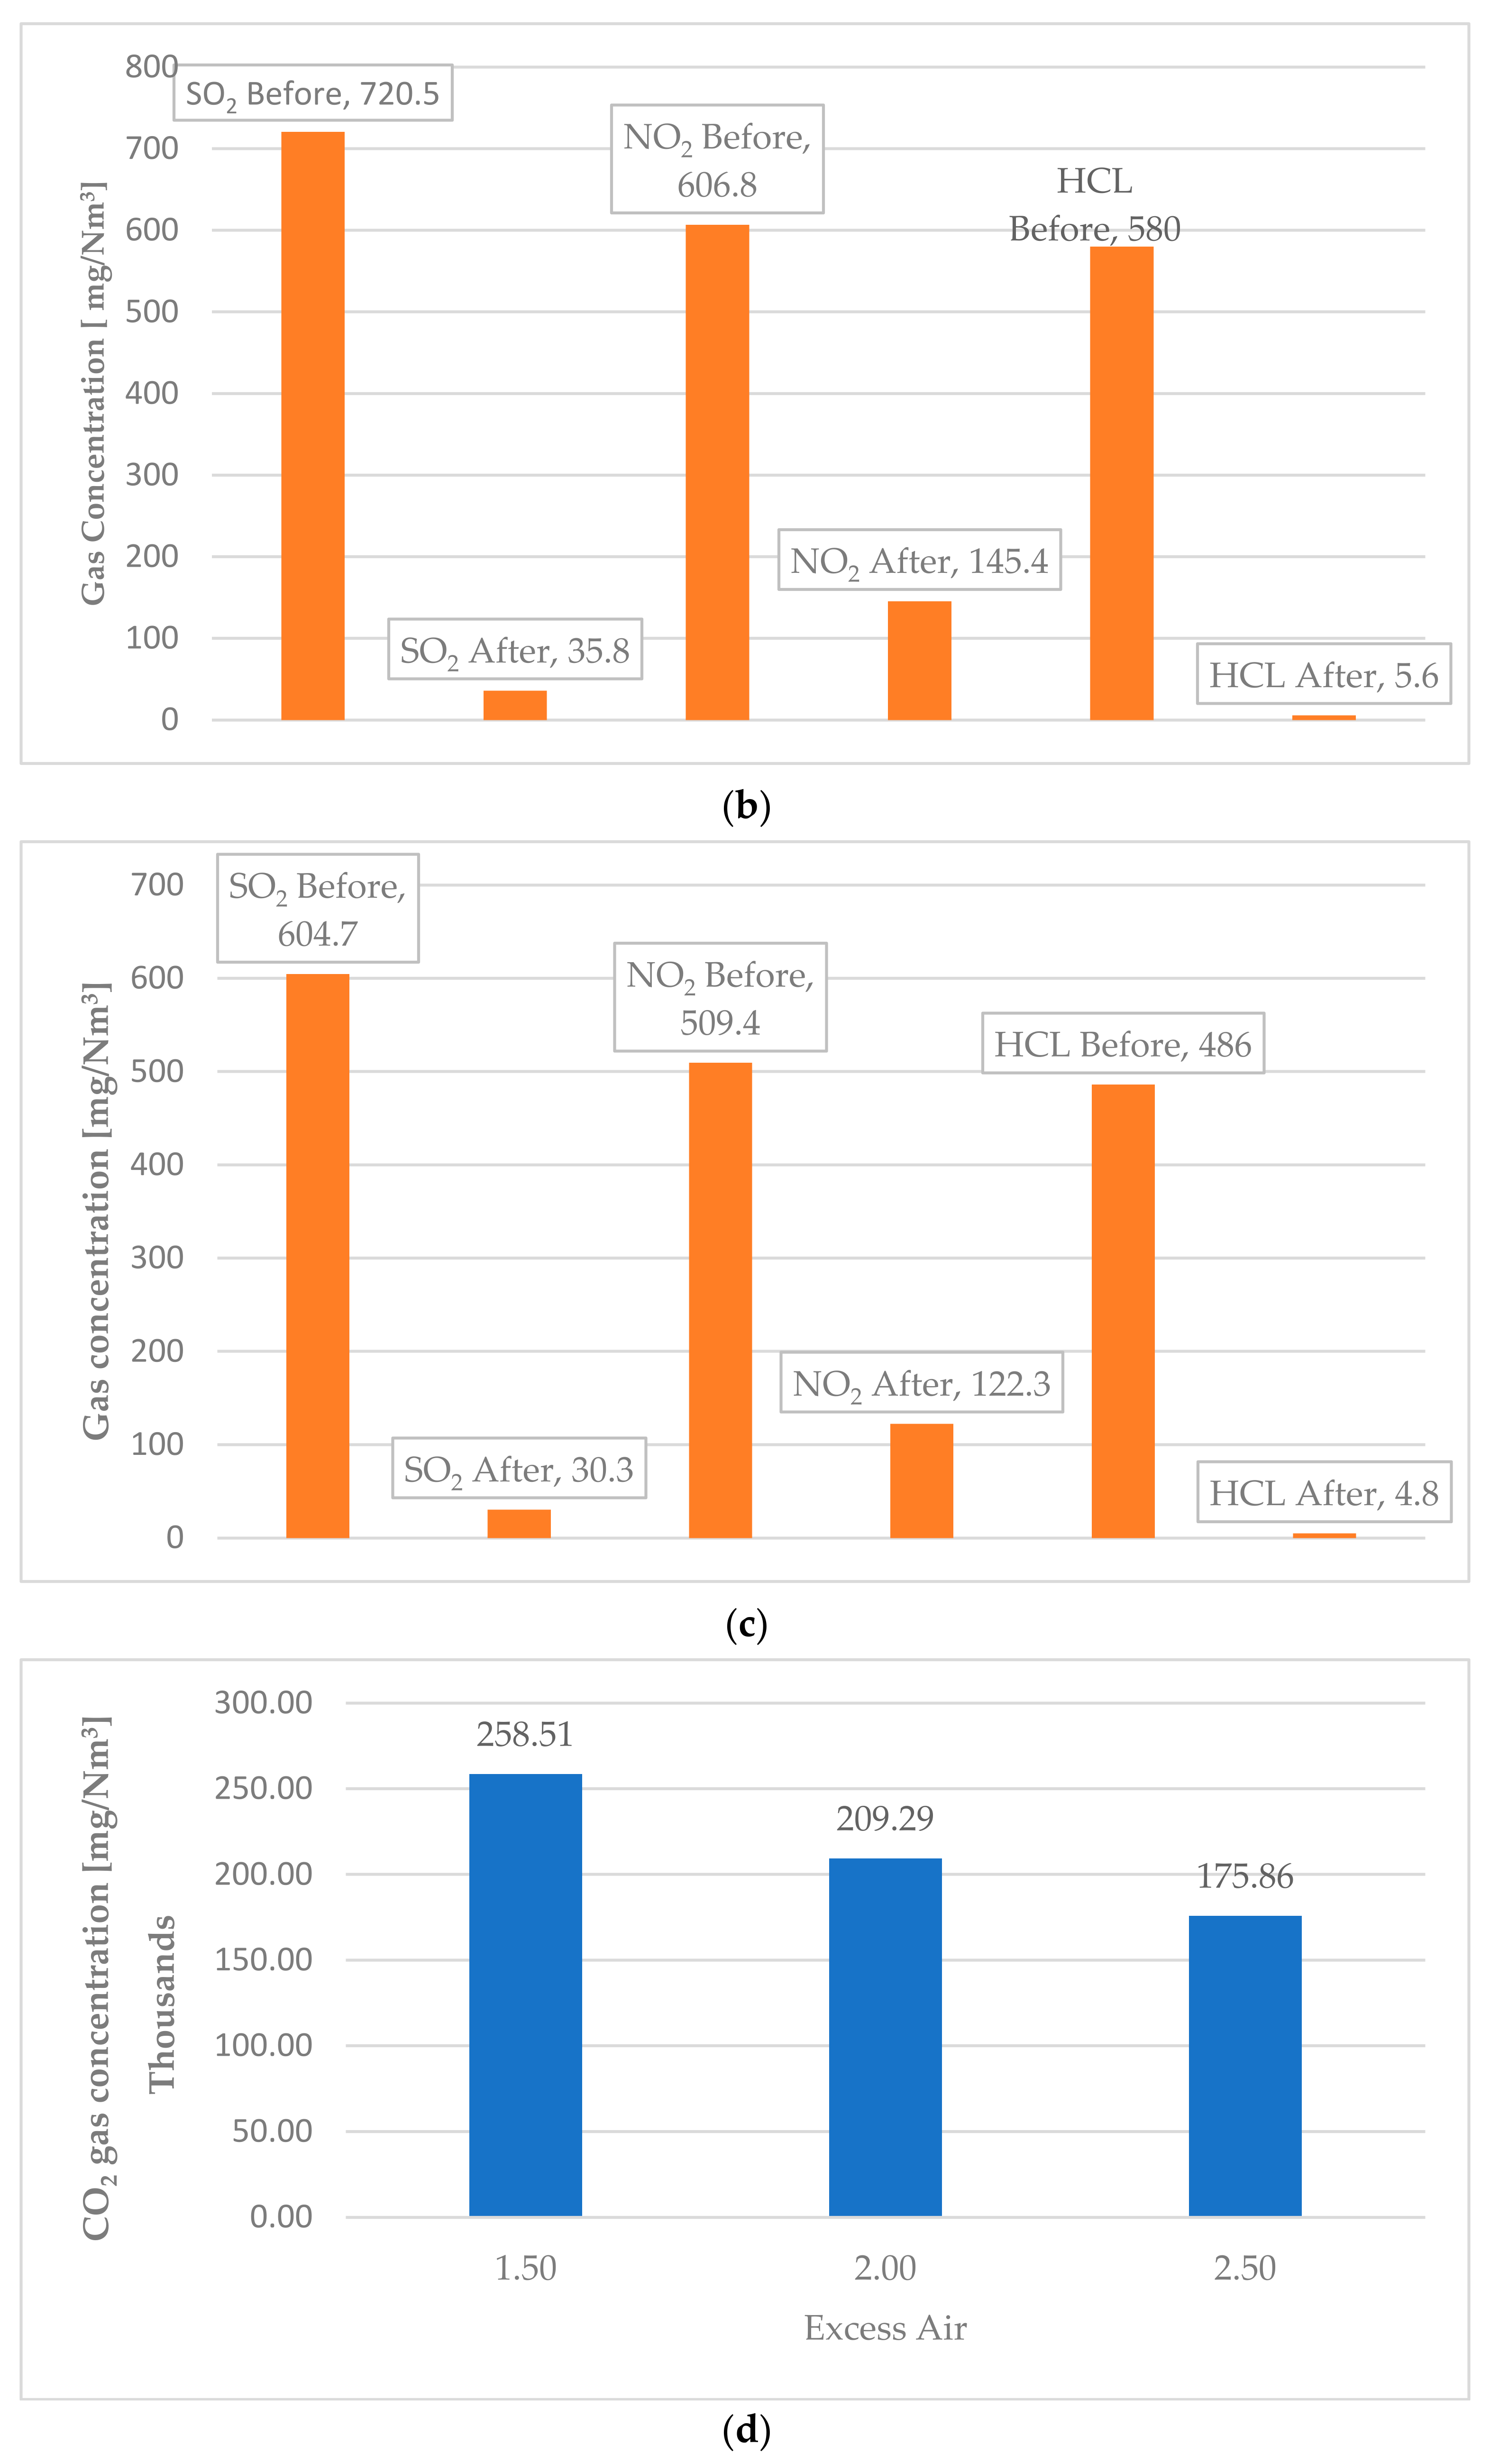
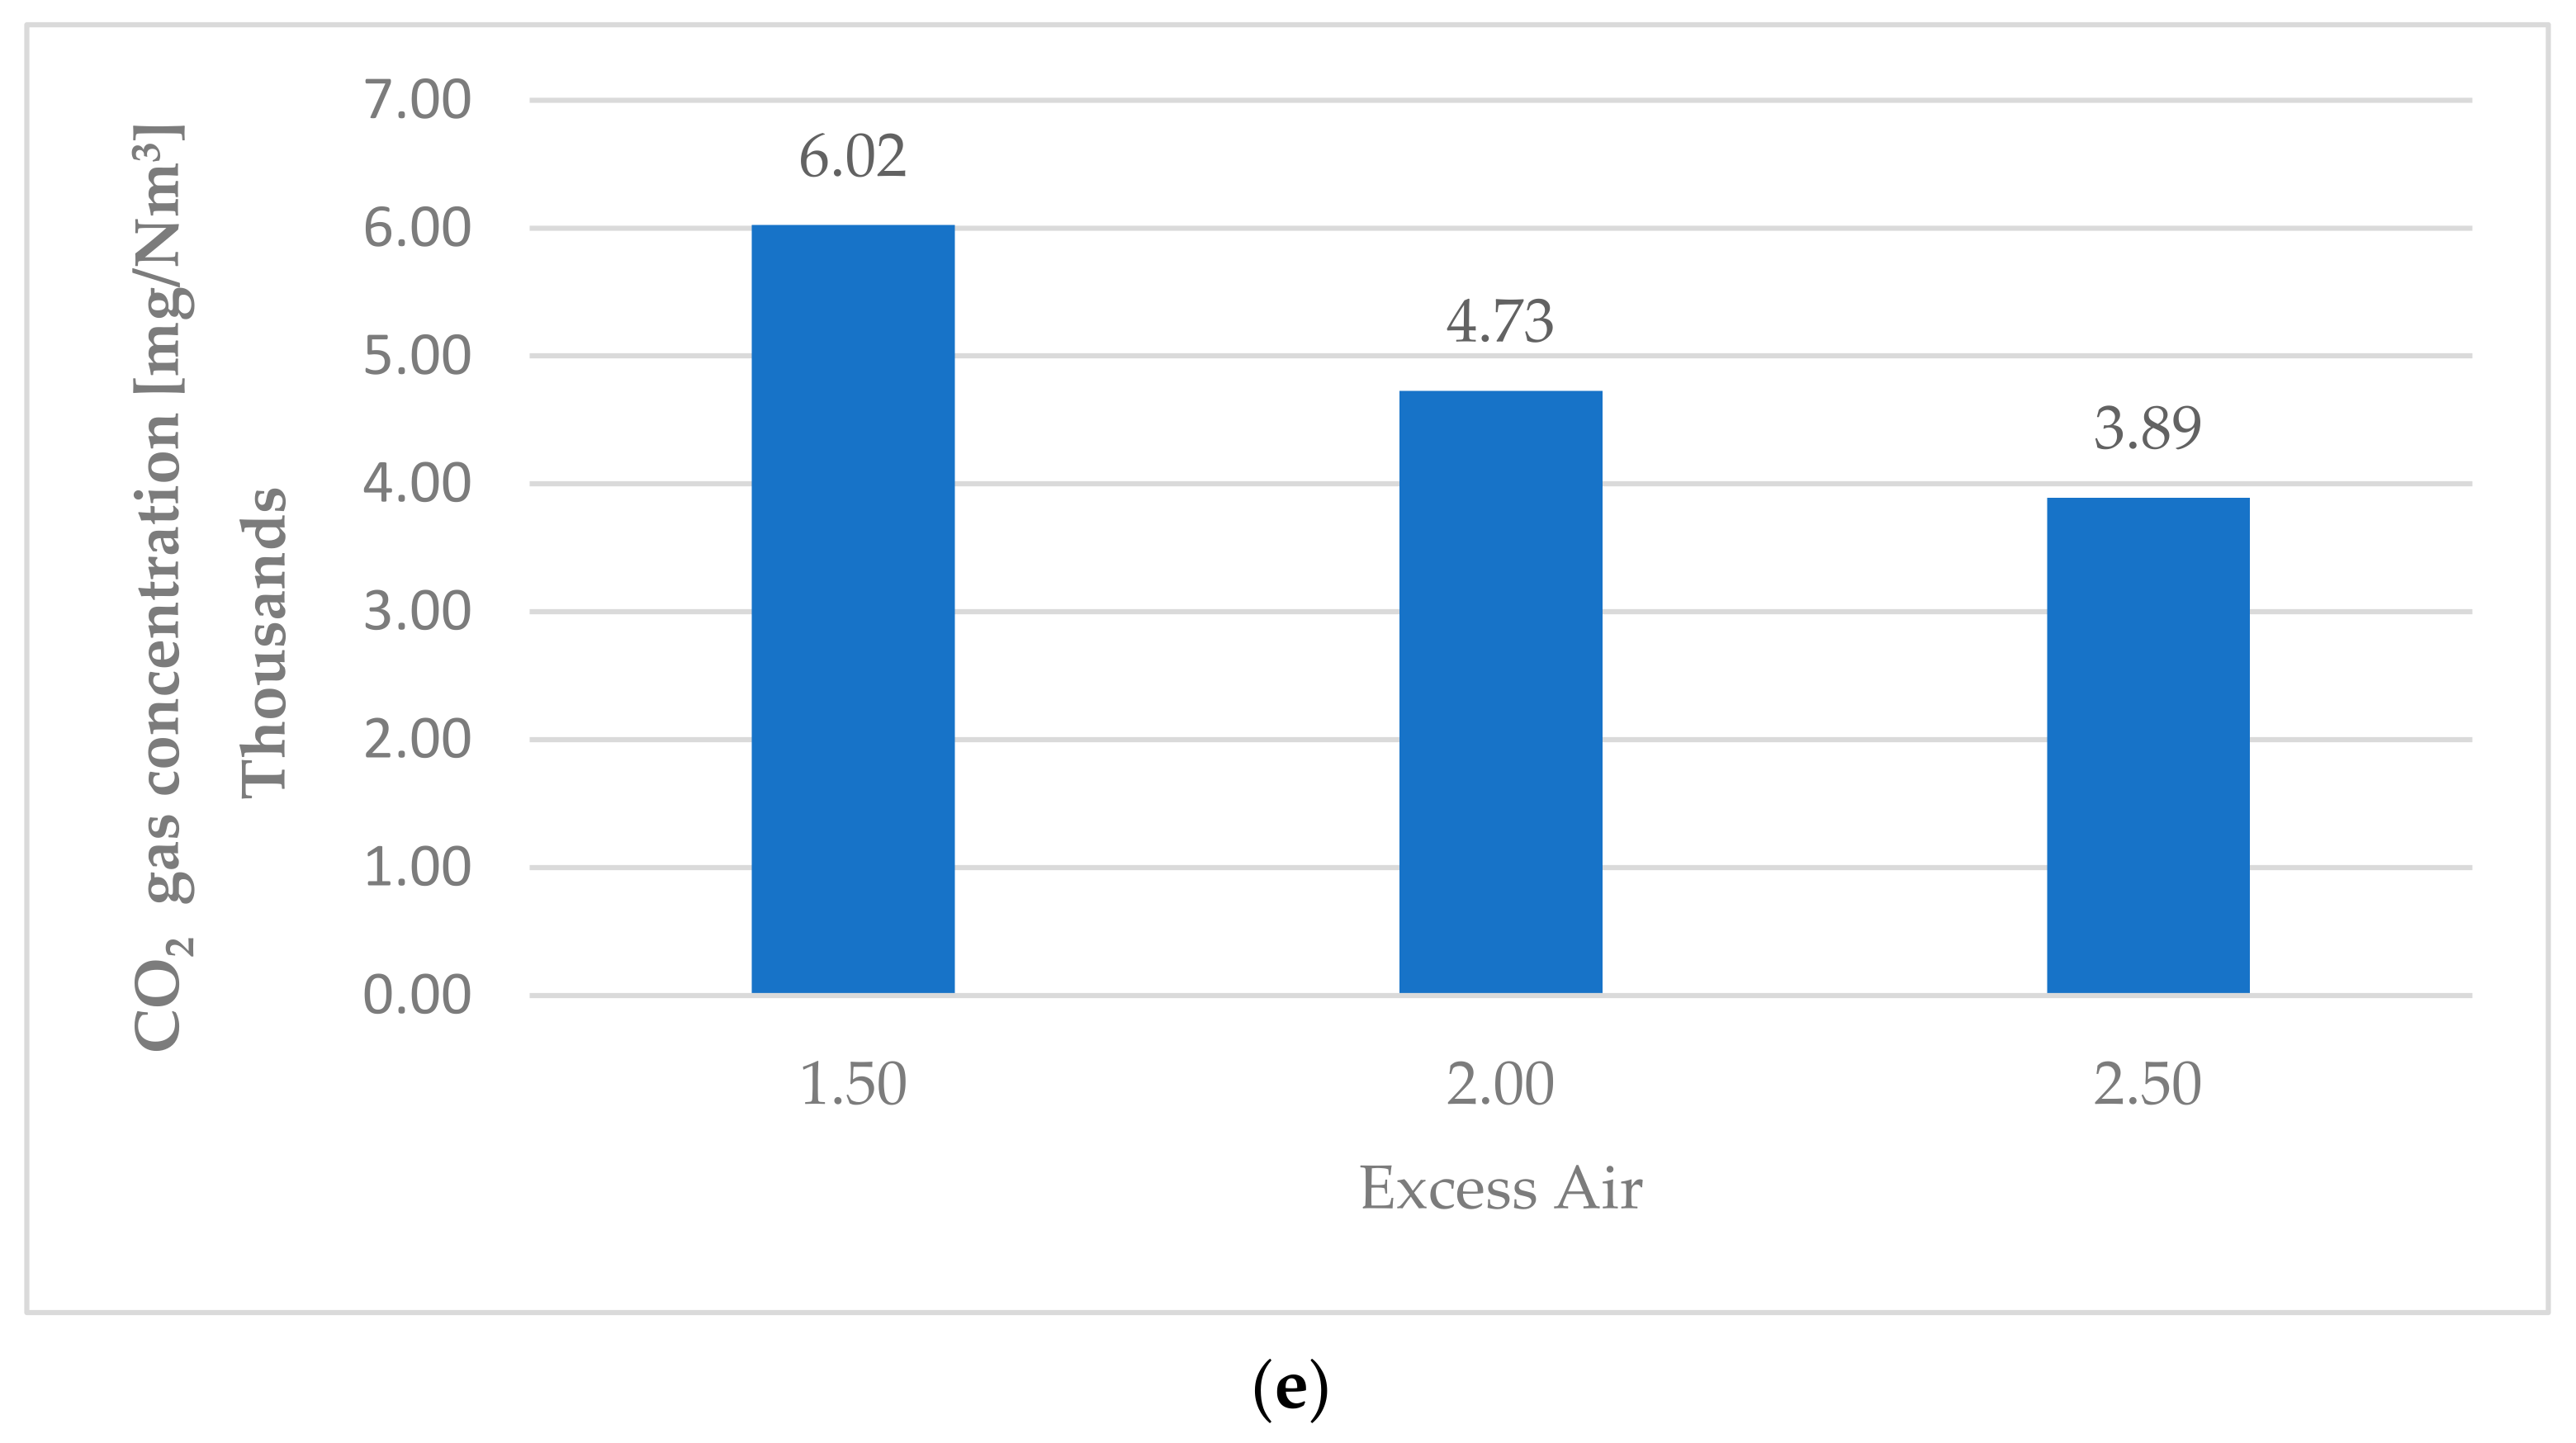
Table 14. The effect of excess air was clear, as shown in Figure 9. For CO2 emissions at 1.5 excess air ratio, the first value for the CO2 concentration emitted from the furnace was 258,514 mg/Nm3 which could be reduced to 6000 mg/Nm3 before the stack. To achieve this reduction, around 9.4 kg/s of spherical carbon should be injected. For the 2 and 2.5 excess air ratio, CO2 emissions reduced from 209,294 mg/Nm3 to 4728 mg/Nm3 and from 175,855 mg/Nm3 to 3892 mg/Nm
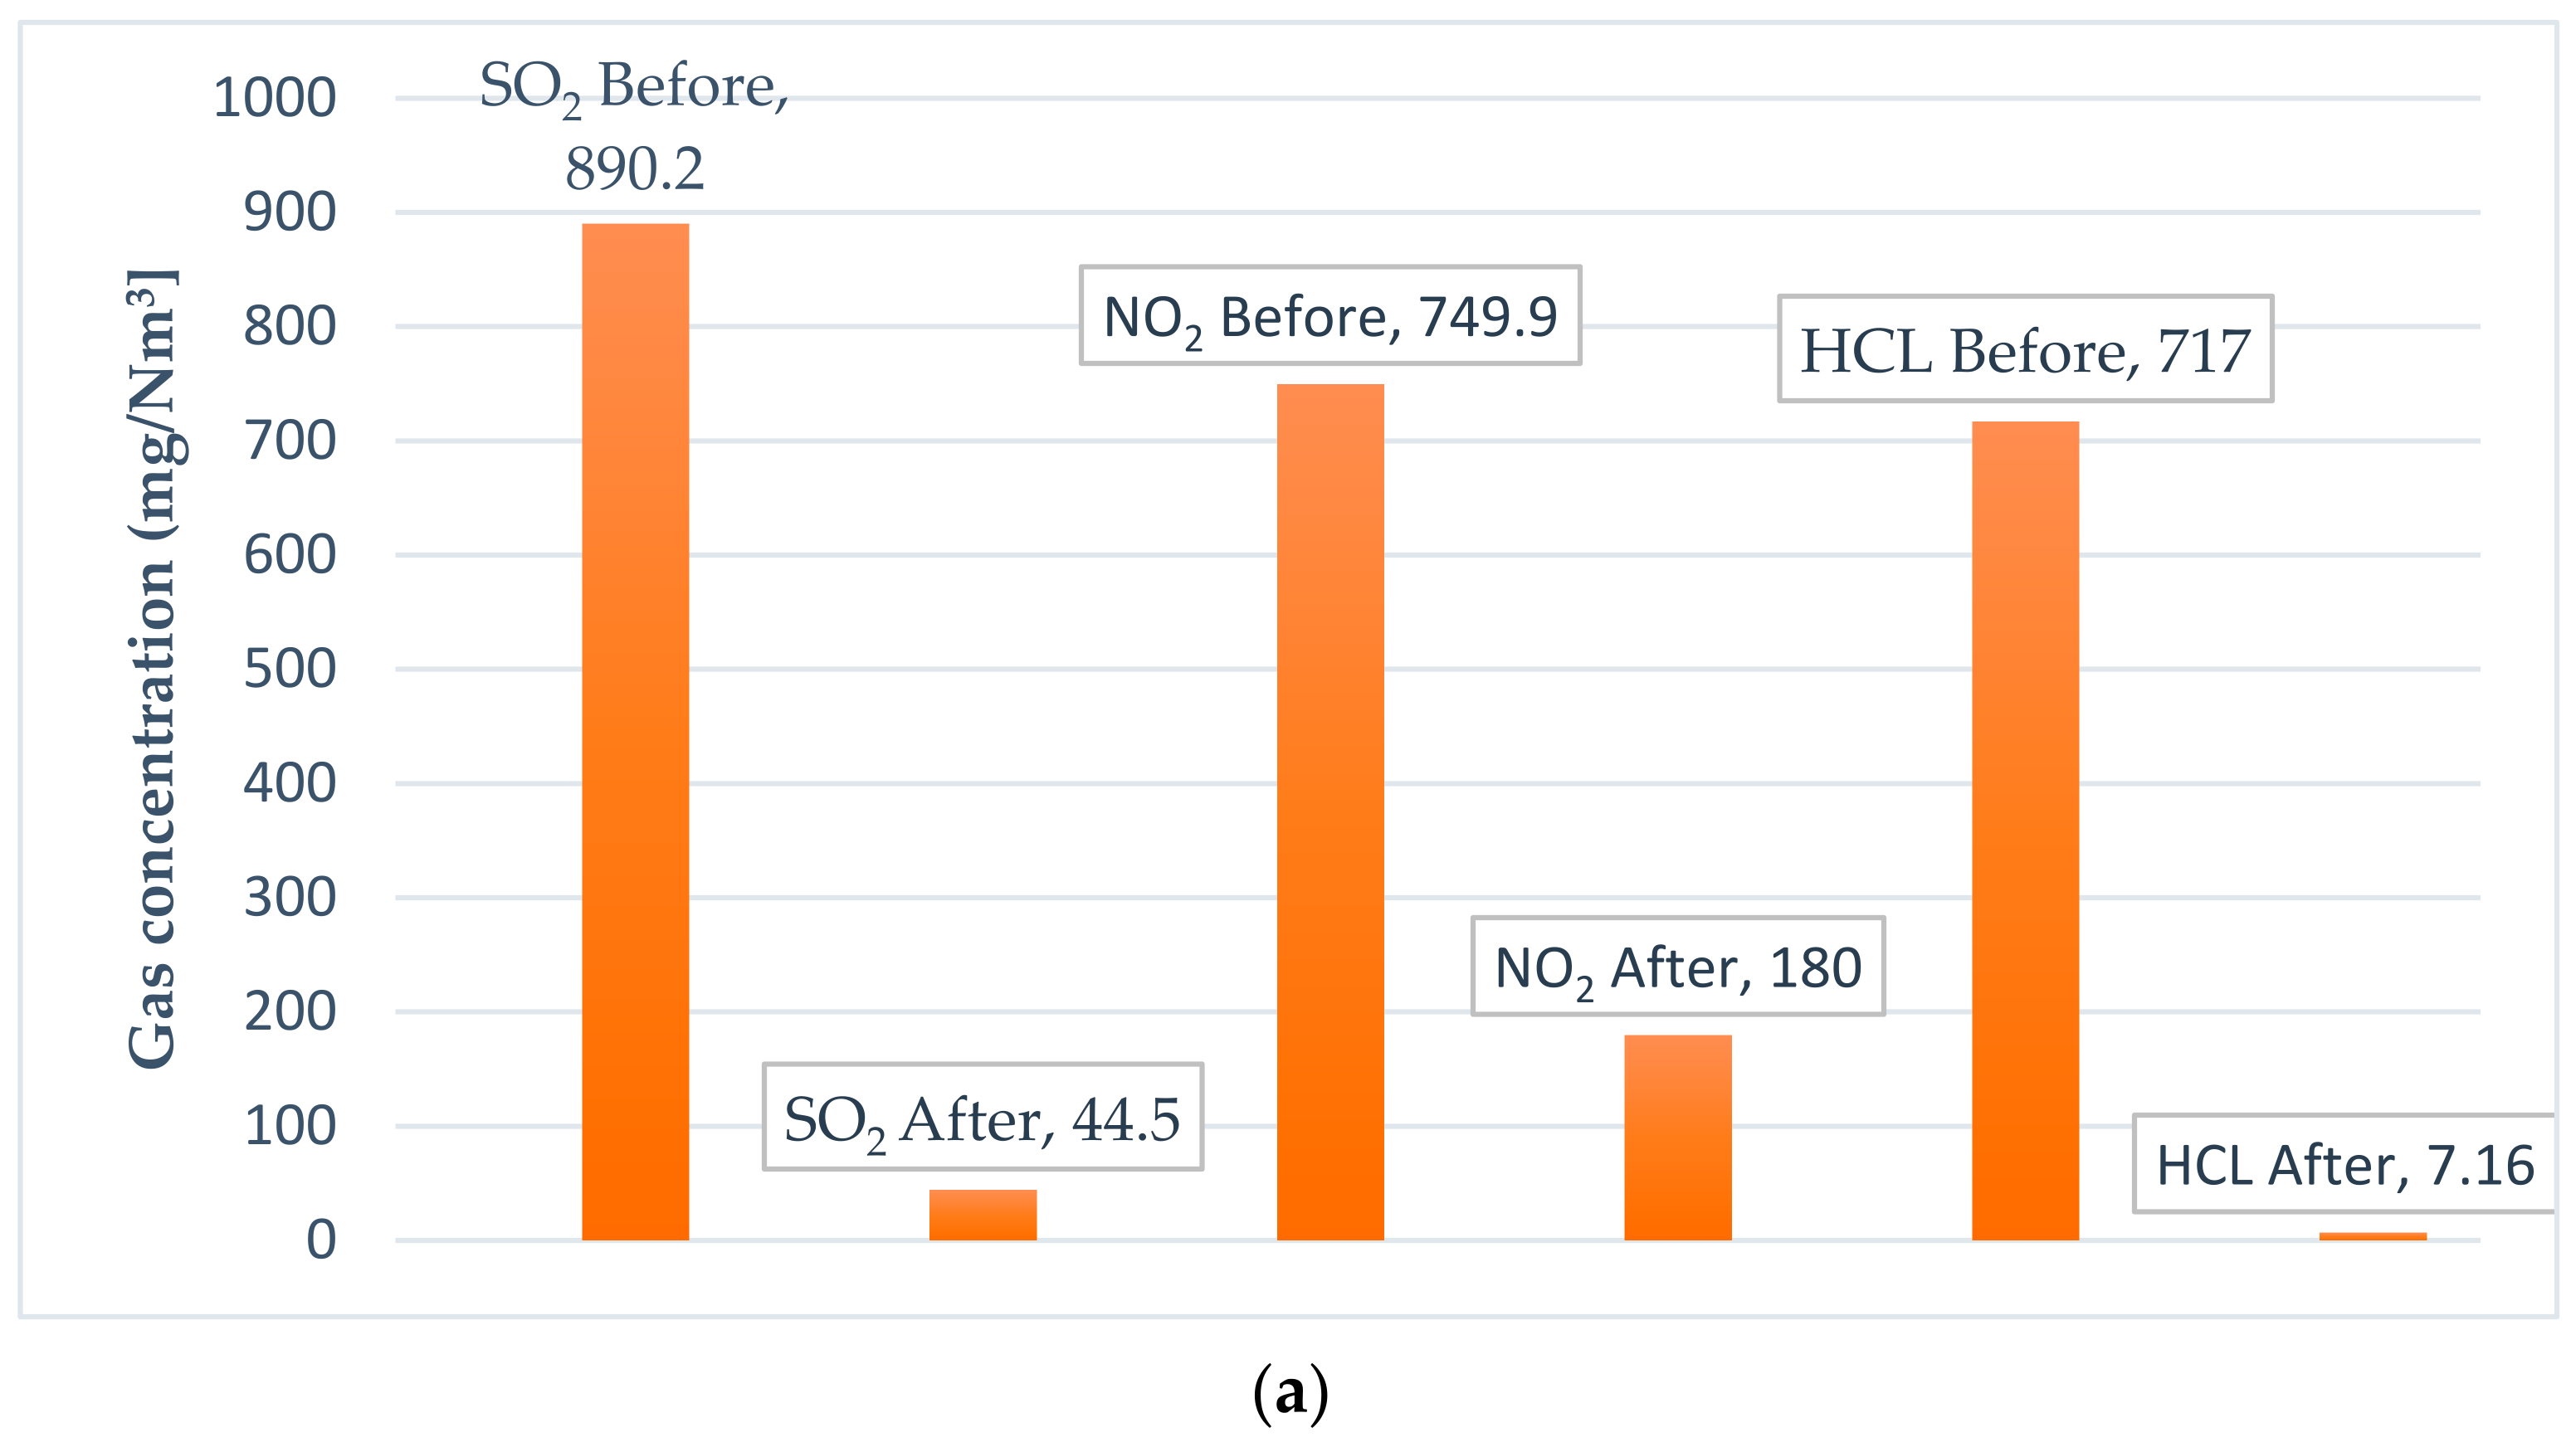
3, respectively. The same outcome was observed for all emitted gases. The SO2 with 1.5 excess air was 890.2 mg/Nm3 before treatment and 44.5 mg/Nm3 after treatment. With 2 excess air, SO2 emissions dropped to 720.5 mg/Nm3 before treatment. After exposure to lime particles, it was 35.8 mg/Nm3, and finally, with 2.5 excess air, it was 604.7 mg/Nm3 before lime injection and 30.3 mg/Nm3 after interaction with lime particles.
Regarding the NO2 emissions, for the 1.5 excess air ratio, it could be reduced from 749 mg/Nm3 to 180 mg/Nm3, and from 606 mg/Nm3 to 145 mg/Nm3 for 2 excess air ratio. With 2.5 excess air ratio, the reduction was from 509 mg/Nm3 to 122 mg/Nm3.
Table 15 summarizes the emission values of the flue cleaning system after the furnace at point 1 and before the stack at point 5.
As previously mentioned, gases emitted from waste incineration facilities must adhere to the laws and regulations in each country. For example, in Europe, they follow the EC BAT 2010 techniques which can be adapted for MENA region countries since there are no incineration plants. Flue gas emission requirements affect capital investment and plant operation costs which is why the economic analysis of waste incineration is so varied and changeable. The analysis of flue gas emissions in this study highlights the need for future research into the detailed costs of the chemical compounds required, such as lime and spherical carbon, to achieve reductions in emissions. Regarding the polychlorinated dibenzo-p-dioxins (PCDDs) and polychlorinated dibenzo-furans (PCDFs), as mentioned before, the design temperature of the furnace was taken at 850 °C, and the recommended temperature for the combustion zone to achieve complete combustion process and reduce formation possibility of PCDDs is in the range between 850–1000 °C, and therefore, this range of temperature hampers the rearrangement reaction of chlorinated precursors such as chlorophenols (CPs) and chlorobenzenes (CBs) in the gas phase. Furthermore, the end-of-pipe treatment technique from which 95% of dioxin and furan removal can be achieved, which can be formed in the post-combustion zone at low temperatures due to de novo process (the surface catalytic effect of fly ash), and this technique consists of a wet scrubber and a bag filter coupled with carbon injection at a temperature between 120–150 °C. Injecting carbon at 50 mg/Nm3 burns it in the incinerators [40]. The concentration and reduction of PCDDs and PCDFs were beyond the scope of this research.

4. Discussion

In our previous work [12] which used Jordan as a case study, a waste incineration plant was simulated to produce power and desalinated water, from which analysis of the MSW sample taken in Jordan was achieved. The proposed system was also analyzed economically. The previous work was essential for this research in relation to air emissions from waste incineration plants since such waste incineration technology is at an earlier stage in the MENA region.
There are many studies on the topic of waste incineration emissions, particularly since the introduction of new regulations and agreements to reduce the emissions from waste incinerations plants, specifically CO2 emissions which are considered the main driver of climate change. Sevilla et al. [41] prepared highly porous carbons and tested three materials as sorbents for CO2 capture.
Jones et al. [42] suggested four different methods to ascertain the amount of carbon in waste combusted in Sweden. They took real samples from erected waste incineration plants including 42 solid samples, 21 flue gas samples, 3 sorting analyses, and 2 investigations using the balance method.
Clerens et al. [43] studied the greenhouse gas (GHG) emissions from MSW management in EU countries, mainly in waste incineration facilities, and found that one of the best techniques for improving the performance of waste incineration, as well as reducing emissions, was to improve the efficiency of the incineration plants. After a comprehensive analysis of current and emerging techniques, they concluded that if proven techniques and supporting measures are properly implemented, the amount of energy recovered from waste can be increased by 35%, using the same amount of waste as feedstock.
Hwang et al. [44] studied the effect of country-specific, plant-specific, and operational conditions on the emissions from real waste incineration plants in Korea, based on data gathered from real plants. The selected incineration plants had different operating systems (i.e., stoker, fluidized bed, moving grate, rotary kiln, and kiln and stoker), and different nitrogen oxide (NOx) removal systems (i.e., selective catalytic reduction (SCR) and selective non-catalytic reduction (SNCR)) to treat municipal solid waste (MSW), commercial solid waste (CSW), and specified waste (SW). The total mean emission factors for MSW incineration were found to be 134 ± 17kg CO2 ton−1 and 69 ± 16 g N2O ton−1 while those for CSW incineration were 259.76 g N2O ton−1, and for SW incineration, the emission factors were 2959 kg CO2 ton−1 and 401.21 g N2O ton−1. In the case of Korea, it could be concluded that MSW incinerators have the lowest CO2 emissions. Choi et al. [45] continuously measured the emissions from five MSW incinerators and four industrials for N2O and CO2. The climate-relevant CO2 emission factors ranged from 0.45 to 0.72 tons of CO2/ton waste combusted in modern waste incinerators (MWI). According to the Bellona Europa report [46] the CO2 produced by burning municipal solid waste can be captured, transported, and permanently stored at geological storage sites to prevent the emission of CO2 into the atmosphere. Some researchers have investigated the effect of waste incineration plants as electricity generators on climate emissions in terms of life cycle assessment [47]. Trilling et al. [48] investigated the life cycle climate change impact of waste incineration. Their sensitivity analysis indicated that the non-biogenic fraction of the waste significantly influences the life cycle assessment.
However, the novelty of this study is to introduce a comprehensive methodology through a validated model to pre-assess the potential CO2, SO2, and NO2 emissions from a waste incineration plant during the design phase. Waste composition (the elementary fractions of the waste), LCV, and incarnation design capacity were the most important values to be investigated and specified to activate the model.

5. Conclusions

Converting waste to power and generating water (WtE) is a unique process which can be carried out in many countries, particularly those with chronic waste management and water scarcity problems. However, WtE must become more efficient. Climate change is the responsibility of all sectors that contribute to increases in CO2 in the atmosphere, including transportation and power generation. Waste incinerators are one source of CO2 emissions and other gases, but they are currently using promising technologies to mitigate their emissions. As previously mentioned, there are a range of regulations issued by different authorities including the EC that state an acceptable level of emissions from incineration facilities to reduce the effect on climate change. This research presented two available methodologies that predict emissions from a waste incineration plant either by applying a set of equations in Excel or by using Ebsilon software. Findings from the first methodology were validated using Ebsilon. There were three main factors that needed to be well-defined beforehand; (i) waste composition (elementary definition), (ii) waste energy content (LCV), (iii) and designed plant capacity. As this paper was integrated with our previous work, where a waste to energy to water plant was suggested for a case study in Jordan, the previously mentioned factors were precisely defined and evaluated, and an elementary analysis of the waste is presented in Table 1, where 7 MJ/kg annual LCV was assumed as well as a 25 kg/s designed capacity of the plant. It was found that excess air plays a major role in the concentration of emissions, especially CO2. According to the results, CO2 could be reduced from 258 × 103 mg/Nm3 with excess air of 1.5 to 209 × 103 mg/Nm3 with 2 excess air ratio; it could be decreased further to 175 × 103 mg/Nm3 but this also reduced the energy content of the flue gas itself. In addition, spherical carbon materials were used in the simulation as absorption materials for CO2 emissions. The results showed that the spherical materials were effective where CO2 could be reduced by 90%.
The effect of excess air could also be seen on the concentrations of the other gases, and SO2, NO2, and HCL emissions decreased around 33% by increasing the excess air from 1.5 to 2.5. The simulations results showed that the carbon particles were effective to mitigate the CO2 emissions, and at the same time, SNCR achieved 76% removal in terms of NO2 emissions. On the other hand, the results of O2 and CO2 volumes in the flue gas calculated by the Excel model were perfectly matched with Ebsilon, which means that the set of equations used (Excel model) can be adapted especially in the early design steps as long as the elemental composition of the waste is available.

Author Contributions

Conceptualization, Q.T. and A.N.; methodology, Q.T. and A.N.; software, Q.T.; validation, Q.T. and A.N.; formal analysis, Q.T. and A.N.; investigation, Q.T. and A.N.; resources, Q.T.; data curation, Q.T. and A.N.; writing—original draft preparation, Q.T.; writing—review and editing, Q.T. and A.N.; visualization, Q.T. and A.N.; supervision, A.N.; project administration, M.N.; funding acquisition, A.N. and M.N. All authors have read and agreed to the published version of the manuscript.

Funding

This research was funded by DAAD German Academic Exchange service, as a part of the PhD scholarship grant for Qahtan Thabit.

Acknowledgments

The authors would like to thank Steag Company “Steag Energy Services GmbH” for their essential support and for providing the Ebsilon software package to conduct this research.

Conflicts of Interest

The authors declare no conflict of interest.

Appendix A

  • Post-Combustion Capture:
The capture of CO2 from flue gases made by the combustion of fossil fuels and biomass in air is known as post-combustion capture. The flue gas is passed through equipment which separates most of the CO2. The CO2 is fed to a storage tank and the remaining flue gas is relinquished into the atmosphere. The separation process is achieved using a specific chemical sorbent. This technology is mature and is applicable on an industrial scale. Many existing plants around the world are working with post-combustion chamber techniques and approve of this technology including 2261 GWe capacity oil, coal, and natural gas power plants [49], and in particular, 155 GWe supercritical pulverized coal-fired plants [50]. Furthermore, with over 60% of the electricity in the United States (US) produced from fossil fuel power plants, the deployment of post-combustion capture technologies is vital to reduce CO2 emissions [51].
  • Oxy-fuel Combustion Capture:
With this type of capturing, almost pure oxygen is used for combustion as an alternative to air, resulting in a flue gas that is mainly CO2 and H2O. If fuel is burnt in pure oxygen, the flame temperature is excessively high, but CO2- and/or H2O-rich flue gas can be recycled to the combustor to justify this. Oxygen is typically produced by low-temperature (cryogenic) air separation and novel techniques to supply oxygen to the fuel, such as membranes and chemical looping cycles. The disadvantage of this process is that it needs a huge amount of oxygen to become separated. This increases operational costs. It is not widely used in MSW incineration plants due to the existence of water inside the waste composition [30,52].
  • Pre-combustion Capture:
This technique is more complicated, and includes reacting a fuel with oxygen or air and/or steam to give mainly a “synthesis gas” (syngas) or “fuel gas” composed of carbon monoxide and hydrogen. The next stage is the reacting of carbon monoxide with steam in a catalytic reactor called a shift converter, to give CO2 and more hydrogen. CO2 is then separated, usually by a physical or chemical absorption process, resulting in a hydrogen-rich fuel which can be used in many applications, such as boilers, furnaces, gas turbines, engines, and fuel cells [50]. It can be concluded from the brief information mentioned above about post-combustion technology that it is more mature than the other two technologies. There is much detailed research in the literature about the differences between these technologies [50,53], both technically and economically, but these are beyond the scope of this study.
Post-combustion technology was chosen to be simulated in Ebsilon and to capture the results of any potential reduction in CO2. The most important point about this technology is the selection of an efficient sorbent. There are a number of criteria that must be met for a successful sorbent material, specifically high selectivity and adsorption capacity for CO2, fast adsorption and desorption kinetics, efficient regeneration of sorbents, and low cost [54]. Different materials have been investigated as solid-state adsorbents for CO2, such as zeolites, silica, porous polymer materials, metal organic frameworks, and carbon materials [55,56,57]. The most efficient for CO2 adsorption are carbon materials, which exhibit a high surface area, large porous volume, chemical stability, affinity for carbon dioxide, low cost, and the possibility of modification with heteroatoms [58]. The weak aspect of carbon sorbents is their poor selectivity.
There are many behaviors that can overcome this undesirable feature and convert the carbon element into activated carbon with a high rate of selectivity. Polymers, biomass, or resins are widespread and used to produce or to convert these sources of carbon into activated carbon by using potassium compounds, namely, potassium hydroxide or potassium oxalate chemical activators. This leads to increasing selectivity and also enhances the surface area and porous volume. For example, according to the results in [59], chemical activation with potassium oxalate resulted in a large increase in the surface area of carbon materials (from 680 m2/g to 1490 m2/g) and an increase in CO2 uptake from 3.03 mmol/g to 7.67 mmol/g in 0 °C at 1 atm.
The use of spherical nanocarbon materials as a desirable structure is the optimum. Different technologies have been used to achieve this goal, and the most popular is the Stöber method which is used to obtain porous nanocarbon spheres, using resins as a carbon source and microwave-assisted solvothermal.

References

  1. Paraschiv, L.S.; Serban, A.; Paraschiv, S. Calculation of combustion air required for burning solid fuels (coal/biomass/solid waste) and analysis of flue gas composition. Energy Rep. 2019, 6, 36–45. [Google Scholar] [CrossRef]
  2. Kitto, J.B.; Stultz, S.C. Steam/Its Generation and Use; Babcock & Wilcox Company: Akron, OH, USA, 2010. [Google Scholar]
  3. Zhang, Y.; Zhao, J.; Ma, Z.; Yang, F.; Cheng, F. Effect of oxygen concentration on oxy-fuel combustion characteristic and interactions of coal gangue and pine sawdust. Waste Manag. 2019, 87, 288–294. [Google Scholar] [CrossRef] [PubMed]
  4. Sun, J.; Shen, Z.; Zeng, Y.; Niu, X.; Wang, J.; Cao, J.; Gong, X.; Xu, H.; Wang, T.; Liu, H.; et al. Characterization and cytotoxicity of PAHs in PM2.5 emitted from residential solid fuel burning in the Guanzhong Plain, China. Environ. Pollut. 2018, 241, 359–368. [Google Scholar] [CrossRef] [PubMed]
  5. Odunlami, O.A.; Oderinde, O.K.; Akeredolu, F.A.; Sonibare, J.A.; Obanla, O.R.; Ojewumi, M.E. The effect of air-fuel ratio on tailpipe exhaust emission of motorcycles. Fuel Commun. 2022, 11, 100040. [Google Scholar] [CrossRef]
  6. Zhu, X.; Baran, S.; Cel, W.; Cao, Y. Sustainable approach to mitigation of CO2 emission. Ecol. Chem. Eng. 2015, 21, 617–622. [Google Scholar]
  7. Zhang, C.; Zeng, G.; Huang, D.; Lai, C.; Chen, M.; Cheng, M.; Tang, W.; Tang, L.; Dong, H.; Huang, B.; et al. Biochar for environmental management: Mitigating greenhouse gas emissions, contaminant treatment, and potential negative impacts. Chem. Eng. J. 2019, 373, 902–922. [Google Scholar] [CrossRef]
  8. Mungai, E.M.; Ndiritu, S.W.; Rajwani, T. Do voluntary environmental management systems improve environmental performance? Evidence from waste management by Kenyan firms. J. Clean. Prod. 2020, 265, 121636. [Google Scholar] [CrossRef]
  9. Nassour, A.; Hemidat, S.; Chaabane, W.; Eickhoff, I.; Nelles, M. Current Development in Waste Management in the Arab World; Erich Scmidt Verlag: Berlin, Germany, 2018. [Google Scholar]
  10. Elnaas, A. Actual Situation and Approach for Municipal Solid Waste Treatment in Arab Region; University of Rostock: Rostock, Germany, 2015. [Google Scholar]
  11. Hemidat, S. Feasability Assesment of Waste Management and Treatment in Jordan; University of Rostock: Rostock, Germany, 2019. [Google Scholar]
  12. Thabit, Q.; Nassour, A.; Nelles, M. Potentiality of Waste-to-Energy Sector Coupling in the MENA Region: Jordan as a Case Study. Energies 2020, 13, 2786. [Google Scholar] [CrossRef]
  13. European Commission. Integrated Pollution Prevention and Control Reference Document on the Best Available Techniques for Waste Incineration; European Commission: Brussels, Belgium, 2006. [Google Scholar]
  14. Ciobanu, C.; Tudor, P.; Aura Istrate, I.; Voicu, G. Assessment of Environmental Pollution in Cement Plant Areas in Romania by Co-Processing Waste in Clinker Kilns. Energies 2022, 15, 2656. [Google Scholar] [CrossRef]
  15. Zhu, H.; Song, L.; Li, K.; Wu, R.; Qiu, W.; He, H. Low-Temperature SCR Catalyst Development and Industrial Applications in China. Catalysts 2022, 12, 341. [Google Scholar] [CrossRef]
  16. Kosowska-Golachowska, M.; Luckos, A.; Kijo-Kleczkowska, A. Pollutant Emissions during Oxy-Fuel Combustion of Biomass in a Bench Scale CFB Combustor. Energies 2022, 15, 706. [Google Scholar] [CrossRef]
  17. Dong, J.; Kumar Jeswani, H.; Nzihou, A.; Azapagic, A. The environmental cost of recovering energy from municipal solid waste. Appl. Energy 2020, 267, 114792. [Google Scholar] [CrossRef]
  18. Dal Pozzo, A.; Guglielmi, D.; Antonioni, G.; Tugnoli, A. Environmental and economic performance assessment of alternative acid gas removal technologies for waste-to-energy plants. Sustain. Prod. Consum. 2018, 16, 202–215. [Google Scholar] [CrossRef]
  19. Biganzoli, L.; Racanella, G.; Marras, R.; Rigamonti, L. High temperature abatement of acid gases from waste incineration. Part II: Comparative life cycle assessment study. Waste Manag. 2015, 35, 127–134. [Google Scholar] [CrossRef]
  20. Brunner, C.R. Incineration Systems Handbook; Incinerator Consultants Inc.: Ashburn, VA, USA, 1996. [Google Scholar]
  21. Nielsen, O.K.; Nielsen, M.; Hjelgaard, K.; Coleman, P.; Rentz, O.; Oertel, D.; Jones, H.; Wenborn, M.; Woodfield, M. Municipal Waste Incineration, Guidebook; European Environmental Agency: Copenhagen, Denmark, 2019. [Google Scholar]
  22. Pipe Flow Calculations. Available online: https://www.pipeflowcalculations.com/tables/flue-gas.xhtml (accessed on 9 March 2022).
  23. Lee, H.; Yi, S.M.; Holsen, T.M.; Seo, Y.S.; Choi, E. Estimation of CO2 emissions from waste incinerators: Comparison of three methods. Waste Manag. 2017, 37, 247–255. [Google Scholar]
  24. IPCC. IPCC Guidelines for National Greenhouse Gas Inventories; IPCC: Geneva, Switzerland, 2006. [Google Scholar]
  25. Neuwahl, F.; Cusano, G.; Benavides, J.; Holbrook, S.; Roudier, S. Best Available Techniques (BAT) Reference Document for Waste Incineration; European Commission: Brussels, Belgium, 2019. [Google Scholar]
  26. European Commission. Available online: https://ec.europa.eu/info/news/publication-new-eu-environmental-standards-waste-incineration-sector-2019-dec-18_en (accessed on 15 October 2021).
  27. World Bank. Technical Guide Report Municipal Solid Waste; World Bank: New York, NY, USA, 2000. [Google Scholar]
  28. Le Coz, P.; Tabaries, F. Integrated technology for NOx and Dioxin Removal inside WtE and Biomass Boilers. In Proceedings of the IRRC Waste to Energy, Vienna, Austria, 14–15 October 2019. [Google Scholar]
  29. Crevecoeur, S.; Tuliga, R. Improving the SO2 and HCl Removal Efficiency by 30% in Existing Dry FGC without any Capital Investment On-Site Observations and Results on Latest Developments. In Proceedings of the IRRC waste to Energy, Vienna, Austria, 14–15 October 2019. [Google Scholar]
  30. Staciwa, P.; Narkiewicz, U.; Sibera, D.; Moszy’ nski, D.; Wróbel, R.J.; Cormia, R.D. Carbon Spheres as CO2 Sorbents. Applied 2019, 9, 3349. [Google Scholar] [CrossRef] [Green Version]
  31. Fagerlund, J.; Zevenhoven, R.; Thomassen, J.; Tednes, M.; Abdollahi, F.; Thomas, L.; Nielsen, C.J.; Mikoviny, T.; Wisthaler, A.; Zhu, L.; et al. Performance of an amine-based CO2 capture pilot plant at the Fortum Oslo Varme Waste to Energy plant in Oslo, Norway. Int. J. Greenh. Gas Control. 2021, 106, 103242. [Google Scholar] [CrossRef]
  32. World Data Lab. Federal Ministry for Economic Cooperation and Development, GIZ GmbH, International Institute for Applied System Analysis. 2020. Available online: https://worldwater.io/ (accessed on 10 June 2020).
  33. Mazzoni, A.; Zaccagni, S. Status of Water Resources and Human Health in the Middle East and North Africa Region: An Integrated Perspective; Elsevier: Amsterdam, The Netherlands, 2019; pp. 805–815. [Google Scholar]
  34. Silva, A.A.; Krout, A.; Biehn, C. HCl Control Using Hydrated Lime Dry Sorbent Injection. In Proceedings of the Power Plant Air Pollutant Control “MEGA” Symposium, Maryland, MD, USA, 20–23 August 2012. [Google Scholar]
  35. Wang, M.; Atuman, J.; Colin, R.; Dag, E.; Nuhu, M. Process intensification for post-combustion CO2 capture with chemical absorption: A critical review. Appl. Energy 2015, 158, 275–291. [Google Scholar] [CrossRef]
  36. Jaffe, L.S. Ambient Carbon Monoxide and Its Fate in the Atmosphere. J. Air Pollut. Control Assoc. 1968, 18, 534–540. [Google Scholar] [CrossRef]
  37. Zero Waste Europe. The Impact of Waste-to-Energy Incineration on Climate, Policy Briefing; Zero Waste Europe: Ixelles, Belgium, 2019. [Google Scholar]
  38. Klima Oslo. Available online: https://www.klimaoslo.no/2021/02/26/the-klemetsrud-carbon-capture-project/ (accessed on 10 May 2021).
  39. David, T. Kearns Waste-to-Energy with CCS: A Pathway to Carbon-Negative Power Generation; Global CCS Institute: Brussels, Belgium, 2019. [Google Scholar]
  40. Hung, P.C.; Chang, S.H.; Lin, S.H.; Buekens, A.; Chang, M.B. Pilot tests on the catalytic filtration of dioxins. Environ. Sci. Technol. 2014, 48, 3995–4001. [Google Scholar] [CrossRef]
  41. Sevilla, M.; Fuertes, A. CO2 adsorption by activated templated carbons. J. Colloid Interface Sci. 2012, 366, 147–154. [Google Scholar] [CrossRef] [PubMed] [Green Version]
  42. Jones, F.; Blomqvist, E.; Bisaillon, M.; Lindberg, D.; Hupa, M. Determination of fossil carbon content in Swedish waste fuel by four different methods. Waste Manag. Res. 2013, 31, 1052–1061. [Google Scholar] [CrossRef] [PubMed]
  43. Clerens, P.; Thuau, A. The Role of Waste-to-Energy (WtE) in the EU’s Long-Term Greenhouse Gas Emissions Reduction Strategy. In Proceedings of the IRRC Waste to Energy, Vienna, Austria, 14–15 October 2019. [Google Scholar]
  44. Hwang, K.; Choi, S.M.; Kim, M.; Heo, J.; Zoh, K. Emission of greenhouse gases from waste incineration in Korea. J. Environ. Manag. 2017, 196, 710–718. [Google Scholar] [CrossRef] [PubMed]
  45. Choi, E.; Eum, H.; Seo, Y.; Yi, S.; Lee, H. Variability of nitrous oxide and carbon dioxide emissions continuously measured in solid waste incinerators. J. Mater. Cycles Waste Manag. 2018, 20, 832–843. [Google Scholar] [CrossRef]
  46. Bellona Europa. Ana Serdoner Waste Incineration and Carbon Capture and Storage; Bellona Europa: Oslo, Norway, 2021. [Google Scholar]
  47. Rajaeifar, M.A.; Ghanavati, H.; Dashti, B.B.; Heijungs, R.; Aghbashlo, M.; Tabatabaei, M. Electricity generation and GHG emission reduction potentials through different municipal solid waste management technologies: A comparative review. Renew. Sustain. Energy Rev. 2017, 79, 414–439. [Google Scholar] [CrossRef]
  48. Trilling, A.; Volk, T.; Fortier, M. Climate Change Impacts of Electricity Generated at a Waste-to-Energy Facility. Environ. Sci. Technol. 2021, 55, 1436–1445. [Google Scholar] [CrossRef]
  49. International Energy Agency. World Energy Outlook 2004; International Energy Agency: Paris, France, 2004. [Google Scholar]
  50. Adams, T., II; Hoseinzade, L.; Madabhushi, P.B.; Okeke, I.J. Comparison of CO2 Capture Approaches for Fossil-Based Power Generation: Review and Meta-Study. Processes 2017, 5, 44. [Google Scholar] [CrossRef] [Green Version]
  51. US Department of Energy National Energy Technology Laboratory. 2020. Available online: https://netl.doe.gov/coal/carbon-capture/post-combustion (accessed on 8 February 2021).
  52. Jurado, N.; Darabkhani, H.G.; Anthony, E.J.; Oakey, J.E. Oxy-Fuel Combustion for Carbon Capture and Sequestration (CCS) from a Coal/Biomass Power Plant: Experimental and Simulation Studies; Springer: Cham, Switzerland, 2015. [Google Scholar]
  53. Metz, B.; Davidson, O.; de Coninck, H.; Loos, M.; Meyer, L. Carbon Dioxide Capture and Storage; IPPC: Rome, Italy; Cambridge University Press: Cambridge, UK, 2005. [Google Scholar]
  54. Samanta, A.; Zhao, A.; Shimizu, G.K.H.; Sarkar, P.; Gupta, R. Post-combustion CO2 capture using solid sorbents: A review. Ind. Eng. Chem. Res. 2012, 51, 1438–1463. [Google Scholar] [CrossRef]
  55. Gui, M.M.; Yap, Y.X.; Chai, S.P.; Mohamed, A.R. Multi-walled carbon nanotubes modified with (3-aminopropyl) triethoxysilane for effective carbon dioxide adsorption. Int. J. Green. Gas Control. 2013, 14, 65–73. [Google Scholar] [CrossRef]
  56. Sevilla, M.; Fuertes, A.B. Ageneral and facile synthesis strategy towards highly porous carbons: Carbonization of organic salts. J. Mater. Chem. 2013, 1, 13738–13741. [Google Scholar] [CrossRef] [Green Version]
  57. Zhang, X.; Li, W.; Lu, A. Designed porous carbon materials for efficient CO2 adsorption and separation. New Carbon Mater. 2015, 30, 481–501. [Google Scholar] [CrossRef]
  58. Wang, R.; Lang, J.; Yan, X. Effect of surface area and heteroatom of porous carbon materilas on electrochemical capacitance in aqueous and organic electrolytes. Sci. China Chem. 2014, 57, 1570–1578. [Google Scholar] [CrossRef]
  59. Choma, J.; Kloske, M.; Dziura, A.; Stachurska, K.; Jaroniec, M. Preparation and Studies of Adsorption Properties of Microporous Carbon Spheres. Eng. Prot. Environ. 2016, 19, 169–182. [Google Scholar] [CrossRef]
Figure 1. Methodology of emission specification for the proposed waste incineration plant (LCV denotes the lower calorific value and λ, the excess air).
Applsci 12 05236 g001
Figure 2. Simulated furnace in Ebsilon with two different amounts of excess air ratio; 1.5 (left side of the figure) and 2 (right side of the figure). This shows the effect of the excess air ratio on the mass flow of air required to be loaded into the furnace, the volumetric flue gas, flue gas temperature, and the emissions for the same MSW mass flow.
Applsci 12 05236 g002
Figure 3. Arrangement of an SCR system in the flue gas treatment of the plant [28].
Applsci 12 05236 g003
Figure 4. Results of CO2, O2, and air mass flow obtained from the calculation model.
Applsci 12 05236 g004
Figure 5. Flue gas temperature and density with CO2 emissions (simulated in Ebsilon).
Applsci 12 05236 g005
Figure 6. Air ratio and CO2 emissions.
Applsci 12 05236 g006
Figure 7. Simulated selective non-catalytic reduction (SNCR) technology for NOx emissions in Ebsilon (190 ppm = 357.5 mg/Nm3).
Applsci 12 05236 g007
Figure 8. Flue gas cleaning system for the proposed incineration facility (simulated in Ebsilon).
Applsci 12 05236 g008
Figure 9. Emission concentrations (SO2, NO2, HCL, and CO2) before and after the treatment process as a function of excess air. (a) Excess air 1.5. (b) Excess air 2. (c) Excess air 2.5. (d) CO2 emissions before exposing to reduction process. (e) CO2 emissions after exposing to reduction process.
Applsci 12 05236 g009aApplsci 12 05236 g009bApplsci 12 05236 g009c
Table 1. Elementary analyses of the composition of raw waste collected in Jordan [12].
ParameterSymbolUnitValue
Water contentW%60
Total solid contentTS%40
Fuel ashA% of TS15
CarbonC% of TS46.0
HydrogenH2% of TS6.5
OxygenO2% of TS45.85
NitrogenN2% of TS0.9
SulfurS% of TS0.2
ChlorineCl% of TS0.55
Table 2. The chemical properties of interacting carbon with air in the furnace.
ReactantsResulting Material
CO2N2CO2N2
No. of moles113.7613.76
Atomic weights12.013228.0244.0128.02
Molecular weights12.0132105.3644.01105.36
Material weight to carbon weight12.668.773.668.77
Table 3. The chemical properties of interacting carbon with 20% excess air.
ReactantsResulting Material
CO2N2CO2N2O2
No. of moles11.2(1.2 + 3.76)1(1.2 + 3.76)0.2
Atomic weights12.013228.0244.0128.0232
Molecular weights12.0138.4138.944.01138.96.4
Material weight to carbon weight13.1911.573.6611.570.53
Table 4. The chemical properties of hydrogen interacting with air.
ReactantsResulting Material
H2O2N2H2ON2
No. of moles113.7623.76
Atomic weights2.023228.0218.0228.02
Molecular weights2.0232105.3635.04105.36
Material weight to carbon weight17.9226.088.9226.08
Table 5. Typical combustion parameters for stoichiometric conditions (adapted from [20,21]).
LCV (KJ/kg)Dry Flue Gas (kg/MJ)Water Vapor (kg/MJ)
4218.110.3590.03
5279.50.3770.028
6333.50.3660.027
7386.50.360.026
8440.50.350.025
9493.40.3470.024
10,555.80.3430.024
11,608.80.340.024
12,662.80.3370.024
13,715.70.3350.023
14,769.70.3330.023
15,822.70.3320.023
16,885.10.330.023
17,938.10.3290.022
Table 6. Characteristics of real incineration facilities (adapted from [23]).
FacilityWaste TypeFlow Rate (m3/h)CO2Volume %O2
Volume %
Auxiliary Fuel (m3/day)Amount of Daily Waste InputGross Calorific Value (KJ/kg)
AMSW50,8888.5610.6277917614,690
BMSW57,2509.759139021313,840
CMSW57,42310.28.79 23614,650
DMSW36,1209.7210 11413,540
EIW62,3716.9512.7 17332,260
FIW32,7128.6810.8 9025,470
GIW15,0828.2911.4 6631,460
Table 7. The chemical properties of cellulose interacting with air.
ReactantsResulting Material
C6H10O5O2N2CO2H2ON2
No. of moles16(6 × 3.76)6522.56
Atomic weights162.163228.0244.0118.0228.02
Molecular weights162.16192632.13264.0690.1632.13
Material weight to carbon weight11.193.91.630.563.9
Table 8. Applicable emissions for waste-to-energy (WtE) plants in Europe [13,28].
PollutantIED (2010)BREF WI Final Draft 2018
BAT-AEL
New PlantOld Plant
NOx (mg/Nm3 at 11% O2)20050–12050–150
NH3 (mg/Nm3 at 11% O2) 2–102–10
PCDD/F I-TEQ (ng/Nm3 at 11% O2)0.1<0.01–0.04<0.01–0.06
PCDD/F + Dioxin like PCBs-<0.01–0.06<0.01–0.08
Hg <5–20<5–20
Industrial Emissions Directive (IED), BREF: is the best available technique (BAT).
Table 9. Evolution of the emission limit value for waste incineration between the industrial emission directive (IED) and the latest waste incineration (WI) best available technique reference (BREF) document (for heavy metals the average is taken over the sampling period) [29].
Emission Limit mg/Nm3 Dry
(Corrected at 11% O2)
IED 2010BREF 2018
SO2 daily average505–30
HCl daily average102 to 6
HF daily average11<
Dust-<2–5
Cd + TI-0.005–0.02
Sb +As + Pb + Cr + Co + Cu + Mn + Ni + V-0.01–0.3
Table 10. Volumes of O2 and CO2 in flue gas and the air mass flow required in the furnace (verified using the model calculation and Ebsilon simulation).
Excess Air (λ)MSW Mass Flow (kg/s)Calculated Volumetric Flue Gas Flow
(m3/kg Fuel)
Model CalculationsEbsilon Results
O2 (%)CO2 (%)Air Mass Flow (kg/s)O2 (%)CO2 (%)Air Mass Flow (kg/s)
1.5252.55515545.414.451.5
2252.6781269.48.811.668.7
2.5252.781288611.29.785.8
1.5302.5551562.45.414.461.8
2302.6781283.38.811.682.4
2.5302.7812910411.29.8103
Table 11. Input and output parameters of the combustion chamber.
Combustion Chamber (Input)
MSW
valueunit
Mass flow25Kg/s
Temperature50°C
LCV7MJ/kg
Air
Mass flow150Kg/s
Temperature25°C
Combustion chamber (output)
Flue Gas
Mass flow171Kg/s
Temperature931°C
Pressure0.8bar
Ash
Mass flow3Kg/s
Temperature931°C
NO2
Concentration190ppm
Table 12. Molar weights and emissions concentrations of sulfur oxides and hydrochloric acids.
CompoundMolar Weight (g/mol)Ebsilon Emissions
Before Treatment (mg/m3)
Ebsilon Emissions
After Treatment (mg/m3)
Ca(OH)274.093reagentReagent
SO264.06451.9622.53
HCl36.45364.073.64
Table 13. CO2 emissions before and after the reactor of CO2 purification.
CompoundMolar Weight (g/mol)Ebsilon Emissions
before Treatment (mg/m3)
Ebsilon Emissions
after Treatment (mg/m3)
CO244.01180,960.664014.7
Table 14. Results of the simulated flue gas cleaning emissions system for 25 kg/s of MSW.
Emissions [mg/Nm3]
MSW Mass Flow [kg/s]Air Mass Flow [kg/s]Air Temperature °CExcess Air RatioFlow Rate of Flue Gas [m3/s]Flue Gas Temperature °C C O 2 N O 2 S O 2 H C L Point
2551.51201.5310.51146258,514.40749.90890.20717.001
2551.51201.5310.51146258,514.40180.00890.20717.002
2551.51201.5137.4325258,514.40180.00890.20717.003
2551.51201.5137.4325258,514.40180.0044.507.164
2551.51201.5851296023.90180.0044.507.165
2568.61802337998209,294.70606.80720.50580.001
2568.61802337998209,294.70145.40720.50580.002
2568.61802166325209,294.70145.40720.50580.003
2568.61802166325209,294.70145.4035.805.604
2568.618021041294728.20145.4035.805.605
2585.81902.5375931175,855.40509.40604.70486.001
2585.81902.5375931175,855.40122.30604.70486.002
2585.81902.5195325175,855.40122.30604.70486.003
2585.81902.5195325175,855.40122.3030.304.804
2585.81902.51241293892.30122.3030.304.805
Table 15. Summary of results of the flue gas emission cleaning system.
Emissions [mg/Nm3]
Excess Air Ratio C O 2 N O 2 S O 2 H C L Point
1.5258,514.40749.90890.20717.001
6023.918044.57.165
2209,294.7606.8720.55801
4728.2145.435.85.65
2.5175,855.4509.4604.74861
3892.3122.330.34.85
Publisher’s Note: MDPI stays neutral with regard to jurisdictional claims in published maps and institutional affiliations.

