Article

Model of Emotion Judgment Based on Features of Multiple Physiological Signals

1
School of Media and Design, Hangzhou Dianzi University, Hangzhou 310018, China
2
College of Computer Science and Technology, Zhejiang University, Hangzhou 310027, China
3
College of Control Science and Technology, Zhejiang University, Hangzhou 310027, China
*
Author to whom correspondence should be addressed.
Appl. Sci. 2022, 12(10), 4998; https://doi.org/10.3390/app12104998
Submission received: 11 April 2022 / Revised: 11 May 2022 / Accepted: 12 May 2022 / Published: 15 May 2022
(This article belongs to the Special Issue Human Performance Monitoring and Augmentation)

Abstract

:
The model of emotion judgment based on features of multiple physiological signals was investi-gated. In total, 40 volunteers participated in the experiment by playing a computer game while their physiological signals (skin electricity, electrocardiogram (ECG), pulse wave, and facial electromy-ogram (EMG)) were acquired. The volunteers were asked to complete an emotion questionnaire where six typical events that appeared in the game were included, and each volunteer rated their own emotion when experiencing the six events. Based on the analysis of game events, the signal data were cut into segments and the emotional trends were classified. The correlation between data segments and emotional trends was built using a statistical method combined with the questionnaire responses. The set of optimal signal features was obtained by processing the data of physiological signals, extracting the features of signal data, reducing the dimensionality of signal features, and classifying the emotion based on the set of signal data. Finally, the model of emotion judgment was established by selecting the features with a significance of 0.01 based on the correlation between the features in the set of optimal signal features and emotional trends.

1. Introduction

With the rapid development of human–computer interaction technology and the upgrading of computer, network, and radio communication technology, higher requirements for aninteractive experience, i.e., more in line with being “people-centered”, are being put forward. There are three levels in the human–computer interaction: (1) physical level, i.e., operation method and mechanical relationship between human and computer, involving to the hardware equipment; (2) cognitive level, i.e., information exchange between human and computer, involving to the operating system; (3) emotional level, i.e., communication between human and computer, interactive experience of humans, and degree to which computers understand humans, to the intelligence and feedback of computer. In this paper, we focus on the emotional level.
Emotion plays a very important role in our life. In addition to reflecting people’s current physiological and psychological state, emotion is also a key factor in determining people’s cognitive process, communication, and decision-making ability. In order to successfully recognize emotion according to people’s physiological signals through human–computer interaction, there are two important aspects to focus on. One is the model of emotion discrimination based on physiological signals, and this model is used as the comparison standard for emotion recognition; another is the naturalization of the interaction process. Physiological signals include electromyography (EMG), electrocardiogram (ECG), skin electrical signal, pulse wave signal, and so on. The pulse wave signal has clear mechanical features of blood flow but is used less in the related research based on the recognition of the physiological signal.
There have been some studies on the emotion judgment according to the features of the physiological signal. Zhou et al. [1] studied whether auditory stimuli could be used as an effective elicitor as visual stimuli for emotion prediction, and results showed that auditory stimuli were as effective as visual stimuli in eliciting emotions in terms of systematic physiological reactivity. Liapis et al. [2] identified a specific stress region in the valence-arousal (V-A) space by combining self-reported ratings and skin conductance, the results showed which regions in the V-A rating space might reliably indicate self-reported stress that was in alignment with one’s measured skin conductance. They also proposed an approach for the empirical identification of affect regions in the V-A space based on physiological signals. Yan et al. [3] presented a multimodal emotion classification framework using multichannel physiological signals and introducing hybrid feature extraction and adaptive decision fusion, they indicated the necessity of using event-related features and the importance of developing adaptive decision fusion strategies for emotion classification. Fu et al. [4] proposed the use of human physiological signals as a new form of modality in determining human affects, in a non-intrusive manner, and computed and derived human physiological signals with photople-thysmography signals. They argued that their research would provide a new dimension for multimodal affective computing research. Yoo et al. [5] proposed a method that could recognize human emotional states, such as joy, happiness, fear, anger, despair, and sadness from bio-signals, and the results showed that the proposed method could distinguish one emotion compared to all other possible emotional states and had a good accuracy performance. Jang et al. [6] assessed the reliability of physiological changes induced by happiness, sadness, anger, fear, disgust, and surprise that were measured during 10 weekly repeated experiments, and extracted skin conductance level (SCL), fingertip temperature (FT), heart rate (HR), and blood volume pulse (BVP) from the physiological signals. The results showed that SCL, HR, and BVP were more reliable than those assessed at baseline and exhibited excellent internal consistency and interrater reliability. Sepulveda et al. [7] improved the performance of emotion recognition from ECG signals using wavelet transform for signal analysis, and the results showed that the proposed algorithm for extracting features and classifying the signals obtained an accuracy of 88.8% in the valence dimension, 90.2% in arousal, and 95.3% in a two-dimensional classification. Zhang et al. [8] proposed a regularized deep fusion framework for emotion recognition based on multimodal physiological signals, and the results showed that this framework could improve the performance of subject-independent emotion recognition compared to single-modal classifiers or other fusion methods, and it exhibited higher class-separability power for emotion recognition. Khezri et al. [9] proposed a new adaptive method for fusing multiple emotional modalities to improve the performance of the emotion recognition system, and the overall classification accuracies of 84.7% and 80% were obtained in identifying the emotions, respectively, using support vector machine and k-nearest neighbor classifiers. Feng et al. [10] presented an automated method for emotion classification in children using electro-dermal activity (EDA) signals and conducted various experiments on the annotated EDA signals to classify emotions using a support vector machine classifier, the results showed that the emotion classification performance remarkably improved compared to other methods when the proposed wavelet-based features were used. Yang et al. [11] proposed a method of affective image classification based on information about the user’s experience collected through measurable eye movements and electroencephalography signals, the results showed that the method was accurate and successful in identifying images that could lead to a pleasurable experience.
It can be seen from the above research results that most previous studies use a single physiological signal to obtain a single emotional model, which can easily lead to bias in emotional judgment. In order to improve the performance of emotion recognition system, further research on fusing multiple emotional modalities using multiple physiological signals is needed. Therefore, this paper aims to establish a model of emotion judgment based on the features of multiple physiological signals through an experiment of playing a game. Based on the newly established model, we can judge the emotion according to people’s physiological signals more accurately, so that human–computer interaction can play its role more effectively in practical application and life.

2. Description of Experiment

In the process of the data acquisition of physiological signals, no deliberate guidance in terms of pictures or audio is given to the subjects in order to obtain the subjects’ natural emotions in the daily environment. Games are one of the best activities to naturally awaken subjects’ emotions. During the experiment, the subjects operated the game freely, which ensures that all complex emotions are generated under the stimulation of different game events. In the process of playing the game, the signals of skin electricity, ECG, pulse wave, and facial EMG of subjects are acquired through human–computer interaction. After that the data features based on the various signals are computed and classified, and the model of emotion judgment is established using a statistical method combined with a subjective questionnaire on emotion.

2.1. Experiment Content and Object

In view of different preference, adaptation, and personality of each individual for the game, a test of Bran Hex player type on the subjects who intended to participate in the experiment was first conducted. The test included age, gender, game experience, and other relevant background. After testing, 40 subjects with relatively average distribution of player types were selected to participate in the experiment. All subjects were between the ages of 24 and 30 and consisted of 13 women and 27 men. They had normal visual acuity or corrected visual acuity and physical and mental health and could operate a computer skillfully. The experimental game is Nintendo’s classic horizontal version of the adventure game Super Mario. The rules of the game are simple, the operation is convenient, and the number of game events that can be triggered is small, but the classification is clear. Additionally, it is the player’s operation rather than the game plot that dominates the promotion of the game, so that there are few factors that interfere with the emotional changes of players’ interaction, which meets the experimental needs. Each subject played two games, including 6 levels and 10 game opportunities. The game ends when all opportunities are used up. The experiment was conducted indoors with a quiet environment in order to reduce external interference. The facial expressions, game pictures, and the whole game process were recorded by software.

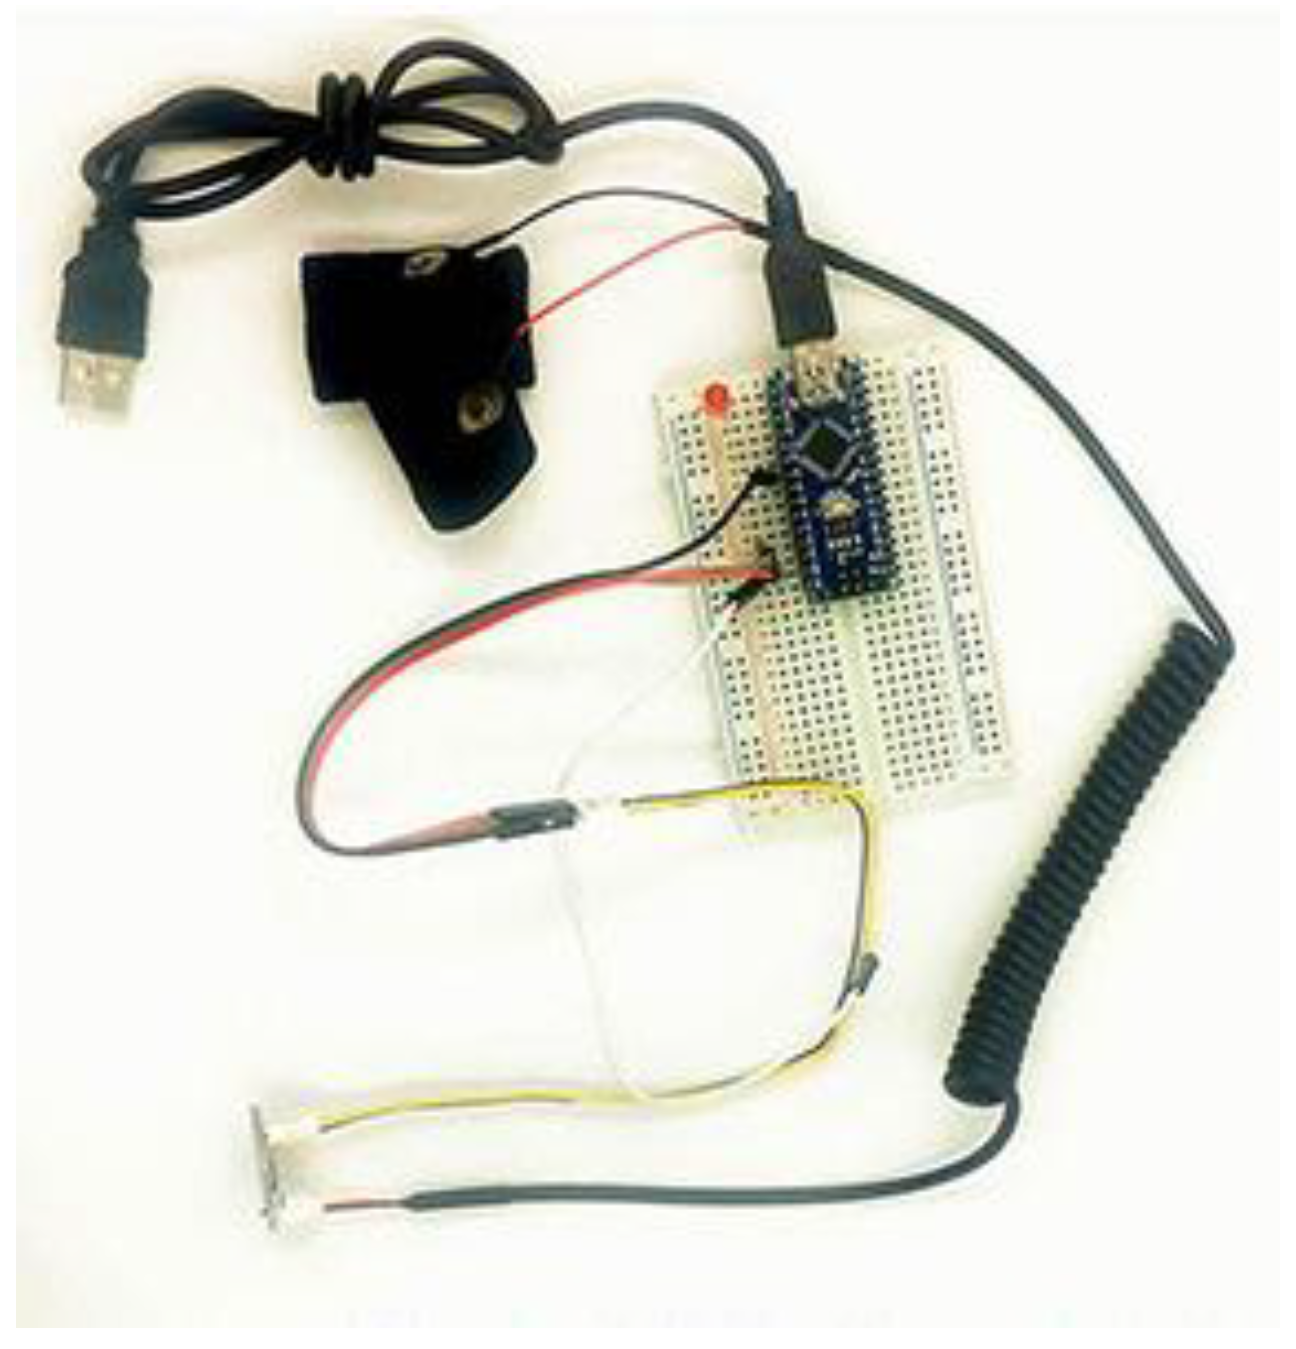
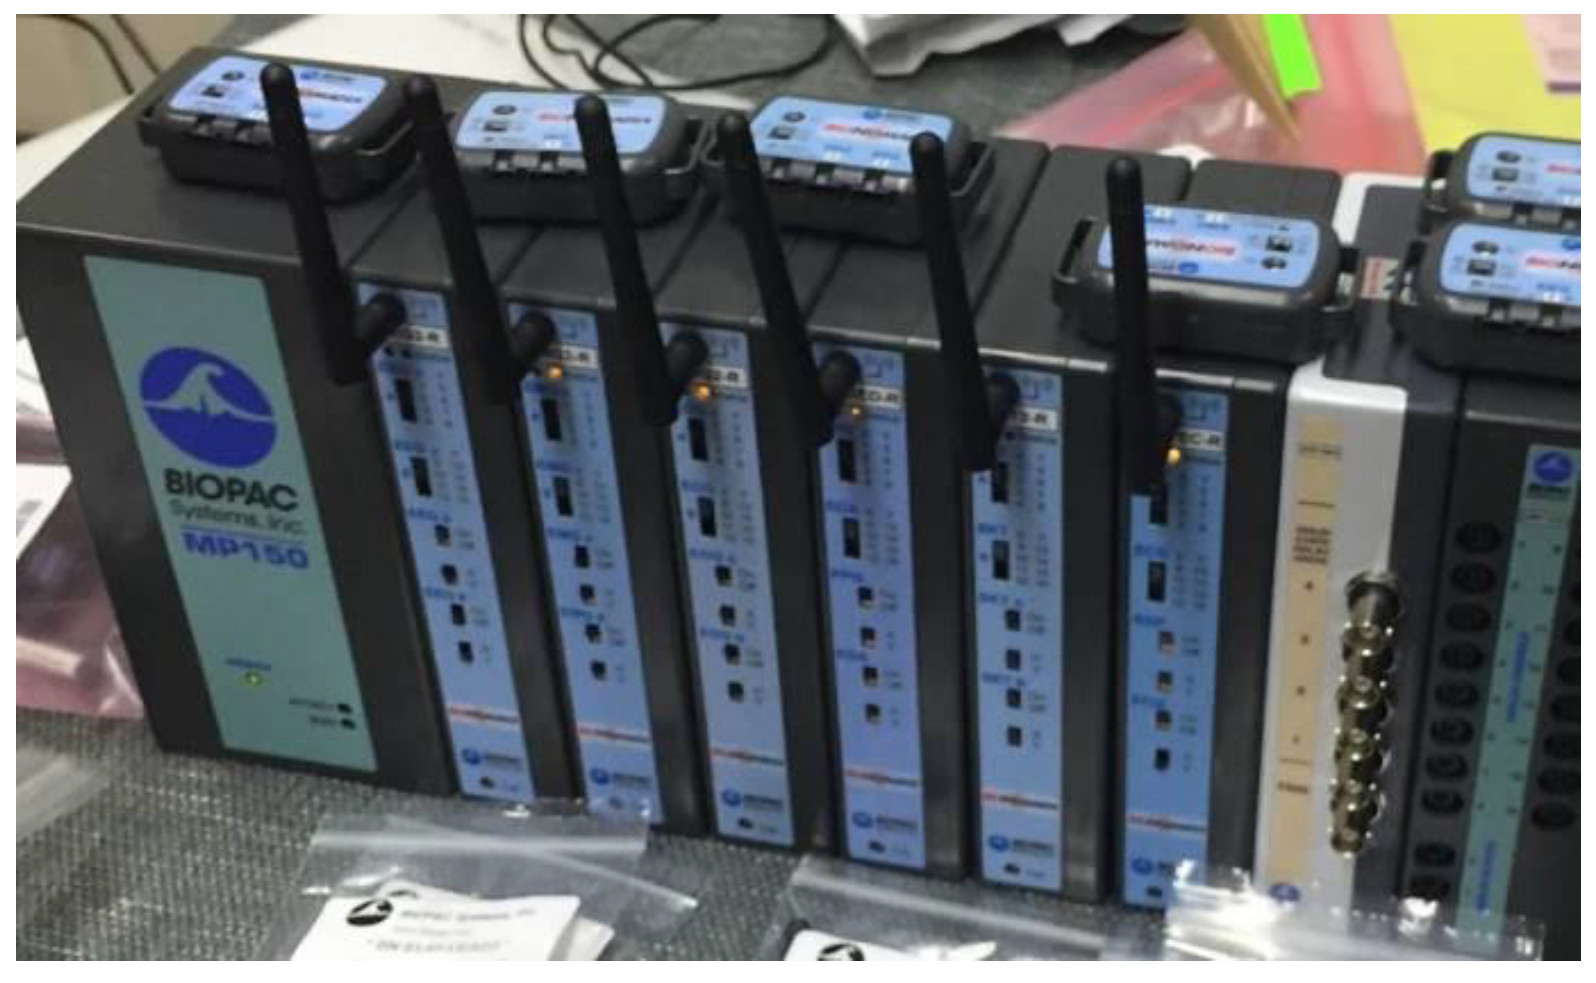
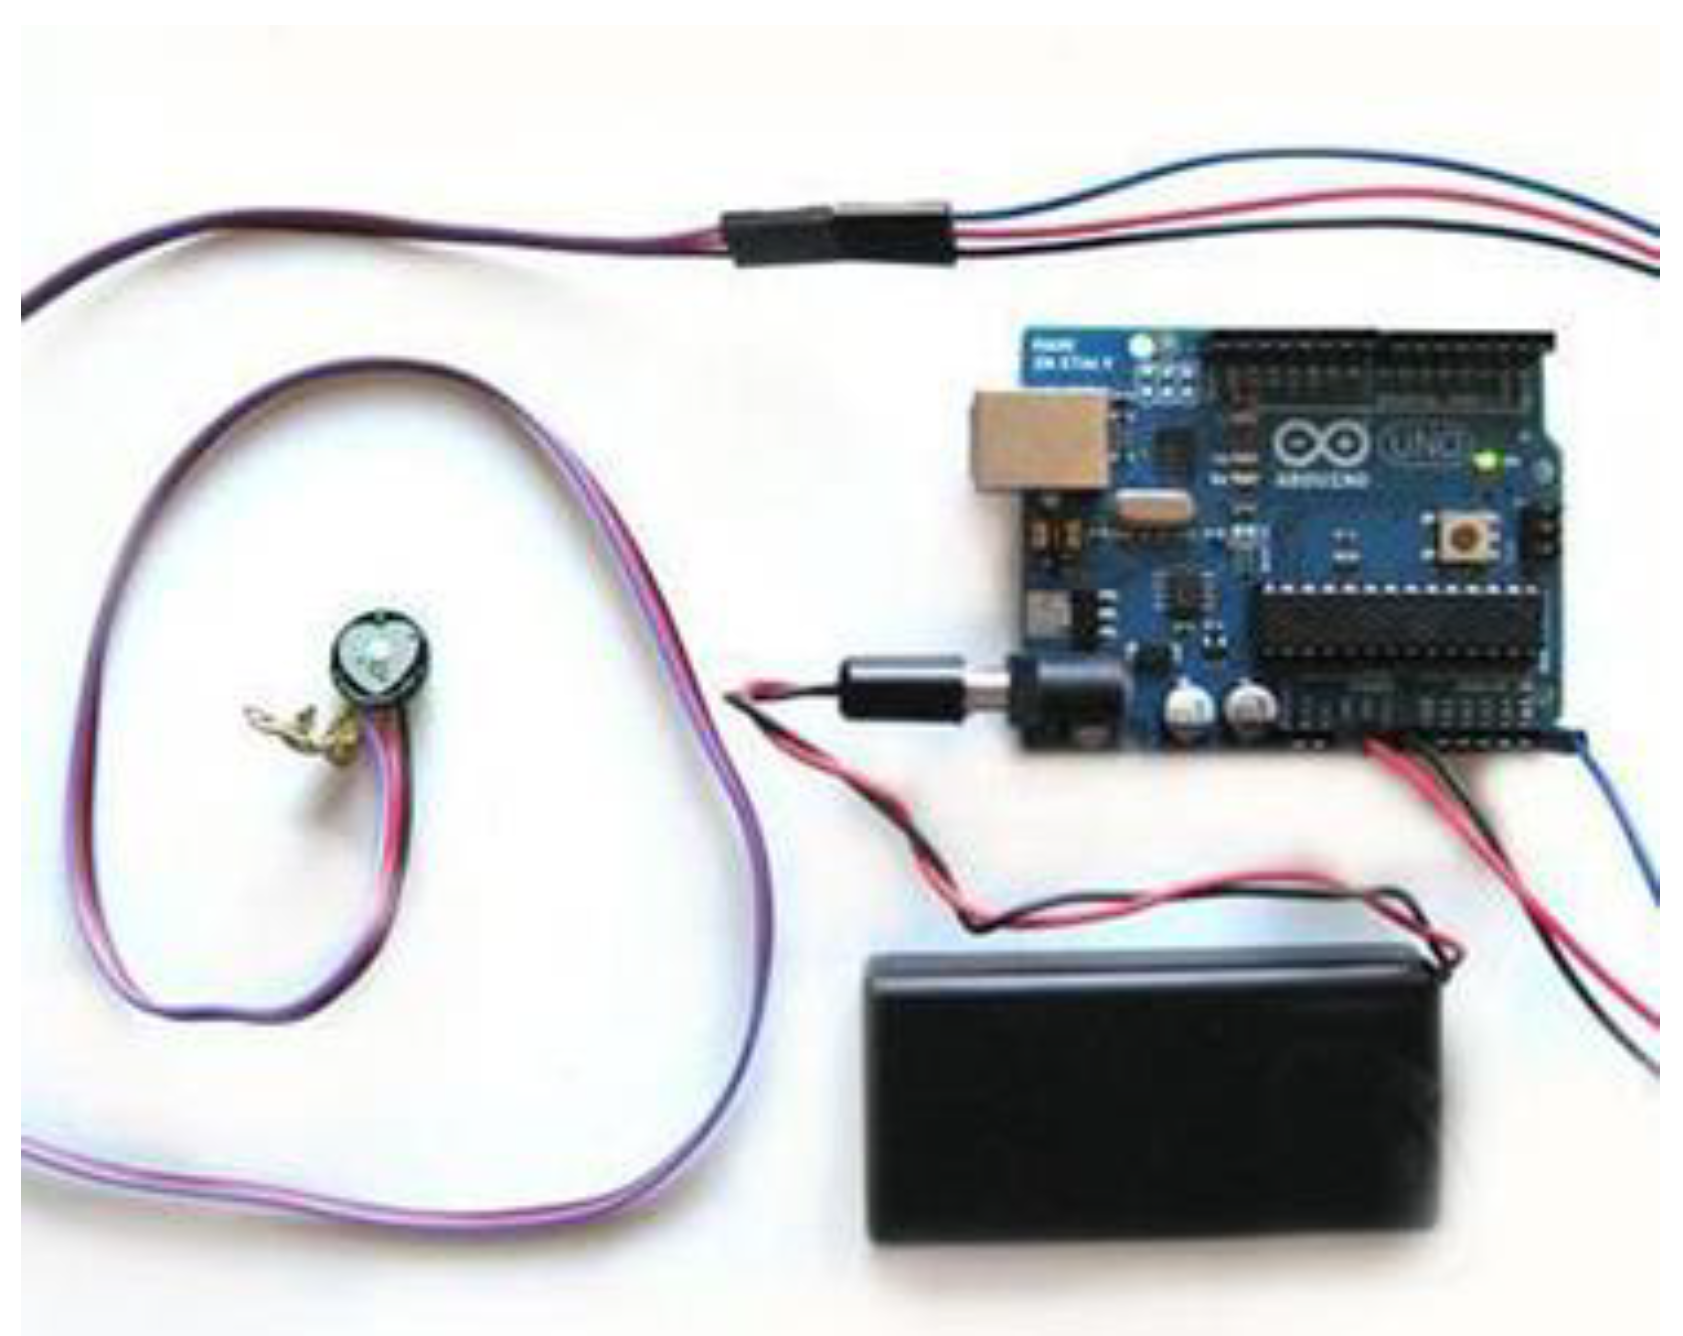
2.2. Experimental Apparatus

The device of the experimental game was a computer with a 23.8-inch screen and headphones. All operations during the game were completed through the computer keyboard. In order not to affect the data extraction of the sensor, all the keys that may be used in the game were set to the right-hand area because the sensors were worn on the subject’s left hand as shown in Figure 1.
An EMG100c amplifier and ECG100c amplifier in BIOPAC MP150 physiological multi-channel recorder were used to acquire the signals of facial EMG and ECG, respectively, as shown in Figure 2. The skin electrical signal is acquired using a Grove-GSR skin electrical kit, as shown in Figure 3. Two finger sleeves containing electrodes were put on the middle part of the middle finger and the thumb of the left hand, and the frequency of signal sampling was 20 Hz. A pulse sensor, as shown in Figure 4, was used to acquire the signals of the pulse wave and heart rate. The pulse sensor was fixed on the tip of the middle finger of the left hand with a bandage, and the frequency of signal sampling was 100 Hz. Sensors were connected to another notebook computer to acquire physiological signals through an Ardunio board. The physiological signal data of each game opportunity for each subject were saved as a separate file.

2.3. Subjective Questionnaire

The subjects were asked to complete a questionnaire of subjective emotion when all games were finished. In the questionnaire, six typical events that appeared in the game were selected, which included three events that could produce a positive impact and three events that could produce a negative impact, as shown in Figure 5. Each subject was asked to evaluate their own experience and emotion when they encountered the corresponding typical event. The six events are shown in Table 1 where “P” and “N” represent positive and negative, respectively.
Russell’s valence-arousal (V-A) model is referenced for the emotion evaluation. In this model, V as a horizontal axis indicates the degree of emotional pleasure, and A as a vertical axis indicates the degree of emotional arousal. After referring to the discrete emotion classification, four poles of the two-dimensional emotion classification model are extracted, and are used to represent four emotions: fatigue, tension, happiness, and sadness.
Then, the emotion classification system based on V-A model is extended from two-dimensional coordinates into a plane, and four corners of the plane are used to express excitement, relaxation, boredom, and anger, respectively, as shown in Figure 6. In this way, a total of eight kinds of emotions were extracted. The subjects were asked to rate the eight emotions under each listed game event because of the emotional complexity of the interactive experience; the lowest score is 0, i.e., subject does not feel the emotion, and the highest score is 5, i.e., the emotion is very strong.

2.4. Analysis of Questionnaire Response

The subjects rated the emotions of six game events and put them into the V-A model, as shown in Figure 6. Finally, P1, P2, and N1 were rated by 40 people, i.e., all subjects experienced these three types of game events; N3 was rated by 34 people; P3 and N2 were rated by 31 people.
The range of each subject’s emotion for each game event and range of the overall emotion of all subjects in a certain game event are obtained by employing the barycenter algorithm based on Figure 6. The four ranges of V-A model are divided into four emotion trends which include high V-high A (HVHA) in the range of happiness-excitement-tension, high V-low A (HVLA) in the range of happiness-relaxation-fatigue, low V-low A (LVLA) in the range of fatigue-boredom-sadness and low V-high A (LVHA) in the range of sadness-anger-tension as shown in Table 2.
The scoring of the questionnaire is analyzed, and the result shows that the subjects’ valence and arousal are high when P1 occurs. Although the subjects have a high degree of valence, they are not strong when P2 and P3 occur. Subjects have slight negative emotion when N3 occurs. The negative emotion of subjects is relatively strong when N1 and N2 occur.

3. Data Analysis of Physiological Signal

Most of the subjects had no obvious changes in facial expression during the game. Therefore, only signals of skin electricity, ECG, and pulse wave are analyzed.

3.1. Processing of Skin Electrical Signal

The skin electrical signal is very weak and easyily disturbed by other signals inside the human body or external environmental factors in the processing.
The noise interference generated by the hardware itself should be removed firstly with Equation (1) given by Grove-GSR:
f ( t ) = Serial _ P _ R [ ( 2014 + 2 × Serial _ P _ R ) × 10000 ] ( 512 Serial _ P _ R )
where Serial_P_R is the displayed data of skin electrical signal, the range is 0~1023.
Wavelet transform (WT) is usually used to denoise physiological signals. Here, the discrete WT is used for facilitating computer analysis and processing:
W T f ( j , k ) = f ( t ) a 0 j 2 ψ ( a 0 j t k τ 0 ) d t
where WTf(j, k) is the WT coefficient, a0 is the scale factor, τ0 is the translation factor, ψ is the basic wavelet function. The discrete WT is a decomposition of the signal which is decomposed into different frequency bands through low-pass and high-pass filtering as shown in Figure 7 where x[n] is a discrete input signal, g[n] is low pass filter, h[n] is high pass filter, Q is down sampling filter, xα,L[n] is:
x α , L [ n ] = k = 0 K 1 x α 1 , L [ 2 n k ] g [ k ] ,     x α , H [ n ] = k = 0 K 1 x α 1 , L [ 2 n k ] h [ k ]
The skin electrical signal is decomposed in three layers, then the wdencmp function in MATLAB is used to denoise the skin electrical signal:
denoisexs = wdencmp(‘gbl’, X, ‘wname’, N, THR, SORH, KEEPAPP),
where THR is the threshold vector, SORH indicates whether a soft or hard threshold is selected, and KEEPAPP is to judge whether the low-frequency coefficient is subjected to threshold quantization; it is not judged when the value is 1, otherwise, the low-frequency coefficient is threshold quantized; gbl represents the same threshold used for each layer, and the threshold is calculated based on:
T sqtuolog = σ 2 log N
where N is number of layers of wavelet decomposition.
Then, all segments of skin electrical signal were normalized, making all signal data within the value range of 0 to 100:
GSR nor = ( GSR n GSR min GSR max GSR min ) × 100
The skin electrical signals of each subject were acquired according to the game picture during the experiment, and the game picture is cut into segments according to the occurrence of each event in order to obtain the corresponding data of physiological signal under the influence of each event as shown in Figure 8. Finally, the number of data segments of physiological signal for various events is: 276, 213, 87, 72, 169, and 223 for P1, P2, P3, N1, N2, and N3, respectively.

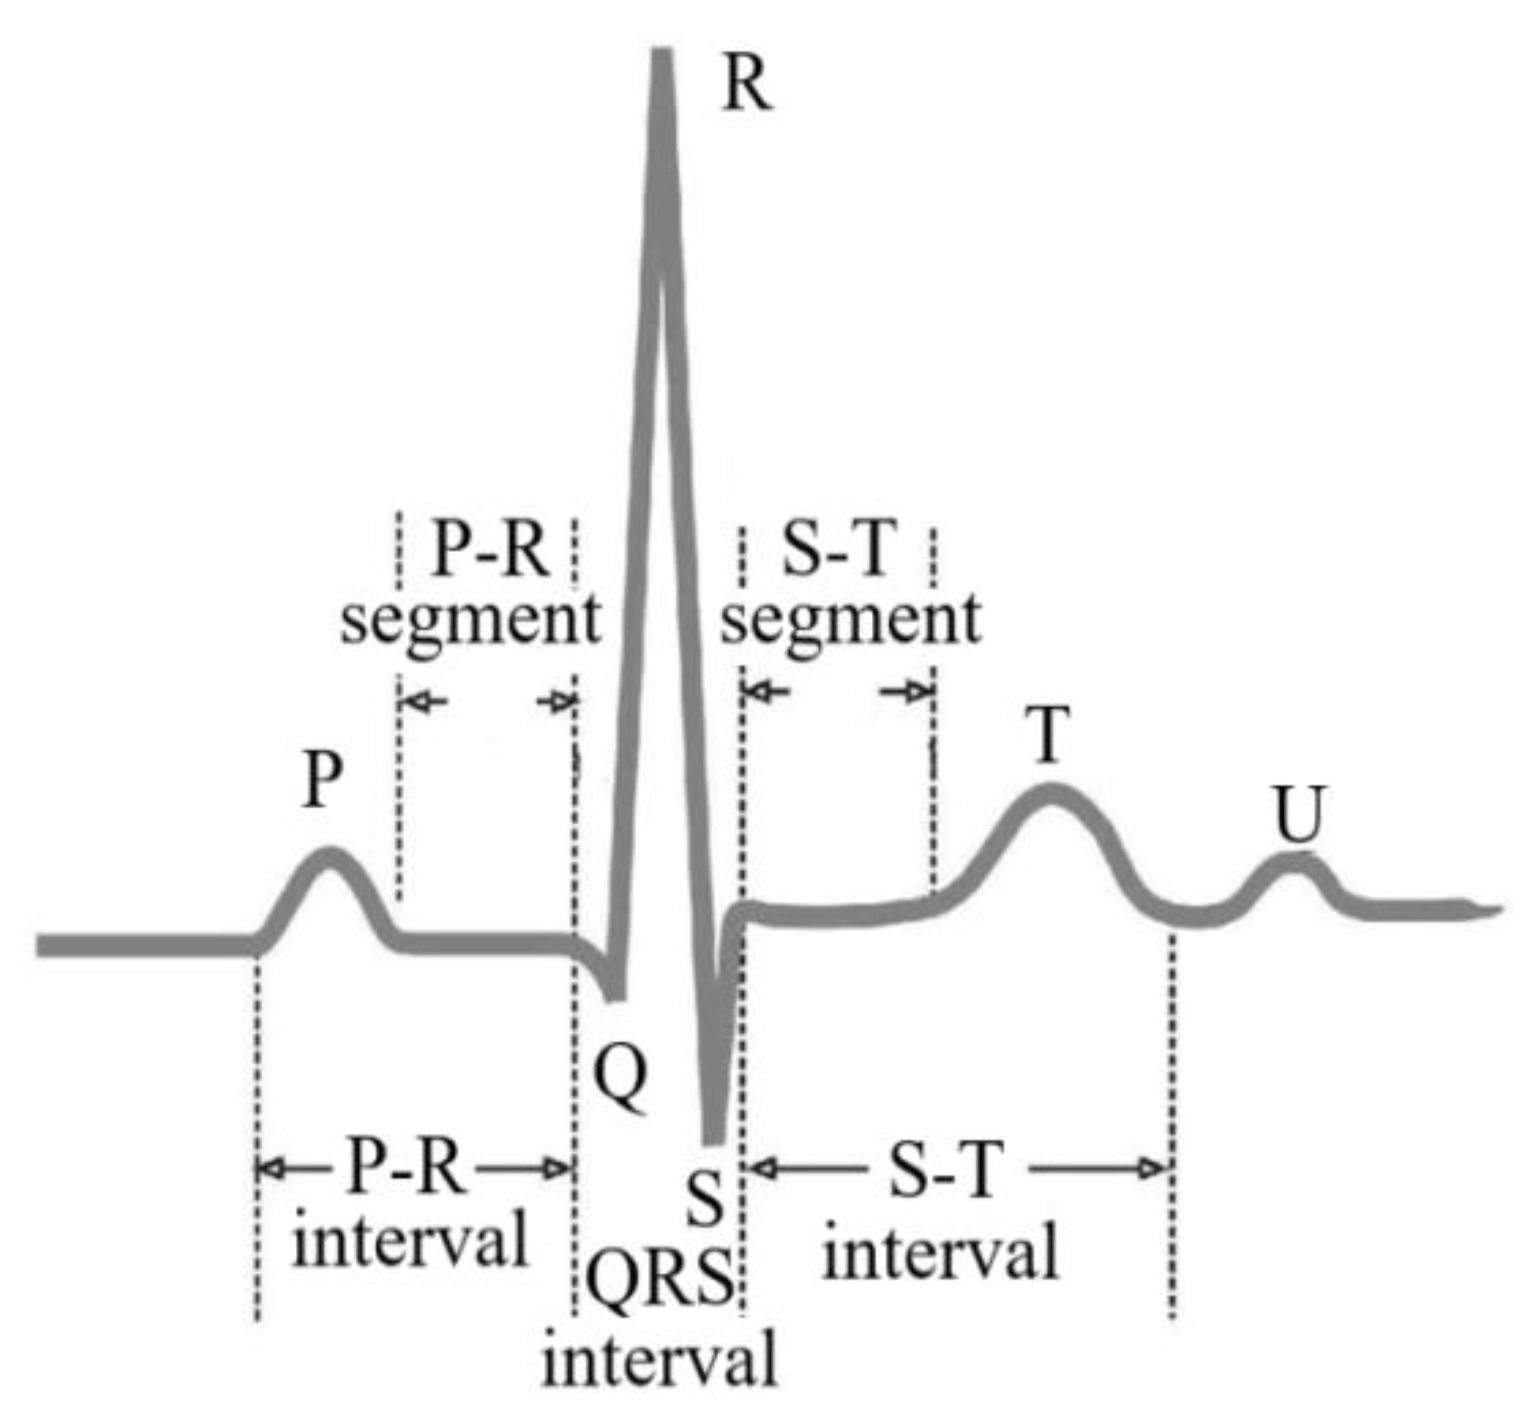
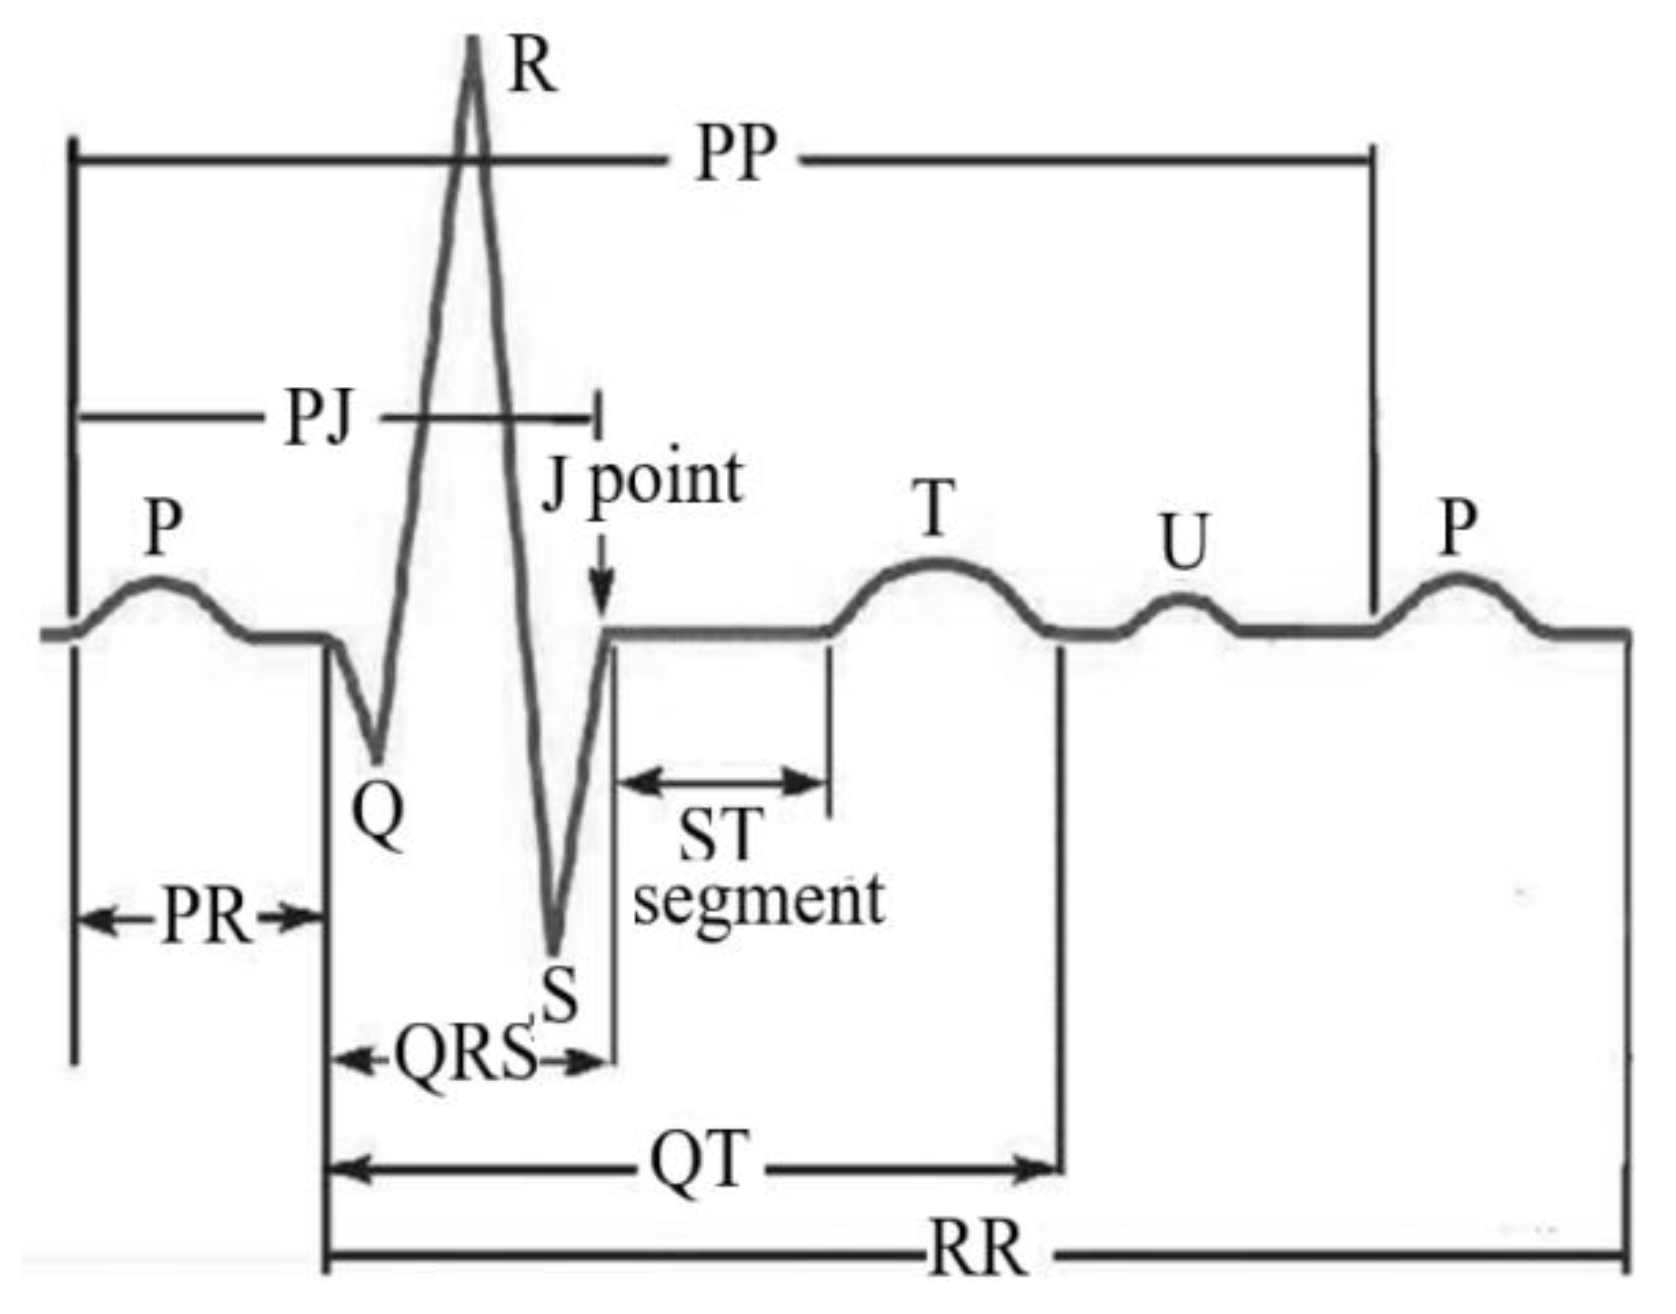
3.2. Processing of ECG Data

Typical ECG waveform is shown in Figure 9, where the ECG shape is divided into single wave (P, T, U wave), QRS composite wave, P-R and Q-T interval, and ST segment; these four parts are combined to form a set of completed P-QRS-T-U waveform.
The frequency band of ECG, QRS composite wave, and P, T wave are generally 0.05~100, 3~40, and 0.5~10 Hz, respectively. The detection of ECG waveform is mainly aimed at QRS wave. Compared with other single waves, the frequency band of QRS wave is more centered, and R wave has high amplitude. Firstly, the repeated signal in the heartbeat interval is eliminated to recover the missed detection signal, and then the WT is used to remove the noise. The heartbeat interval refers to the time interval between two heart beats, and it can be obtained by the RR interval of ECG signal. The RR interval is the time interval between the peaks of two adjacent R waves in the time domain as shown in Figure 10.
The 20% rule is used to give the abnormal judgment of RR interval [12]. This rule means the two RR intervals belong to abnormal RR intervals when the difference between the current RR interval and the nearest previous RR interval exceeds 20% of the previous RR interval. This kind of abnormality is usually modified by using the method of difference replacement. An adaptive filtering method of abnormal RR interval was proposed to solve this problem. There are the following main steps in this method: (1) Removing the obviously abnormal RR interval less than 200 ms which is the heartbeat interval for human to reach difficultly. (2) Proportional adaptive filtering is adopted for the signals:
t n = ( x n 3 + 6 x n 2 + 15 x n 1 + 20 x n + 15 x n + 1 + 6 x n + 2 + x n + 3 ) / 64
where [x1, x2, …, xn] is the signals of heartbeat interval. (3) The adaptive mean μa and standard deviation σa are calculated with tn sequence:
μ a ( n ) = μ a ( n 1 ) c [ μ a ( n 1 ) t n 1 ] ,     σ a ( n ) = μ a ( n ) 2 λ a ( n )
where c is the control coefficient. When RR interval xn satisfies:
| x n x n 1 | > p 100 x n 1 + c f σ ¯ a ,   a n d   | x n x η | > p 100 x η + c f σ ¯ a
the abnormal RR interval will be replaced by a random number in the interval of [μa(n) − σa(n)/2, μa(n) + σa(n)/2]. In Equation (8), p is the proportional threshold, xη is the last valid RR interval, and σ ¯ a is the average value of σa. (4) The new sequence obtained is filtered adaptively again, and new adaptive mean μa and standard deviation σa are calculated again till the new sequence satisfies:
| x n μ a ( n ) | > c f σ a ( n ) + σ b
this point is considered as abnormal point and is replaced.
In the processing of ECG data, the method of WT and cutting signal segments, and normalization of each signal segment are the same as that in the processing of skin electrical signal in Section 3.1.

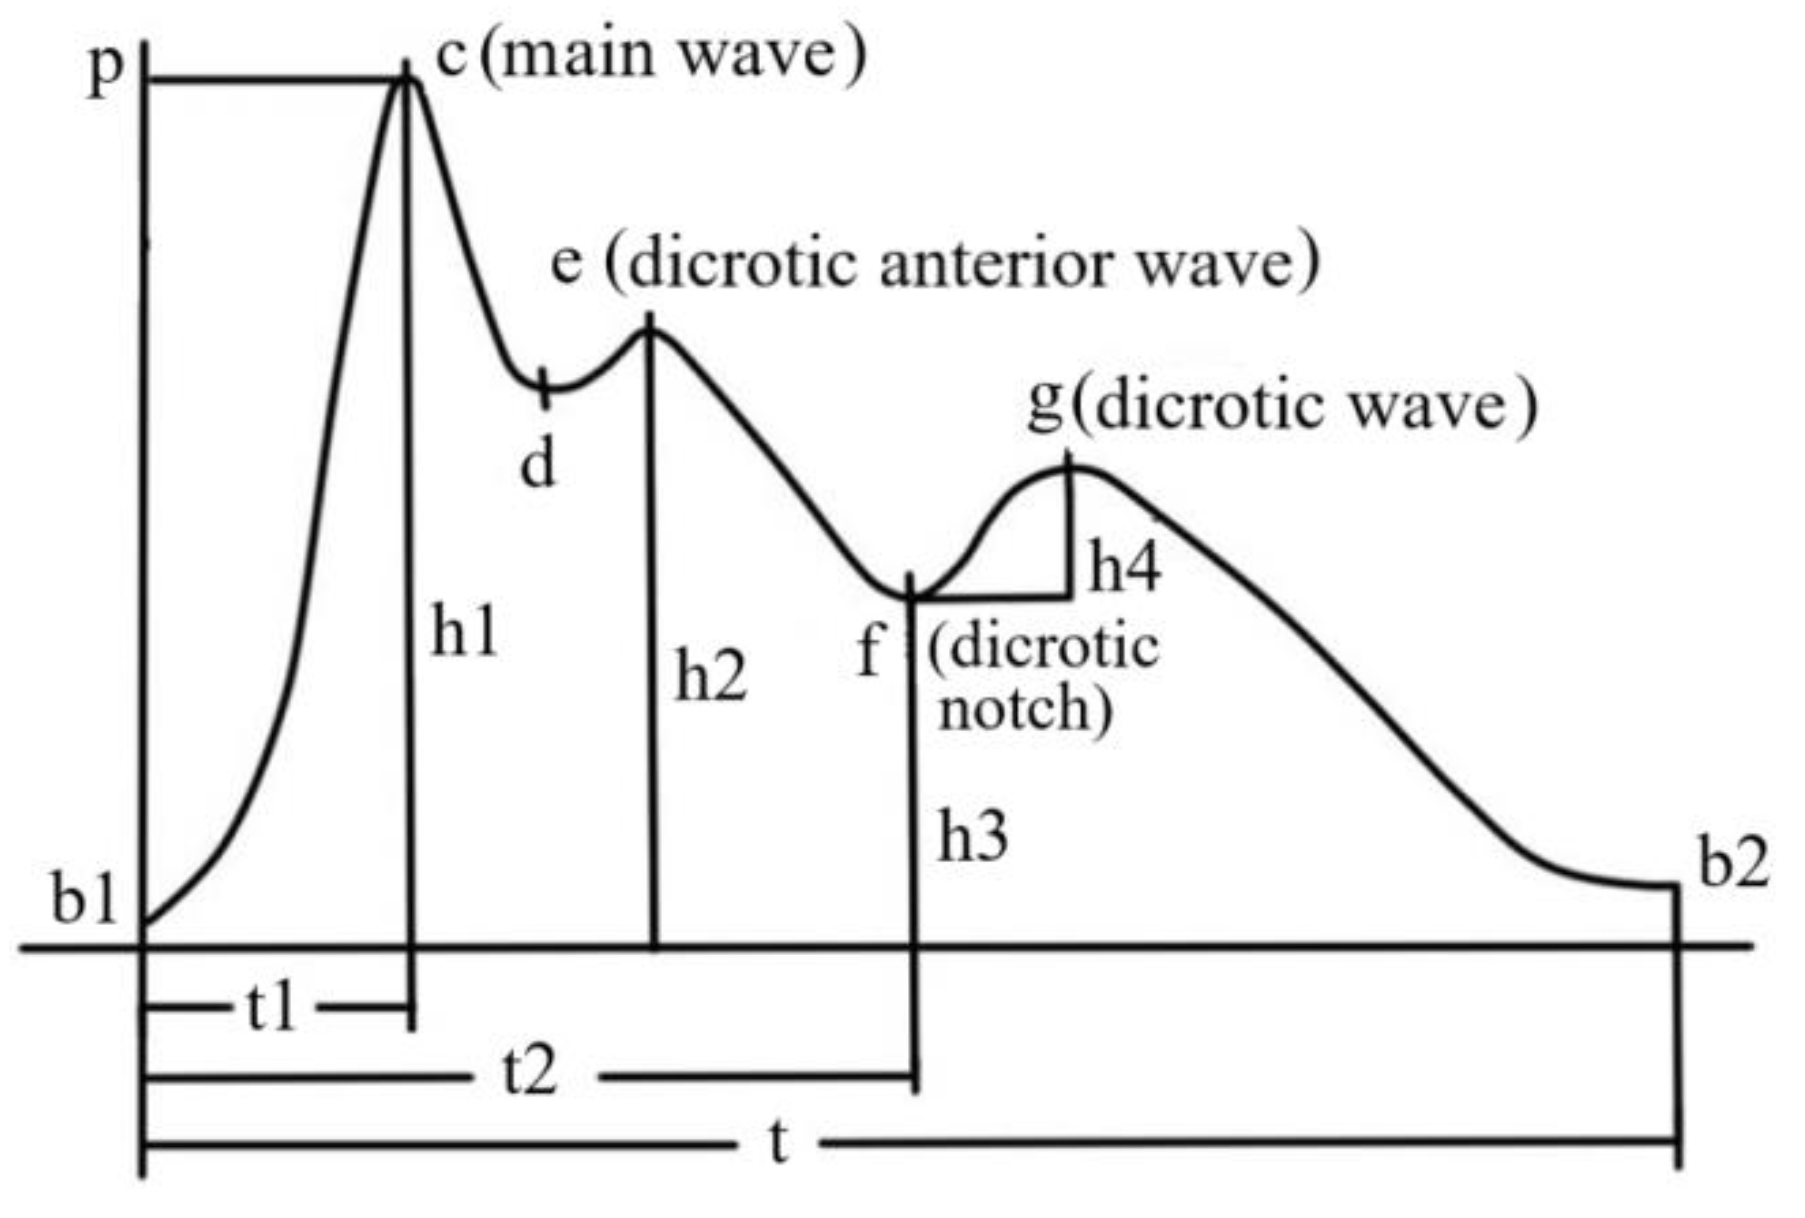
3.3. Data Processing of Pulse Wave Signal

Considering the convenience of wearing device and its monitoring of human blood flow, the acquisition of pulse wave signal is also used in the experiment. Pulse signal wave is mainly composed of main wave, dicrotic anterior wave, dicrotic notch, and dicrotic wave as shown in Figure 11 where point c (peak systolic pressure), e (starting point of left ventricular diastole), g (maximum pressure point of anti-tide wave), d (point of aortic dilation depressurization), f (origin of anti-tide wave), and b1 (point of aortic valve opening) are key feature points.
The pulse wave also has the following key indicators: amplitude of main wave h1, amplitude of dicrotic anterior wave h2, amplitude of dicrotic notch h3, amplitude of dicrotic wave h4, the time from the starting point of waveform period to the peak C point of main wave t1, the time from the starting point of waveform cycle to the lowest point of dicrotic notch t2, and duration of one waveform period t.
The pulse wave is smoothed and filtered using the Butterworth low-pass filter based on MATLAB:
H ( u , v ) = 1 1 + [ D ( u , v ) / D 0 ] 2 n
The cut-off frequency of the low-pass filter is 10 Hz. After filtering, the relevant parameters of pulse wave are normalized. In the normalization, the reference height and time are h1 and t, respectively.

3.4. Feature Extraction of Signals

Features of physiological signal are divided into time domain, frequency domain, and feature related with physiological process [13]. The feature of time domain is more intuitive, the obvious change caused by different emotional stimulation can be seen from the waveform. The feature of frequency domain cannot be directly judged from the waveform, and WT should be used:
F ( ω ) = f ( t ) e j ω t d t ,     f ( t ) = 1 2 π F ( ω ) e j ω t d t
There is no specific law for the change of physiological signals with strong randomness, and the information behind physiological signals could be analyzed in frequency domain. The features related with physiological process have their own feature according to different physiological signals.
On the features of time domain, there are 24 features for skin electrical signal, 30 for ECG, and 18 for pulse wave signal. On the frequency domain, the signal is generally divided into very low frequency band (0.0022~0.04 Hz), low frequency band (0.04~0.15 Hz), and high frequency band (0.15~0.40 Hz). The feature type and calculation method of frequency domain for skin electrical signal, ECG, and pulse wave signal are similar.
On the feature related with physiological process of skin electrical signals, two newly introduced concepts, i.e., skin electrical level (SCL) and skin electrical response (SCR) are included. The slowly changing part of skin electrical signal is called SCL which is an important measurement index of human physiological arousal. The value of SCL will decrease and increase when the human is relaxed and active, respectively. The change of SCL has sensitivity and periodicity. The steep wave crest in the waveform of physiological signal caused by sudden stimulation is called SCR which is usually generated within 1 to 6 s after the stimulation event. The value of SCR is directly proportional to the intensity of external stimulation. The time difference between the time when the stimulus event occurs and the time when the waveform response starts is called the delay time. The time when the skin electrical signal drops from the peak to the original level is called the recovery time, and it is generally regarded as the completion of recovery when it recovers to 63% of the amplitude. According to the above description, on the feature related with physiological process, there are 7 features for skin electrical signal, 6 for ECG, and 10 for pulse wave signal. On the features of time domain, there are 24 features for skin electrical signal, 30 for ECG, and 18 for pulse wave signal. On the frequency domain, there are 41 features for skin electrical signal, 41 for ECG, and 41 for pulse wave signal. In summary, a total of 218 features of physiological signal are used in the present study.

3.5. Validation of Experimental Method

The 218 features of physiological signals as mentioned above are used as classification features, and 72 × 3 × 6 data fragments of physiological signals are classified using three kinds of machine learning method, i.e., k-nearest neighbor algorithm (k-NN), linear support vector machine (SVM), and logistic regression (LR). In 72 × 3 × 6 data fragments, 6 is six typical game events, 3 is three types of physiological signal data, and 72 is the number of randomly selected segments of each physiological signal. The recognition accuracy of three kinds of machine learning method is shown in Table 3. It can be seen that the distribution of recognition accuracy basically conforms to the emotional interval classification of events in Section 2.4.

4. Extraction of Optimal Feature and Model of Emotion Judgment

Before the establishment of model of emotion judgment, the optimal feature set should be built.

4.1. Dimensionality Reduction of Original Signal Feature

The direct fusion of original signal features will make the dimension of feature matrix too high, resulting in too much computation. So, the dimensionality reduction of original signal feature is performed using the method of principal component analysis (PCA), making the classifier more efficient and accurate in emotion recognition.
PCA is mainly composed of three key steps: (1) calculation of matrix of correlation coefficient and load matrix of principal component; (2) weight analysis and calculation of the original feature data; (3) getting feature subset.
In our experiment, the emotion is divided into four types according to the V-A model, and the segments of physiological signal corresponding game events are labeled according to the emotion trend as shown in Table 2. The sample numbers of physiological signal for four emotion trends HVHA, HVLA, LVHA, and LVLA are 276 × 3, 300 × 3, 241 × 3, and 223 × 3, respectively. Each sample contains 206 features of skin electrical signal, ECG and pulse wave signal. In order to unify the number of samples, we randomly extract 660 samples equally from the four-emotion trend based on the least number of samples, forming a 660 × 218 feature matrix X:
X = [ x 1 , 1 x 1 , 2 x 1 , 149 x 2 , 1 x 2 , 2 x 2 , 149 x 220 , 1 x 220 , 2 x 220 , 149 ]
The main purpose of PCA is to reduce the dimension of feature space, therefore, the weight of the original feature in the principal component should be calculated, and the original features with large weight are selected to form a new feature subset, so as to reach the aim of feature dimensionality reduction and speed up the operation speed.

4.2. Extraction of Optimal Feature Set

Firstly, SPSS (statistical product and service solutions) software is used to make selection of dimensionality reduction for the features through PCA, and then the SVM is used to recognize the samples. Finally, the recognition rate is used to determine the most effective feature subset as the basis for model establishment.
A total of 15 principal components as shown in Table 4 are obtained after transforming the original feature matrix using the method of PCA. The cumulative contribution rate of these principal components has reached 86.3% of the total contribution rate, which meets the condition that cumulative contribution rate of principal component is greater than 85%. Then, the weight threshold of each feature of physiological signal on the principal component is taken as the criterion for selecting feature. Finally, some original features that play a major role can be determined as optimal feature subset to build a judgment model.
Since the weight of all signal features in the principal component is less than 7%, the weight threshold of feature is set to 1%, 2%, 4%, and 6%. A total of 660 samples are randomly extracted from each emotion trend during classification and recognition, and there are 2640 samples for four emotion trends. Then, 1740 samples were randomly selected from the 2640 samples as the training set, and the remaining 900 samples were used as test set. Each round of recognition is performed for 20 times, and the final recognition rate is the average of 20 recognition rates. The results of emotion recognition are shown in Table 5 where we can see that the best recognition effect can be obtained when the weight threshold is 4%. Under this circumstance, the 20 kinds of features that achieve the best recognition result include: (1) skin electrical signals: range, mean value of first order difference, minimum ratio of first order difference, the first order standard difference, minimum of first order difference, minimum ratio, maximum ratio, mean value, minimum ratio of second order difference, mean value of frequency domain; (2) ECG: mean value of R-wave, range of R-wave, mean value of Q-wave, standard difference of S-wave, percentage of RR interval difference >50 ms; (3) pulse wave signals: amplitude of main wave, mean value of main wave, range of main wave, time from start to peak of main wave, percentage of main wave interval >50 ms.
After obtaining 20 kinds of features with the best recognition effect, the Pearson correlation coefficient (PCC) is used to judge the relationship between the emotional interval and these features and build the model of emotion recognition. The PCC is obtained by dividing the covariance by the standard deviation of two numbers. The covariance is a numerical feature that represents the relationship between two variables X and Y:
Cov ( X , Y ) = 1 n 1 1 n ( X i X ¯ ) ( Y i Y ¯ )
the change trend of X and Y is the same when X = Y. If Xi > X ¯ , accordingly Yi > Y ¯ ; and Xi < X ¯ , accordingly Yi < Y ¯ , then Cov (X, Y) is a positive value. If Xi > X ¯ , accordingly Yi < Y ¯ ; or Xi < X ¯ , accordingly Yi > Y ¯ , then Cov (X, Y) is a negative value. The PCC is:
Cor ( X , Y ) = 1 n ( X i X ¯ ) ( Y i Y ¯ ) 1 n ( X i X ¯ ) 2 1 n ( Y i Y ¯ ) 2
The PCC is calculated for 8 features of four emotion trends, and the results are shown in Table 6 where BpNN50 means percentage of main wave interval >50 ms, pNN50 means percentage of RR interval difference >50 ms, 1 d mean means the mean value of first order difference. We can see that the values of correlation coefficient are between 0.505 and 0.671, which belongs to medium correlation and strong correlation. In addition, the PCC can be tested for significance and the values of P (strength of significance) are also shown in Table 6 where all values of P are less than 0.009, indicating that the significance is very high (<0.01).
Based on the values of P and correlation coefficient, the normalized threshold of physiological signal features (the range of skin electrical signal, the mean value of first order difference for skin electrical signal, pNN50 for ECG, BpNN50 for pulse wave signal) significantly correlated with emotional trends is determined:
x t h = i = 1 n ( x n x min x max x min ) / n

4.3. Model of Emotion Judgment

After observing the optimal feature set obtained from the PCC, we find that two problems need to be solved.
(1)
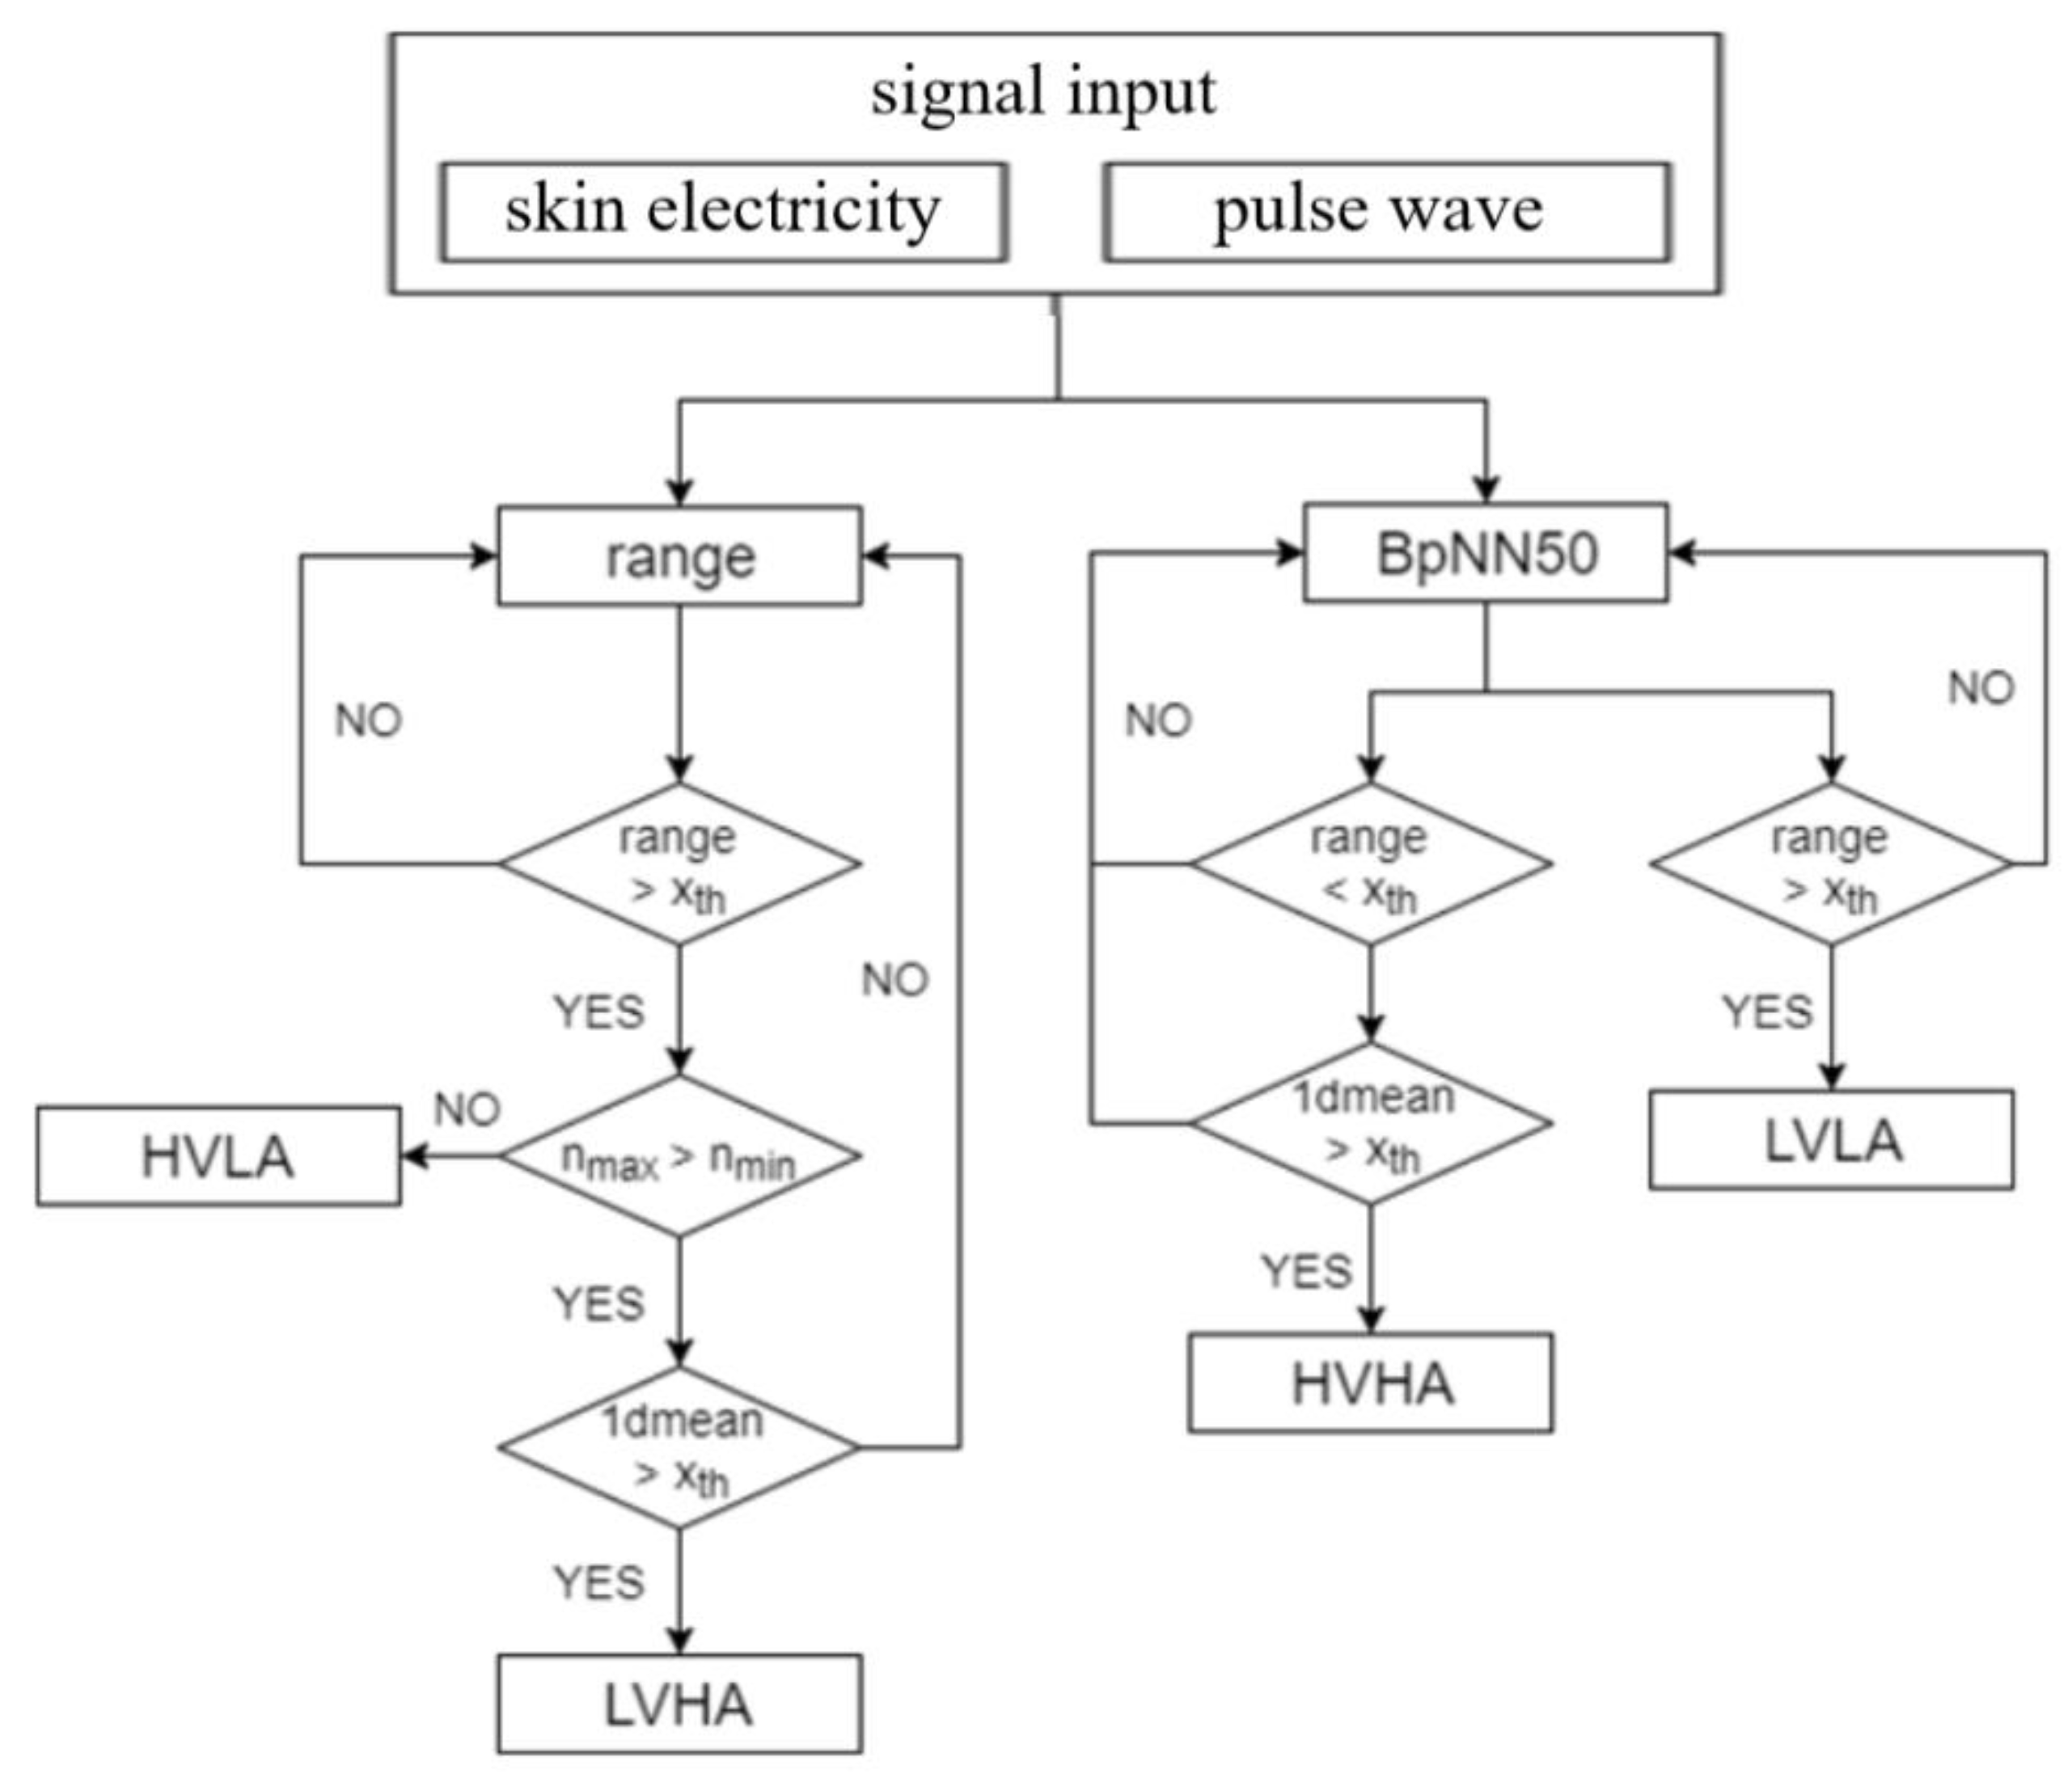
The features of pNN50 for ECG and BpNN50 for pulse wave signal have similar effects on the emotional trend. So, the correlation analysis of these two features is made based on types of physiological signal and the goal of simplifying emotional judgment. The results show that the correlation coefficient of pNN50 for ECG and BpNN50 for pulse wave signal is 0.984, i.e., high correlation. Since the skin electrical signal and pulse wave signal are extracted by the device worn by the finger, we finally chose BpNN50 for pulse wave signal as one of the elements of emotion judgment.
(2)
The range of skin electrical signal has a high positive correlation between the two completely opposite emotional trends, i.e., HVLA and LVHA. So, the skin electrical waveform corresponding to the emotional trend is studied. The results show that it is necessary to add a directional judgment to the range of skin electrical signal.
According to the above two points and other optimal features of PCC, we can build the model of emotional trend as shown in Figure 12.

5. Conclusions

In order to improve the performance of the emotion recognition system, research on the model of emotion judgment based on features of multiple physiological signals was conducted. Firstly, an experiment of data extraction from physiological signal was designed and performed. In total, 40 volunteers participated in the experiment by playing a computer game while their physiological signals (skin electricity, ECG, pulse wave, and facial EMG) were acquired, and a natural mode of human–computer interaction induced by unintentional emotion was adopted. Meanwhile, the volunteers were asked to complete a questionnaire of emotion when all games were finished. Six typical events that appeared in the game were included in the questionnaire, each volunteer was asked to evaluate their own experience and emotion for six events. Secondly, based on the analysis of game events, the signal data were cut into data segments and the emotional trends were classified. The correlation between the data segments and the emotional trends was judged using statistical method combined with the emotional survey of subjective questionnaire. Thirdly, the set of optimal signal feature was obtained by processing the acquired data of physiological signals, extracting the features of signal data, reducing the dimensionality of signal feature, and classifying the emotion based on the set of signal data. Finally, according to the correlation between each feature in the set of optimal signal feature and emotional trend, the model of emotion judgment was established with selecting the features with significance of 0.01.
In the present experiment, the participants rated their own emotion when experiencing six events after finishing the game by completing an emotion questionnaire about their emotions. It would be better to have the volunteers rate their emotions immediately after experiencing one event because it is very difficult to describe emotion and its intensity after a reasonably short period of time, particularly when facing various opposite emotional states. We will improve this in future research. In addition, there will be a certain delay in the collection and feedback of physiological signal data because of the effect of sensor hardware, system software, and the delay of physiological signal changes when people are excited. The method to solve this delay is to obtain the signal type or signal feature that can most quickly respond to the user’s real-time emotional situation, which is the goal we should strive for in the future.

Author Contributions

Conceptualization, Y.Z. and W.L.; methodology, W.L. and C.L.; software, W.L. and C.L.; validation, C.L. and W.L.; writing, W.L. and C.L.; resources, W.L. and Y.Z.; review, Y.Z. All authors have read and agreed to the published version of the manuscript.

Funding

This work was supported by the National Natural Science Foundation of China (Grant no. 12132015).

Institutional Review Board Statement

Not applicable.

Informed Consent Statement

Not applicable.

Data Availability Statement

Data sharing not applicable.

Conflicts of Interest

There are no conflict of interest regarding the publication of this paper.

References

  1. Zhou, F.; Qu, X.D.; Jiao, J.X.; Helander, M.G. Emotion prediction from physiological signals: A comparison study between visual and auditory elicitors. Hum. Comput. Interact. 2014, 26, 285–302. [Google Scholar] [CrossRef]
  2. Liapis, A.; Katsanos, C.; Sotiropoulos, D.G.; Karousos, N.; Xenos, M. Stress in interactive applications: Analysis of the valence-space based on physiological signals and self-reported data. Multimed. Tools Appl. 2017, 76, 5051–5071. [Google Scholar] [CrossRef]
  3. Yan, M.S.; Deng, Z.; He, B.W.; Zou, C.S.; Wu, J.; Zhu, Z.J. Emotion classification with multichannel physiological signals using hybrid feature and adaptive decision fusion. Biomed. Signal Process. Control 2022, 71, 103235. [Google Scholar] [CrossRef]
  4. Fu, Y.J.; Leong, H.V.; Ngai, G.; Huang, M.X.; Chan, S.C.F. Physiological mouse: Toward an emotion-aware mouse. Univers. Access Inf. Soc. 2017, 16, 365–379. [Google Scholar] [CrossRef]
  5. Yoo, G.; Seo, S.; Hong, S.; Kim, H. Emotion extraction based on multi bio-signal using back-propagation neural network. Multimed. Tools Appl. 2018, 77, 4925–4937. [Google Scholar] [CrossRef]
  6. Jang, E.H.; Byun, S.; Park, M.S.; Sohn, J.H. Reliability of Physiological Responses Induced by Basic Emotions: A Pilot Study. J. Physiol. Anthropol. 2019, 38, 15. [Google Scholar] [CrossRef] [PubMed]
  7. Sepulveda, A.; Castillo, F.; Palma, C.; Rodriguez-Fernandez, M. Emotion recognition from ECG signals using wavelet scattering and machine learning. Appl. Sci. 2011, 11, 4945. [Google Scholar] [CrossRef]
  8. Zhang, X.W.; Liu, J.Y.; Shen, J.; Li, S.J.; Hou, K.C.; Hu, B.; Gao, J.; Zhang, T. Emotion recognition from multimodal physiological signals using a regularized deep fusion of kernel machine. IEEE Trans. Cybern. 2021, 51, 4386–4399. [Google Scholar] [CrossRef] [PubMed]
  9. Khezri, M.; Firoozabadi, M.; Sharafat, A.R. Reliable emotion recognition system based on dynamic adaptive fusion of forehead biopotentials and physiological signals. Comput. Meth. Programs Biomed. 2015, 122, 149–164. [Google Scholar] [CrossRef] [PubMed]
  10. Feng, H.H.; Golshan, H.M.; Mahoor, M.H. A wavelet-based approach to emotion classification using EDA signals. Expert Syst. Appl. 2018, 112, 77–86. [Google Scholar] [CrossRef]
  11. Yang, M.Q.; Lin, L.; Milekic, S. Affective image classification based on user eye movement and EEG experience information. Hum. Comput. Interact. 2018, 30, 417–432. [Google Scholar] [CrossRef]
  12. Gershon, N.; Eick, S.G.; Card, S. Information visualization. IEEE Comput. Graph. Appl. 1998, 5, 9–15. [Google Scholar] [CrossRef]
  13. Zhou, M.X. Interactive Visual Analysis of Human Emotions from Text. In The Workshop on Emovis; ACM: New York, NY, USA, 2016; p. 3. [Google Scholar]
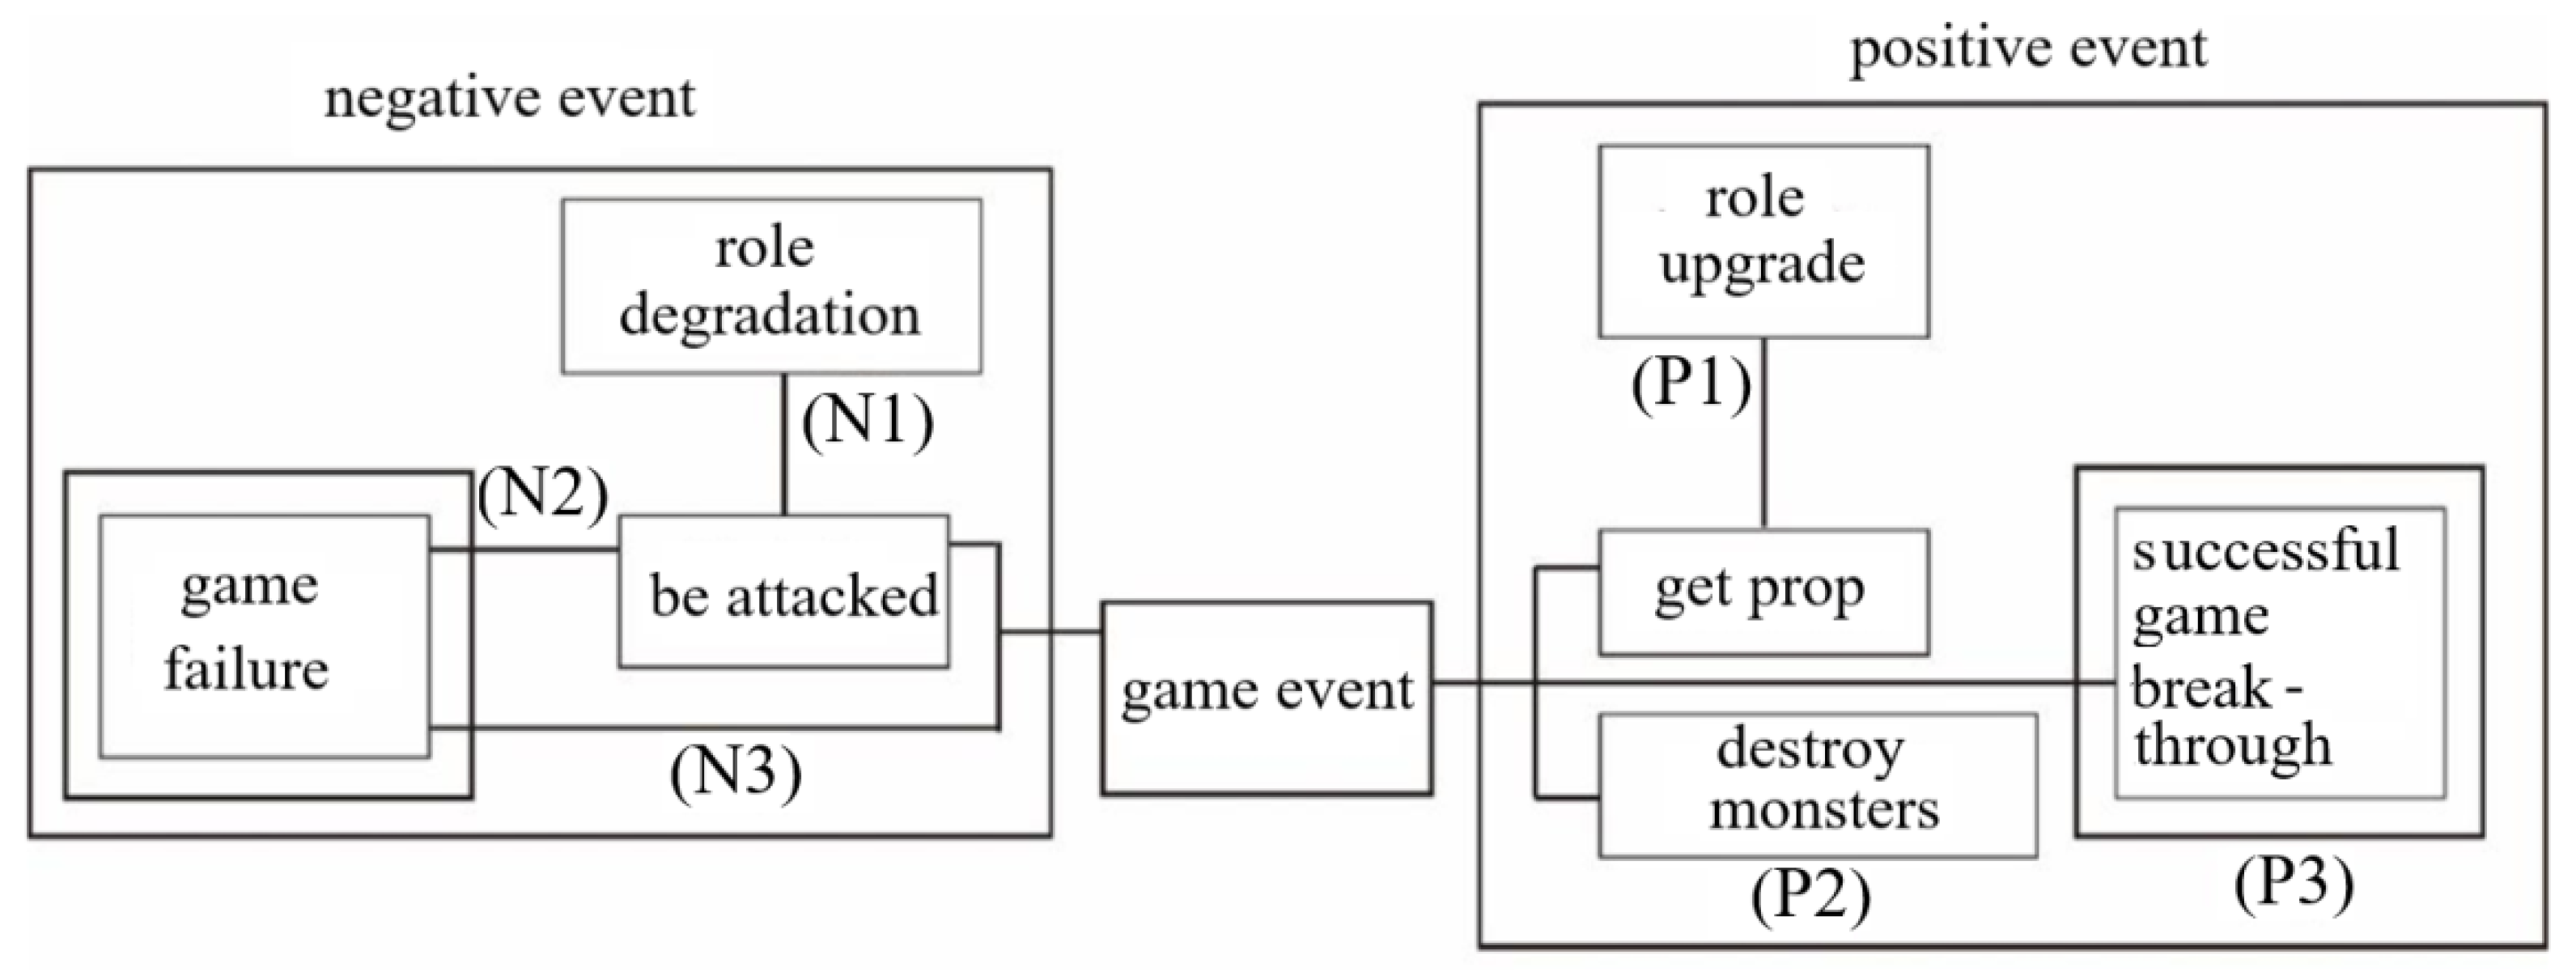
Figure 1. Experimental scene.
Applsci 12 04998 g001
Figure 2. Physiological multi-channel recorder.
Applsci 12 04998 g002
Figure 3. GSR skin electrical kit.
Applsci 12 04998 g003
Figure 4. Pulse sensor.
Applsci 12 04998 g004
Figure 5. Game events listed in the subjective questionnaire.
Applsci 12 04998 g005
Figure 6. Emotional rate of six game events.
Applsci 12 04998 g006
Figure 7. Discrete WT.
Applsci 12 04998 g007
Figure 8. Segment cutting of skin electrical signal according to game events.
Applsci 12 04998 g008
Figure 9. Typical ECG waveform.
Applsci 12 04998 g009
Figure 10. RR interval from ECG signal.
Applsci 12 04998 g010
Figure 11. Key feature points of pulse wave.
Applsci 12 04998 g011
Figure 12. Process of model of emotion judgment.
Applsci 12 04998 g012
Table 1. Six game events.
Game EventContentDescription
P1role upgradeThe character is stronger after obtaining the props. The position of the prop is fixed, but the acquisition process is difficult. Players can decide whether to obtain props or not.
P2destroy monsterThe monster is in constant motion and unpredictable, and players need to operate in time to complete.
P3breakthroughSuccessful breakthrough.
N1role degradationThe character is weaker than before because of being attacked by monsters. The monster is in a state of constant motion and unpredictable.
N2game failure being
attacked by monster
The character is attacked by a monster, resulting in the end of the game. The monster is in a state of constant motion and unpredictable.
N3game failure due to misoperationThe character ends the game due to misoperation.
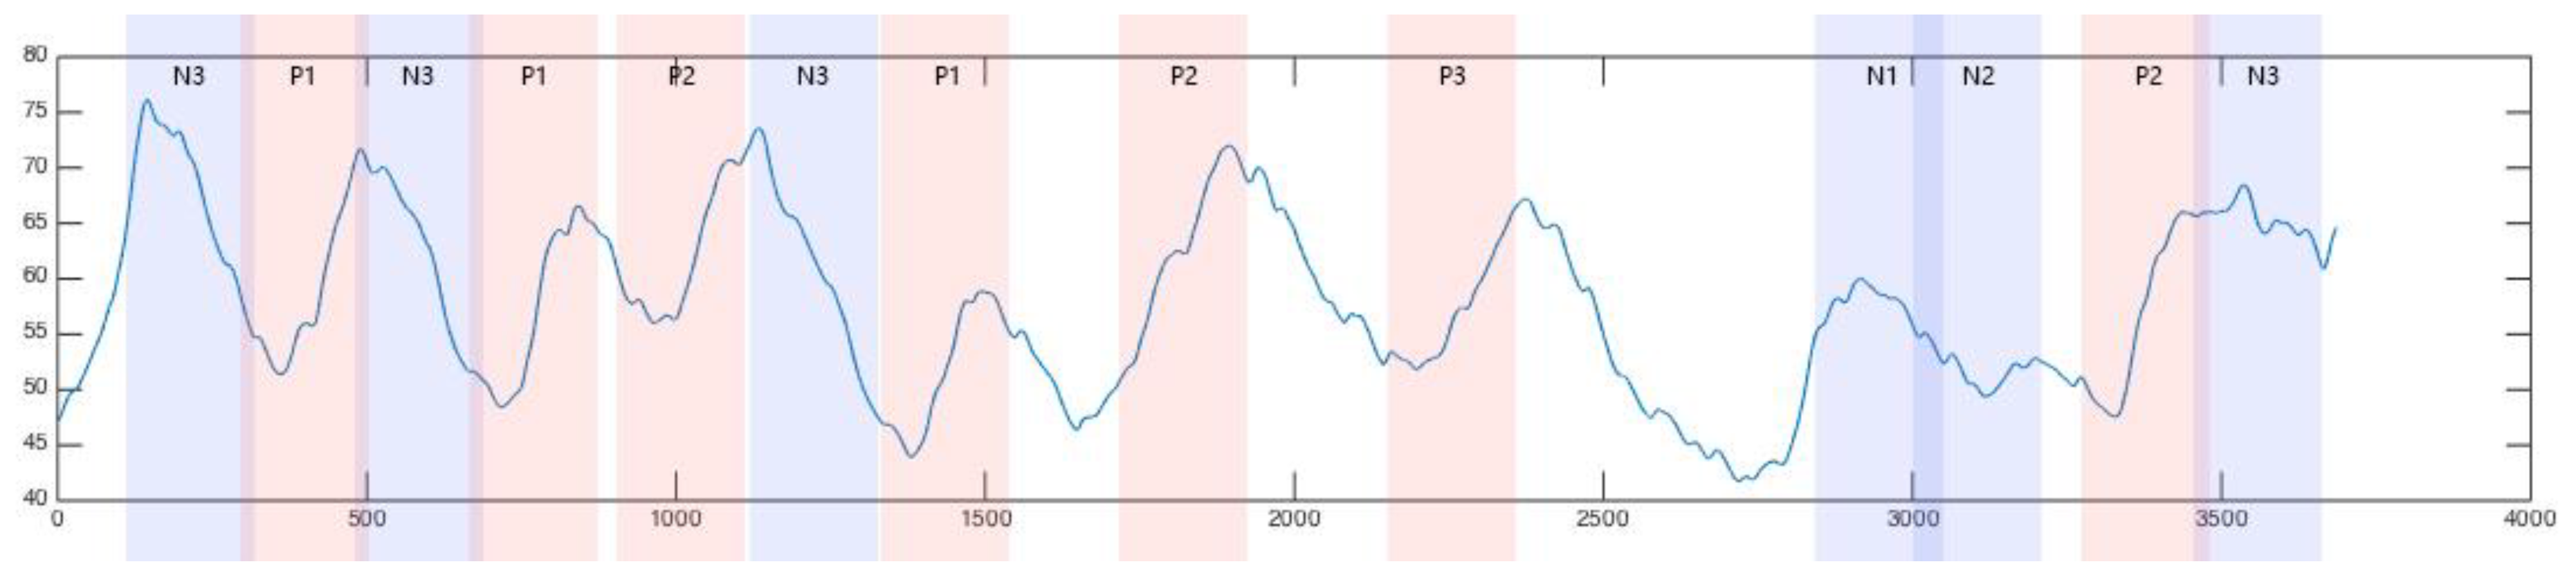
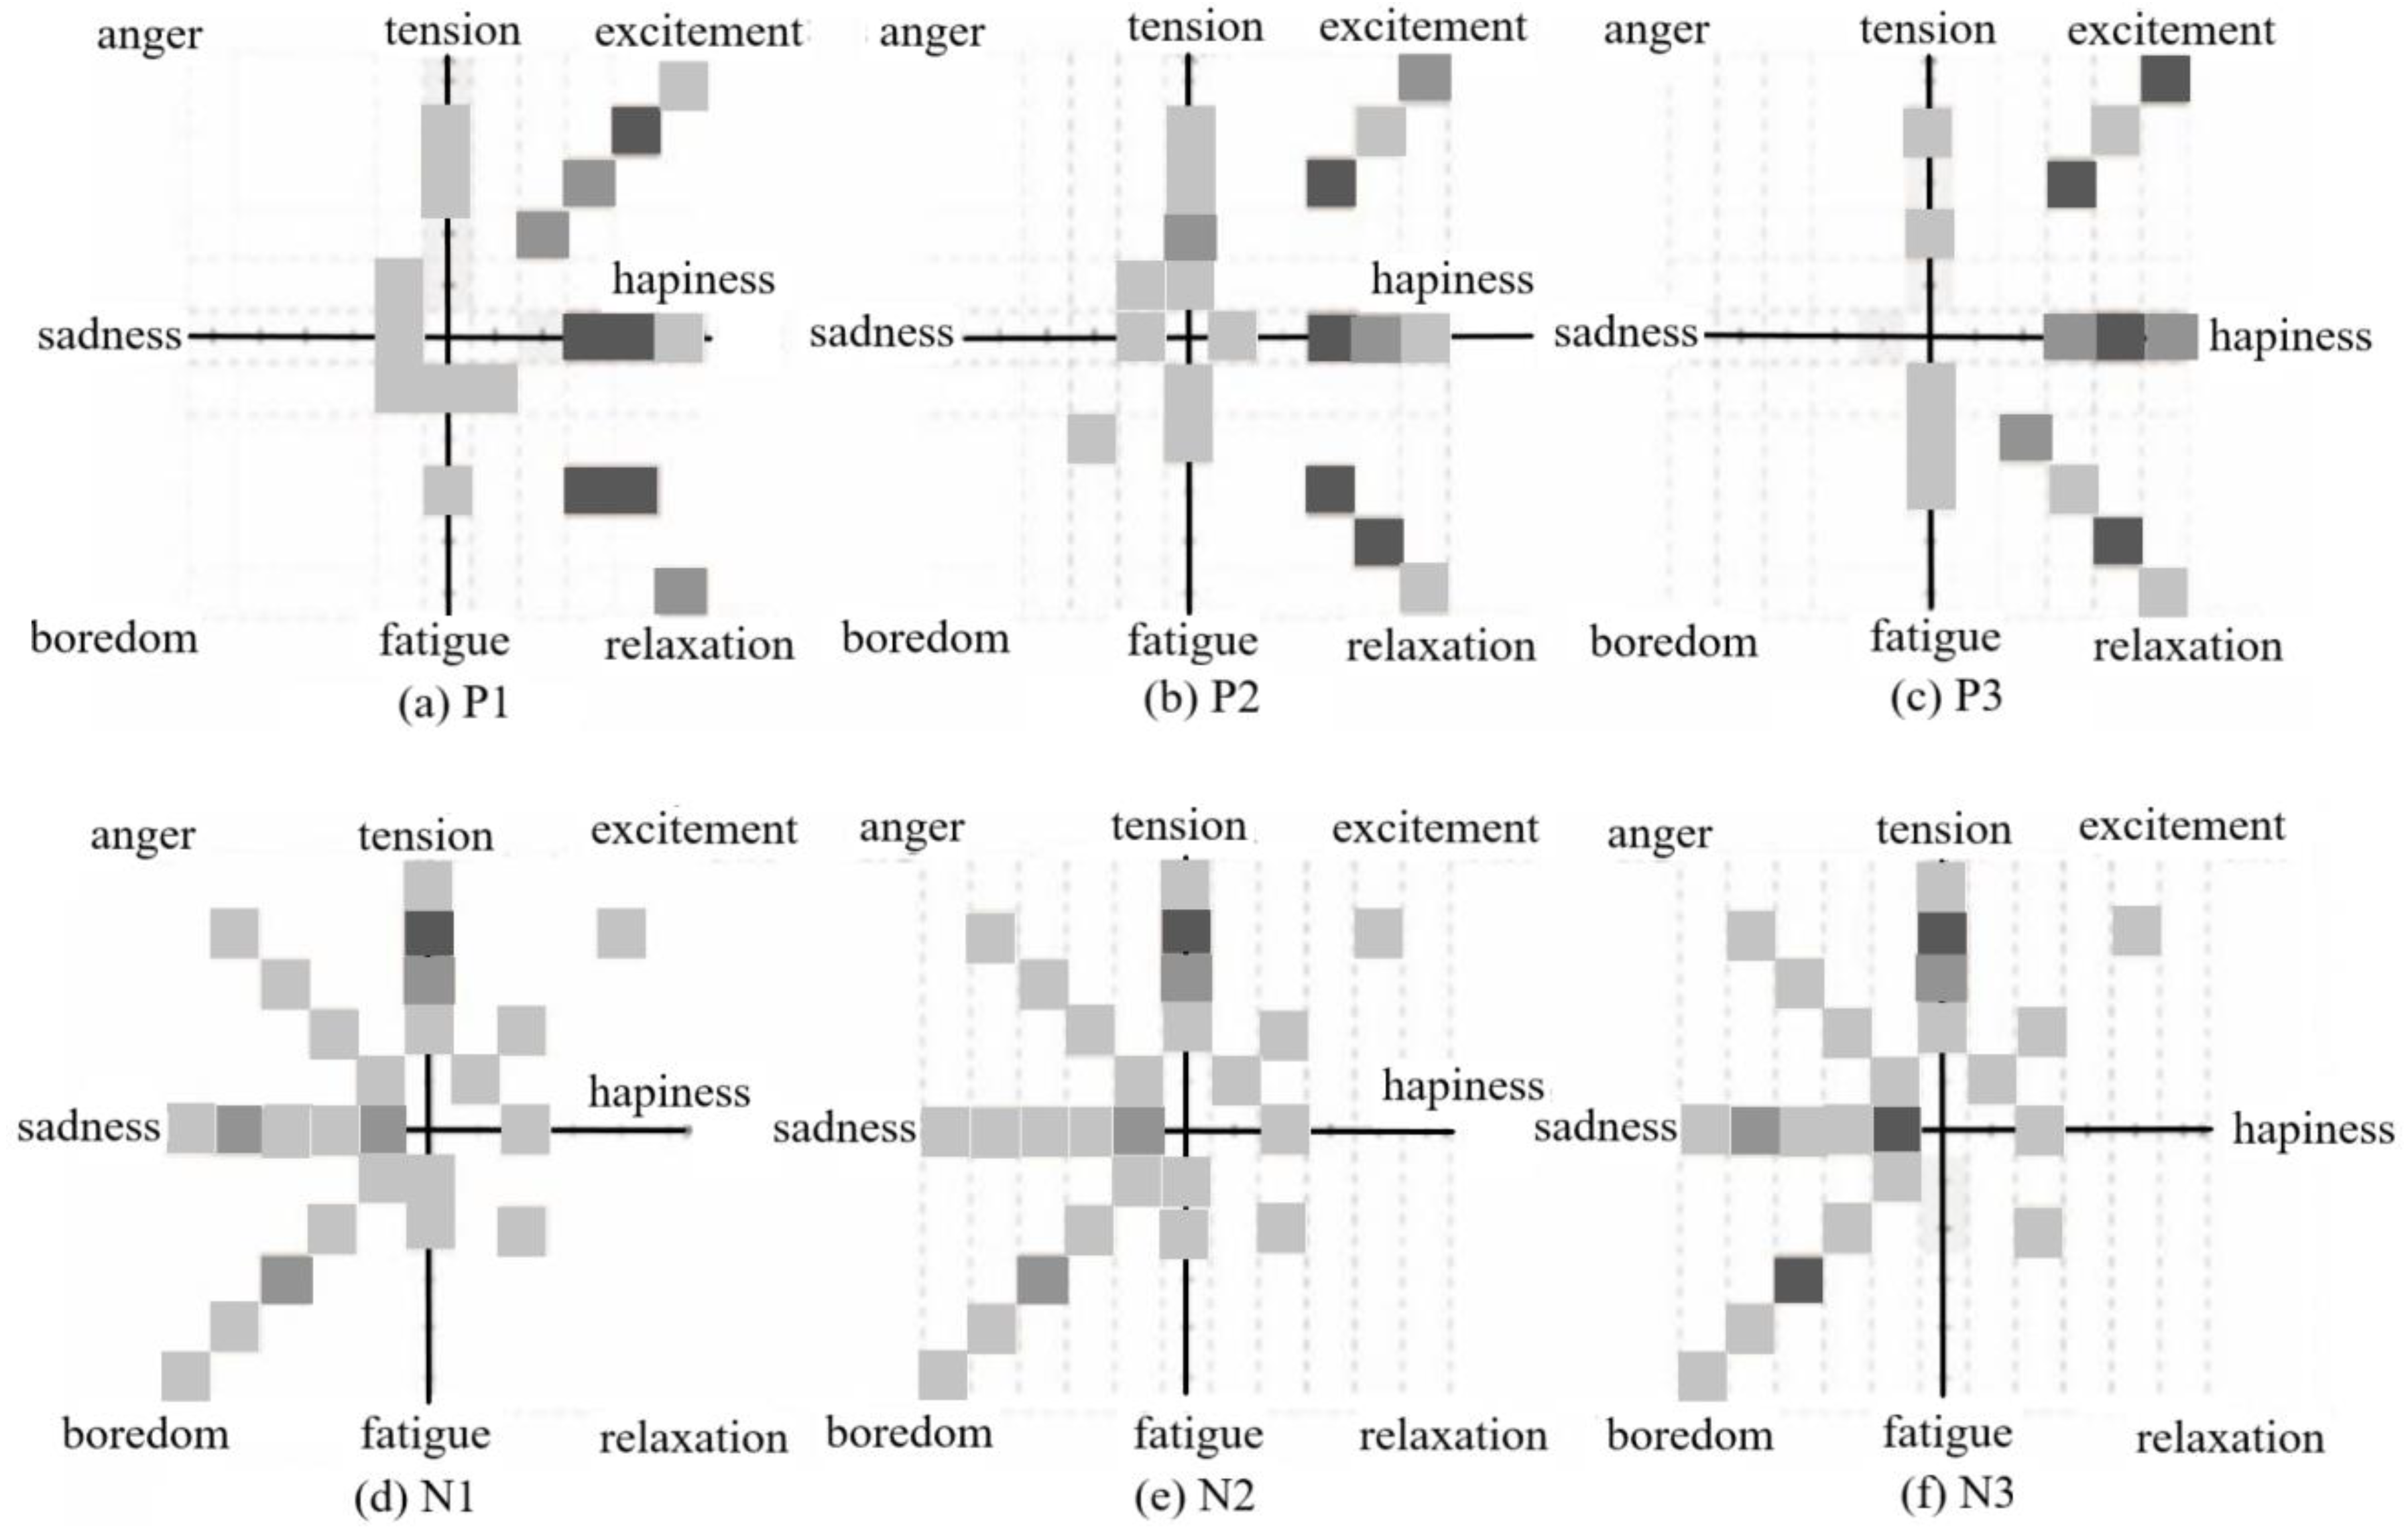
Table 2. Emotional range of six game events.
Game EventEmotional RangeEmotion Trend
P1happiness-excitement-tensionHVHA
P2happiness-relaxation-fatigueHVLA
P3happiness-relaxation-fatigueHVLA
N1sadness-anger-tensionLVHA
N2sadness-anger-tensionLVHA
N3fatigue-boredom-sadnessLVLA
Table 3. The recognition accuracy of methods.
Game Eventk-NN (k = 5)%SVM%LR%
P/N76.884.490.2
P1/P268.473.669.4
P1/P367.875.071.3
P2/P341.231.544.3
N1/N243.747.737.0
N1/N373.975.168.0
N2/N377.280.878.8
Table 4. Principal component table.
NoCharacteristic RootContribution of Principal
Component (%)
Cumulative
Contribution (%)
14.13658.1138.113
24.07748.00516.118
33.69827.10723.225
43.55406.62829.853
53.30616.44936.302
62.98456.01242.314
72.93465.90148.215
82.86515.58253.797
92.85005.30059.097
102.83065.25664.353
112.76405.00269.355
122.53644.86074.215
132.32054.30678.521
142.11504.03382.554
152.06843.77586.329
Table 5. Results of emotion recognition.
Weight ThresholdHVHAHVLALVHALVLANumber of
Features
1%86.3%65.5%93.2%61.1%44
2%89.6%63.4%82.5%61.7%32
3%92.5%73.1%87.6%63.5%26
4%95.2%87.6%96.3%85.4%20
5%78.2%83.1%85.6%65.7%14
6%67.5%76.6%74.0%79.4%10
Table 6. The Pearson correlation coefficient.
Emotion TrendFeaturesCorrelationCorrelation
Coefficient
p
HVHABpNN500.6340.001
pNN500.6670.001
1 d mean+0.5620.006
HVLA
LVLA
range+0.5140.008
BpNN50+0.6710.001
LVLApNN50+0.6530.001
LVHArange+0.5980.003
1 d mean+0.5050.009
Publisher’s Note: MDPI stays neutral with regard to jurisdictional claims in published maps and institutional affiliations.

