Article

COVID-19 Chest X-ray Classification and Severity Assessment Using Convolutional and Transformer Neural Networks

1
Department of Artificial Intelligence Convergence, Pukyong National University, Busan 48513, Korea
2
Department of Computer Engineering, Donga University, Busan 49201, Korea
3
Department of Electronics Engineering, Kyungil University, Gyeongsan-si 38428, Korea
*
Author to whom correspondence should be addressed.
Appl. Sci. 2022, 12(10), 4861; https://doi.org/10.3390/app12104861
Submission received: 31 March 2022 / Revised: 5 May 2022 / Accepted: 7 May 2022 / Published: 11 May 2022
(This article belongs to the Special Issue Advanced Image Analysis and Processing for Biomedical Applications)

Abstract

:
The coronavirus pandemic started in Wuhan, China in December 2019, and put millions of people in a difficult situation. This fatal virus spread to over 227 countries and the number of infected patients increased to over 400 million cases, causing over 6 million deaths worldwide. Due to the serious consequence of this virus, it is necessary to develop a detection method that can respond quickly to prevent the spreading of COVID-19. Using chest X-ray images to detect COVID-19 is one of the promising techniques; however, with a large number of COVID-19 infected cases every day, the number of radiologists available to diagnose the chest X-ray images is not sufficient. We must have a computer aid system that helps doctors instantly and automatically determine COVID-19 cases. Recently, with the emergence of deep learning methods applied for medical and biomedical uses, using convolutional neural net and transformer applications for chest X-ray images can be a supplement for COVID-19 testing. In this paper, we attempt to classify three types of chest X-ray, which are normal, pneumonia, and COVID-19 using deep learning methods on a customized dataset. We also carry out an experiment on the COVID-19 severity assessment task using a tailored dataset. Five deep learning models were obtained to conduct our experiments: DenseNet121, ResNet50, InceptionNet, Swin Transformer, and Hybrid EfficientNet-DOLG neural networks. The results indicated that chest X-ray and deep learning could be reliable methods for supporting doctors in COVID-19 identification and severity assessment tasks.

1. Introduction

Novel coronavirus, known as COVID-19, caused by the SARS-CoV-2 virus, initiated a global pandemic that influenced the lives of billions of people worldwide [1,2,3]. The number of infected case numbers and the rapidly increasing death rate indicated that this is a serious illness and challenging disease. The rapid spreading of COVID-19 is one of the most daunting obstacles, which prevents us from controlling the viral pneumonia. The early symptoms of coronavirus include dyspnea, dry cough, fever, myalgia, and headache [4,5,6]; however, in some cases, there are no clear signs which make the disease more dangerous to public health. It is therefore necessary to have a quick, reliable, safe, and simple method for COVID-19 detection and diagnosis.
The main method to detect COVID-19 is the reverse transcriptase–polymerase chain reaction (RT–PCR) [7], which can detect axit ribonucleic SARS-CoV-2 (RNA) from the respiratory specimens (collected from nasopharyngeal swabs), is now the gold standard for identifying COVID-19. However, RT–PCR has many limitations [8], and this screening method is a time-consuming procedure, laborious, complicated, and lacking supply devices. Some patients, including those highly suspected of COVID-19, have false negative and false positive results with the RT–PCR test, which indicates the poor sensitivity and highly variable results of the method [9,10,11].
One of the recent emerging screening methods for COVID-19 is thoracic imaging analysis, which can be applied in early COVID-19 detection [12,13,14]. These chest X-ray images are obtained and analyzed by radiologists to find visual indicators related to SARS-CoV-2 viral infection. Former studies prove that COVID-19 causes abnormal areas that could be visible in chest X-rays; this hypothesis could be a strong suggestion to use chest X-rays as the initial step for COVID-19 monitoring [15,16,17]. Some of the most cutting-edge benefits when using chest X-rays for COVID-19 diagnosis include the following:
  • Chest X-ray diagnosis allows us to have rapid COVID-19 classification and could be carried out in parallel with RT–PCR testing to deal with high volumes of patients.
  • Chest X-ray images could be obtained in many clinical sites and are readily available in most health care centers.
  • The portable chest X-ray imaging system helps doctors to isolate the image capturing process from other people such that it can reduce the risk of spreading COVID-19.
Despite chest X-ray diagnosis having many advantages, it still faces some obstacles due to some idiosyncratic characteristics of the new pandemic disease. The most cumbersome obstacle is the lack of experienced radiologists and also the error-prone human visual indicators. Computer aid design diagnosis can help radiologists to have faster and more accurate COVID-19 diagnosis as a crucial adjunct to reduce workload and enhance patient safety [18,19,20].
Recently, with the emergence of deep learning, many studies have been conducted to analyze the potential of chest X-ray and CT images for COVID-19 detection, especially to apply deep learning for automatic COVID-19 detection [21,22,23,24,25]. Deep learning for COVID-19 detection could help solve the problem of a lack of radiology specialists and also produce reliable performance [26,27,28]. However, almost all developed artificial intelligence (AI) systems are not open and are not available for the research community to access resources. We do not have much open-source coding or datasets available to conduct thorough research on the subject. Recently, there have been significant efforts pushing for access to the resource and AI source code about detecting COVID-19 using chest X-ray images; some of the notable research can be found in [29,30,31,32,33,34]. In one study, a tailored convolution neural COVID-NET [35] architecture was created to classify normal, pneumonia, and COVID-19. Different from other studies, the author of this study used a large dataset containing 13,800 chest X-ray images on 13,645 patients. The authors gained accuracy results of 92.4% with COVID-19 classification performance.
Severity assessment using chest X-ray is not an easy task, even with experienced radiologists; clinical diagnosis with the aid of a computer could help doctors with this daunting task. There are some works related to COVID-19 severity assessment [36,37], including the deep learning applied works of Liang et al. [38] and COVID-Gram [39] in which the author investigated the X-ray abnormality to detect COVID-19. In the work of Colombi et al. [40], the lung pneumonia extent was diagnosed to assess the severity of the disease. Another notable work was COVID-NET-S [41], one of the early COVID-19 severity assessment studies in which the author designed a deep neural network to predict extent scores from chest X-ray images.
In this paper, we study the application of deep learning for detecting COVID-19 based on chest X-ray images. The experimental results have shown us that artificial intelligence methods based on deep neural networks could aid doctors and radiologists with high accuracy and reliable performance. Furthermore, we also study the assessment of COVID-19 severity through classified chest X-ray images. The patient severity is divided into level1 and level2, which indicates the seriousness of the illness and can aid doctors in deciding a treatment response. We collected training images from various open dataset sources and then cleaned the input data by removing low-quality images and separating the original dataset to balance sets for efficient training. We trained five deep learning models on the customized datasets and evaluated model performance on three metrics: precision, recall, and F1-score.
The rest of the paper was organized as follows. Section 2 presents the materials and methods which are the dataset collecting process and deep learning architecture description. Section 3 describes experimental results and a detailed analysis of each method’s performance on the COVID-19 detection and the severity assessment task. We also discuss the limitation of the used methods and review other potential deep learning methods that can be applied to X-ray imagery. Section 4 recaps our study so far and discusses future work.

2. Materials and Methods

We created two new datasets and ran experiments on 5 deep learning models, which are currently the state of art for medical image classification tasks. The detailed results analysis will be illustrated in Section 2.1 and Section 2.2.

2.1. Dataset

Two datasets were used to run our experiments: the COVID-19 classification dataset which was collected from COVID CXR [42], and the Chest X-ray Images (Pneumonia) dataset [43]. These datasets were published freely on the internet for research and education purposes. Another dataset was used for severity assessment which was collected from two sources, the RICORD [44] dataset and the RALO dataset [45].

2.1.1. The Customized COVID-19 Classification Dataset

We collected the COVID-19 classification dataset from two open datasets. The first is COVID CXR dataset which contains 30,128 images in total. There are 16,488 images labeled as COVID-19 and 5555 images labeled as pneumonia and 8085 images labeled as normal. The whole dataset was collected from five open-source datasets which are currently freely available. The second dataset is the Chest X-ray Images (Pneumonia) dataset which was published on the Kaggle competition to classify pneumonia and normal chest X-ray images. We mixed the two datasets together and removed portions of COVID-19 labeled images from the COVID CXR dataset to create a more balanced dataset. Details about the dataset contribution are illustrated in Table 1, in which the COVID CXR was collected from 5 published datasets [46,47,48,49,50] which account for 80% of the mixed dataset. We made the combined dataset cleaner by removing all low-quality images and keeping the high-quality images only, then data augmentation was used to feed images into the deep learning models.
The Chest X-ray Pneumonia dataset contains a total of 5856 images which are grouped into two categories, normal and pneumonia. There are 1583 images labeled as normal and 4273 images labeled as pneumonia. All the normal and pneumonia images were then mixed with normal and pneumonia images from the COVID CXR dataset.
The total number of COVID-19 images is 9446, normal is 9668, and pneumonia is 9828. The Chest X-ray images were selected from Guangzhou Women and Children’s Medical Center, Guangzhou. All those images were collected as the clinical checking routine for patients suffering from pneumonia. The chest X-ray images were cleaned to make sure the quality of the input images was acceptable to feed into deep neural models. These images were classified by two expert radiologists and double-checked by a third radiologist. Three classes of chest X-ray images are illustrated in the Figure 1 with respect to normal, pneumonia, and COVID-19 cases.

2.1.2. The Customized COVID-19 Severity Assessment Dataset

The second dataset used for the severity assessment experiment was collected from two public datasets, the RICORD dataset and the RALO dataset. Details about the contribution of the two datasets are presented in Table 2.
RICORD stands for the RSNA International COVID-19 Open Radiology Database, the dataset was published by the Radiological Society of North America (RSNA) with the purpose of providing free access to research and education resources for the machine learning community. The segmentation was performed by a thoracic specialist and the labeling process was coordinated with other international medical imaging organizations. There are a total of 909 images, and we separated the dataset into train, validation, and test sets. In the train set, there are 140 and 467 images belonging to level1 and level2. The validation set contains a total of 152 images with 35 images of level1 and 117 of level2. For the test set, there are 52 level1 images and 98 level2 images which contribute to the total number of test images for the severity assessment.
The RALO (Radiographic Assessment of Lung Opacity Score) dataset was captured and scored by Stony Brook Medicine to aid researchers with a standard COVID-19 dataset. The dataset contains 2373 chest X-ray images and was scored by two expert radiologists for further COVID-19 severity analysis. In the RALO dataset, we only separated the dataset into train and validation with 1899 and 474 images, respectively. There are 845 and 1054 images with respect to level1 and level2 in the training set. For the validation set, there are 211 and 263 images as level1 and level2. We present an illustration of level1 and level2 severity chest X-ray images in Figure 2 below.

2.2. Neural Networks Architecture

We used five neural networks to conduct our experiment, three convolutional, and two transformer-based models. The overview of each model architecture is shown in Table 3 and the details are presented in the following sections.

2.2.1. DenseNet121

The DenseNet121 [51] model won the CVPR 2017 Best Paper Award and was developed by researchers from Cornell University, Tsinghua University, and FaceBook Research. The convolution neural net contains shorter connections between input and output layers so that the network can be deeper, more efficient, and more accurate. Based on these observations, Gao Huang et al. [51] introduced DenseNet, which connects each layer following the deep-forward design principle. With each layer, a feature map of all layers is used as the input and its own feature map is then used for the next layers. The DenseNet architecture has many strong points: it reduces the gradient descent, enhances features propagation, promotes features reuse, and reduces a large number of parameters.

2.2.2. ResNet50

ResNet architecture was proposed by Kaiming He et al. [52] to solve the problem when training very deep neural networks. Prior convolutional neural networks often face the issue of gradient vanishing when a large number of layers are stacked into the neural network. Gradient vanishing appears when the network is too deep, and the gradient calculated from the loss function easily decreases to zero through several chain rule operations. This results in the model not learning anything from the training process as there is no weight updating. The main concept of ResNet is the skip connection mechanism which reduces the gradient vanishing in two ways. First, it establishes a shortcut for the gradient passing through many layers, which helps the gradient to still pass over many layers. Second, it allows the model to learn an identity function which makes sure that the higher layers do not perform worse than the lower. In this paper, we use ResNet50, which is a variant of ResNet and has 50 layers, including 48 convolution layers and 1 max-pooling, and 1 average pool layer.

2.2.3. InceptionNet

Before InceptionNet, prior convolutional neural networks mainly focused on increasing the depth of the network to extract features for improving the learning ability of the model. However, the creators of InceptionNet [53] pioneered the scaling of both depth and width of the model while still maintaining constant hardware usage. The principal idea behind the InceptionNet model is that every neuron which extracts the same features should learn together. Furthermore, InceptionNet architecture focuses on parallel processing and extracting different feature maps simultaneously. This is the key innovative aspect that makes InceptionNet unique from other convolutional neural networks before it. However, InceptionNet architecture also has some disadvantages, for example, large models which use InceptionNet are subjected to overfit, especially with limited numbers of labeling input data. The model will bias toward the category which has more labels than another category.

2.2.4. Swin Transformer

Winning the Best Paper Awards and Best Student Paper competition, the Swin Transformer [54] is listed on the priority choices to run our experiments. The model had solved many problems that many vision transformers before it experienced, and it also makes a significant shift in applying transformer for vision tasks. We face a substantial challenge when applying transformer from natural language processing to computer vision, because of the natural difference between these two tasks, for example, a large number of pixels in high-resolution images far exceeds the number of words in text documents. Which makes the transformer for vision tasks cost more expensive computationally than applying transformer for NLP. In order to solve this problem, the creators of Swin Transformer proposed a hierarchical architecture of transformer which has representation computed by shifted windows. This hierarchy provided a flexible ability to model at different scales and has linear complexity with image size. Therefore, it can be used as the backbone for other vision tasks such as classification and dense prediction.

2.2.5. Hybrid EfficientNet and DOLG

The Hybrid EfficientNet and DOLG [55] won the Google Landmark Competition 2021 with the highest recognition performance on the over 200,000 classes. The author implemented the model by enhancing the original DOLG [56] with some adjustments to improve the recognition capability. At first, the author used the EfficientNet [57] which was pre-trained on the ImageNet dataset as an encoder. Then the author added a local branch after the third EfficientNet block and extracted those 1024 dimensions of local features by using three dilated convolutions where parameters were different per each model. The output of the fourth EfficientNet was projected to 1024 dimensions and those fused features accumulate using the average pooling before they were fed into the fully connected layers. The model used the subcenter arc face as the loss function contains dynamic margins for predicting thousands of classes. Overview architecture of Hybrid EfficientNet and DOLG illustrates in Figure 3 with EfficientNet-B5 as a feature extractor and DOLG as a classifier.

2.3. Training Setting

2.3.1. Data Augmentation

Recently, convolutional neural network and transformer performed excellently on many vision tasks such as classification and segmentation. However, these networks need more input data to prevent overfitting, which leads to the failure of the model generalization. These models overfit when learned weights are performed well on the training set, however, badly on the testing set. Unfortunately, many application domains of deep learning do not have access to big data, such as the medical and biomedical domains, in which input data are scarce because of the costly labeling expense and the scarcity of image sources. We need to have experienced radiologists, pathologists, and specialists in medical images analysis to perform labeling of input data which makes the cost of labeling data become too expensive. Furthermore, many real-life medical data cannot be available for the privacy protection of patient information.
One of the common techniques usually used to increase input image data for deep learning models is to apply data augmentation operations. Many works apply deep learning for COVID-19 detection using chest X-ray data augmentation techniques to increase input data. In the work of COVID-NET, Wang et al. [35] applied horizontal flip, intensity shift, translations, zoom, and rotation. The work of Bassi et al. [58] applied flipping, rotations, and translation methods to improve the deep neural network performance. Another work by Nishio et al. [59] used a mixture of data augmentation techniques, such as rotating, flipping, shifting, and mix-up to improve the model’s performance. In this paper, we utilized various image transformation techniques using ImageDataGenerator from keras.preprocessing.image to augment our input data. Image augmentation operations include height_shift_range, rotation_range, horizontal_flip, brightness_range, width_shift_range, and rescale. All these data augmentation techniques are illustrated in Figure 4.

2.3.2. Hardware and Hyperparameter Settings

We trained deep learning models on the NVIDIA GeForce RTX 2070 GPU 8GB with the computer hardware setting: Intel(R) Core (TM) i7-8700K CPU @ 3.70GHz RAM 16GB. We used CallBack, ModelCheckpoint, LearningRateScheduler, TensorBoard, EarlyStopping, and ReduceLROnPlateau from tensorflow.keras.callbacks. We set the maximum epoch to 120 with a patience of 10, starting with a leaning rate to 0.0001 with a minimum learning rate of 0.0001 and maximum learning rate of 0.0005. We utilized the Adam optimizer [60] from tensorflow_addons, which is the upgrade version of the stochastic gradient descent and has been used frequently for vision and natural language processing.
We used Sparse Categorical Cross Entropy as the loss function for our training pipeline, which is a loss function applied for multi-categorical classification. There are two loss functions usually applied for the multi-categorical classification tasks, which are categorical cross entropy and sparse categorical cross entropy. The two loss functions have the same formula as illustrated in the diagram above; however, the only difference is the truth value in sparse categorical cross entropy, which are integer encoded such as {1}, {2}, {3}, and the categorical cross entropy use of one-hot encoding, such as {1, 0, 0}, {0, 1, 0}, and {1, 0, 1} instead. Illustration of multi-categorical classification scheme presents in Figure 5 with feature maps goes through Softmax layer before passing to Sparse Categorical Cross Entropy.

2.4. Evaluation Metrics

In our experiment, we used evaluation metrics from classification_report in sklean.metrics which include precision, recall, F1-score metrics with respect to each category, macro average and micro average. Details about metrics are presented in the following sections.

2.4.1. Precision Metric

This evaluation metric calculated the ratio between the correct case predicted as positive over all predicted as positive cases.
Precison = True   Positive True   Positive + False   Positive
The precision metric provides us with the intuition of the ability to find all cases relevant to the dataset. The precision metric relates to direct costs; if there is a large false positive, then there is a higher true positive cost.

2.4.2. Recall Metric

This evaluation metric calculates the ratio between the correct case predicted as positive over actual positive cases.
Recall = True   Positive True   Positive + False   Negative
The recall metric provides us the intuition of the ability to find all cases that are only relevant in the dataset. This metric relates to opportunity costs; if there are many false negatives, then there are opportunities lost every time.

2.4.3. F1-Score Metric

The F1-score metric involves the average of both precision and recall, when we have two classifiers and the first one has higher precision.
F 1 Score = 2 × Precision × Recall Precision + Recall
However, the second one has a larger recall, in this case, we should use the F1-score to compare two models. The F1-score is also named as the harmonic mean of precision and recall of the model.

2.4.4. Macro-Average Metric

The macro-average calculates the harmonic mean of precision and recall of each class in the dataset.
Macro   average   of   precision = P 1 + P 2 2
Macro   average   of   recall = R 1 + R 2 2 Macro   average   of   F 1 score = F 1 + F 2 2
For example, in the formula above, we have two classes with the P 1 as the precision of the first class and P 2 as the precision of the second class. After calculating a precision score for every class, the macro-average can be computed by taking the average of each score and compute the macro-average for recall as the same as the precision.

2.4.5. Micro-Average Metric

Different from the macro-average, when calculating micro-average, we have to sum up individual true positive, false positive, and false negative and then take the average.
Micro   average   of   precision = TP 1 + TP 2 TP 1 + TP 2 + FP 1 + FP 2
Micro   average   of   recall = TP 1 + TP 2 TP 1 + TP 2 + FN 1 + FN 2 Micro   average   of   F 1 score = 2 × MicroAvgPrecision × MicroAvgRecall MicroAvgPrecision + MicroAvgRecall
For example, we have two classes and TP1, FP1, FN1, TP2, FP2, and FN2 are true positive, false positive, and false negative of class 1 and class 2. Then each micro-average of precision can be calculated and recalled as described in the formula.

3. Results and Discussions

We ran experiments on two tasks. The first task included normal, pneumonia, and COVID-19 classification, which was a multiple-categorical classification task. The second task was the COVID-19 severity assessment, which included two levels of severity and turned out to be a binary classification task. Details of the experiment results for the two tasks are presented in the Section 3.1 and Section 3.2.

3.1. COVID-19 Classification Results

We trained three convolution-based and two transformer-based models on the customized COVID-19 classification dataset. The output results were evaluated based on three metrics, which were precision, recall, and F1-score with respect to COVID-19, normal, pneumonia, macro-average, and micro-average. Each tables below contained numerical results of three metrics and will be described in detail. The two models which showed the best results were DenseNet121 and Hybrid EfficientNet-DOLG.
Table 4 compares the performance of five deep learning models based on the precision metric score. The numerical results illustrate each category and on macro- and micro-average. For the COVID-19 precision score, the best model was found to be Swin Transformer with a score of 0.99, and for normal images, we found Hybrid EfficientNet-DOLG a top score of 0.93, and for pneumonia, the DensNet121 model produced the highest result (0.94). For macro-average and micro-average, the Hybrid EfficientNet-DOLG was found to lead both metrics with scores of 0.95 and 0.96, respectively. The hierarchical architecture of Swin Transformer computed image representation in different scales which works best on COVID-19. On the other hand, the concatenate mechanism of DensNet boosted the pneumonia detection of DenseNet. The hybrid architecture helped Hybrid EfficientNet-DOLG perform best results on normal, macro average, and micro average.
As shown in Table 5, we could see the outstanding performance of Hybrid EfficientNet-DOLG as it produced the highest score on three metrics: pneumonia, macro-average, and micro-average, with scores of 0.95, 0.96, and 0.96, respectively. For the COVID-19 category, we found the DenseNet121 to have a recall score of 0.98 and the second highest score was found to be Hybrid EfficientNet Transformer which was 0.97, only smaller than a 0.01 gap. For normal, we found Swin Transformer to have a score of 0.97 and the second score was DenseNet 121 and Hybrid EfficientNet-DOLG, which was 0.94. The other models, including ResNet50 and InceptionNet, also computed comparable results. With respect to recall, the dense architecture of DenseNet worked best on COVID-19 images, and different from precision metric, the hierarchy architecture of Swin Transformer achieved the best results on normal images. The combination of EfficientNet and DOLG took the best place on pneumonia, macro average, and micro average.
The third metric was the F1-score; in this metric, we could see the pattern that Hybrid EfficientNet produced the best results on all scores except the normal category, in which the top result belonged to DenseNet with a score of 0.95. For COVID-19, pneumonia, macro-average, and micro-average the Hybrid EfficientNet-DOLG produced the highest results with scores of 0.99, 0.94, 0.95, and 0.96, respectively. For COVID-19, pneumonia, macro-average, and micro-average, the second highest model was DensNet121, which produced scores of 0.98, 0.93, 0.94, and 0.95 sequentially. Different from precision and recall, the classification performance of DenseNet secured best on normal images, this might be because the dense connections performed well for normal cases regarding the F1-score, then the compound of EfficientNet and DOLG did efficiently on other categories.
From Table 6, we can conclude that Hybrid EfficientNet-DOLG and DenseNet models are the best models for COVID-19 classification tasks on our customized dataset.
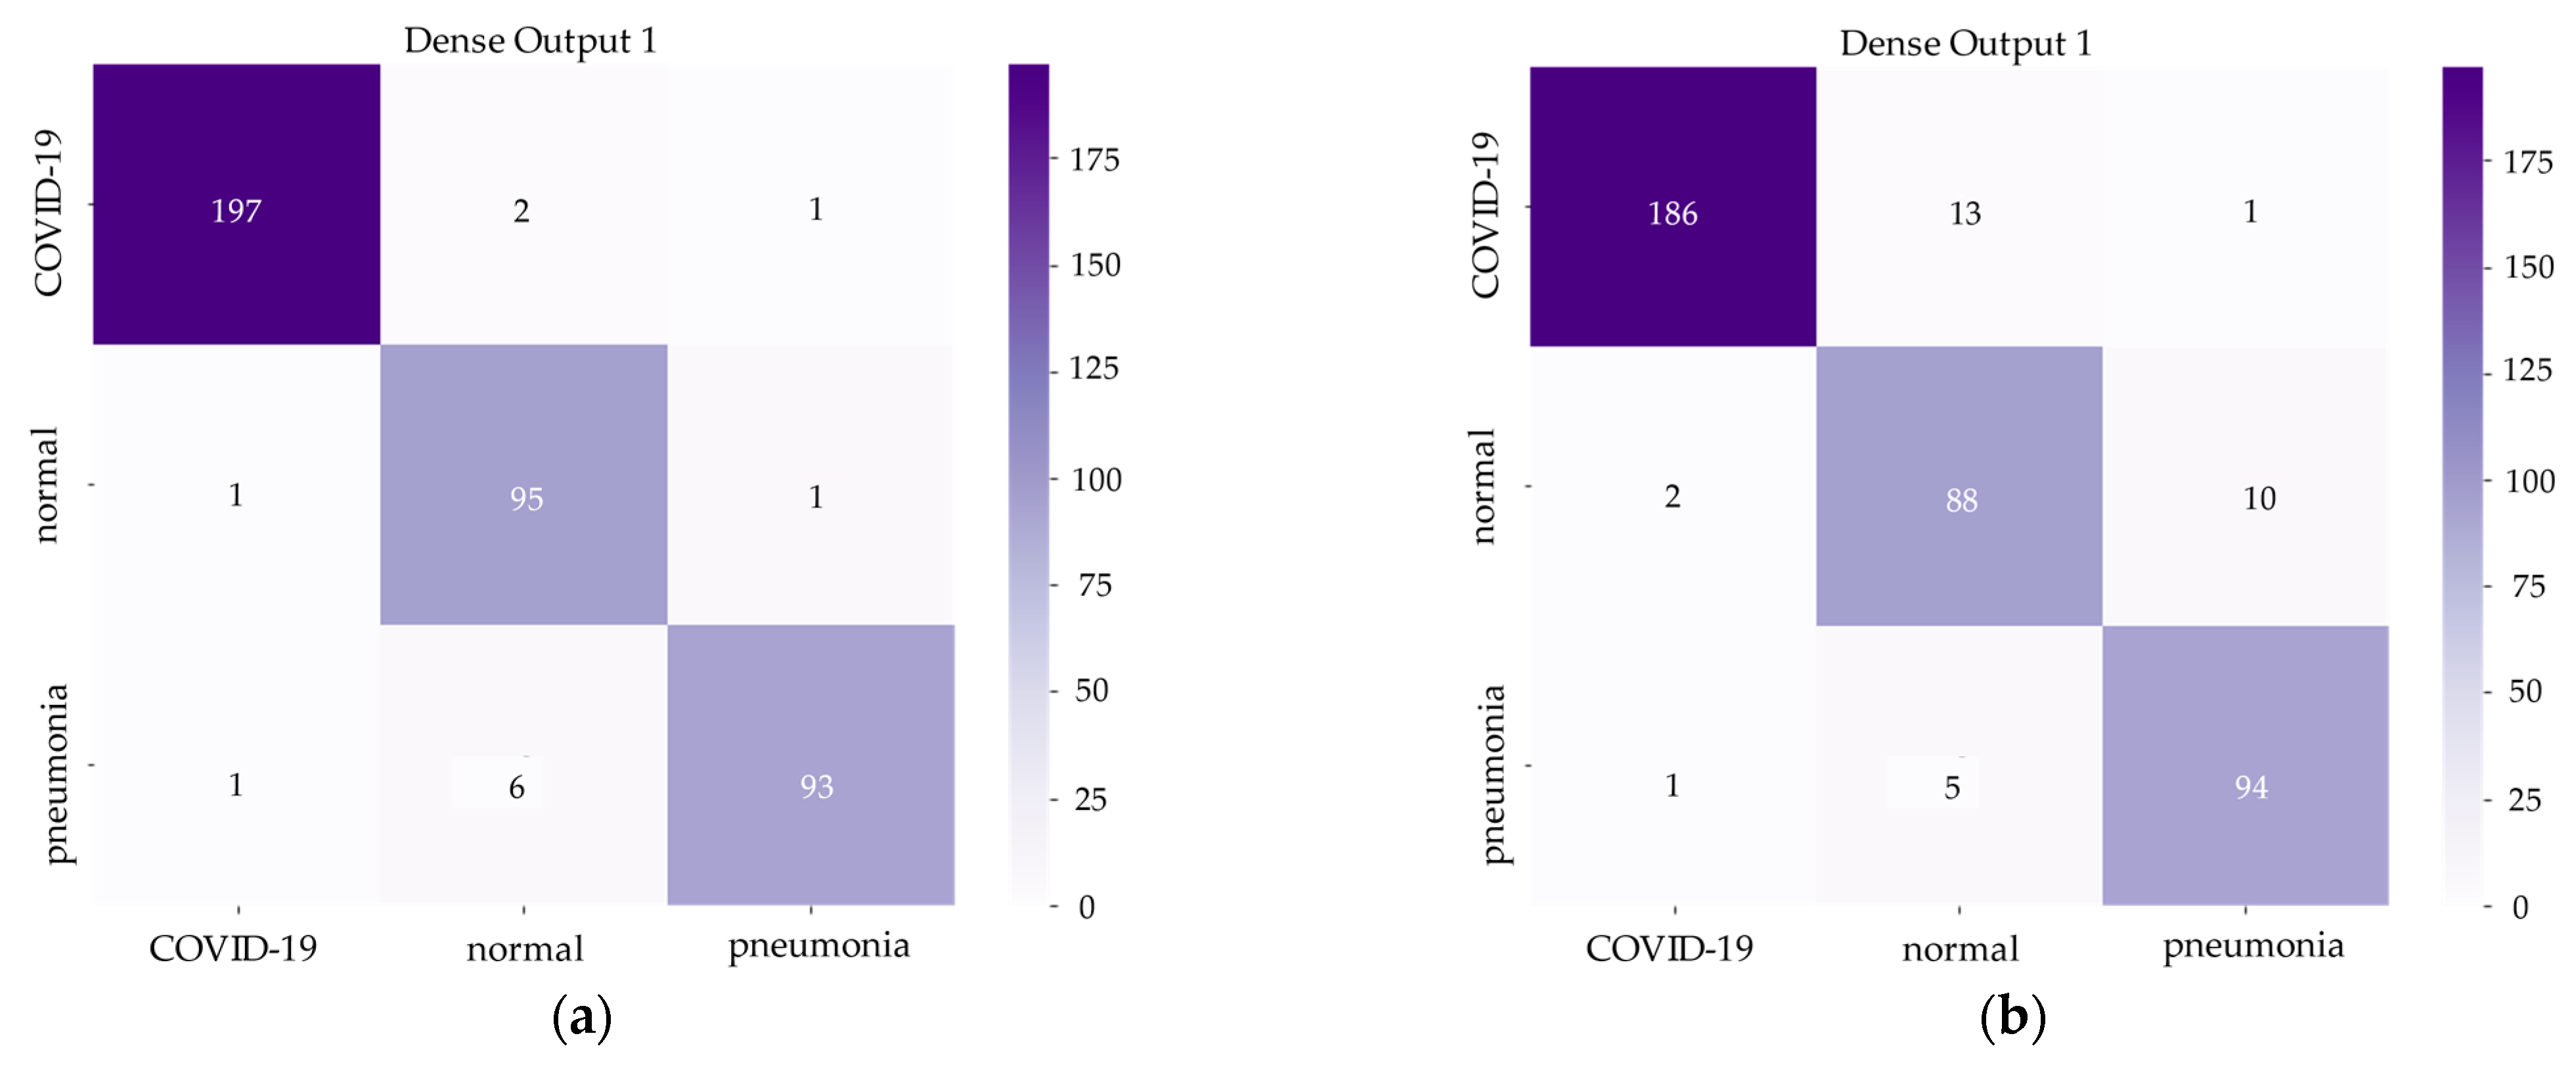
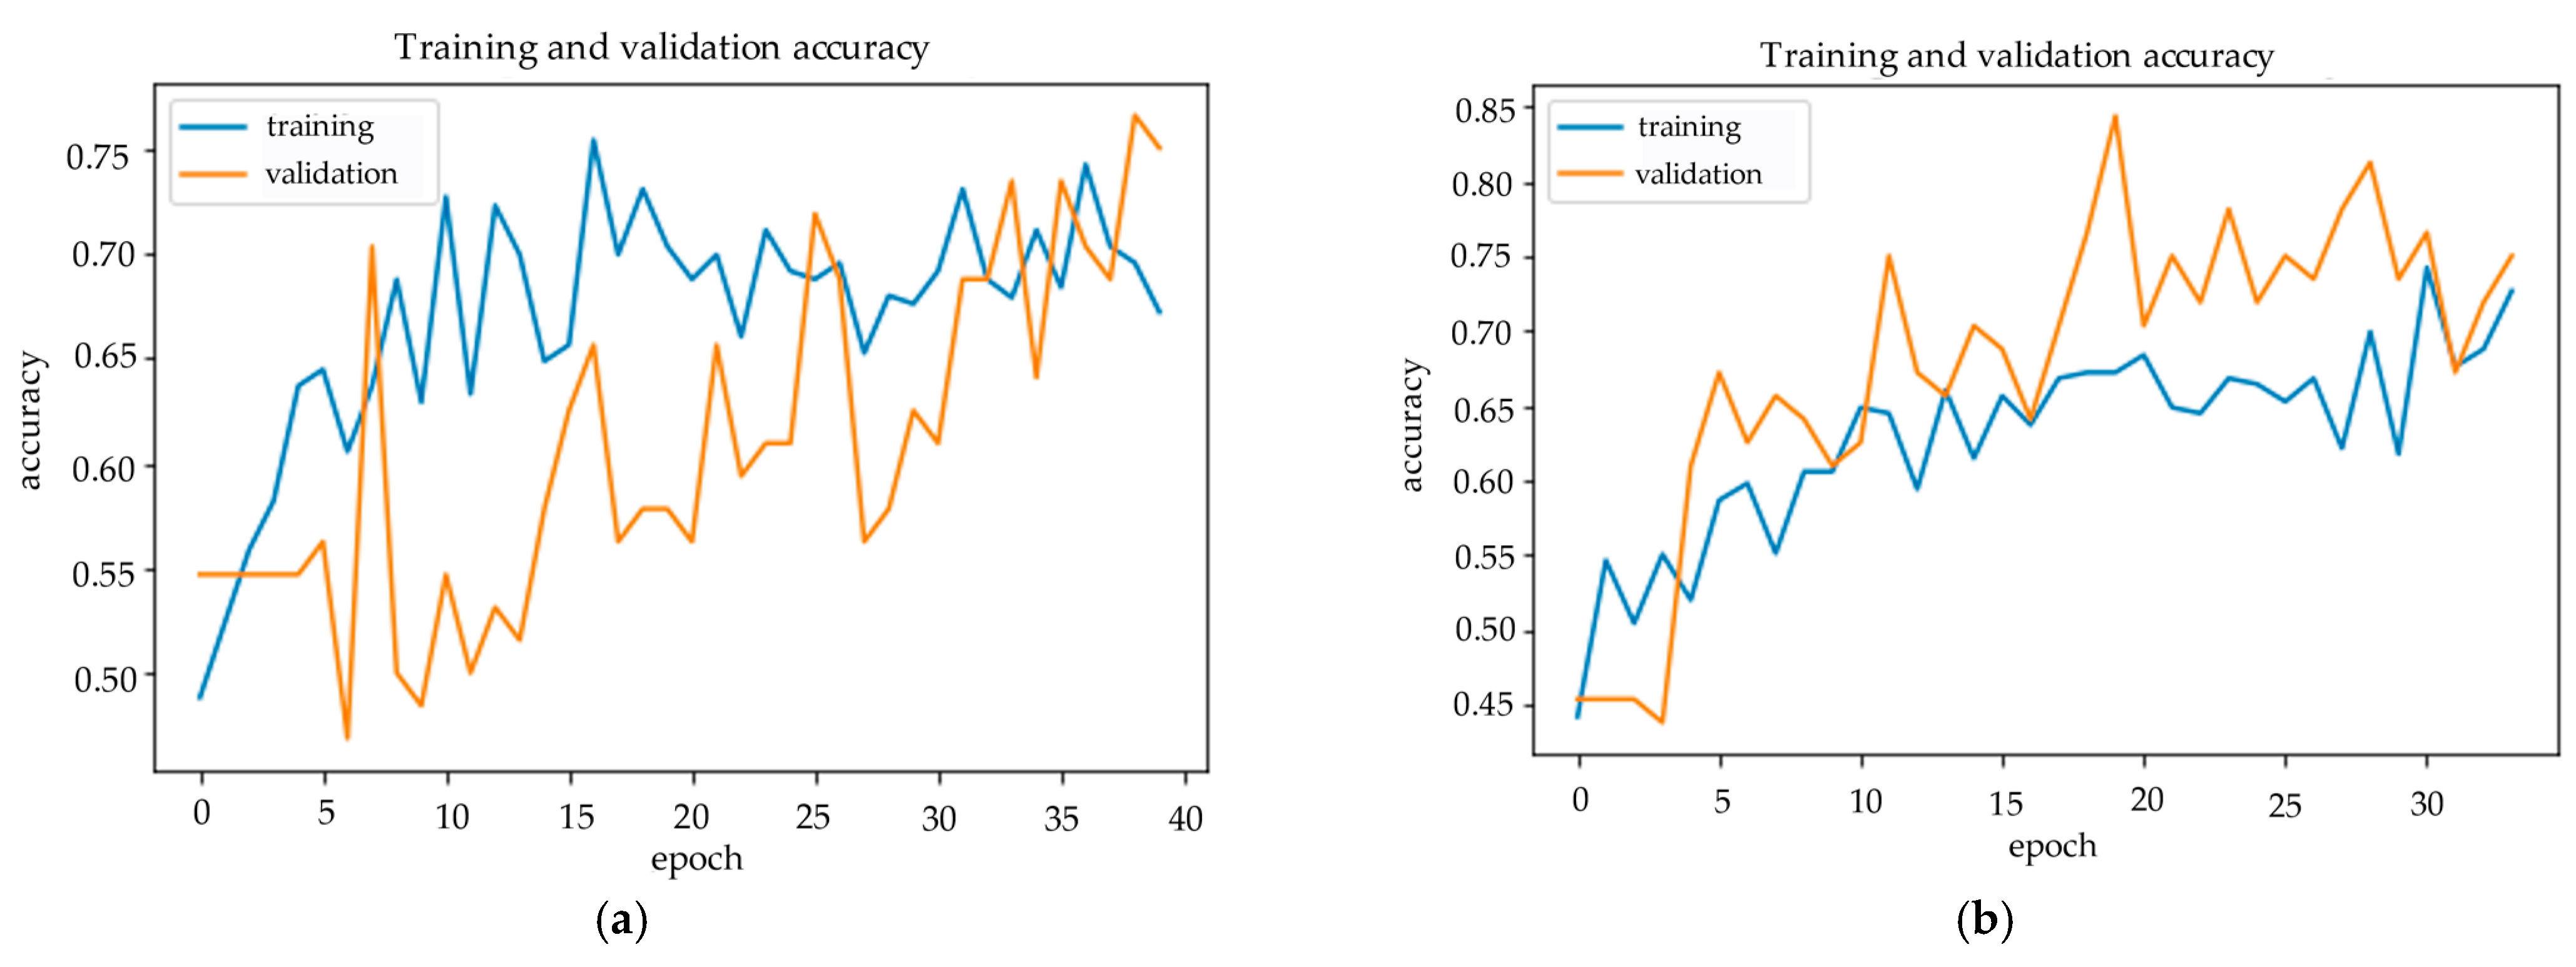
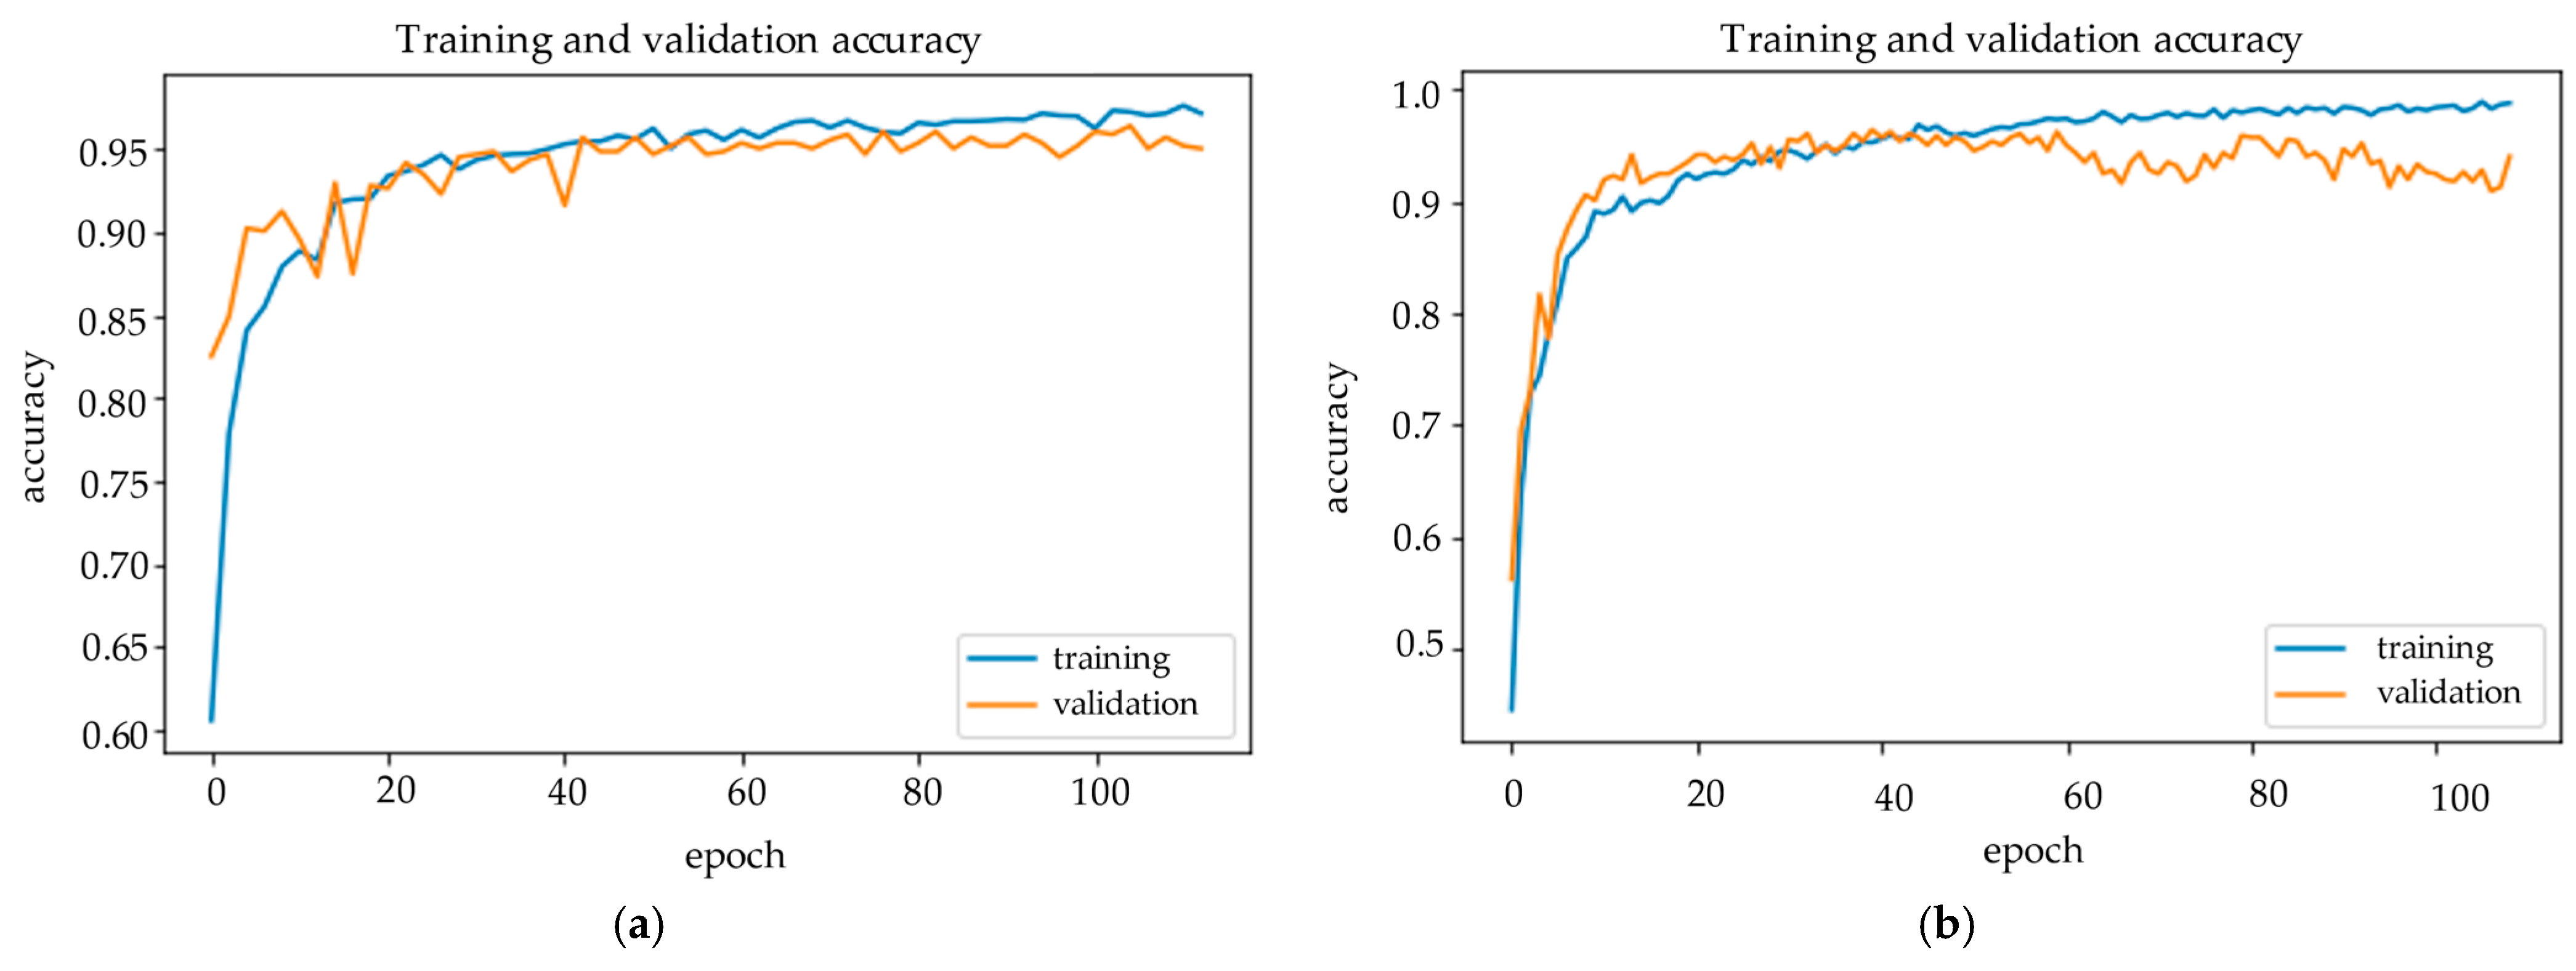
 Figure 6 and Figure 7 demonstrate the confusion matrix of inference results on the test set and training history of the Hybrid EfficientNet-DOLG and DenseNet models.

3.2. Severity Assessment Results

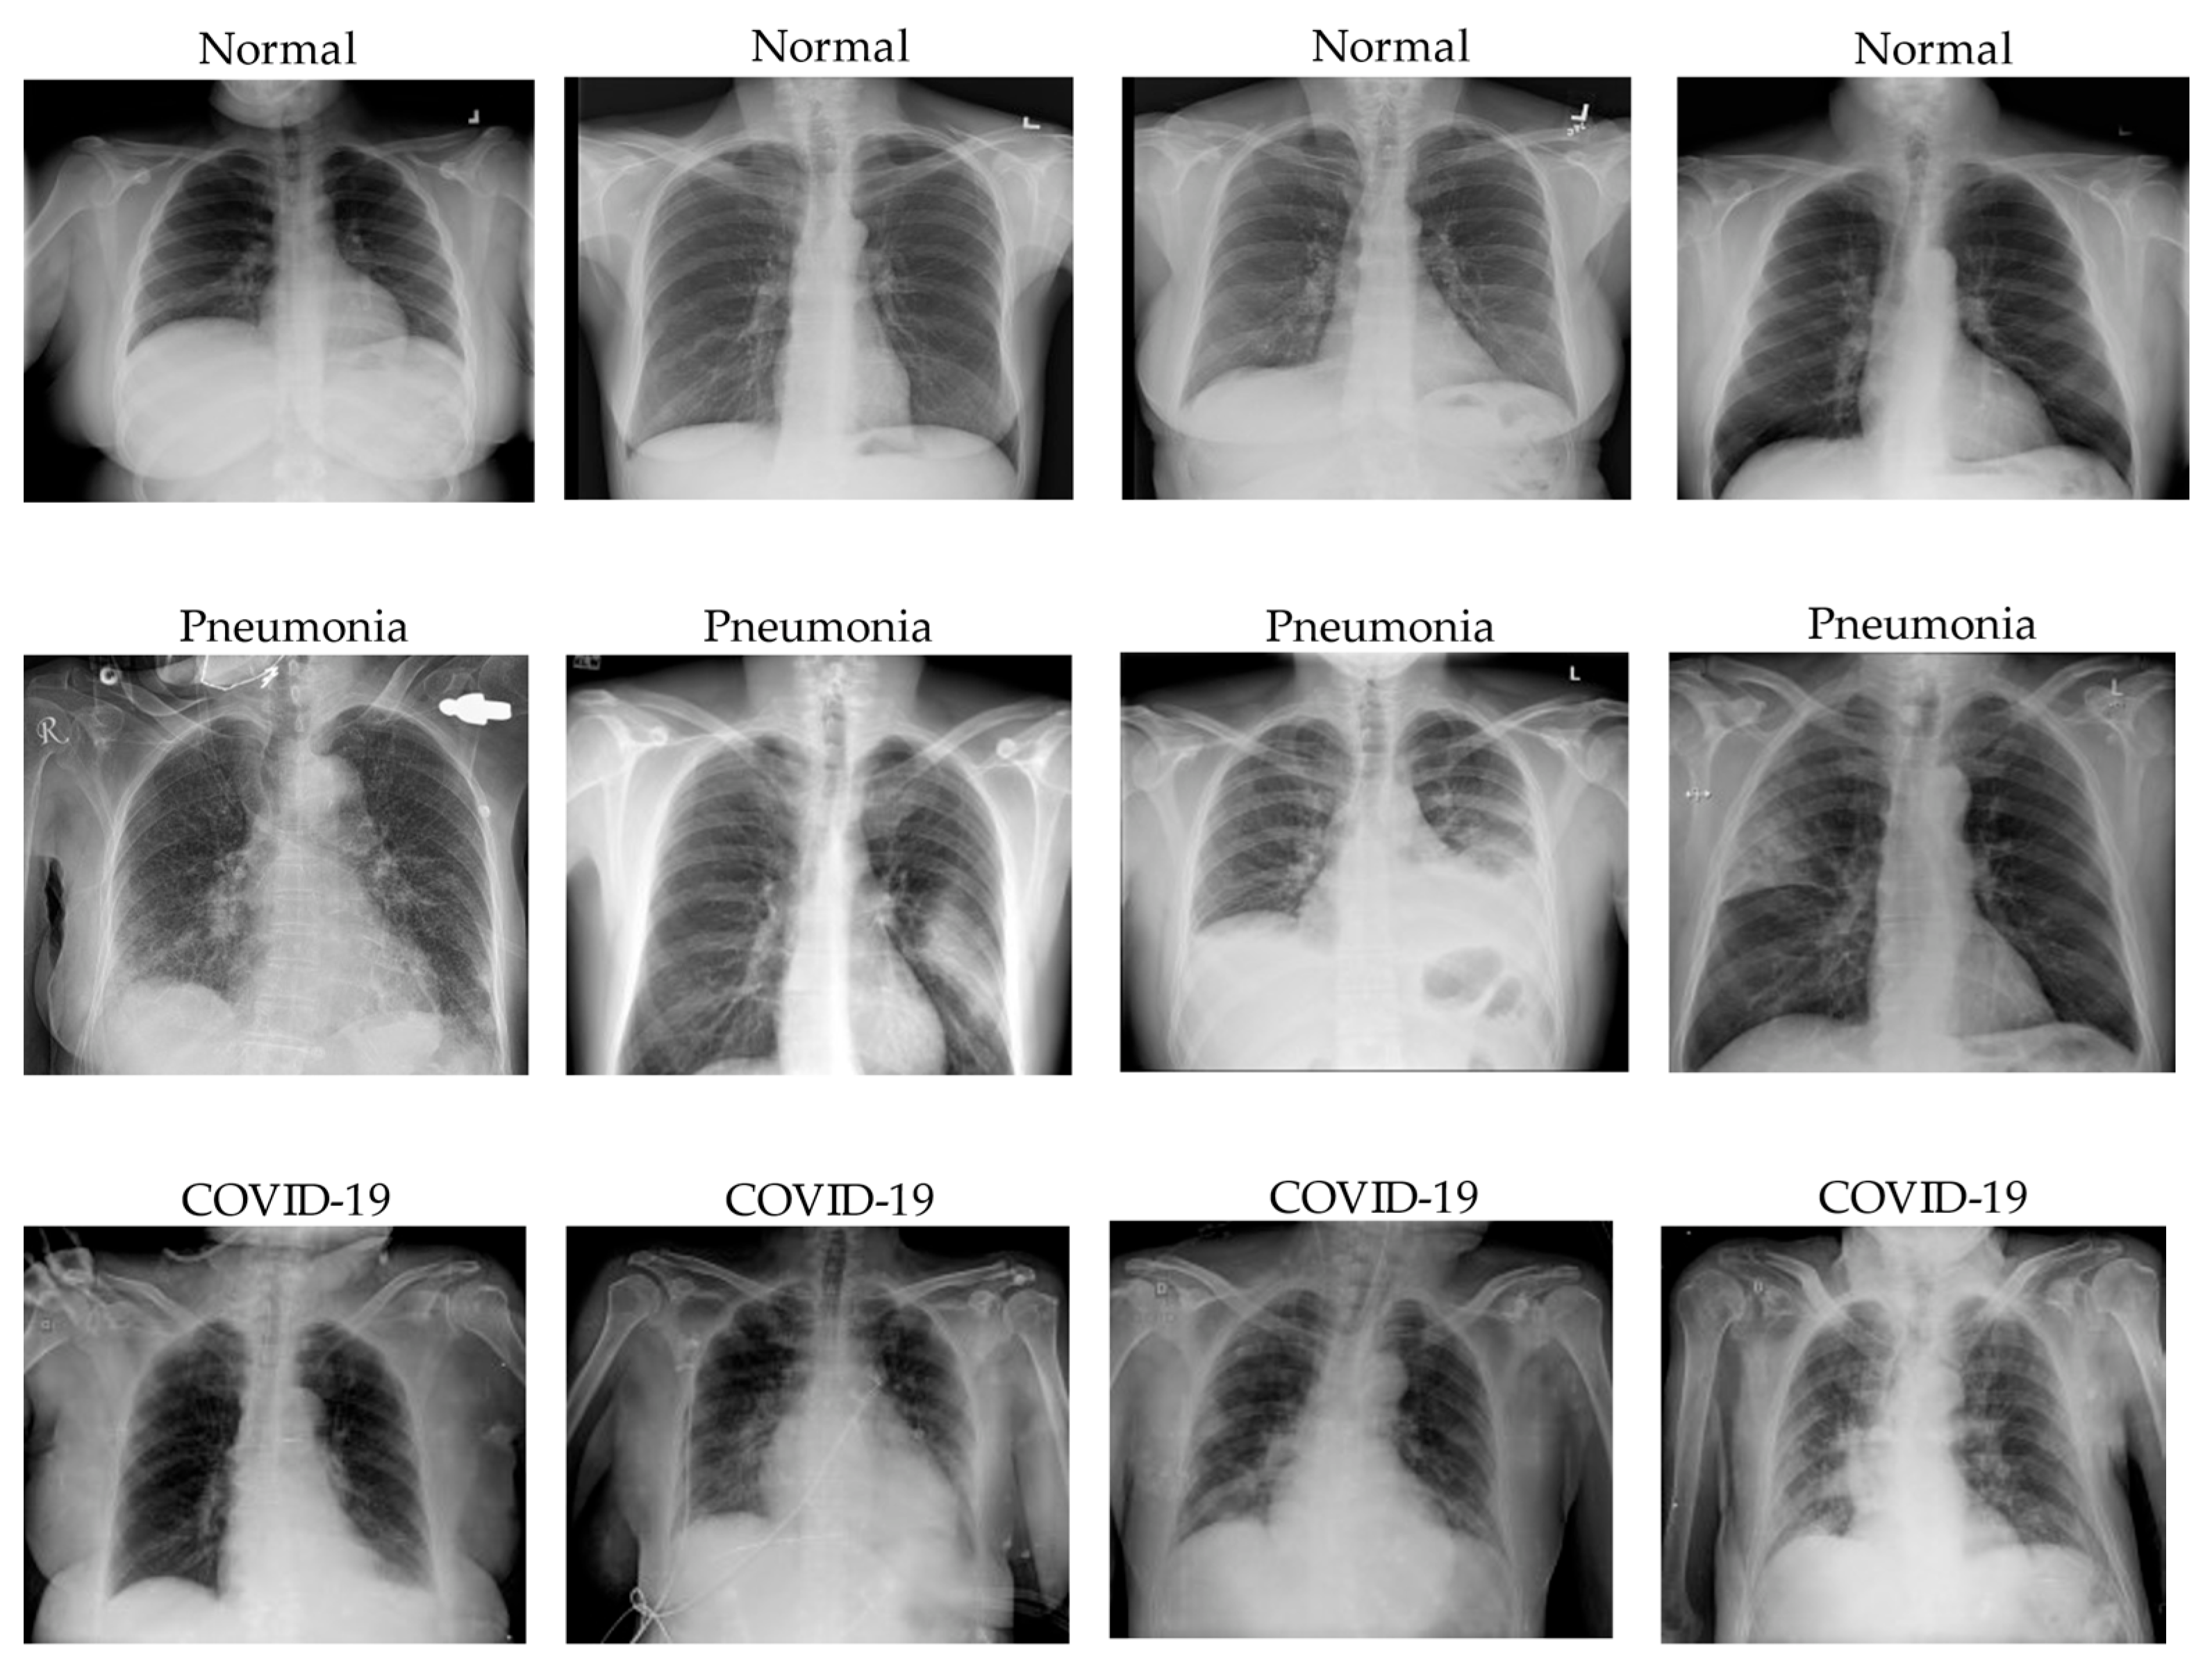
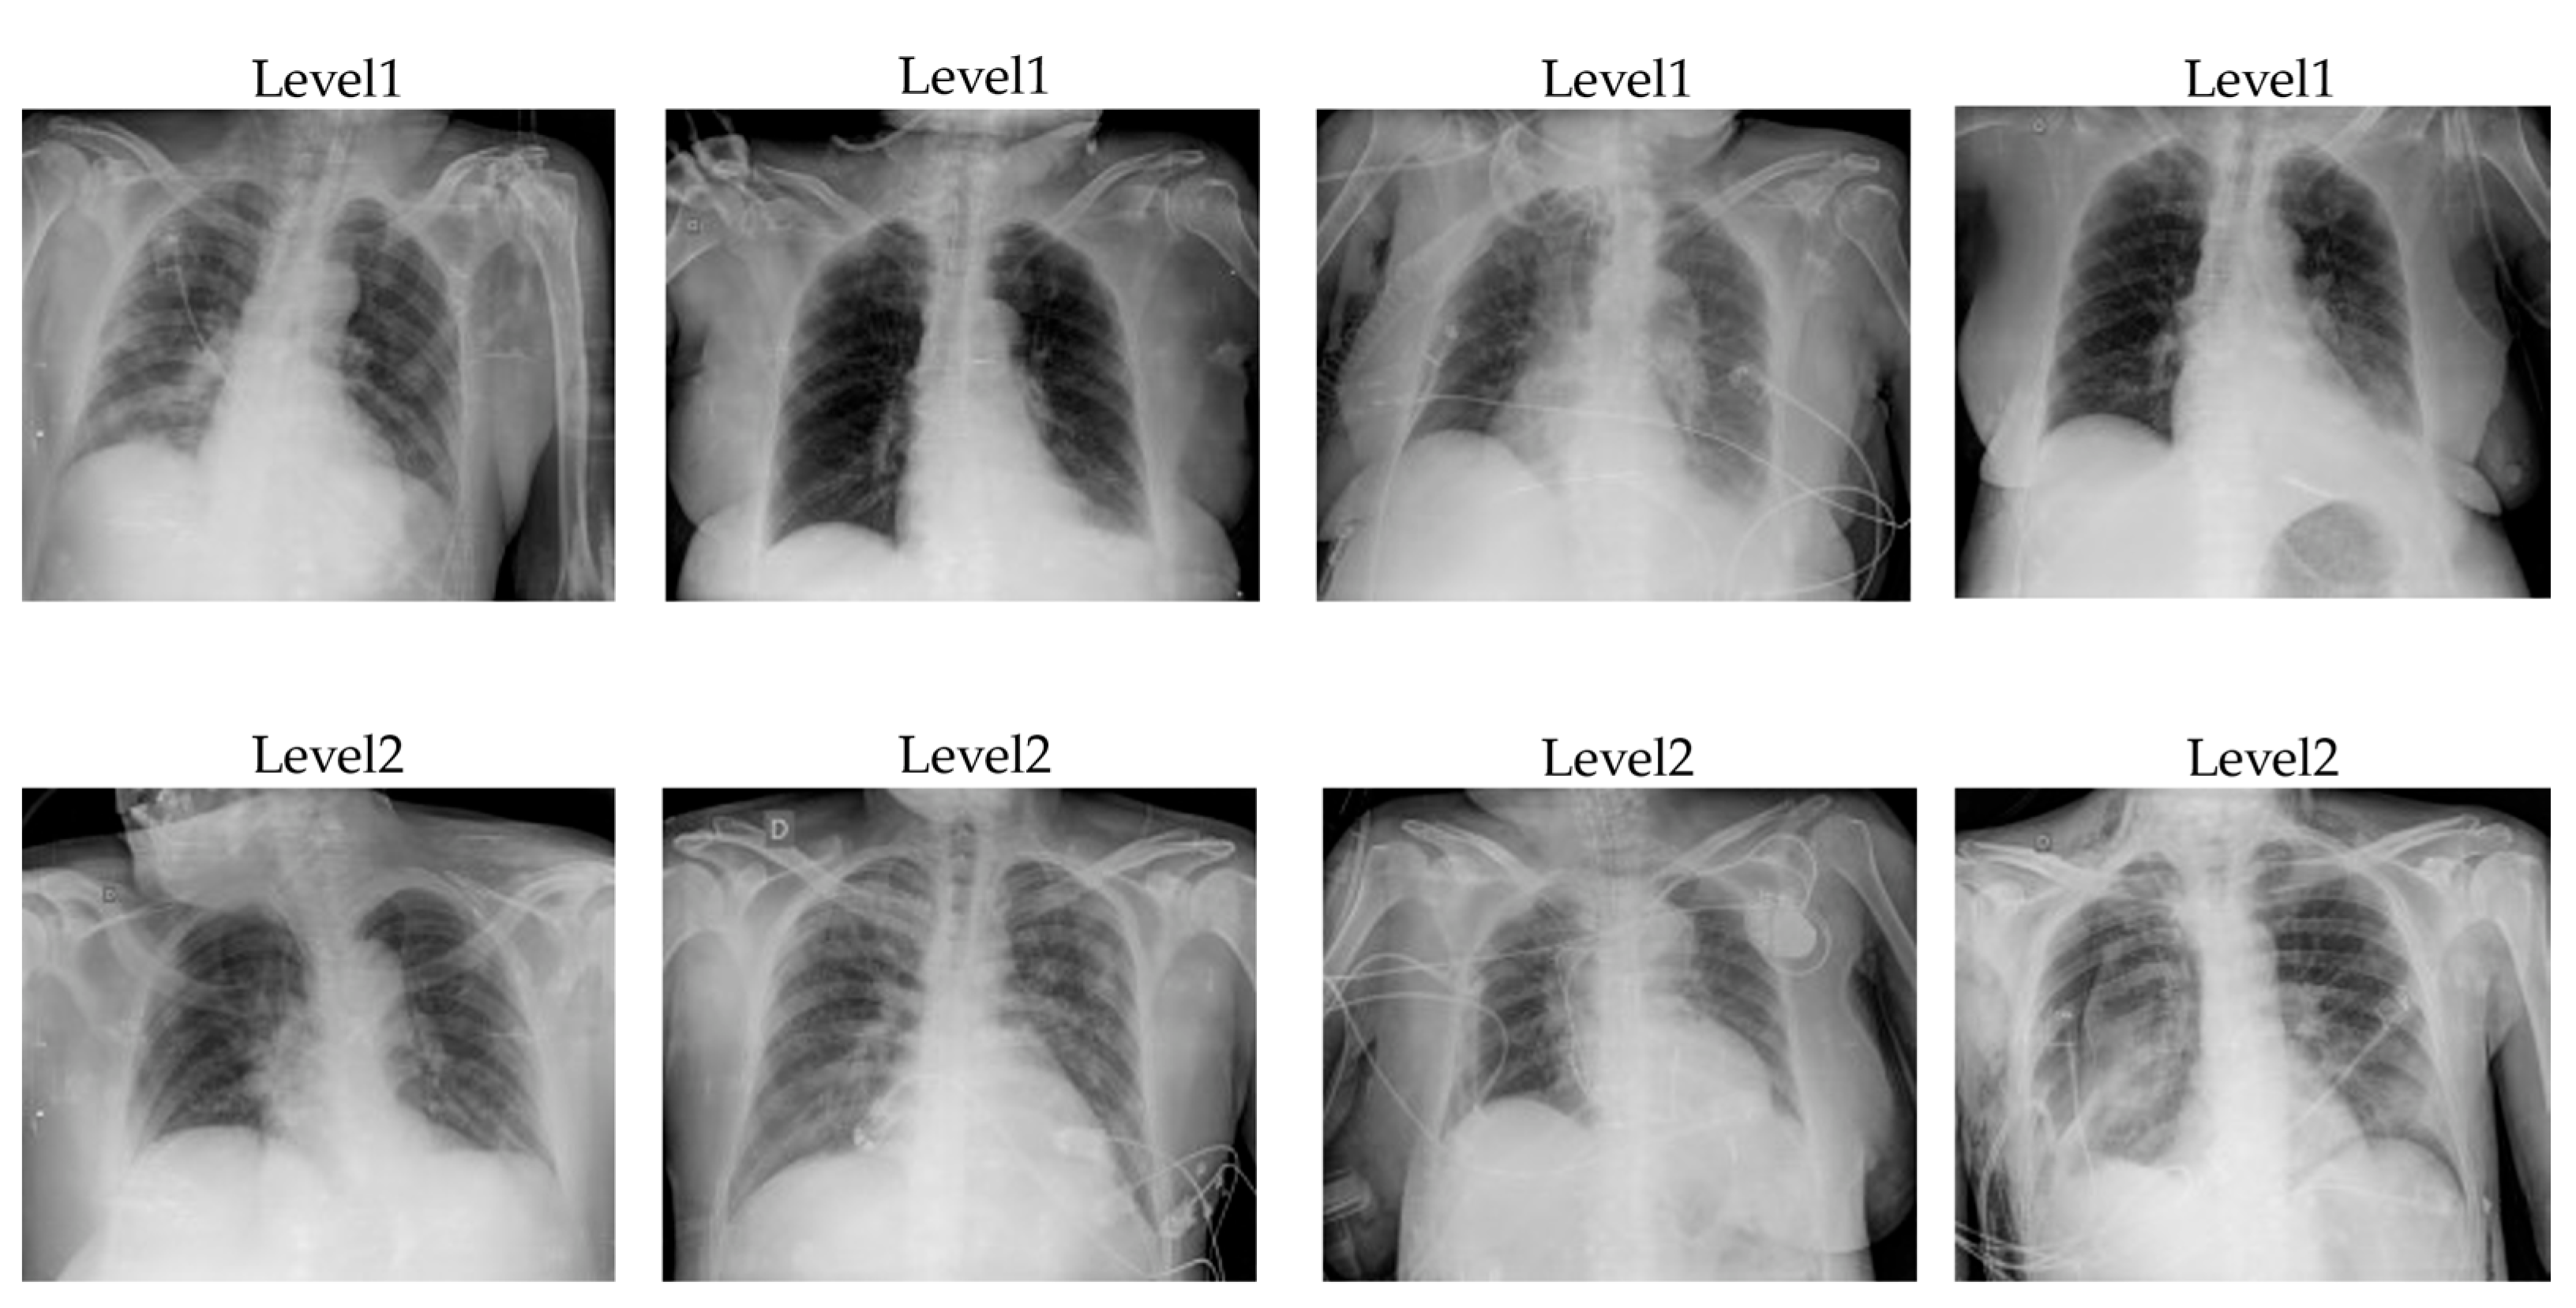
With the COVID-19 severity assessment task, we also trained the customized COVID-19 severity dataset with five models: DenseNet121, ResNet50, InceptionNet, Swin Transformer, and Hybrid EffificientNet-DOLG. The dataset contains images of two categories, level1 and level2, in which level1 indicates the patient severity is normal and the patient can self-quarantine at home without requiring a further treatment response. Level2 indicates that the patients need to have further support and need to go to the hospital for a treatment response because the pneumonia extent of COVID-19 damage is large and severe.
After training models for hours, we obtained the output results as shown in Table 7, Table 8 and Table 9. We also evaluated severity assessment results on three metrics: precision, recall, and F1-score with respect to level1, level2, macro-average, and micro-average, the same as the COVID-19 classification task. A detailed analysis of deep learning models’ performance on COVID-19 severity assessment is presented for each metric under every table.
From Table 7, we can see that with level1, DenseNet121 output had the top precision score result of 0.76, and level2 Hybrid EfficientNet-DOLG produced a precision score of 0.87. The Swin Transformer led the macro-average with a 0.81 precision score, and with respect to the micro-average, the Hybrid Efficient-DOLG also produced the highest score of 0.82. The dense connection of DenseNet helped to reduce gradients vanishing which improve the precision metric of DenseNet on level1 chest X-ray images. The Swin Transformer produced the best on macro average because the accuracy of level1 and level2 is very high, and Hybrid EfficientNet-DOLG surpassed other neural nets on micro average because its precision on level2 is the highest and on level1 almost equal DenseNet.
When comparing the precision score, we could see that the Hybrid EfficientNet-DOLG outperformed on all three categories: level1, macro-average, and micro-average with the score of 0.75, 0.80, and 0.82. The DenseNet121 produced the highest score of level2 (0.89) on the recall metric. The dense connection mechanism of DenseNet is sensitive to level2 chest X-ray images that made up the highest score for DenseNet on the recall metric. The EfficientNet encoder of the hybrid network produces overall superb performance on both level1, macro-average, and micro-average. Swin Transformer and other two convolution-based neural nets, ResNet50 and InceptionNet, also achieved comparable results with DenseNet and Hybrid EfficientNet-DOLG.
The last metric we analyzed was F1-score. In this metric, Hybrid EfficientNet-DOLG outperformed all four categories: level1, level2, macro-average, and micro-average, with scores of 0.74, 0.86, 0.80, and 0.82. The top results on the F1-score of Hybrid EfficientNet-DOLG are based on the robustness of EfficientNet as an encoder of the structure and combine with the global and local descriptor of DOLG. DenseNet also produced high output results with scores of 0.71 on level1, 0.86 on level2, 0.79 on macro-average, and 0.81 on micro-average. Output of DenseNet was only smaller than Hybrid EfficientNet-DOLG with 0.01 score gaps on level1, macro-average, and micro-average and produce the equal result on level2. Other neural nets also achieved comparable results on F1-score with DenseNet and Hybrid EfficientNet-DOLG.
Overall, we can conclude that Hybrid EfficientNet-DOLG and DenseNet are two models which produce the highest inference results on the COVID-19 severity assessment task; it is the same pattern as the performance on the COVID-19 classification task.
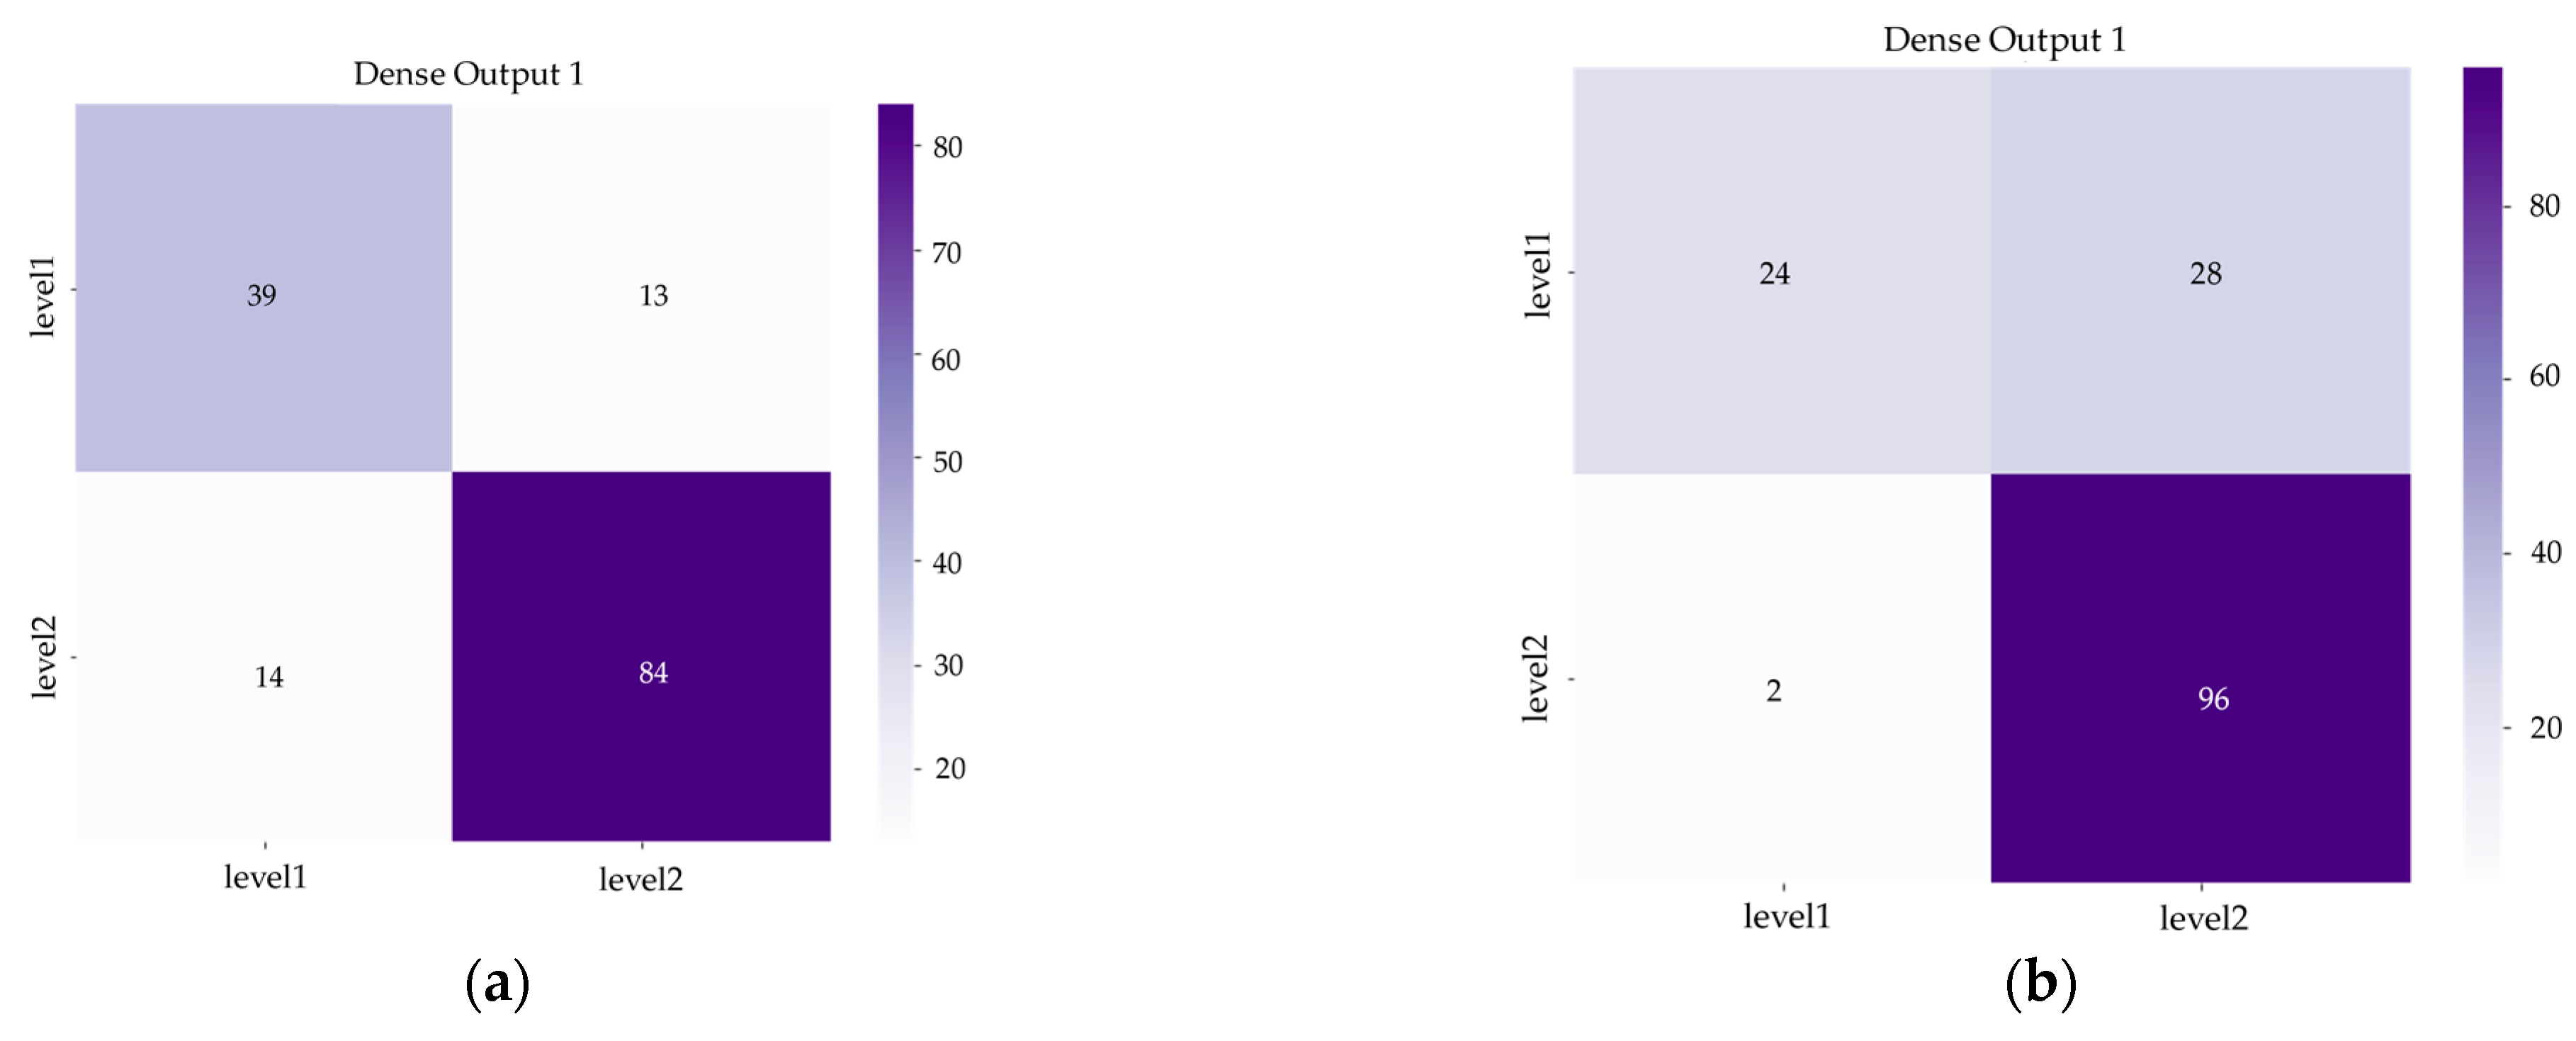
 Figure 8 and Figure 9 show us the confusion matrix and training history of DenseNet and Hybrid EfficientNet-DOLG after inferencing and training on the COVID-19 severity assessment dataset.
There are many deep learning architecture and deep transfer learning techniques that could apply to X-ray imagery as a potential method for classifying COVID-19 detection and severity assessment. Some of the architecture techniques include Wide Residual Networks [61] (WRNs) and Visual Geometry Group [62] (VGG). Wide Residual Networks are variants of ResNet, which both increase the width and decrease the depth of residual networks, and also create lightweight models with high performance. With only 16 layers, the network can outperform another convolutional neural networks with over 1000 layers on CIFAR and ImageNet datasets. The second network is VGG, which won the ImageNet Challenge 2014 and was first and second in terms of localization and classification, respectively. We have VGG16 and VGG19, which represent 16 layers and 19 layers of neural networks. In general, the architecture of VGG includes input layers, convolutional layers, hidden layers, and fully connected layers, and depending on the architecture we use, that the number of layers might be different. There is research that studies the application of deep transfer learning, including the work of Naushad et al. [63] in which the author efficiently implemented deep transfer learning techniques for land use and land cover classification based on WSNs and VGG pre-trained models. Another study by Das et al. [64] tried to apply deep transfer learning automatically to detect COVID-19 based on chest X-ray images.
This study has some limitations. First, we collected data from many open-source datasets; to some extent this might affect the model accuracy. Because X-ray images obtained from different machines have various image qualities, image color channels as well as resolutions, these factors have significantly impact on the model training pipeline. Another shortcoming of this study was the severity assessment levels; to have a more precise treatment response for patients, having many classes of severity is better than having few classes. In this study, we only focused on two classes, level1 and level2; this is not as detailed as it could be with more levels for severity diagnosis, which means a more appropriate treatment response could be designed. The last disadvantage of this paper is that we did not propose a deep learning model to customize for our chest X-ray dataset. We only used a built-in model from available libraries, which was then not as efficient as we trained on X-ray imagery. In future work, we aim to build a model that is lightweight, robust, and has a lower computational complexity for X-ray image classification tasks. We used five deep neural networks with computational complexity as follows: Swin Transformer 1038 (Giga FLOPs), InceptionNet (24.57 Giga FLOPs), Hybrid EfficientNet-DOLG (9.9 Giga FLOPs), DenseNet121 (5.69 Giga FLOPs), and ResNet50 (3.8 Giga FLOPs). We will design a network with computational complexity approximate to 10 Giga FLOPs for an efficient and robust model.

4. Conclusions

In this work, we have shown the benefits of using the chest X-ray images as an early COVID-19 screening method to have a faster and safer method of COVID-19 detection. We also created new chest X-ray datasets from the available open datasets and then we cleaned the input data by removing low-quality images to make our training dataset more balanced. The first dataset used for COVID-19, pneumonia, and normal classification was collected from the COVID CXR and Chest X-ray Pneumonia datasets, containing a total of 36,384 images, and the second dataset used for COVID-19 severity classification was collected from RICORD and RALO datasets, containing a total of 3282 images. We ran experiments on five deep learning models, which are convolution-based and transformer-based models. The results indicated that using chest X-ray images to detect and assess COVID-19 severity is a promising method since it produces a reliable inference performance. We could also see the pattern that the transformer-based models performed better than convolution-based models on all three metrics: precision, recall, and F1-score.
In future work, we will apply more data augmentation techniques such as GAN [65] to augment input data for more accurate training models. We will also consider customizing deep learning models for the chest X-ray dataset to create more robust and stable models for the COVID-19 detection and the COVID-19 severity assessment task to improve model performance. Our machine learning model currently performs well on a research scale but is not ready as a production solution. We hope that in the future we can gather more real case datasets to apply our machine learning system for practical diagnosis in clinical settings.

Author Contributions

Conceptualization, T.L.D.; funding acquisition, S.-H.L. and K.-R.K.; investigation, T.L.D.; methodology, T.L.D.; project administration, S.-H.L., S.-G.K., and K.-R.K.; software, T.L.D.; S.-H.L., S.-G.K. and K.-R.K.; supervision, S.-H.L., S.-G.K. and K.-R.K.; validation, S.-H.L., S.-G.K. and K.-R.K.; writing—original draft, T.L.D.; writing—review and editing, T.L.D. and S.-H.L. All authors have read and agreed to the published version of the manuscript.

Funding

This research was funded by the Brain Korea 21 project (BK21).

Institutional Review Board Statement

Not applicable.

Informed Consent Statement

Not applicable.

Data Availability Statement

The COVID CXR dataset is available online at https://www.kaggle.com/datasets/andyczhao/covidx-cxr2/discussion/251355 (accessed on 20 November 2021). The Chest X-ray Images (Pneumonia) dataset is available online at https://www.kaggle.com/datasets/paultimothymooney/chest-xray-pneumonia (accessed on 20 November 2021). The RICORD dataset is available online at https://www.rsna.org/covid-19/COVID-19-RICORD (accessed on 15 December 2021). The RALO dataset is available online at https://zenodo.org/record/4634000#.YkUfiShByUk (accessed on 15 December 2021).

Acknowledgments

This research was supported by the Ministry of Trade, Industry, and Energy for its financial support of the project titled “the establishment of advanced marine industry open laboratory and development of realistic convergence content” and the MSIT (Ministry of Science and ICT), Korea, under the Grand Information Technology Research Center support program (IITP-2022-2016-0-00318) supervised by the IITP (Institute for Information & communications Technology Planning & Evaluation).

Conflicts of Interest

The authors declare no conflict of interest.

Abbreviations

AIArtificial Intelligence
RT-PCRReverse Transcriptase–Polymerase Chain Reaction
RNARibonucleic Acid
RSNARadiological Society of North America
RICORDRSNA International COVID-19 Open Radiology Database
RALORadiographic Assessment of Lung Opacity Score Dataset
CXRChest X-ray
CNNConvolutional Neural Network
WRNsWide Residual Neural Networks
VGGVisual Geometry Group

References

  1. Wu, F.; Zhao, S.; Yu, B.; Chen, Y.M.; Wang, W.; Song, Z.G.; Hu, Y.; Tao, Z.W.; Tian, J.H.; Pei, Y.Y.; et al. A new coronavirus associated with human respiratory disease in China. Nature 2020, 579, 265–269. [Google Scholar] [CrossRef] [PubMed] [Green Version]
  2. Ciotti, M.; Ciccozzi, M.; Terrinoni, A.; Jiang, W.C.; Wang, C.B.; Bernardini, S. The COVID-19 pandemic. Crit. Rev. Clin. Lab. Sci. 2020, 57, 365–388. [Google Scholar] [CrossRef] [PubMed]
  3. Pfefferbaum, B.; North, C.S. Mental health and the Covid-19 pandemic. N. Engl. J. Med. 2020, 383, 510–512. [Google Scholar] [CrossRef] [PubMed]
  4. Vetter, P.; Vu, D.L.; L’Huillier, A.G.; Schibler, M.; Kaiser, L.; Jacquerioz, F. Clinical features of covid-19. BMJ 2020, 369, m1470. [Google Scholar] [CrossRef] [Green Version]
  5. Viner, R.M.; Ward, J.L.; Hudson, L.D.; Ashe, M.; Patel, S.V.; Hargreaves, D.; Whittaker, E. Systematic review of reviews of symptoms and signs of COVID-19 in children and adolescents. Arch. Dis. Child. 2021, 106, 802–807. [Google Scholar] [CrossRef]
  6. Wollina, U.; Karadağ, A.S.; Rowland-Payne, C.; Chiriac, A.; Lotti, T. Cutaneous signs in COVID-19 patients: A review. Dermatol. Ther. 2020, 33, e13549. [Google Scholar] [CrossRef]
  7. Wang, W.; Xu, Y.; Gao, R.; Lu, R.; Han, K.; Wu, G.; Tan, W. Detection of SARS-CoV-2 in Different Types of Clinical Specimens. JAMA 2020, 323, 1843–1844. [Google Scholar] [CrossRef] [Green Version]
  8. Long, C.; Xu, H.; Shen, Q.; Zhang, X.; Fan, B.; Wang, C.; Zeng, B.; Li, Z.; Li, X.; Li, H. Diagnosis of the Coronavirus disease (COVID-19): rRT-PCR or CT. Eur. J. Radiol. 2020, 126, 108961. [Google Scholar] [CrossRef]
  9. Arevalo-Rodriguez, I.; Buitrago-Garcia, D.; Simancas-Racines, D.; Zambrano-Achig, P.; Del Campo, R.; Ciapponi, A.; Sued, O.; Martinez-Garcia, L.; Rutjes, A.W.; Low, N.; et al. False-negative results of initial RT-PCR assays for COVID-19: A systematic review. PLoS ONE 2020, 15, e0242958. [Google Scholar] [CrossRef]
  10. Tahamtan, A.; Ardebili, A. Real-time RT-PCR in COVID-19 detection: Issues affecting the results. Expert Rev. Mol. Diagn. 2020, 20, 453–454. [Google Scholar] [CrossRef] [Green Version]
  11. Surkova, E.; Nikolayevskyy, V.; Drobniewski, F. False-positive COVID-19 results: Hidden problems and costs. Lancet Respir. Med. 2020, 8, 1167–1168. [Google Scholar] [CrossRef]
  12. Jacobi, A.; Chung, M.; Bernheim, A.; Eber, C. Portable chest X-ray in coronavirus disease-19 (COVID-19): A pictorial review. Clin. Imaging 2020, 64, 35–42. [Google Scholar] [CrossRef] [PubMed]
  13. Cozzi, D.; Albanesi, M.; Cavigli, E.; Moroni, C.; Bindi, A.; Luvarà, S.; Lucarini, S.; Busoni, S.; Mazzoni, L.N.; Miele, V. Chest X-ray in new Coronavirus Disease 2019 (COVID-19) infection: Findings and correlation with clinical outcome. La Radiol. Med. 2020, 125, 730–737. [Google Scholar] [CrossRef] [PubMed]
  14. Serrano, C.O.; Alonso, E.; Andrés, M.; Buitrago, N.M.; Vigara, A.P.; Pajares, M.P.; López, E.C.; Moll, G.G.; Espin, I.M.; Barriocanal, M.B.; et al. Pediatric chest X-ray in covid-19 infection. Eur. J. Radiol. 2020, 131, 109236. [Google Scholar] [CrossRef]
  15. Li, Y.; Xia, L. Coronavirus Disease 2019 (COVID-19): Role of Chest CT in Diagnosis and Management. Ajr. Am. J. Roentgenol. 2019, 214, 1280–1286. [Google Scholar] [CrossRef]
  16. Rousan, L.A.; Elobeid, E.; Karrar, M.; Khader, Y. Chest X-ray findings and temporal lung changes in patients with COVID-19 pneumonia. BMC Pulm. Med. 2020, 20, 1–9. [Google Scholar] [CrossRef]
  17. Yasin, R.; Gouda, W. Chest X-ray findings monitoring COVID-19 disease course and severity. Egypt. J. Radiol. Nucl. Med. 2020, 51, 1–18. [Google Scholar] [CrossRef]
  18. van Ginneken, B. The Potential of Artificial Intelligence to Analyze Chest Radiographs for Signs of COVID-19 Pneumonia. Radiology 2021, 299, E214–E215. [Google Scholar] [CrossRef]
  19. Khanna, M.; Agarwal, A.; Singh, L.K.; Thawkar, S.; Khanna, A.; Gupta, D. Radiologist-level two novel and robust automated computer-aided prediction models for early detection of COVID-19 infection from chest X-ray images. Arab. J. Sci. Eng. 2021, 7, 1–33. [Google Scholar] [CrossRef]
  20. Sethy, P.K.; Behera, S.K.; Anitha, K.; Pandey, C.; Khan, M.R. Computer aid screening of COVID-19 using X-ray and CT scan images: An inner comparison. J. X-Ray Sci. Technol. 2021, 29, 197–210. [Google Scholar] [CrossRef]
  21. Gozes, O.; Frid-Adar, M.; Greenspan, H.; Browning, P.D.; Zhang, H.; Ji, W.; Bernheim, A.; Siegel, E. Rapid AI Development Cycle for the Coronavirus (COVID-19) Pandemic: Initial Results for Automated Detection & Patient Monitoring using Deep Learning CT Image Analysis. arXiv 2020, arXiv:2003.05037. [Google Scholar]
  22. Narin, A.; Kaya, C.; Pamuk, Z. Automatic Detection of Coronavirus Disease (COVID-19) Using X-ray Images and Deep Convolutional Neural Networks. Pattern Anal. Appl. 2021, 24, 1207–1220. [Google Scholar] [CrossRef]
  23. Ismael, A.M.; Şengür, A. Deep learning approaches for COVID-19 detection based on chest X-ray images. Expert Syst. Appl. 2021, 164, 114054. [Google Scholar] [CrossRef]
  24. Jain, R.; Gupta, M.; Taneja, S.; Hemanth, D.J. Deep learning-based detection and analysis of COVID-19 on chest X-ray images. Appl. Intell. 2021, 51, 1690–1700. [Google Scholar] [CrossRef]
  25. Zhang, J.; Xie, Y.; Li, Y.; Shen, C.; Xia, Y. Covid-19 screening on chest X-ray images using deep learning-based anomaly detection. arXiv 2020, arXiv:2003.12338 27. [Google Scholar]
  26. Rehman, A.; Saba, T.; Tariq, U.; Ayesha, N. Deep learning-based COVID-19 detection using CT and X-ray images: Current analytics and comparisons. IT Prof. 2021, 23, 63–68. [Google Scholar] [CrossRef]
  27. Tang, S.; Wang, C.; Nie, J.; Kumar, N.; Zhang, Y.; Xiong, Z.; Barnawi, A. EDL-COVID: Ensemble deep learning for COVID-19 case detection from chest X-ray images. IEEE Trans. Ind. Inform. 2021, 17, 6539–6549. [Google Scholar] [CrossRef]
  28. Sakib, S.; Tazrin, T.; Fouda, M.M.; Fadlullah, Z.M.; Guizani, M. DL-CRC: Deep learning-based chest radiograph classification for COVID-19 detection: A novel approach. IEEE Access 2020, 8, 171575–171589. [Google Scholar] [CrossRef]
  29. Ohata, E.F.; Bezerra, G.M.; das Chagas, J.V.S.; Neto, A.V.L.; Albuquerque, A.B.; de Albuquerque, V.H.C.; Reboucas Filho, P.P. Automatic detection of COVID-19 infection using chest X-ray images through transfer learning. IEEE/CAA J. Autom. Sin. 2020, 8, 239–248. [Google Scholar] [CrossRef]
  30. Horry, M.J.; Chakraborty, S.; Paul, M.; Ulhaq, A.; Pradhan, B.; Saha, M.; Shukla, N. COVID-19 detection through transfer learning using multimodal imaging data. IEEE Access 2020, 8, 149808–149824. [Google Scholar] [CrossRef]
  31. Cortés, E.; Sánchez, S. Deep Learning Transfer with AlexNet for chest X-ray COVID-19 recognition. IEEE Lat. Am. Trans. 2021, 19, 944–951. [Google Scholar] [CrossRef]
  32. Karakanis, S.; Leontidis, G. Lightweight deep learning models for detecting COVID-19 from chest X-ray images. Comput. Biol. Med. 2021, 130, 104181. [Google Scholar] [CrossRef]
  33. Khan, A.I.; Shah, J.L.; Bhat, M.M. CoroNet: A deep neural network for detection and diagnosis of COVID-19 from chest X-ray images. Comput. Methods Programs Biomed. 2020, 196, 105581. [Google Scholar] [CrossRef]
  34. Hemdan, E.E.D.; Shouman, M.A.; Karar, M.E. Covidx-net: A framework of deep learning classifiers to diagnose covid-19 in X-ray images. arXiv 2020, arXiv:2003.11055. [Google Scholar]
  35. Wang, L.; Lin, Z.Q.; Wong, A. COVID-Net: A tailored deep convolutional neural network design for detection of COVID-19 cases from chest X-ray images. Sci. Rep. 2020, 10, 19549. [Google Scholar] [CrossRef] [PubMed]
  36. Irmak, E. COVID-19 disease severity assessment using CNN model. IET Image Processing 2021, 15, 1814. [Google Scholar] [CrossRef]
  37. Orsi, M.A.; Oliva, G.; Toluian, T.; Pittino, C.V.; Panzeri, M.; Cellina, M. Feasibility, reproducibility, and clinical validity of a quantitative chest X-ray assessment for COVID-19. Am. J. Trop. Med. Hyg. 2020, 103, 822. [Google Scholar] [CrossRef] [PubMed]
  38. Liang, W.; Yao, J.; Chen, A.; Lv, Q.; Zanin, M.; Liu, J.; Wong, S.; Li, Y.; Lu, J.; Liang, H.; et al. Early triage of critically ill COVID-19 patients using deep learning. Nat. Commun. 2020, 11, 3543. [Google Scholar] [CrossRef] [PubMed]
  39. Liang, W.; Liang, H.; Ou, L.; Chen, B.; Chen, A.; Li, C.; Li, Y.; Guan, W.; Sang, L.; Lu, J.; et al. Development and Validation of a Clinical Risk Score to Predict the Occurrence of Critical Illness in Hospitalized Patients With COVID-19. JAMA Intern. Med. 2020, 180, 1081–1089. [Google Scholar] [CrossRef]
  40. Colombi, D.; Bodini, F.C.; Petrini, M.; Maffi, G.; Morelli, N.; Milanese, G.; Silva, M.; Sverzellati, N.; Michieletti, E. Well-aerated Lung on Admitting Chest CT to Predict Adverse Outcome in COVID-19 Pneumonia. Radiology 2020, 296, E86–E96. [Google Scholar] [CrossRef] [Green Version]
  41. Wong, A.; Lin, Z.Q.; Wang, L.; Chung, A.G.; Shen, B.; Abbasi, A.; Hoshmand-Kochi, M.; Duong, T.Q. COVID-Net S: Towards computer-aided severity assessment via training and validation of deep neural networks for geographic extent and opacity extent scoring of chest X-rays for SARS-CoV-2 lung disease severity. arXiv 2020, arXiv:2005.12855. [Google Scholar]
  42. Wang, L.; Lin, Z.Q.; Wong, A. COVIDx CXR-2. Available online: https://www.kaggle.com/datasets/andyczhao/covidx-cxr2?select=competition_test (accessed on 20 November 2021).
  43. Kermany, D.; Zhang, K.; Goldbaum, M. Labeled Optical Coherence Tomography (OCT) and Chest X-ray Images for Classification. Mendeley Data 2018, V2. [Google Scholar] [CrossRef]
  44. Tsai, E.B.; Simpson, S.; Lungren, M.P.; Hershman, M.; Roshkovan, L.; Colak, E.; Erickson, B.J.; Shih, G.; Stein, A.; Kalpathy-Cramer, J.; et al. The RSNA international COVID-19 open radiology database (RICORD). Radiology 2021, 299, E204–E213. [Google Scholar] [CrossRef] [PubMed]
  45. Cohen, J.P.; Shen, B.; Abbasi, A.; Hoshmand-Kochi, M.; Glass, S.; Li, H.; Lungren, M.P.; Chaudhari, A.; Duong, T.Q. Radiographic Assessment of Lung Opacity Score Dataset. Zenodo 2021, V1. [Google Scholar] [CrossRef]
  46. Radiological Society of North America. RSNA Pneumonia Detection Challenge. Available online: https://www.kaggle.com/c/rsna-pneumonia-detection-challenge (accessed on 20 November 2021).
  47. Radiological Society of North America. COVID-19 Radiography Database. Available online: https://www.kaggle.com/datasets/tawsifurrahman/covid19-radiography-database (accessed on 20 November 2021).
  48. Chung, A. Figure 1 COVID-19 Chest X-Ray Data Initiative. Available online: https://github.com/agchung/Figure1-COVID-chestxray-dataset (accessed on 20 November 2021).
  49. Chung, A. ActualMed COVID-19 Chest X-ray Data Initiative. Available online: https://github.com/agchung/Actualmed-COVID-chestxray-dataset (accessed on 20 November 2021).
  50. Cohen, J.P.; Morrison, P.; Dao, L. COVID-19 image data collection. arXiv 2020, arXiv:2003.11597. [Google Scholar]
  51. Huang, G.; Liu, Z.; Van Der Maaten, L.; Weinberger, K.Q. Densely connected convolutional networks. In Proceedings of the IEEE Conference on Computer Vision and Pattern Recognition, Honolulu, HI, USA, 26 July 2017. [Google Scholar] [CrossRef] [Green Version]
  52. He, K.; Zhang, X.; Ren, S.; Sun, J. Deep residual learning for image recognition. In Proceedings of the IEEE Conference on Computer Vision and Pattern Recognition, Las Vegas, NV, USA, 30 June 2016. [Google Scholar] [CrossRef] [Green Version]
  53. Szegedy, C.; Liu, W.; Jia, Y.; Sermanet, P.; Reed, S.; Anguelov, D.; Erhan, D.; Vanhoucke, V.; Rabinovich, A. Going Deeper with Convolutions. In Proceedings of the IEEE Conference on Computer Vision and Pattern Recognition, Boston, MA, USA, 12 June 2015. [Google Scholar] [CrossRef] [Green Version]
  54. Liu, Z.; Lin, Y.; Cao, Y.; Hu, H.; Wei, Y.; Zhang, Z.; Lin, S.; Guo, B. Swin Transformer: Hierarchical Vision Transformer using Shifted Windows. In Proceedings of the IEEE/CVF International Conference on Computer Vision, Montreal, QC, Canada, 17 October 2021. [Google Scholar] [CrossRef]
  55. Henkel, C. Efficient large-scale image retrieval with deep feature orthogonality and Hybrid-Swin-Transformers. arXiv 2021, arXiv:2110.03786. [Google Scholar]
  56. Yang, M.; He, D.; Fan, M.; Shi, B.; Xue, X.; Li, F.; Ding, E.; Huang, J. DOLG: Single-Stage Image Retrieval with Deep Orthogonal Fusion of Local and Global Features. In Proceedings of the IEEE/CVF International Conference on Computer Vision, Montreal, QC, Canada, 17 October 2021. [Google Scholar] [CrossRef]
  57. Tan, M.; Le, Q. EfficientNet: Rethinking Model Scaling for Convolutional Neural Networks. In Proceedings of the International Conference on Machine Learning, Long Beach, CA, USA, 15 June 2019. [Google Scholar]
  58. Bassi, P.R.; Attux, R. A deep convolutional neural network for COVID-19 detection using chest X-rays. Res. Biomed. Eng. 2022, 38, 139–148. [Google Scholar] [CrossRef]
  59. Nishio, M.; Noguchi, S.; Matsuo, H.; Murakami, T. Automatic classification between COVID-19 pneumonia, non-COVID-19 pneumonia, and the healthy on chest X-ray image: Combination of data augmentation methods. Sci. Rep. 2020, 10, 1–6. [Google Scholar] [CrossRef]
  60. Kingma, D.P.; Ba, J. Adam: A Method for Stochastic Optimization. arXiv 2014, arXiv:1412.6980. [Google Scholar]
  61. Zagoruyko, S.; Komodakis, N. Wide Residual Networks. arXiv 2016, arXiv:1605.07146. [Google Scholar]
  62. Simonyan, K.; Zisserman, A. Very Deep Convolutional Networks for Large-Scale Image Recognition. arXiv 2016, arXiv:1409.1556. [Google Scholar]
  63. Naushad, R.; Kaur, T.; Ghaderpour, E. Deep Transfer Learning for Land Use and Land Cover Classification: A Comparative Study. Sensors 2021, 21, 8083. [Google Scholar] [CrossRef]
  64. Das, N.N.; Kumar, N.; Kaur, M.; Kumar, V.; Singh, D. Automated Deep Transfer Learning-Based Approach for Detection of COVID-19 Infection in Chest X-rays. IRBM 2020, 43, 114–119. [Google Scholar] [CrossRef]
  65. Goodfellow, I.; Pouget-Abadie, J.; Mirza, M.; Xu, B.; Warde-Farley, D.; Ozair, S.; Courville, A.; Bengio, Y. Generative Adversarial Nets. In Proceedings of the Advances in Neural Information Processing Systems, Montreal, QC, Canada, 13 December 2014. [Google Scholar]
Figure 1. Image samples from the customized COVID-19 classification dataset with respect to Normal, Pneumonia, and COVID-19 classes.
Applsci 12 04861 g001
Figure 2. Image samples from the customized COVID-19 severity assessment dataset with respect to level1 and level2 classes.
Applsci 12 04861 g002
Figure 3. Hybrid EfficientNet-B5 and DOLG architecture.
Applsci 12 04861 g003
Figure 4. Image samples after applying augmentation techniques.
Applsci 12 04861 g004
Figure 5. Sparse Categorical Cross Entropy use for multi-categorical classification.
Applsci 12 04861 g005
Figure 6. Confusion matrix of (a) DenseNet and (b) Hybrid EfficientNet-DOLG on the COVID-19 classification task. Darker colors illustrate larger number of the correct predicted labels.
Applsci 12 04861 g006
Figure 7. Training history of (a) DenseNet and (b) Hybrid EfficientNet-DOLG on the COVID-19 classification task.
Applsci 12 04861 g007
Figure 8. Confusion matrix of (a) DenseNet and (b) Hybrid EfficientNet-DOLG on the COVID-19 severity assessment task. Darker colors illustrate larger number of the correct predicted labels.
Applsci 12 04861 g008
Figure 9. Training history of (a) DenseNet and (b) Hybrid EfficientNet-DOLG on the COVID-19 severity assessment task.
Applsci 12 04861 g009
Table 1. Detailed description of the COVID-19 classification dataset from the Chest X-ray and COVIDX-CXR-3 datasets.
SetsCategoryChest X-rayCOVIDX-CXR-3Total
TrainCOVID-19-13,19213,192
Normal329044447734
Pneumonia341844447862
ValidationCOVID-19-32983298
Normal82111111932
Pneumonia85511111966
TestCOVID-19-200200
Normal-100100
Pneumonia-100100
Table 2. Detailed description of the COVID-19 severity assessment dataset from the RICORD and RALO datasets.
SetsCategoryRICORDRALOTotal
Trainlevel1140845985
level246710541521
Validationlevel135211246
level2117263380
Testlevel152-52
level298-98
Table 3. Detailed description of the five deep learning models used in this paper.
ArchitectureInput ShapeTrainable ParametersNon-Trainable ParametersTotal Parameters
DensNet121 [51](384, 384, 3)6,956,93183,6487,040,579
ResNet50 [52](384, 384, 3)25,583,59253,12025,636,712
InceptionNet [53](384, 384, 3)54,673,50763,61654,737,123
Swin Transformer [54](224, 224, 3)86,746,299336,14087,082,439
Hybrid EfficientNet-DOLG [55](384, 384, 3)32,843,059170,69533,013,754
Table 4. Comparing results between the five deep learning models on the COVID-19 classification task with respect to precision metric score.
MethodsPrecision
COVID-19NormalPneumoniaMacro-AverageMicro-Average
DenseNet1210.980.910.940.940.95
ResNet500.980.830.930.920.94
InceptionNet0.980.830.900.900.92
Swin Transformer0.990.620.890.830.87
Hybrid EfficientNet-DOLG0.980.930.930.950.96
Table 5. Comparing results between the five deep learning models on the COVID-19 classification task with respect to recall metric.
MethodsRecall
COVID-19NormalPneumoniaMacro-AverageMicro-Average
DenseNet1210.980.940.920.950.95
ResNet500.940.960.890.930.93
InceptionNet0.930.880.940.920.92
Swin Transformer0.700.970.900.860.82
Hybrid EfficientNet-DOLG0.970.940.950.960.96
Table 6. Comparing results between the five deep learning models on the COVID-19 classification task with respect to F1-score metric.
MethodsF1-Score
COVIDNormalPneumoniaMacro-AverageMicro-Average
DenseNet1210.980.950.930.940.95
ResNet500.960.890.910.920.93
InceptionNet0.960.850.920.910.92
Swin Transformer0.820.750.900.820.82
Hybrid EfficientNet-DOLG0.990.940.940.950.96
Table 7. Comparing results between the five deep learning models on COVID-19 severity assessment task with respect to precision metric.
MethodsPrecision
Level1Level2Macro-AverageMicro-Average
DenseNet1210.760.840.800.81
ResNet500.740.770.760.76
InceptionNet0.720.770.750.75
Swin Transformer0.750.860.810.80
Hybrid EfficientNet-DOLG0.740.870.800.82
Table 8. Comparing results between the five deep learning models on the COVID-19 severity assessment task with respect to recall metric.
MethodsRecall
Level1Level2Macro-AverageMicro-Average
DenseNet1210.670.890.780.81
ResNet500.650.850.700.77
InceptionNet0.700.800.700.76
Swin Transformer0.720.800.730.75
Hybrid EfficientNet-DOLG0.750.860.800.82
Table 9. Comparing results between the five deep learning models on the COVID-19 severity assessment task with respect to F1-score metric.
MethodsF1-Score
Level1Level2Macro-AverageMicro-Average
DenseNet1210.710.860.790.81
ResNet500.600.840.720.75
InceptionNet0.650.840.750.77
Swin Transformer0.620.840.630.69
Hybrid EfficientNet-DOLG0.740.860.800.82
Publisher’s Note: MDPI stays neutral with regard to jurisdictional claims in published maps and institutional affiliations.

