
Analysis of Hydrogen Filling of 175 Liter Tank for Large-Sized Hydrogen Vehicle


Abstract
:1. Introduction
2. Numerical Implementation
2.1. Governing Equation
2.2. Assumptions
- (1)
- Thermal properties of liner (aluminum) and laminate (CFRP) for the calculation materials were considered as constant with temperature.
- (2)
- Under high-speed jet and strong convection of hydrogen gas during the filling process, the influences of gravity are relatively small. Based on a two-dimensional axisymmetric model, the buoyancy effect is neglected.
- (3)
- Temperature of inlet gas is considered as a constant of pre-cooling temperature of 233 K. Additionally, the initial temperature of the hydrogen tank is considered as the ambient temperature.
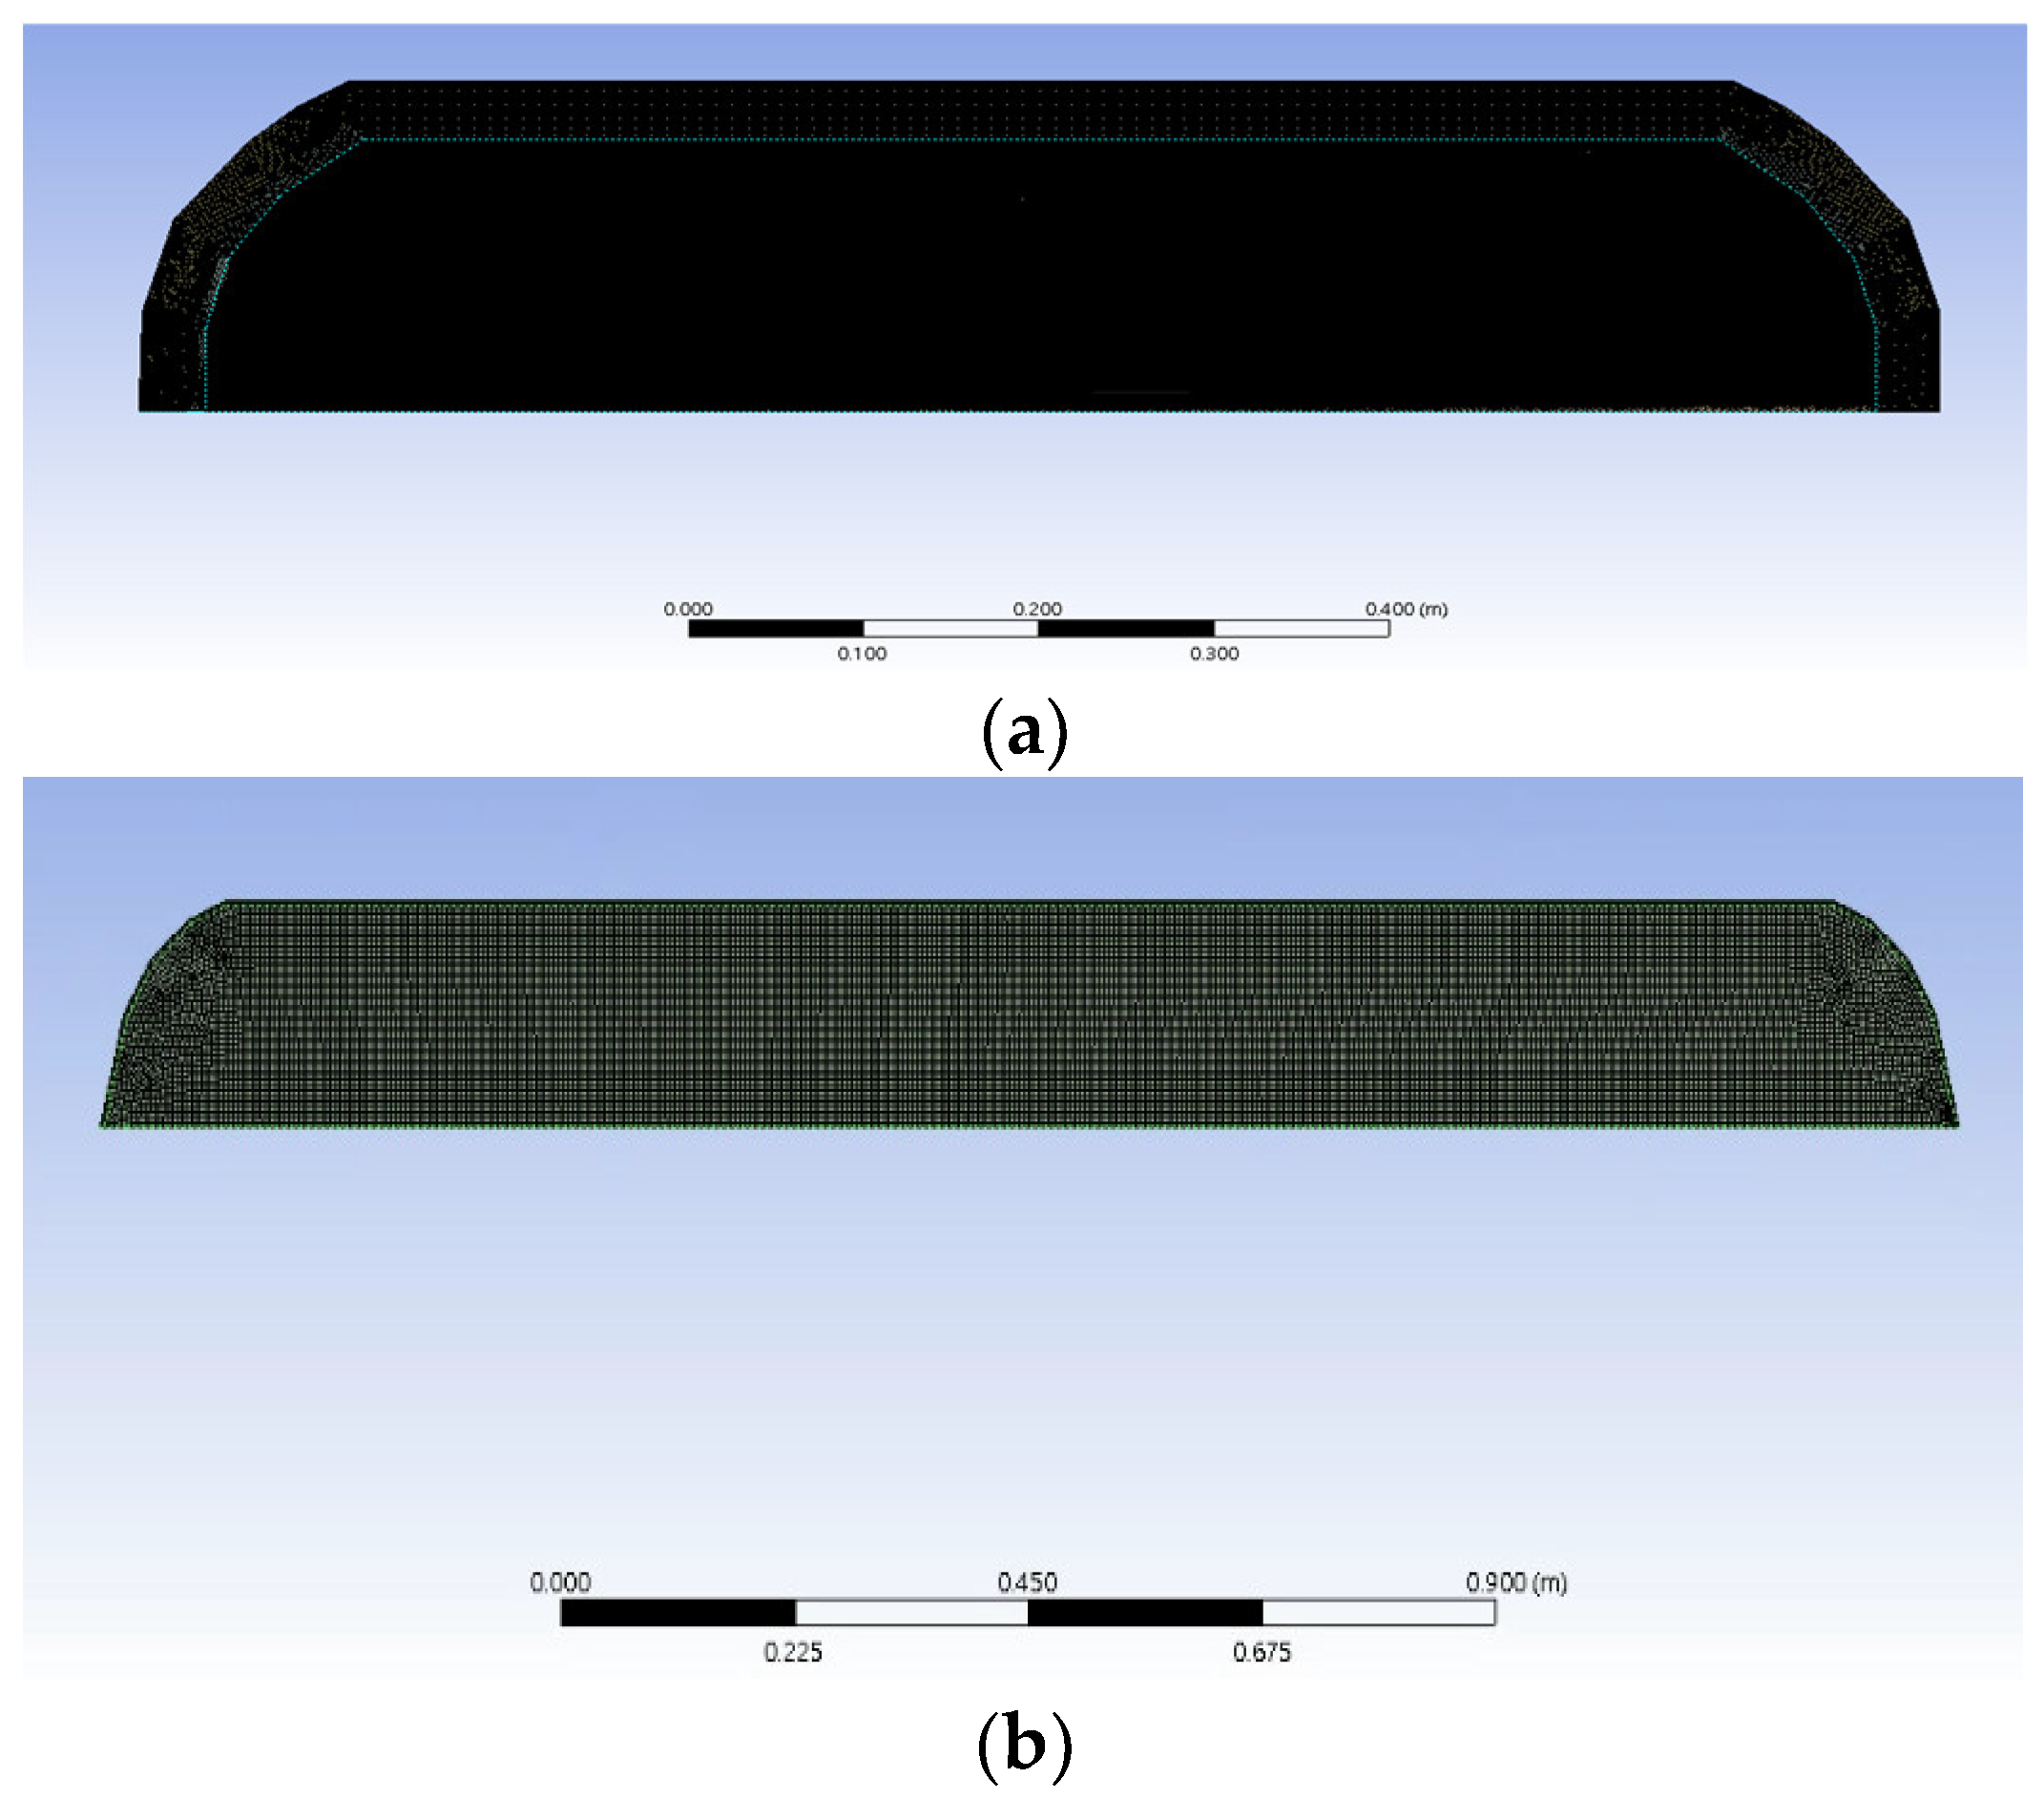
2.3. Calculation Conditions
3. Result and Discussion
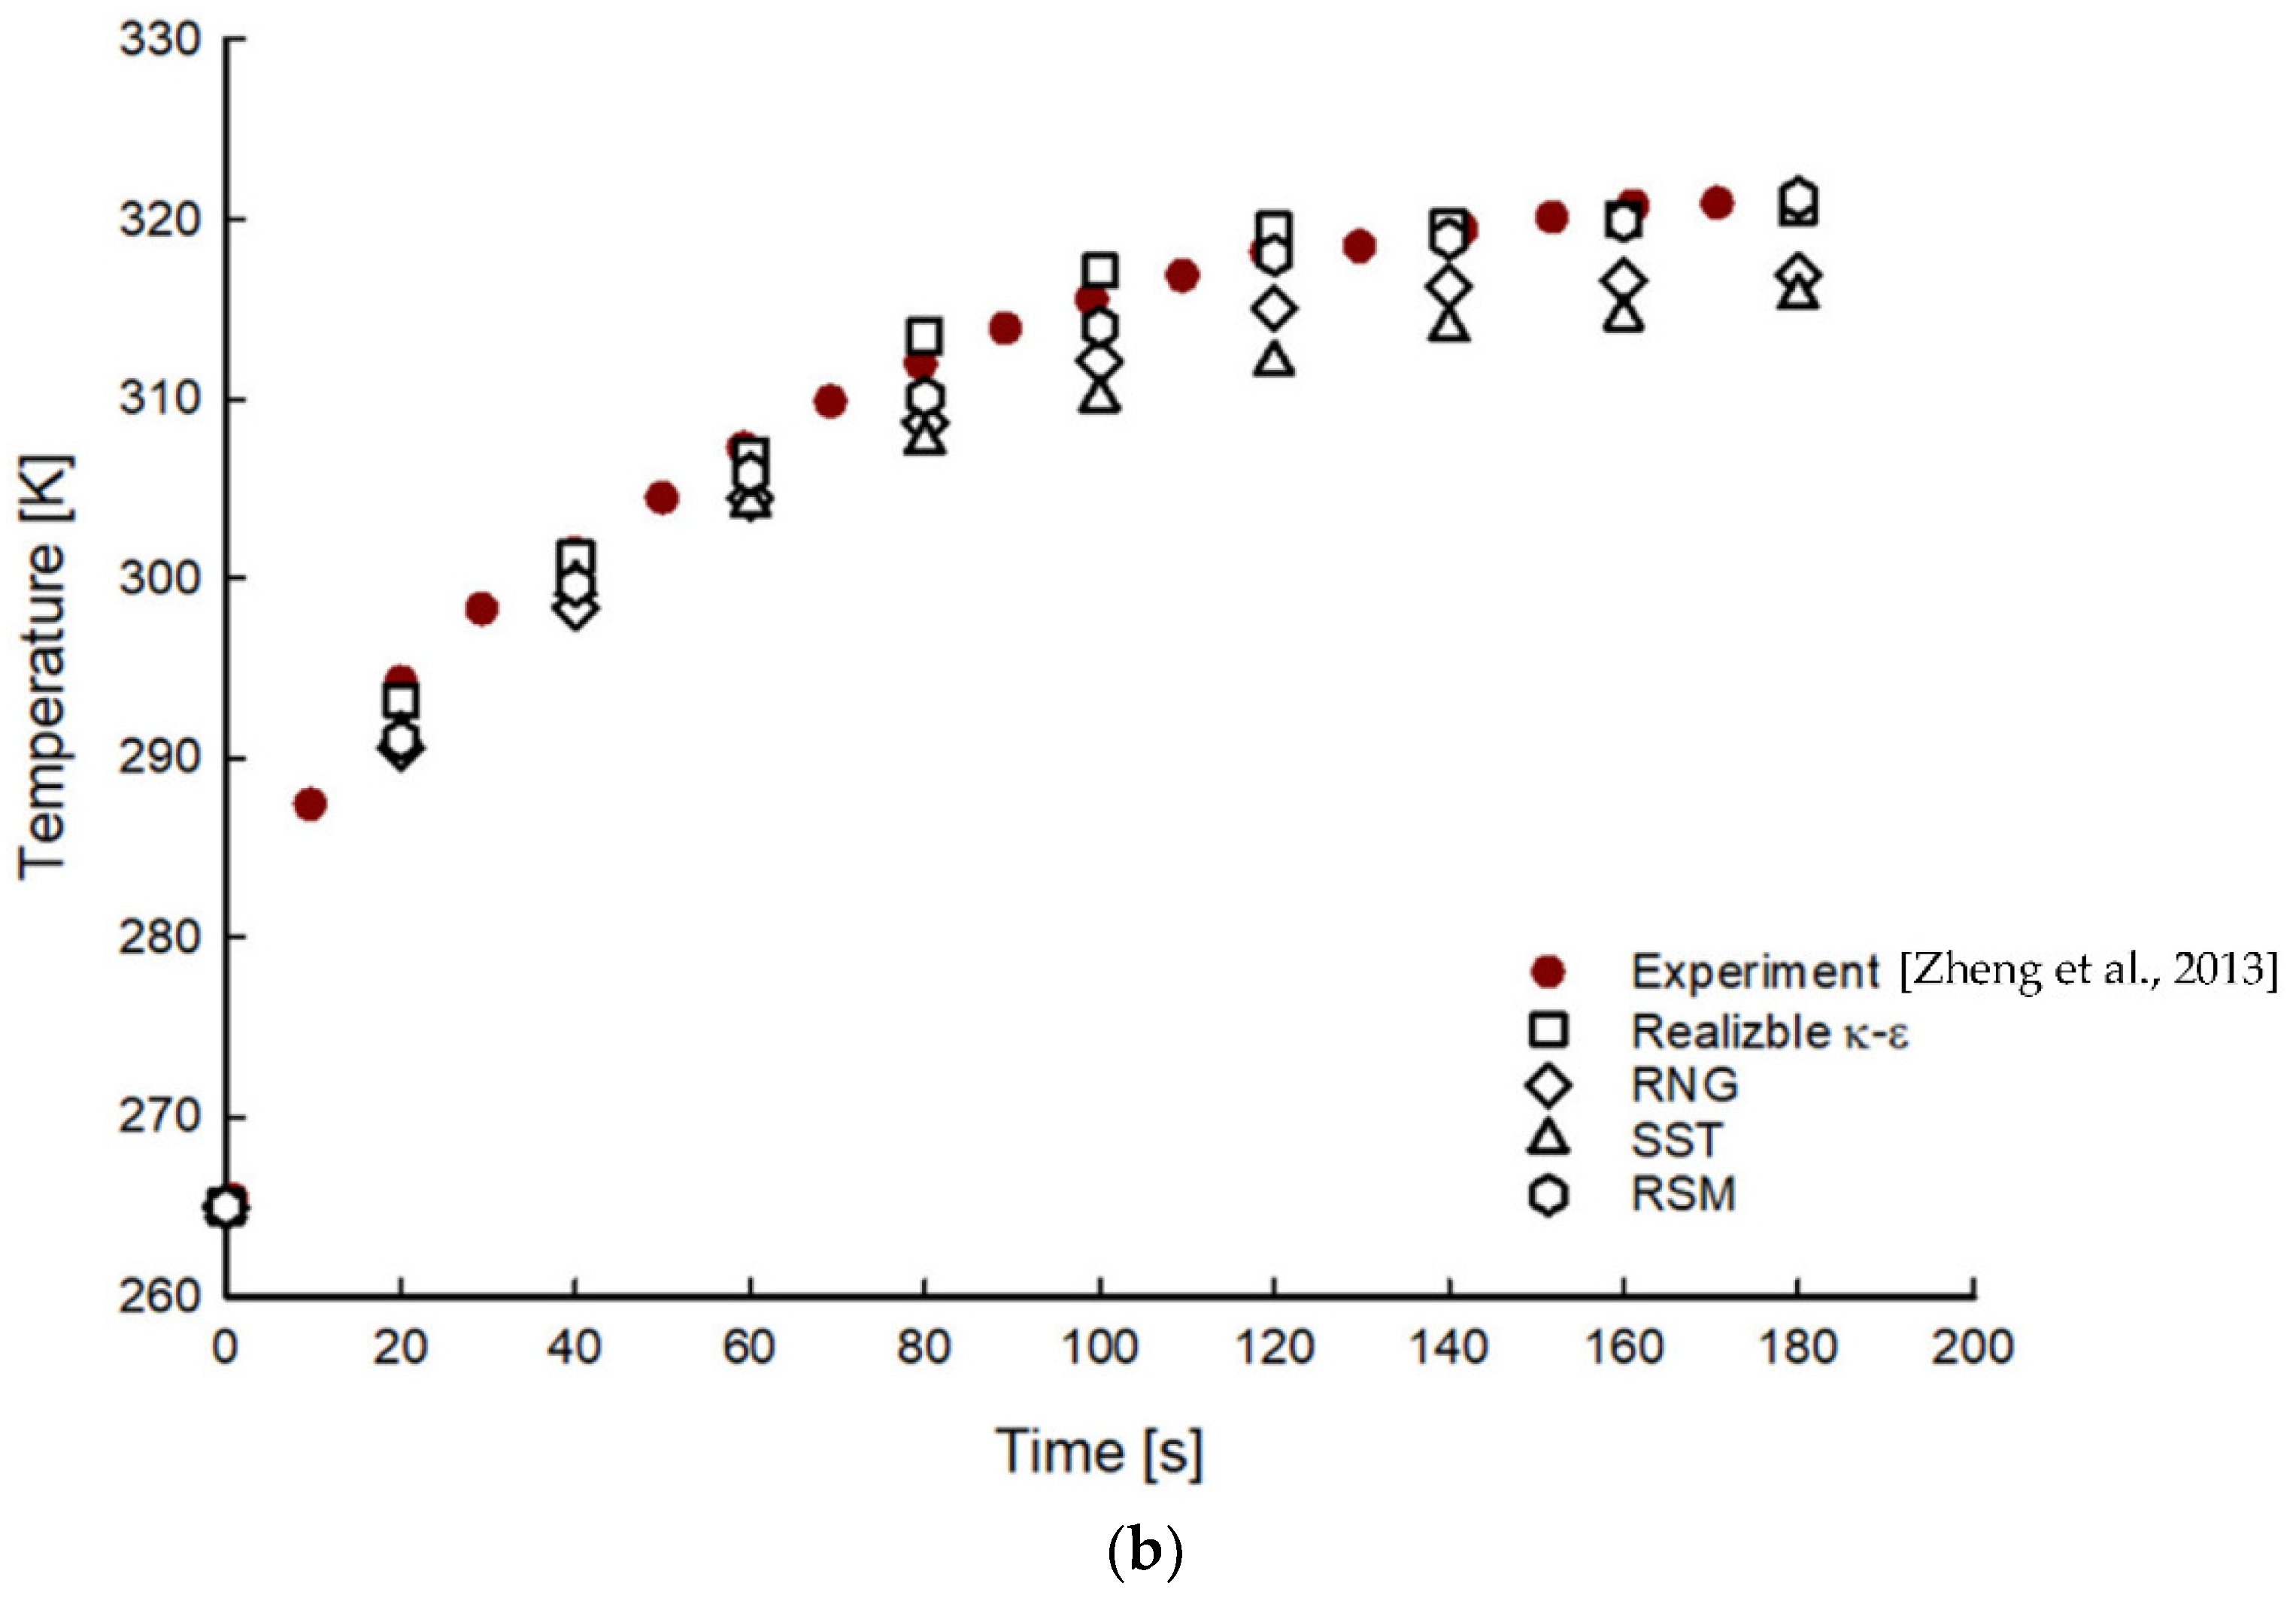
3.1. Numerical Validation
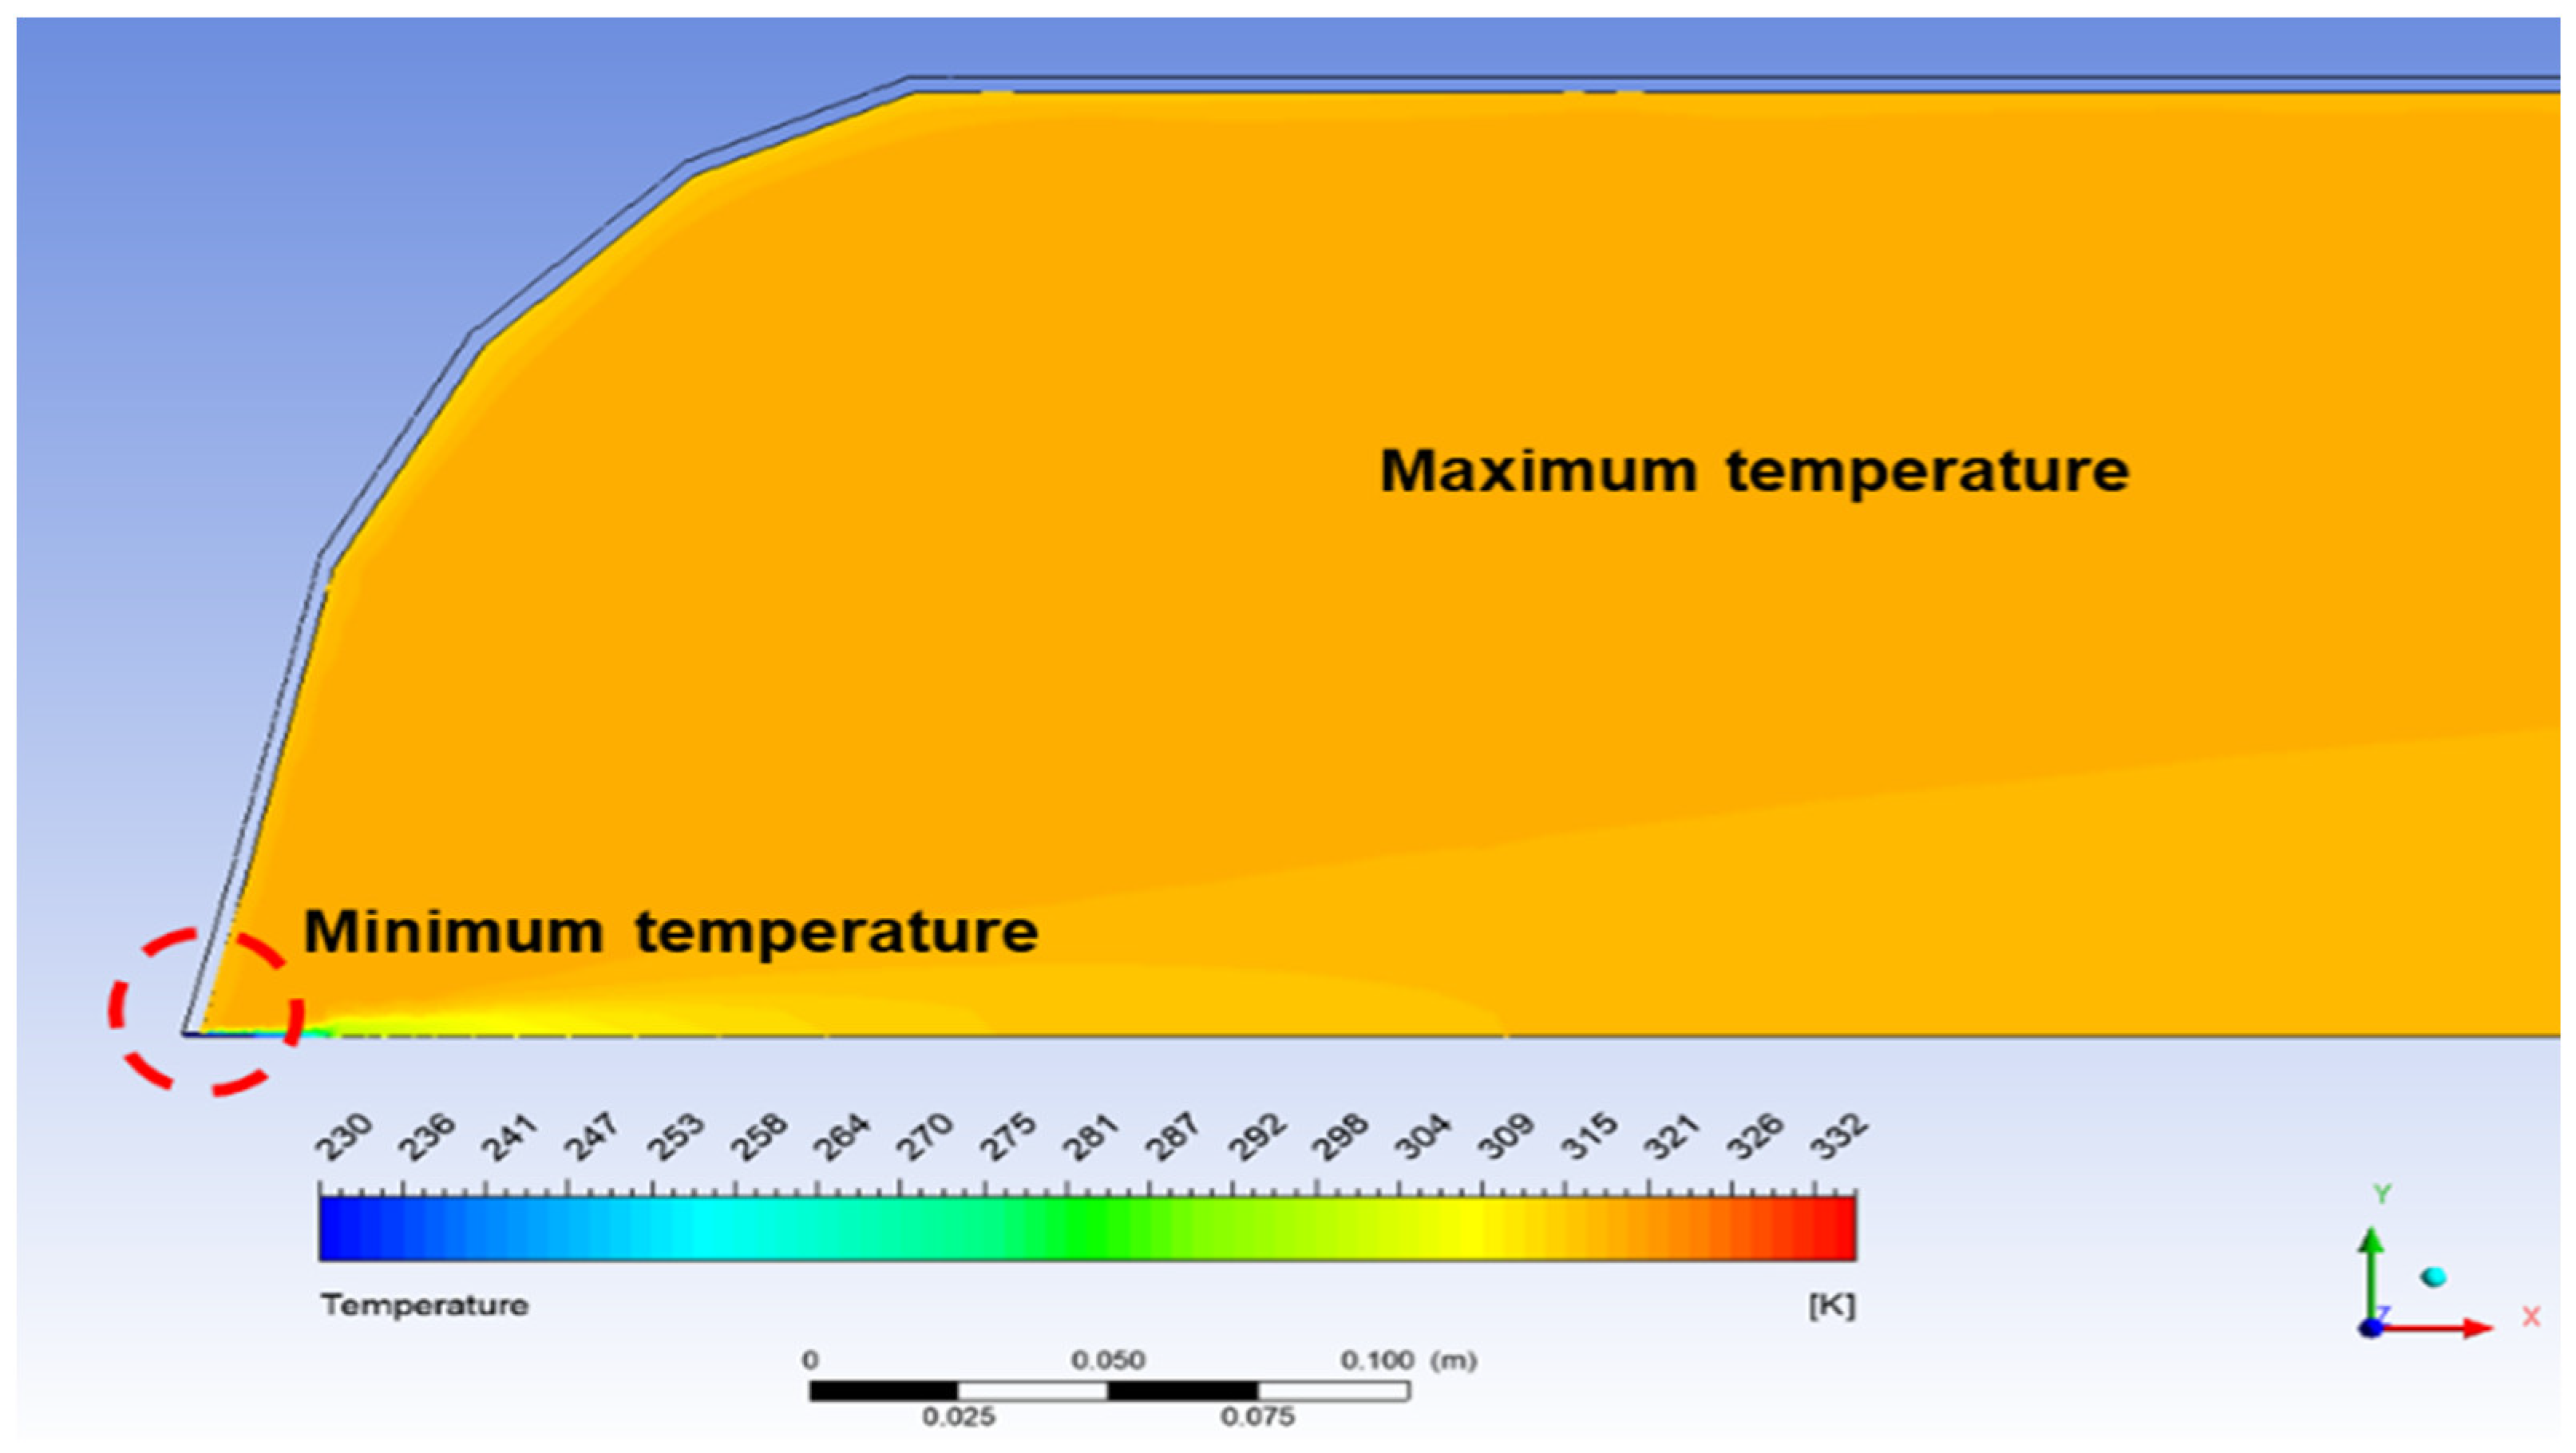
3.2. CGH2 Behaviors
4. Conclusions
- From a numerical validation study for the comparison of experimental results of Zheng et al. [6] with a Type III hydrogen tank, gas model and turbulence model were validated. The Redlich–Kwong gas model and realizable k-epsilon and RSM models was found to be a suitable gas model and turbulence model, respectively. However, the realizable k-epsilon model was found to be a suitable turbulence model considering the accuracy, convergence, and computational cost for the calculation of the CGH2 filling phenomenon.
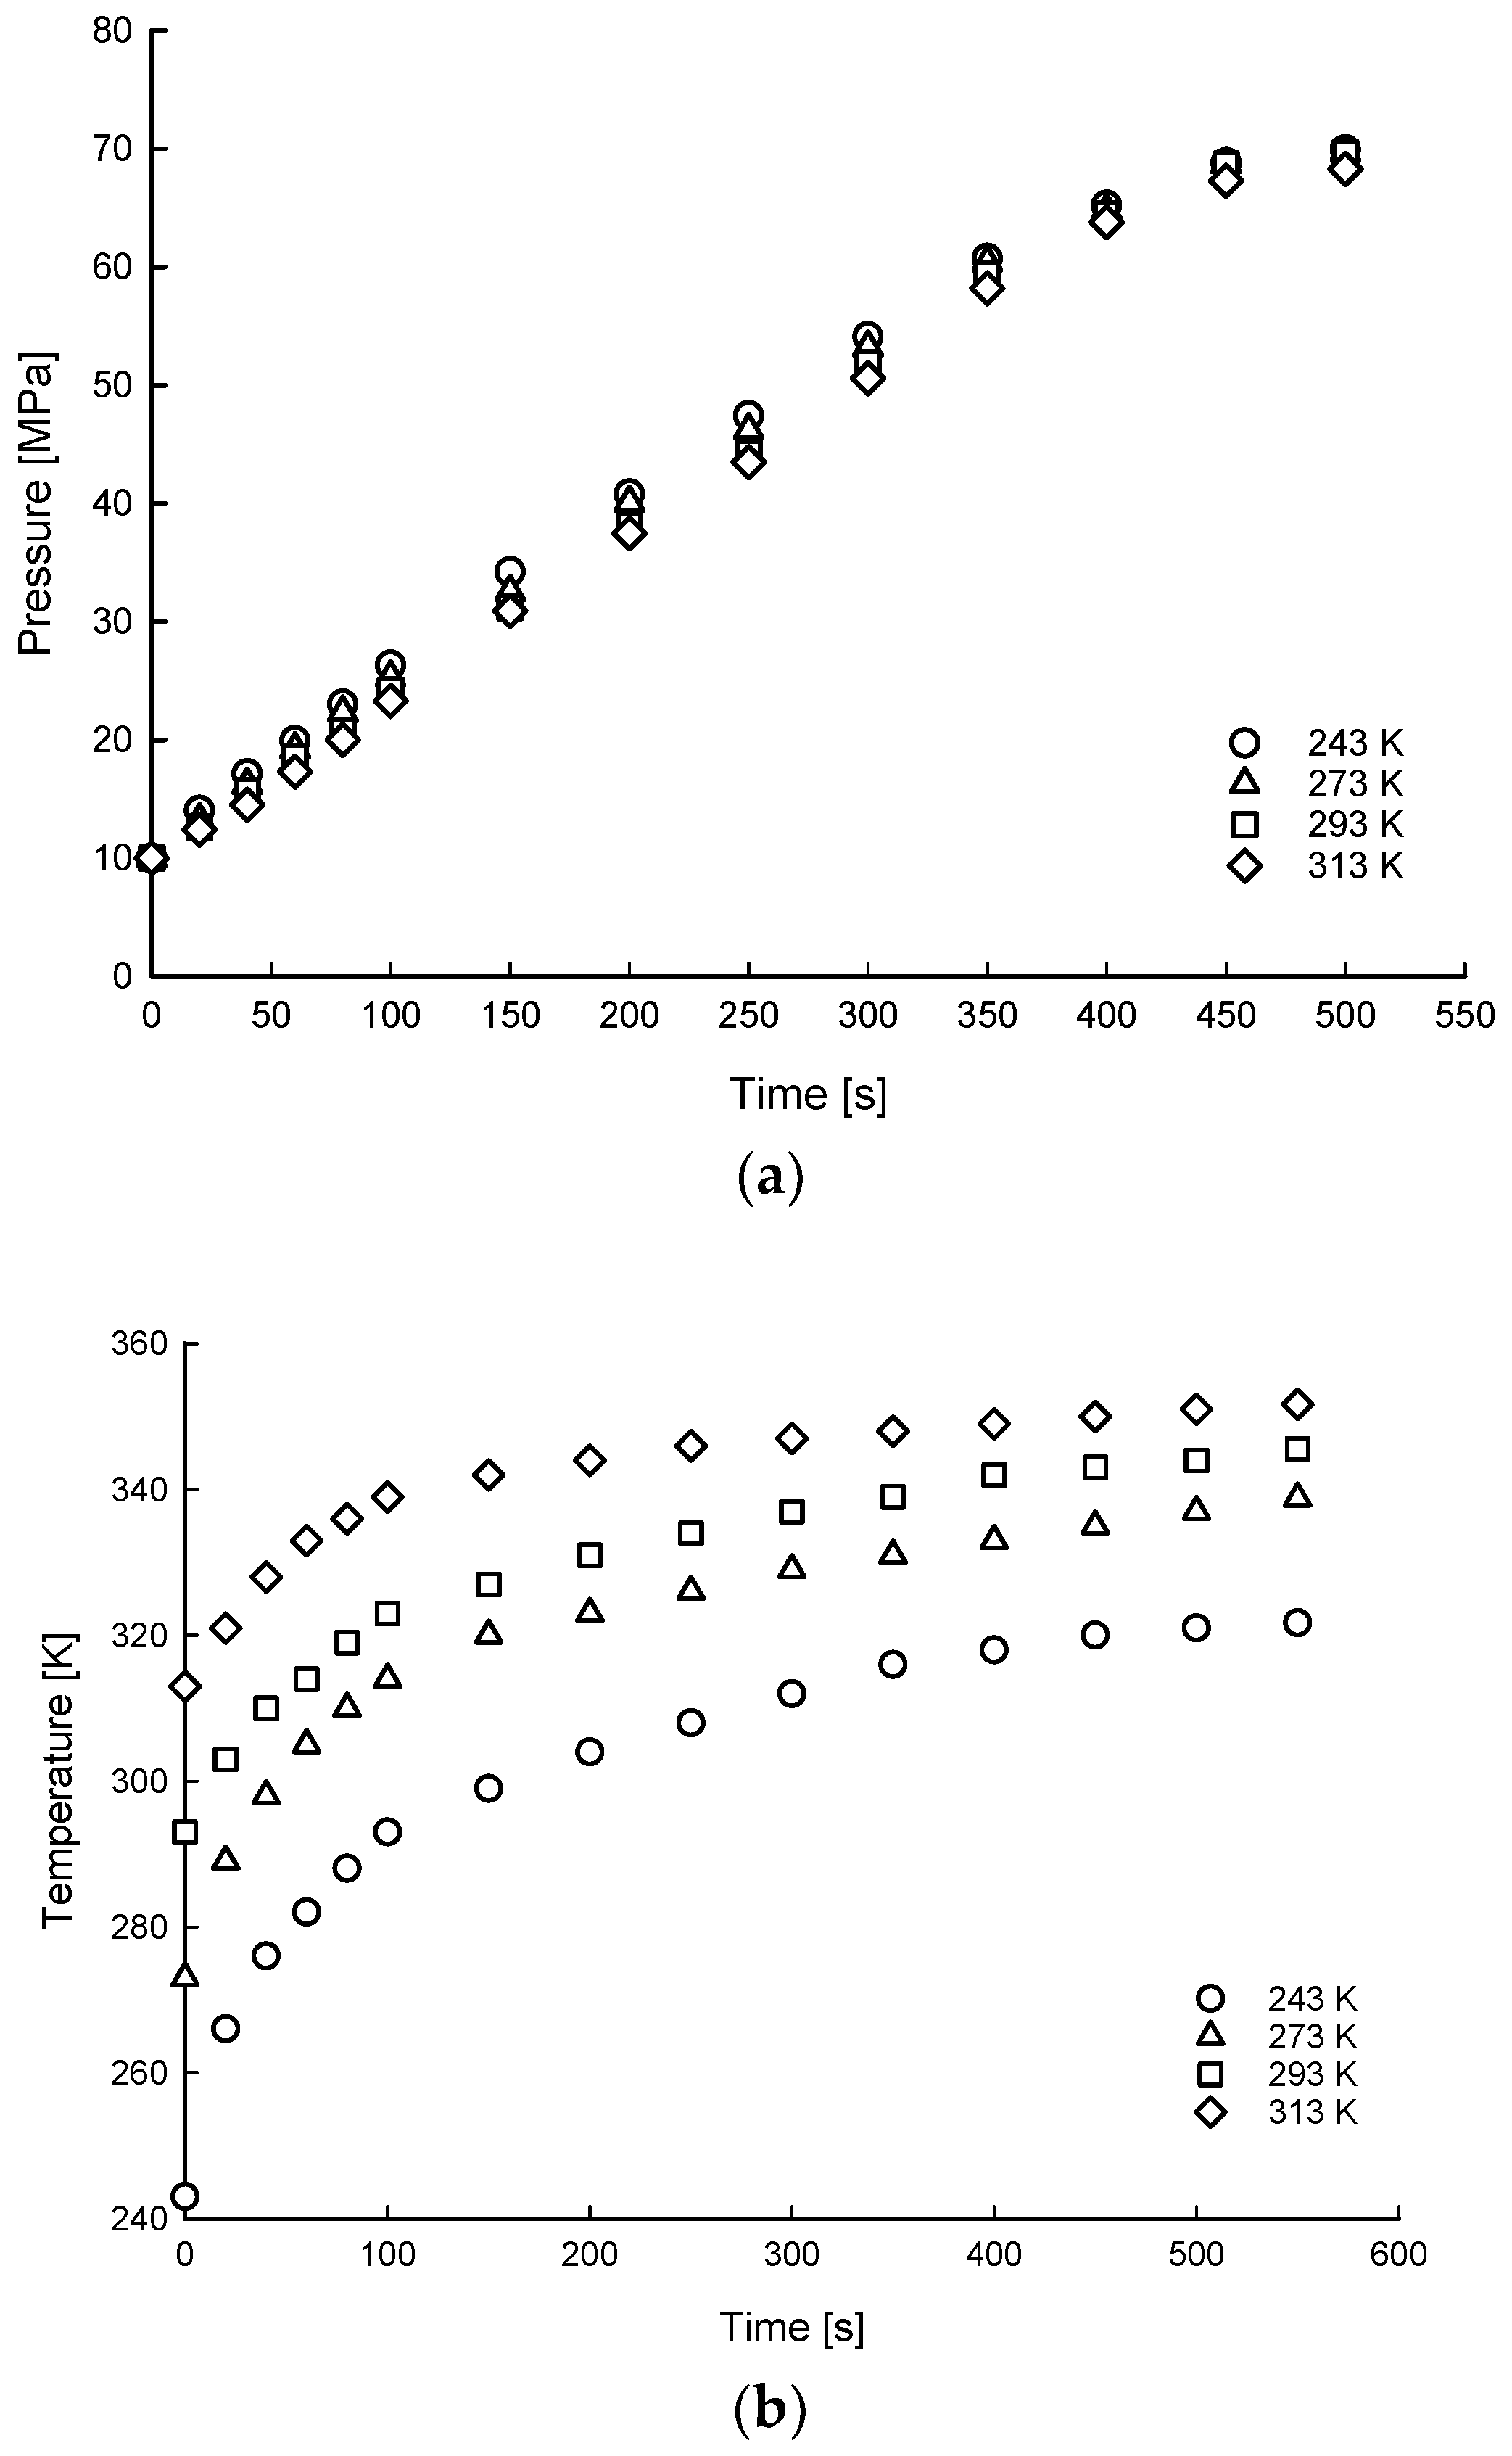
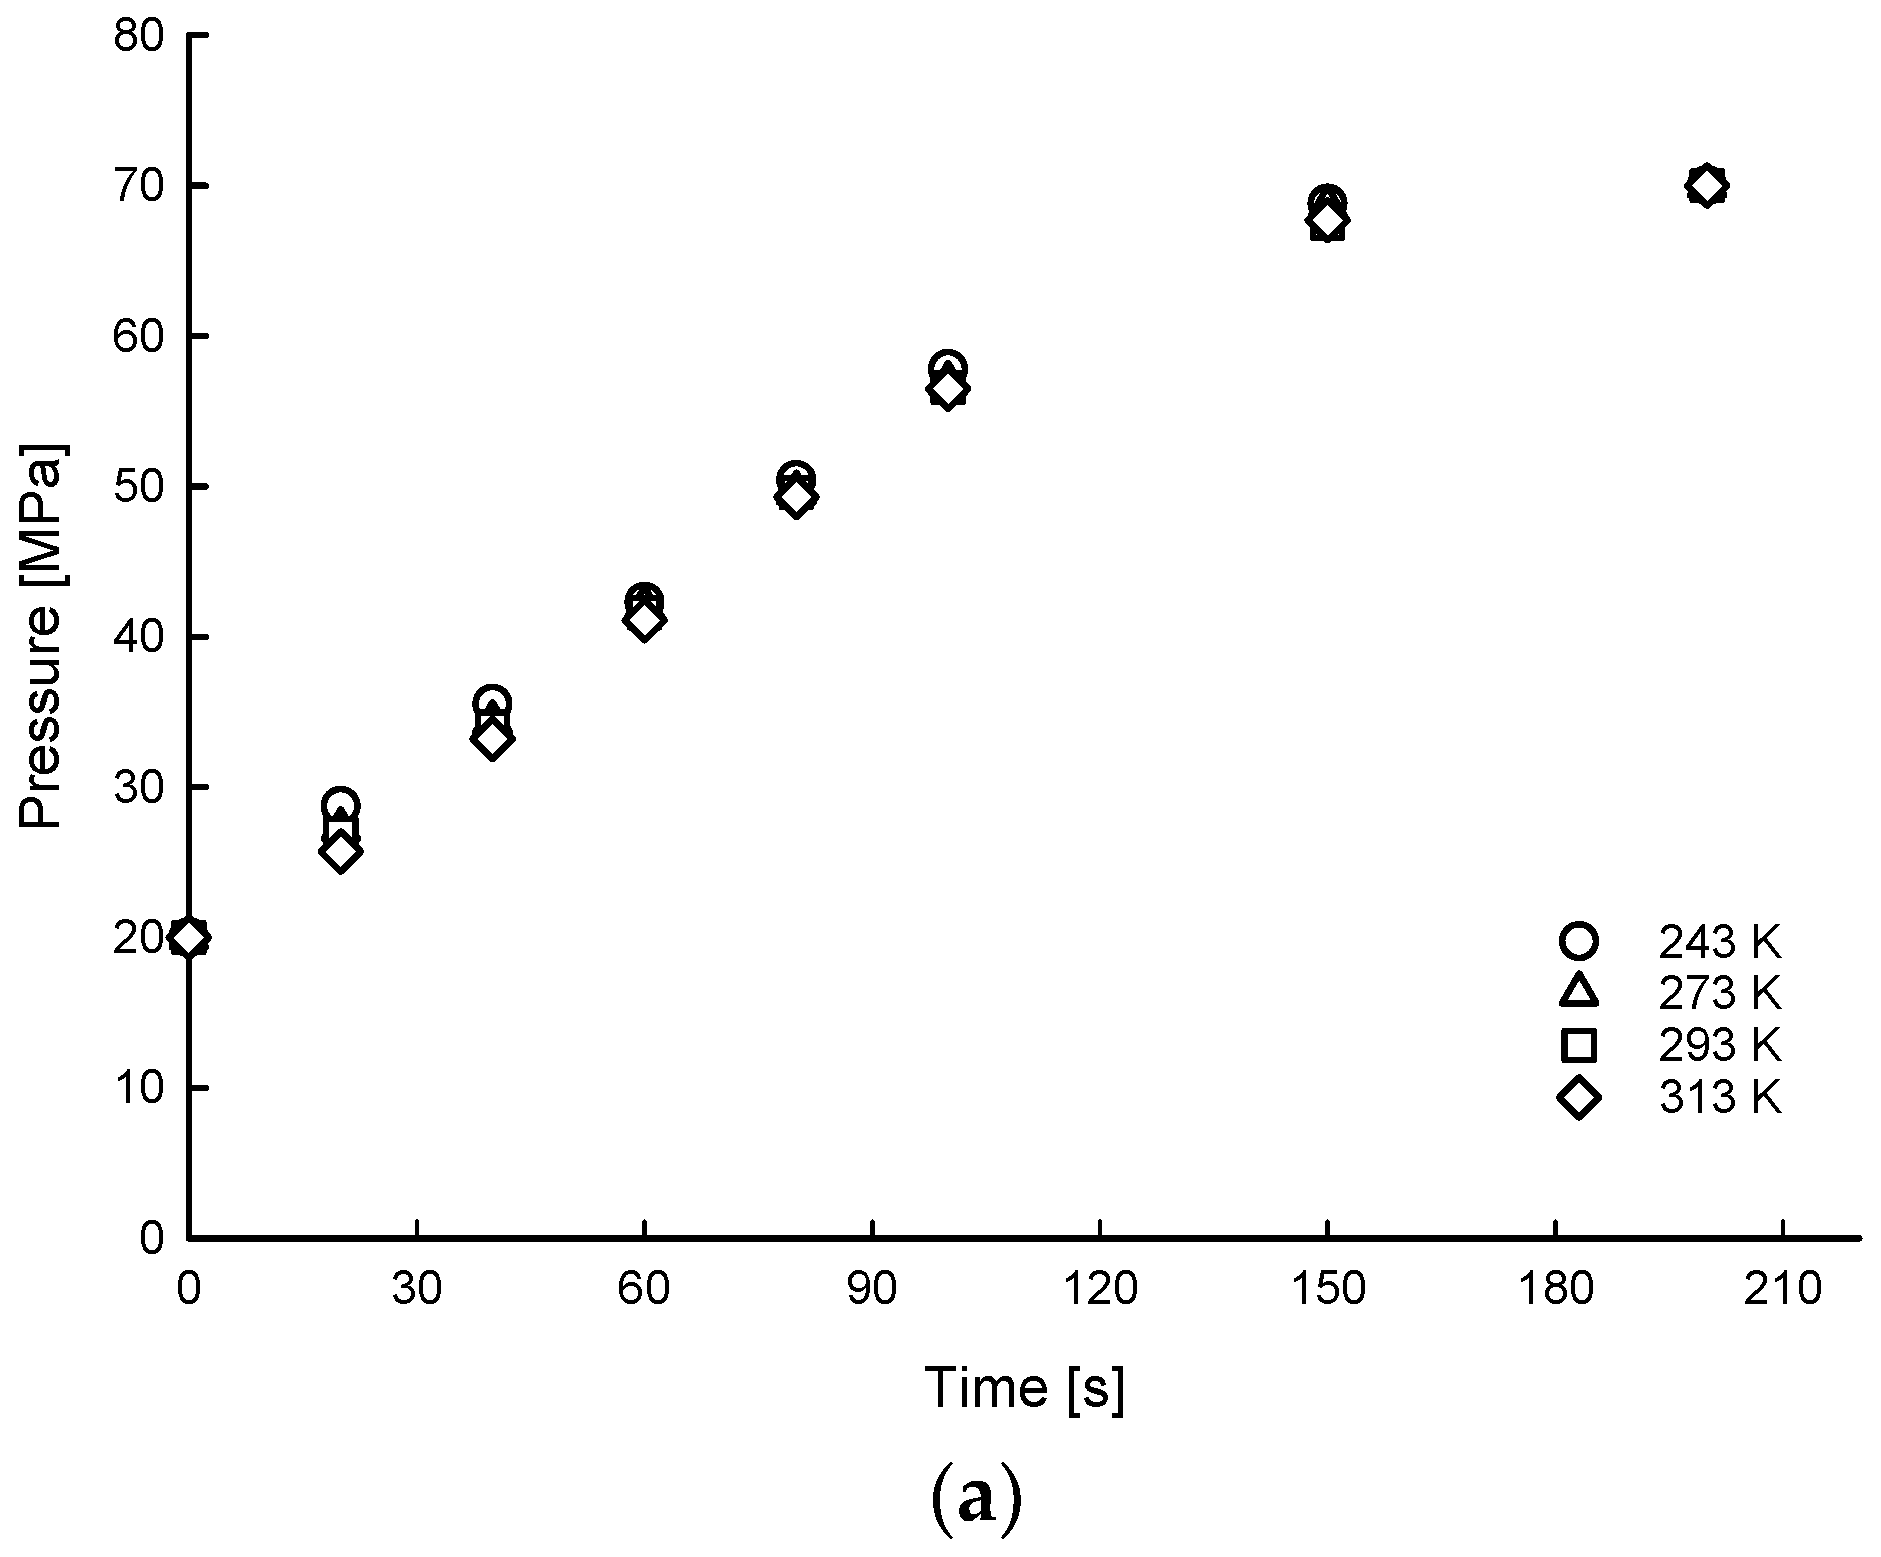
- The average times to charge hydrogen up to 70 MPa were 600, 495, 191, and 148 s for 5, 10, 20, and 35 MPa, respectively, indicating that the average charging time of hydrogen was from 600 s to 148 s for 7% to 50% SOC for the 175 L tank. The time when the pressure reached 70 MPa was influenced by the ambient temperature and SOC condition. For the 5 MPa SOC condition, the time to fully charge up to 70 MPa had a time difference of 29 s between ambient temperature conditions of 313 K and 243 K. Less time difference (17 s) was observed to fully charge hydrogen for a large SOC condition of 35 MPa compared with the 5 MPa case.
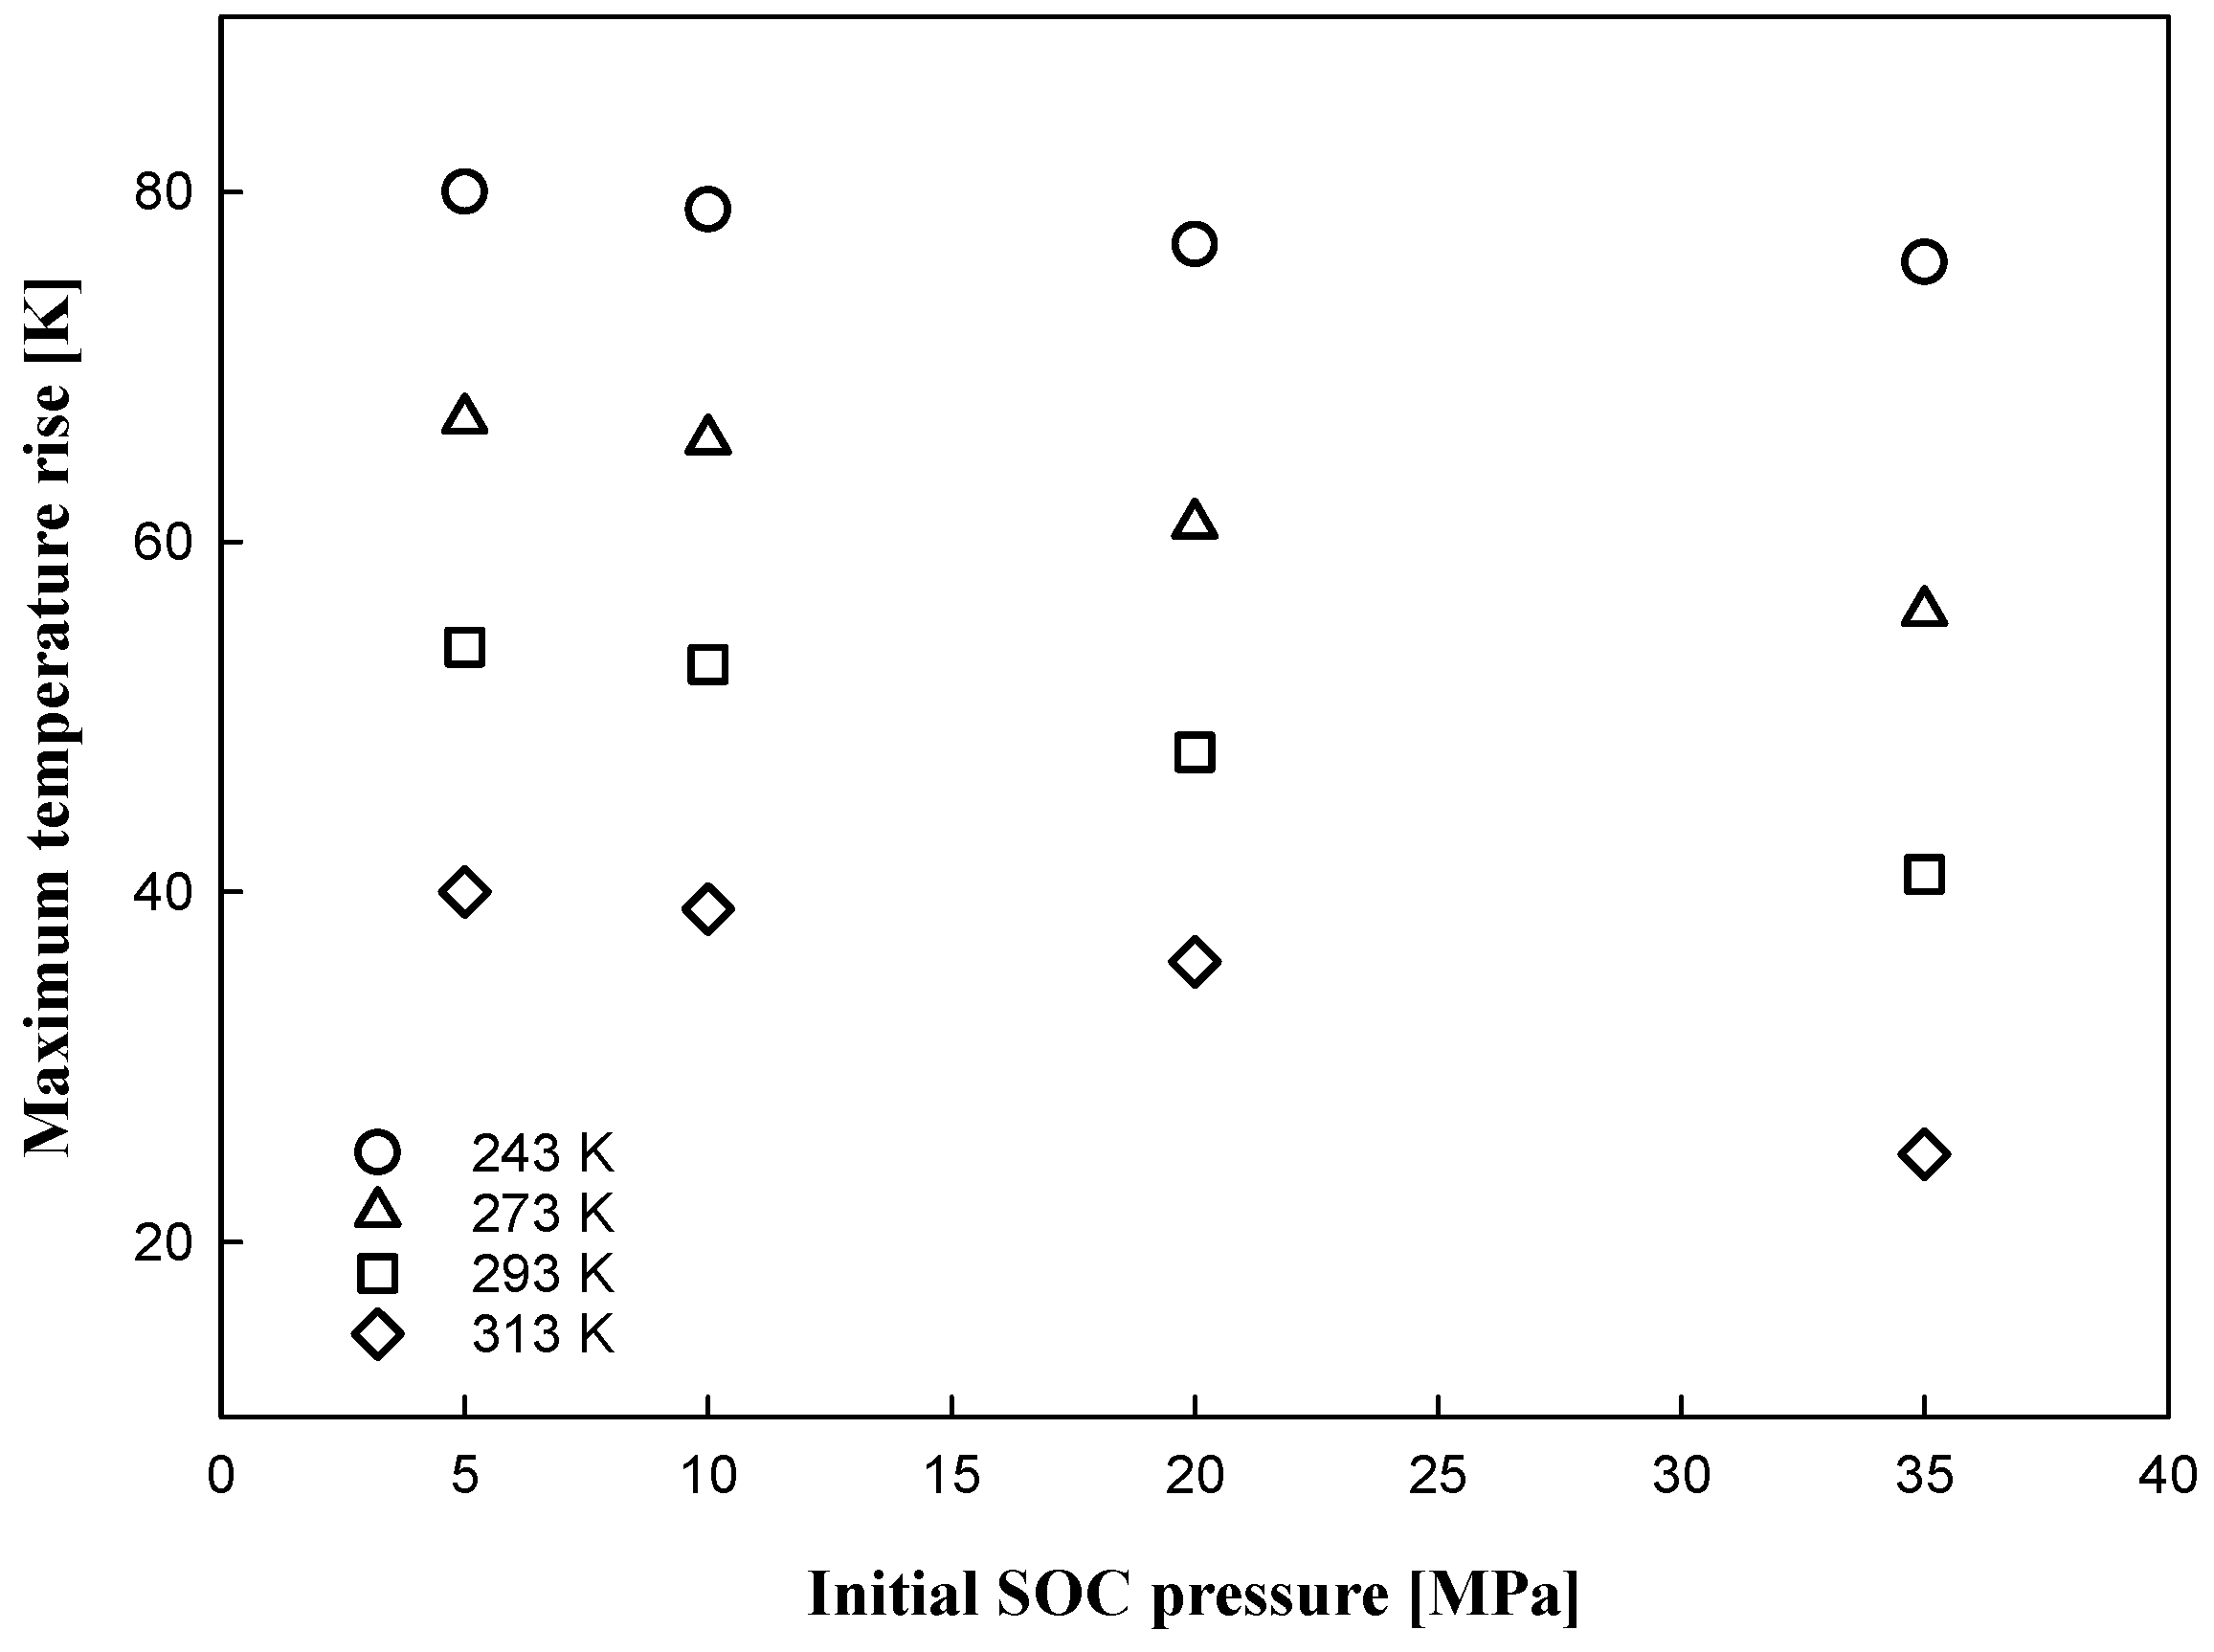
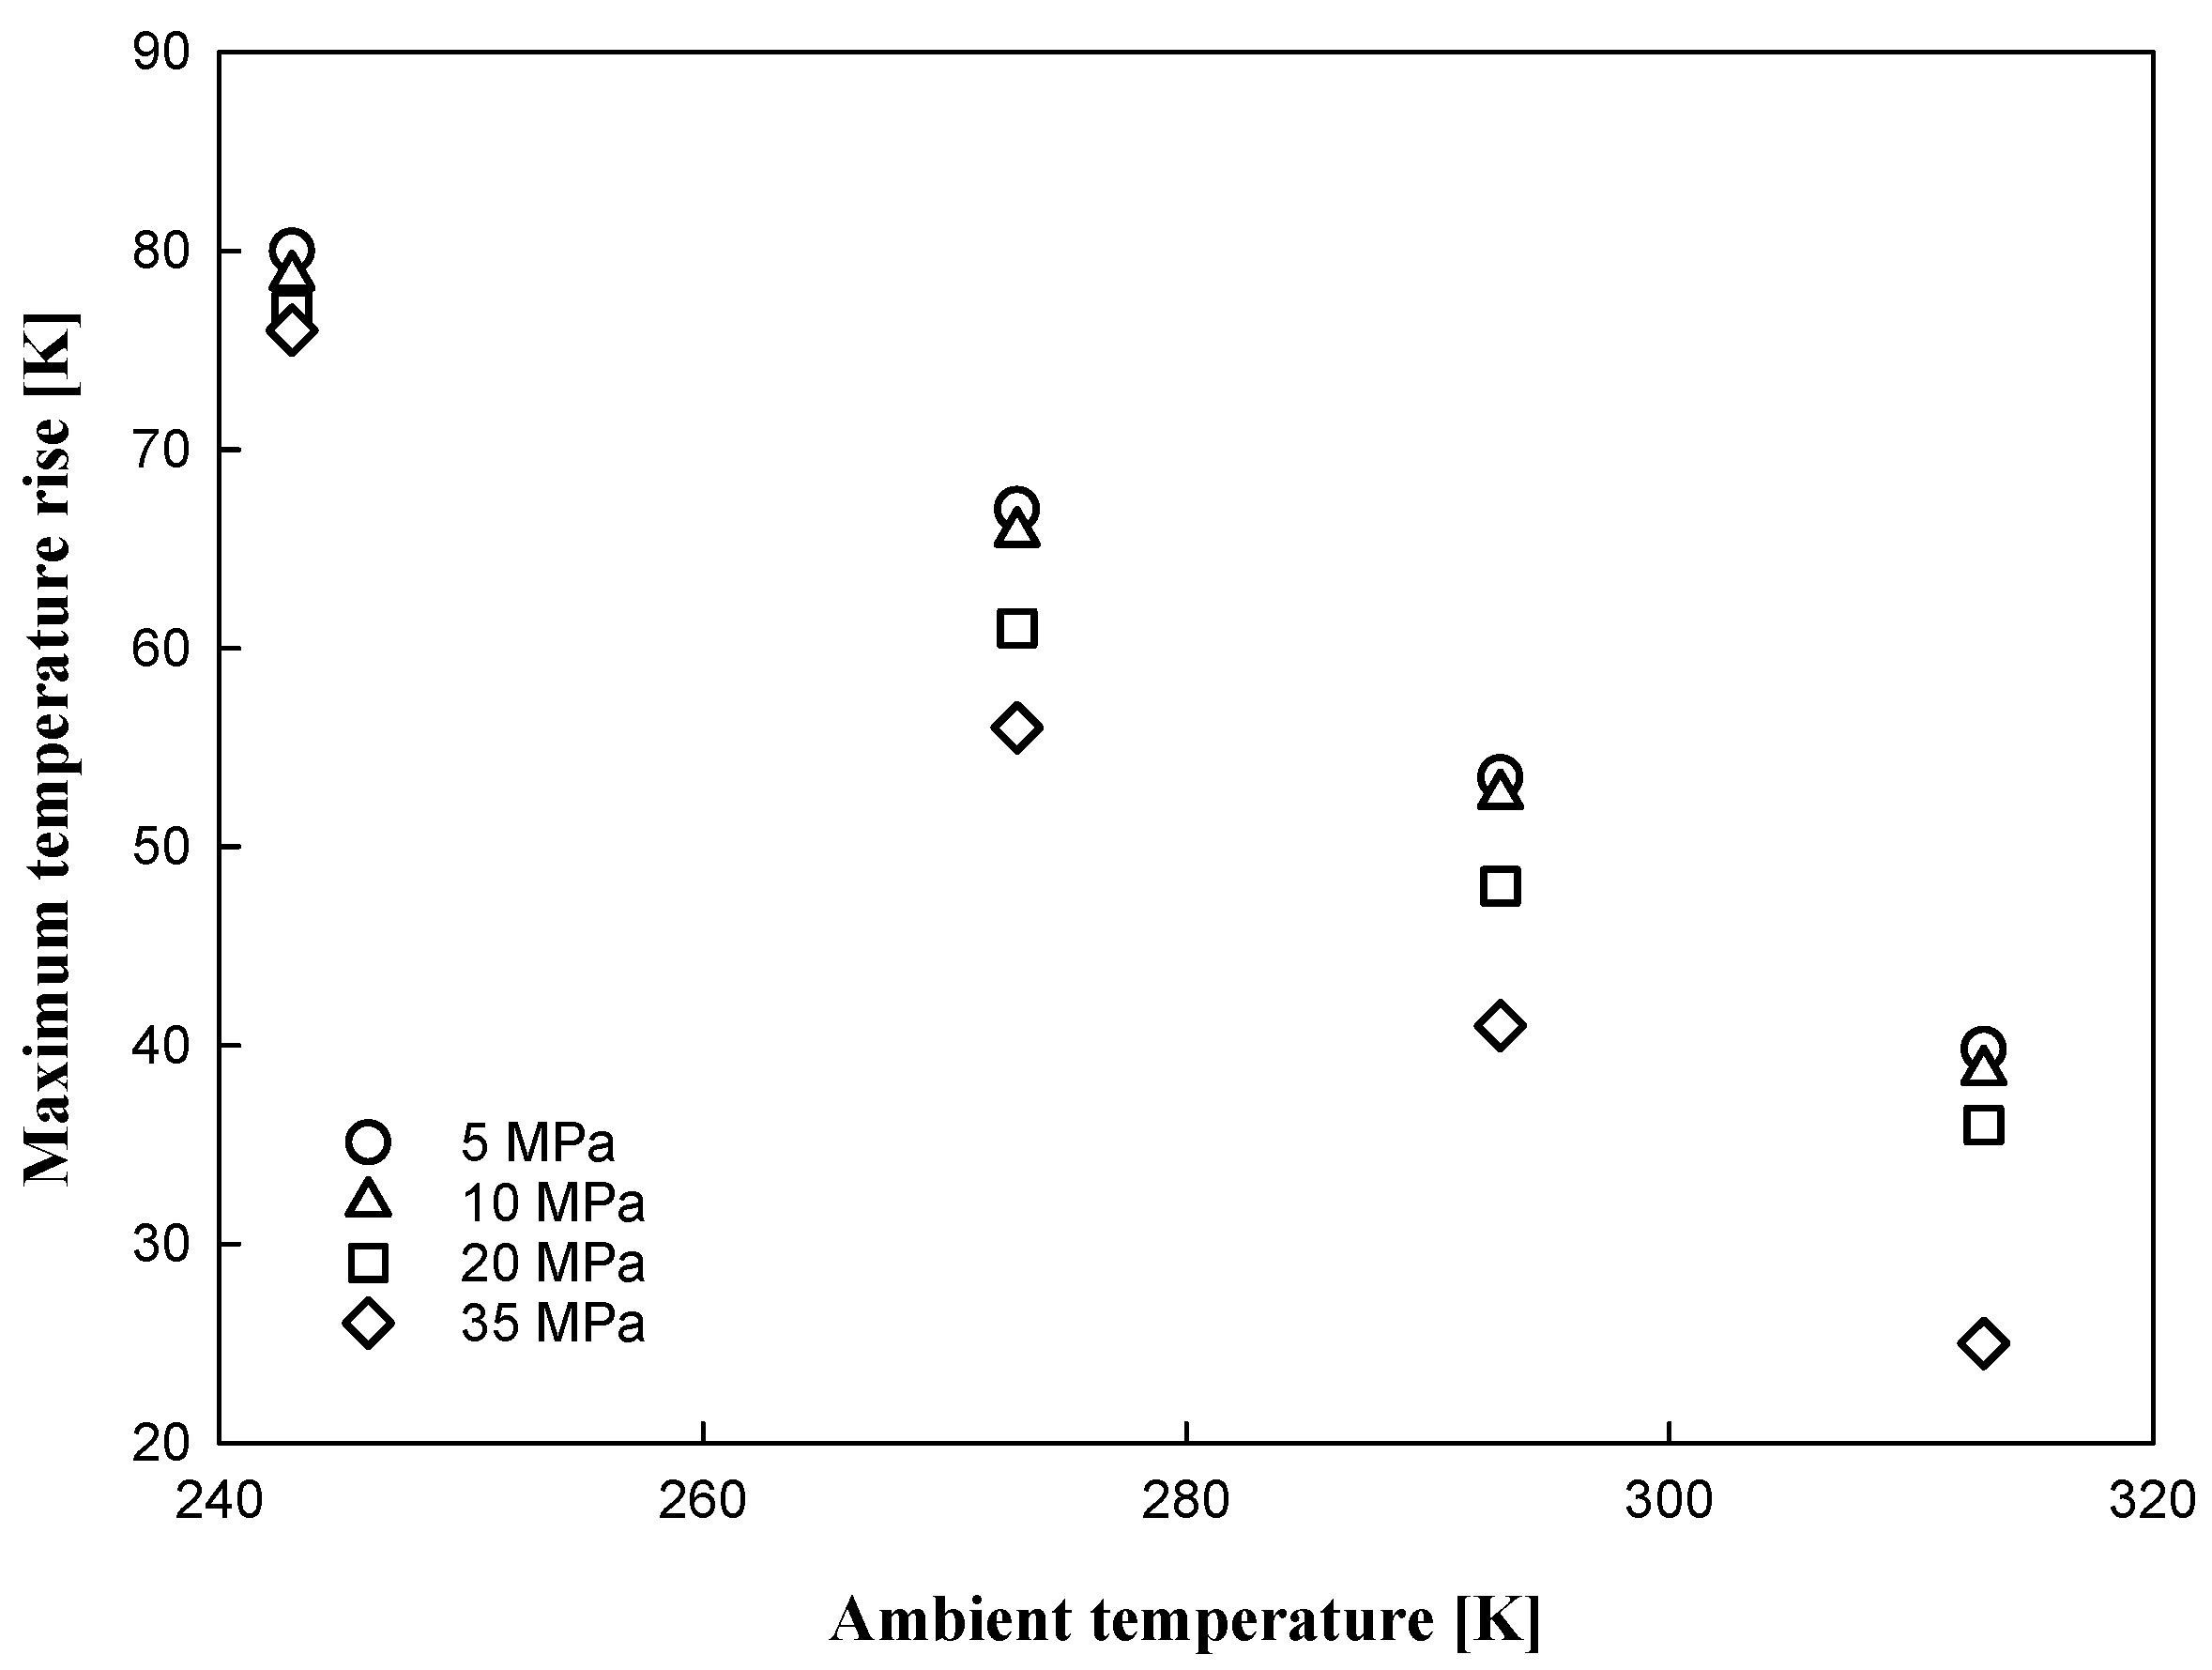
- With the different SOC conditions, the maximum temperature rise of the hydrogen tank when the pressure reached 70 MPa decreased as the initial SOC pressure increased because the temperature rise occurred rapidly for the relatively smaller SOC condition. The temperature rises of hydrogen reached 313–353 K at an ambient temperature of 243–313 K for the 5 MPa SOC condition. However, at 35 MPa of SOC, the temperature of hydrogen reached 298–349 K at an ambient temperature of 243–313 K.
- A relationship between the initial SOC pressure condition and the maximum temperature rise of hydrogen gas showed that the maximum temperature rise increased with decreasing ambient temperature, and the rise increased with decreasing SOC.
- The numerical approach for the applications presented in this paper could also be widely applied to design hydrogen facilities and systems. The present model will be compared with a three-dimensional model in a future study.
Author Contributions
Funding
Institutional Review Board Statement
Informed Consent Statement
Acknowledgments
Conflicts of Interest
References
- Hughes, L. Biological consequences of global warming: Is the signal already apparent? Trends Ecol. Evol. 2000, 15, 56–61. [Google Scholar] [CrossRef]
- Moss, R.H.; Edmonds, J.A.; Hibbard, K.A.; Manning, M.R.; Rose, S.K.; Van Vuuren, D.P.; Carter, T.R.; Emori, S.; Kainuma, M.; Kram, T. The next generation of scenarios for climate change research and assessment. Nature 2010, 463, 747–756. Available online: https://www.nature.com/articles/nature08823 (accessed on 7 December 2018). [CrossRef] [PubMed]
- Akansu, S. Internal combustion engines fueled by natural gas? hydrogen mixtures. Int. J. Hydrogen Energy 2004, 29, 1527–1539. [Google Scholar] [CrossRef]
- Kim, S.C.; Lee, S.H.; Yoon, K.B. Thermal characteristics during hydrogen fueling process of type IV cylinder. Int. J. Hydrogen Energy 2010, 35, 6830–6835. [Google Scholar] [CrossRef]
- Krishna, R.; Titus, E.; Salimian, M.; Okhay, O.; Rajendran, S.; Rajkumar, A.; Sousa, J.M.G.; Ferreira, A.L.C.; Campos, J.; Gracio, J. Hydrogen Storage for Energy Application. In Hydrogen Storage; InTech Open: London, UK, 2012. [Google Scholar]
- Zheng, J.; Guo, J.; Yang, J.; Zhao, Y.; Zhao, L.; Pan, X.; Ma, J.; Zhang, L. Experimental and numerical study on temperature rise within a 70 MPa type III cylinder during fast refueling. Int. J. Hydrogen Energy 2013, 38, 10956–10962. [Google Scholar] [CrossRef]
- Mori, D.; Hirose, K. Recent challenges of hydrogen storage technologies for fuel cell vehicles. Int. J. Hydrogen Energy 2009, 34, 4569–4574. [Google Scholar] [CrossRef]
- Chung, S.-M.; Seo, Y.-S.; Jeon, G.-M.; Kim, J.-W.; Park, J.-C. Parameter Study of Boiling Model for CFD Simulation of Multiphase-Thermal Flow in a Pipe. J. Ocean Eng. Technol. 2021, 35, 50–58. [Google Scholar] [CrossRef]
- Johnson, T.; Bozinoski, R.; Ye, J.; Sartor, G.; Zheng, J.; Yang, J. Thermal model development and validation for rapid filling of high pressure hydrogen tanks. Int. J. Hydrogen Energy 2015, 40, 9803–9814. [Google Scholar] [CrossRef] [Green Version]
- Zhao, Y.; Liu, G.; Liu, Y.; Zheng, J.; Chen, Y.; Zhao, L.; Guo, J.; He, Y. Numerical study on fast filling of 70 MPa type III cylinder for hydrogen vehicle. Int. J. Hydrogen Energy 2012, 37, 17517–17522. [Google Scholar] [CrossRef]
- Suryan, A.; Kim, H.D.; Setoguchi, T. Three dimensional numerical computations on the fast filling of a hydrogen tank under different conditions. Int. J. Hydrogen Energy 2012, 37, 7600–7611. [Google Scholar] [CrossRef]
- Liu, J.; Zheng, S.; Zhang, Z.; Zheng, J.; Zhao, Y. Numerical study on the fast filling of on-bus gaseous hydrogen storage cylinder. Int. J. Hydrogen Energy 2020, 45, 9241–9251. [Google Scholar] [CrossRef]
- Bourgeois, T.; Brachmann, T.; Barth, F.; Ammouri, F.; Baraldi, D.; Melideo, D.; Acosta-Iborra, B.; Zaepffel, D.; Saury, D.; Lemonnier, D. Optimization of hydrogen vehicle refuelling requirements. Int. J. Hydrogen Energy 2017, 42, 13789–13809. [Google Scholar] [CrossRef]
- Bourgeois, T.; Ammouri, F.; Baraldi, D.; Moretto, P. The temperature evolution in compressed gas filling processes: A review. Int. J. Hydrogen Energy 2018, 43, 2268–2292. [Google Scholar] [CrossRef]
- Li, Q.; Zhou, J.; Chang, Q.; Xing, W. Effects of geometry and inconstant mass flow rate on temperatures within a pressurized hydrogen cylinder during refueling. Int. J. Hydrogen Energy 2012, 37, 6043–6052. [Google Scholar] [CrossRef]
- Kim, M.-S.; Ryu, J.-H.; Oh, S.-J.; Yang, J.-H.; Choi, S.-W. Numerical Investigation on Influence of Gas and Turbulence Model for Type III Hydrogen Tank under Discharge Condition. Energies 2020, 13, 6432. [Google Scholar] [CrossRef]
- Shih, T.-H. A Realizable Reynolds Stress Algebraic Equation Model; National Aeronautics and Space Administration: Washington, DC, USA, 1993; Volume 105993.
- Suryan, A.; Kim, H.; Setoguchi, T. Comparative study of turbulence models performance for refueling of compressed hydrogen tanks. Int. J. Hydrogen Energy 2013, 38, 9562–9569. [Google Scholar] [CrossRef]
- Prieler, R.; Demuth, M.; Spoljaric, D.; Hochenauer, C. Numerical investigation of the steady flamelet approach under different combustion environments. Fuel 2015, 140, 731–743. [Google Scholar] [CrossRef]
- De Miguel, N.; Acosta, B.; Baraldi, D.; Melideo, R.; Cebolla, R.O.; Moretto, P. The role of initial tank temperature on refuelling of on-board hydrogen tanks. Int. J. Hydrogen Energy 2016, 41, 8606–8615. [Google Scholar] [CrossRef]


| Type/Capacity (L) | Components | Length (mm) |
|---|---|---|
| Type III 74.3 | Total length | 1030 |
| Inner diameter | 354 | |
| Outer diameter | 427 | |
| Thickness (liner and laminate) | 36 | |
| Inlet diameter | 5 | |
| Type IV 175 | Total length | 1850 |
| Inner diameter | 384 | |
| Outer diameter | 450 | |
| Thickness (liner and laminate) | 33 | |
| Inlet diameter | 5 |
| Type/Capacity (L) | Material | Density (kg/m3) | Specific Heat (J·Kg·K) | Thermal Conductivity (W/m·K) |
|---|---|---|---|---|
| Type III 74.3 | Liner (aluminum) | 2700 | 902 | 238 |
| Laminate (CFRP) | 1570 | 840 | 0.612 | |
| Type IV 175 | Liner (HDPE) | 947 | 1880 | 0.36 |
| Laminate (CFRP) | 1600 | 1400 | 1.5 |
| Temperature [K] | 313 |
| 293 | |
| 273 | |
| 243 | |
| SOC pressure [MPa] | 35 |
| 20 | |
| 10 | |
| 5 |
| States of Charging (%)/(MPa) | Tamb (K) | Maximum Temperature (K) | Time to Filling (s) |
|---|---|---|---|
| 7%/5 MPa | 243 | 322 | 586 |
| 273 | 340 | 595 | |
| 293 | 346 | 604 | |
| 313 | 352 | 615 | |
| 14%/10 MPa | 243 | 322 | 484 |
| 273 | 331 | 490 | |
| 293 | 346 | 498 | |
| 313 | 352 | 509 | |
| 29%/20 MPa | 243 | 320 | 181 |
| 273 | 334 | 186 | |
| 293 | 341 | 194 | |
| 313 | 349 | 201 | |
| 50%/35 MPa | 243 | 319 | 140 |
| 273 | 332 | 145 | |
| 293 | 334 | 151 | |
| 313 | 338 | 157 |
Publisher’s Note: MDPI stays neutral with regard to jurisdictional claims in published maps and institutional affiliations. |
© 2022 by the authors. Licensee MDPI, Basel, Switzerland. This article is an open access article distributed under the terms and conditions of the Creative Commons Attribution (CC BY) license (https://creativecommons.org/licenses/by/4.0/).
Share and Cite
Kim, M.-S.; Jeon, H.-K.; Lee, K.-W.; Ryu, J.-H.; Choi, S.-W. Analysis of Hydrogen Filling of 175 Liter Tank for Large-Sized Hydrogen Vehicle. Appl. Sci. 2022, 12, 4856. https://doi.org/10.3390/app12104856
Kim M-S, Jeon H-K, Lee K-W, Ryu J-H, Choi S-W. Analysis of Hydrogen Filling of 175 Liter Tank for Large-Sized Hydrogen Vehicle. Applied Sciences. 2022; 12(10):4856. https://doi.org/10.3390/app12104856
Chicago/Turabian StyleKim, Moo-Sun, Hong-Kyu Jeon, Kang-Won Lee, Joon-Hyoung Ryu, and Sung-Woong Choi. 2022. "Analysis of Hydrogen Filling of 175 Liter Tank for Large-Sized Hydrogen Vehicle" Applied Sciences 12, no. 10: 4856. https://doi.org/10.3390/app12104856
APA StyleKim, M.-S., Jeon, H.-K., Lee, K.-W., Ryu, J.-H., & Choi, S.-W. (2022). Analysis of Hydrogen Filling of 175 Liter Tank for Large-Sized Hydrogen Vehicle. Applied Sciences, 12(10), 4856. https://doi.org/10.3390/app12104856