Article

Applications of Decision Tree and Random Forest as Tree-Based Machine Learning Techniques for Analyzing the Ultimate Strain of Spliced and Non-Spliced Reinforcement Bars

by
Hamed Dabiri
1,*,
Visar Farhangi
2,*,
Mohammad Javad Moradi
3,
Mehdi Zadehmohamad
4 and
Moses Karakouzian
5
1
School of Science and Technology, University of Camerino, 62032 Camerino, Italy
2
Department of Civil Engineering, Construction Management, and Environmental Engineering, Northern Arizona University, Flagstaff, AZ 86011, USA
3
Department of Civil and Environmental Engineering, Carleton University, Ottawa, ON K1S 5B6, Canada
4
Department of Civil and Environmental Engineering, Louisiana State University, Baton Rouge, LA 70803, USA
5
Department of Civil and Environmental Engineering and Construction, University of Nevada, Las Vegas, NV 89154, USA
*
Authors to whom correspondence should be addressed.
Appl. Sci. 2022, 12(10), 4851; https://doi.org/10.3390/app12104851
Submission received: 26 April 2022 / Revised: 9 May 2022 / Accepted: 10 May 2022 / Published: 11 May 2022

Abstract

:
The performance of both non-spliced and spliced steel bars significantly affects the overall performance of structural reinforced concrete elements. In this context, the mechanical properties of reinforcement bars (i.e., their ultimate strength and strain) should be determined in order to evaluate their reliability prior to the construction procedure. In this study, the application of Tree-Based machine learning techniques is implemented to analyze the ultimate strain of non-spliced and spliced steel reinforcements. In this regard, a database containing the results of 225 experimental tests was collected based on the research investigations available in peer-reviewed international publications. The database included the mechanical properties of both non-spliced and mechanically spliced bars. For better accuracy, the databases of other splicing methods such as lap and welded-spliced methods were excluded from this research. The database was categorized as two sub-databases: training (85%) and testing (15%) of the developed models. Various effective parameters such as splice technique, steel grade of the bar, diameter of the steel bar, coupler geometry—including length and outer diameter along with the testing temperatures—were defined as the input variables for analyzing the ultimate strain using tree-based approaches including Decision Trees and Random Forest. The predicted outcomes were compared to the actual values and the precision of the prediction models was assessed via performance metrics, along with a Taylor diagram. Based on the reported results, the reliability of the proposed ML-based methods was acceptable (with an R2 ≥ 85%) and they were time-saving and cost-effective compared to more complicated, time-consuming, and expensive experimental examinations. More importantly, the models proposed in this study can be further considered as a part of a comprehensive prediction model for estimating the stress-strain behavior of steel bars.

1. Introduction

Reinforced steel bars are generally fabricated with limited lengths due to the limitations of the transportation and production processes. Splicing bars, therefore, is an inevitable issue which could influence the behavior of reinforced concrete (RC) elements and structures [1]. Splice methods and their effect on RC structures’ behavior has been extensively researched experimentally and numerically [2,3,4,5,6,7], considering their remarkable importance.
Regarding splice methods, they can be generally categorized into three main classifications: lap, mechanical, and welded splices. Lap splices are recognized as the most common and inexpensive method applied for connecting rebars due to its simplicity [8]. However, its shortcomings (e.g., bar congestion), which lead to poor performance of structures, have motivated researchers to propose alternative splice approaches [9,10,11]. The application of welded splices is also scarce as it requires specific operation skills to achieve a reliable splice. Moreover, the lack of investigations for conclusions and code provisions on welded splices prevents them from being widely used in construction [9,12].
Mechanical splices, therefore, are claimed to be an appropriate splice method because their implementation (i) is quick and easy, (ii) does not require special skills, (iii) reduces bar congestion, and (iv) leads to better performance compared to other methods [9,10]. Mechanical splices could be categorized into five main groups, namely, threaded (the most common type), grouted, swaged, bolted, and headed bar couplers [6,13]. A combination of the above-mentioned methods (e.g., threaded-screw couplers) has also been proposed by researchers [14,15,16,17,18]. The stress transformation is different in each method. As an example, in the threaded, swaged, bolted, and headed bar couplers, force is transferred through thread locks, grout, interlocks between the bar rips and swaged sleeve, friction between bolts and bar rips, and the male–female elements, respectively [9]. In all the mechanical methods, the rebars are connected by a sleeve and, therefore, the length and diameter (or thickness) of the sleeve affects the splice performance greatly. It is claimed that longer couplers could decrease RC element ductility and deformation capacity [12,18,19] and cause earlier failure due to a larger concrete-bar slip [19]. The coupler rigidity is increased by increasing its outer diameter (or thickness), which might decrease ductility [13,19].
The other remarkable parameter which can affect the performance of either non-spliced or spliced bars is temperature [20,21]. Bompa and Elghazouli concluded that increasing temperature up to 400 °C does not notably affect stiffness and strength, whereas yield plateau becomes less visible for temperatures higher than 300 °C. Furthermore, the ultimate strains of both spliced and non-spliced bars are reduced with increasing temperatures by more than 7.5% of the ultimate strain at ambient temperature [20].
Due to the significant influence of the above-mentioned parameters on the mechanical properties ofnon-spliced and spliced bars, their stress-strain behavior is determined under tensile testing according to design codes (e.g., ASTM [22]). The test is time-consuming and expensive, particularly when an appropriate coupler geometry with a reliable performance needs to be achieved. As a result, machine learning (ML)-based techniques have been developed by researchers as a reliable, quick, and inexpensive alternative approach for experimental tests [23,24,25,26,27]. The limited ML-based models presented for predicting the mechanical properties of non-spliced and spliced bars [28,29] have proven the accuracy of these ML-based techniques. As an example, Dabiri et al., predicted the ultimate tensile strength of both non-spliced and spliced bars using nonlinear regression and ridge regression, as well as incorporating an Artificial Neural Network (ANN). In their study, the proposed nonlinear regression method resulted in more accurate values compared to other techniques [28].
It is worth mentioning that the mechanical properties (specifically ultimate strength and ultimate strain) of reinforcement bars must be accurately determined and reported before commencing the construction procedure. The above-mentioned parameters are generally determined through experimental tests that can be time-consuming and costly. ML-based methods have thus attracted researchers’ attention for determining the properties and performance of steel bars [30,31,32,33]. According to the authors’ best knowledge, the ultimate strain of bars is only investigated experimentally in many studies [10,20]; no ML-based models have been proposed for determining this significant parameter. In this context, the prime goal of this study was to evaluate tree-based ML-based approaches, namely Decision Tree (DT) and Random Forest (RF), for predicting the ultimate strain of non-spliced and spliced bars. It should be explained that DT and RF models are considered in this study since they return more reliable estimated values in comparison to other prediction approaches. The developed models could be used as a part of a larger prediction model for obtaining the stress-strain behavior of steel bars without the need to perform experimental tests.

2. Methodology and Data Collection

The main objective of this study was to present and evaluate models using machine learning for determining the ultimate strain of non-spliced and spliced steel reinforcement bars. To achieve this research objective, 225 data sets were collected from the literature available in peer-reviewed publications [18,20,34,35,36,37,38,39,40]. The collected database was then randomly divided into two sub-databases: (a) a training database for training the relationship between inputs and output, and (b) a testing database for assessing the accuracy of the models. In this study, 85% of the database was incorporated into the training database while 15% was used for testing. As reviewed and discussed in the first section, the parameters with the highest impact on ultimate strain—namely, the bar diameter (mm), steel grade, coupler geometry (length and outer diameter, mm), and temperature (°C)—were considered as input parameters to estimate the only output, ultimate strain. To determine the degree to which the input data affected the target output, Pearson correlation coefficients were determined and are given in Table 1. It is worth explaining that Pearson Coefficients are defined as the ratio of covariance of two parameters to the products of their standard deviation; ρ = C o v ( X , Y ) / σ x σ y , and denotes a linear relationship between two variables. Unless otherwise mentioned, ρ 1 refers to a high linear relationship while ρ 0 stands for independence between factors; negative coefficients show a reverse relationship between two parameters. To compare the effect of input variables on ultimate strain more precisely, the Pearson coefficients are illustrated in a bar chart shown in Figure 1.
The values given in Table 1 and the bar chart demonstrated in Figure 1 reveal that coupler geometry and temperature had a higher effect on the ultimate strain of non-spliced and spliced bars compared to the other input variables. Additionally, all the quantitative inputs (i.e., bar diameter, length of coupler, and outer diameter, along with the temperature) had an inverse relationship with ultimate strain.
Regarding data collection, a comprehensive database was collected including various splice methods used for different bar sizes with different steel grades over a large range of temperature variation. A total of 134 out of 225 datasets are outcomes of a tensile test on non-spliced steel bars while the other 91 datasets are the mechanical properties of spliced bars with different methods. In terms of splice techniques, five mechanical techniques—namely, headed bars, shear-screw, grouted, taper threaded, swaged and threaded couplers (as displayed in Figure 2)—with different lengths and thicknesses were taken into consideration. It should be clarified that according to the design code (i.e., ACI 318-19: 18.2.7.1 [41]), regardless of the splice method, bars spliced by mechanical approaches should provide 1.25fy of a non-spliced bar in both tension and compression. Although the mechanical splices in the database are different, they all meet the above-mentioned provision and therefore could be utilized in the database for the prediction models. It is noteworthy that this study focused on mechanical couplers and that neither lap nor welded splices (e.g., gas pressure welding, head-to-head) are included in the collected database. Table 2 provides the statistical properties of the other quantitative input and output parameters. Bars with diameters of 12–32 mm were included in the database since they are considered by designers and researchers in typical structures more than other sizes. Coupler geometry (i.e., length and outer diameter), as depicted in Figure 3, were in the range of 45.00–490.34 mm and 7.29–64.00 mm, respectively, which are the dimensions leading to the acceptable performance of couplers. Eventually, temperatures in the range of 20–600 °C, which were studied in the literature, were also considered in the database. It should be clarified that one out of the six inputs (splice methods) is not quantitative, and therefore, its statistical properties are not given in Table 2. The distribution of each input is also depicted in the histograms provided in Figure 4.

3. Prediction Models

In this study, two ML-based models, DT and RF—which are recognized as the simplest prediction models with high accuracy results—were proposed using the Python programming language.

3.1. Decision Tree (DT)

The Decision Tree (DT) approach is a supervised machine learning technique with the ability of being used for classifications (for non-continuous output values) and regression (for continuous output value) problems. The name of this method is inspired from the shape of a tree, where the class labels are the leaves and the features (or conditions) are the branches. The most notable asset of the DT approach is its being simple to understand, interpret, and visualize. Moreover, it has the possibility of incorporating decision techniques into the Decision Tree. Modeling the datasets with a high degree of nonlinearity in the relationship between the output and the input variables can also be performed through this method. Its drawbacks which should be taken into account are its being prone to overfitting and its difficulty in classifying multiple output classes [42,43,44].

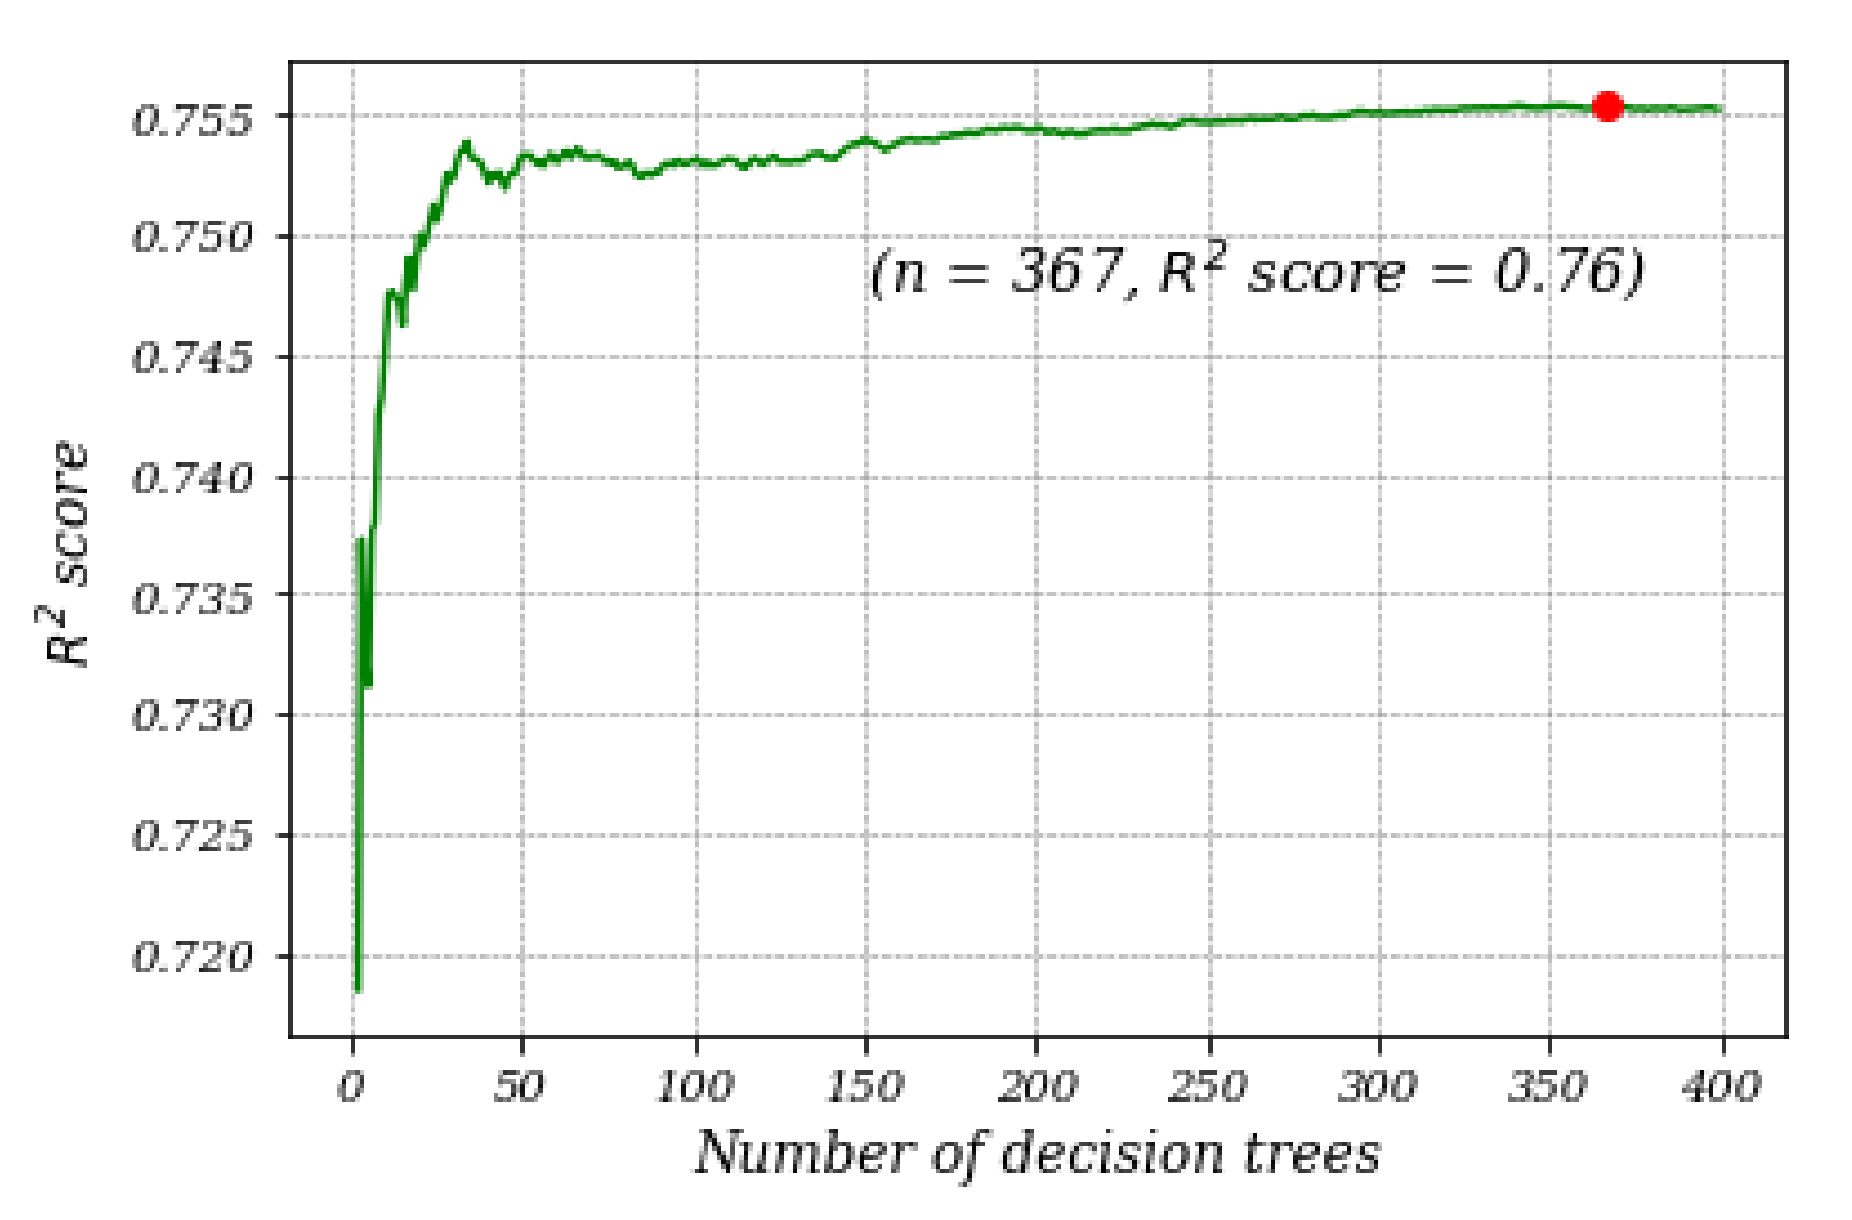
3.2. Random Forest (RF)

Simply stated, RF consists of many Decision Trees, and the target output is predicted by considering either the average of the DTs’ predicted values or the most voted value [45,46]. To be more precise, RF is basically the combination of Bagging and the Random selection of features via the creation of various Decision Trees. Ho primarily developed this method in 1995 by presenting an algorithm for random decision forests. In another research work, Breiman introduced an algorithm using Breiman’s bagging idea and the random selection of features, which was proposed by Ho and Amit and Geman [47,48,49,50]. The RF method has many advantages compared to other ML-based methods; the most remarkable one is its highly accurate results when a large database is used for training. Furthermore, it is simple and fast to implement [43].
The most important parameter that should be chosen efficiently in an RF model is the number of trees. Figure 5 demonstrates the number of trees against the R2-score values for the predicted values. As can be observed in Figure 5, by increasing the number of trees up to approximately 35, the accuracy of the model increased considerably. The accuracy of the models with 35–250 trees increased insignificantly. The R2-score of the models with more than 250 trees remained almost unchanged. The optimal number of trees was 367, which is shown by a red point in Figure 5.

4. Results

The proposed DT and RF models were trained using 85% of the collected database. The other 15%, on the other hand, was used for evaluating the reliability of the prediction models. It is worth explaining that specific optimal percentages have not been suggested for training and testing divisions thus far. It should be clarified that the larger the training database, the better the prediction models can learn the relationship between inputs and output. The testing database, on the other hand, should be sufficient for assessing the accuracy of the proposed models. Additionally, similar percentages have generally been used in similar studies of ML-based models, as they return acceptable results.
The correlation between the predicted and actual values of ultimate strain is depicted in Figure 6 for both the models. The ideal line (predicted values = actual values) and the lines with 20% lower and higher values are shown by solid red and dashed blue lines, respectively. Figure 7 compares the predicted values to the corresponding real ultimate strains obtained in the results of experimental investigations.
The graphical comparison between the predicted and actual values illustrated in Figure 6 and Figure 7 reflects the high ability of the DT and RF models for learning the relationship between the input variables and ultimate strain. The DT model exhibited slightly better accuracy compared to the RF model. The prediction models are evaluated deeper in the next section.

5. Accuracy Evaluation

The accuracy of the proposed tree-based models is deeper assessed in this section through performance metrics and Taylor diagrams.
The most common performance metrics utilized for assessing the reliability prediction models are the R2-score, R, RMSE, MSE, MAPE, and MAE [51]. As could be seen in Equations (1)–(6), the mentioned parameters are all based on the difference between the predicted value and corresponding actual value.
R 2 = i ( y ^ i 1 n 1 n y i ) 2 i ( y i 1 n 1 n y i ) 2
R = i ( y ^ i 1 n 1 n y i ) 2 i ( y i 1 n 1 n y i ) 2
RMSE = 1 n 1 n ( y ^ i y i ) 2
MSE = 1 n 1 n ( y ^ i y i ) 2
MAE = 1 n 1 n y ^ i y i
MAPE = 1 n 1 n y ^ i y i y i
Table 3 reports the performance metrics of the developed prediction models. As noted previously, the ultimate strain values predicted by the DT model (R2 = 0.89) were slightly more accurate than those of the RF model (R2 = 0.85). It should be explained that the RF method is claimed to lead to more reliable results compared to the DT model. However, this statement was concluded for when the same database is used for training and testing, whereas in this study, the training and testing databases were selected randomly. In other words, the training and testing datasets used for the DT and RF models were not the same and therefore caused the insignificant accuracy difference [52]. Briefly noted, both the DT and RF models demonstrated acceptable accuracy, with R2 scores higher than 85%.
In order to compare the R2 scores and RMSE of the proposed prediction models more easily, they are shown in the Taylor diagram in Figure 8. It is worth stating that a Taylor diagram is a two-dimensional space in which predicted and actual values are positioned based on their coordination. The horizontal and vertical axes, circular lines, and radial lines reflect the standard deviation, RMSE, and R2-score, respectively. The distance of each mode to the actual value represents the model’s accuracy [30]; the closer to the actual database a prediction model is, the more reliable it will be. According to the schematic illustration made in Figure 8, the DT model with the higher R2-score and standard deviation and lower RMSE was positioned closer to the actual values (blue star) and thus was slightly more reliable than the RF model.

6. Summary and Conclusions

The mechanical properties (e.g., ultimate strength and stain) of reinforcement bars (either spliced or non-spliced) must be determined before they are implemented in construction. These tests are sometime time-consuming and costly, particularly when an appropriate splice geometry needs to be obtained. As a result, this study aimed at developing ML-based models—namely Random Forest and Decision Trees—for the estimation of the ultimate strain of reinforcement steel bars. To this end, a database containing 225 datasets was collected and divided into training (85%) and testing (15%) databases. The parameters—namely, bar diameter, steel grade, splice method, length and outer diameter of the coupler, and temperature—which are claimed as the most effective factors on ultimate strain were defined as input variables for predicting ultimate strain. The predicted values were compared to the actual values and the accuracy of the proposed DT and RF models were assessed using performance metrics and a Taylor diagram.
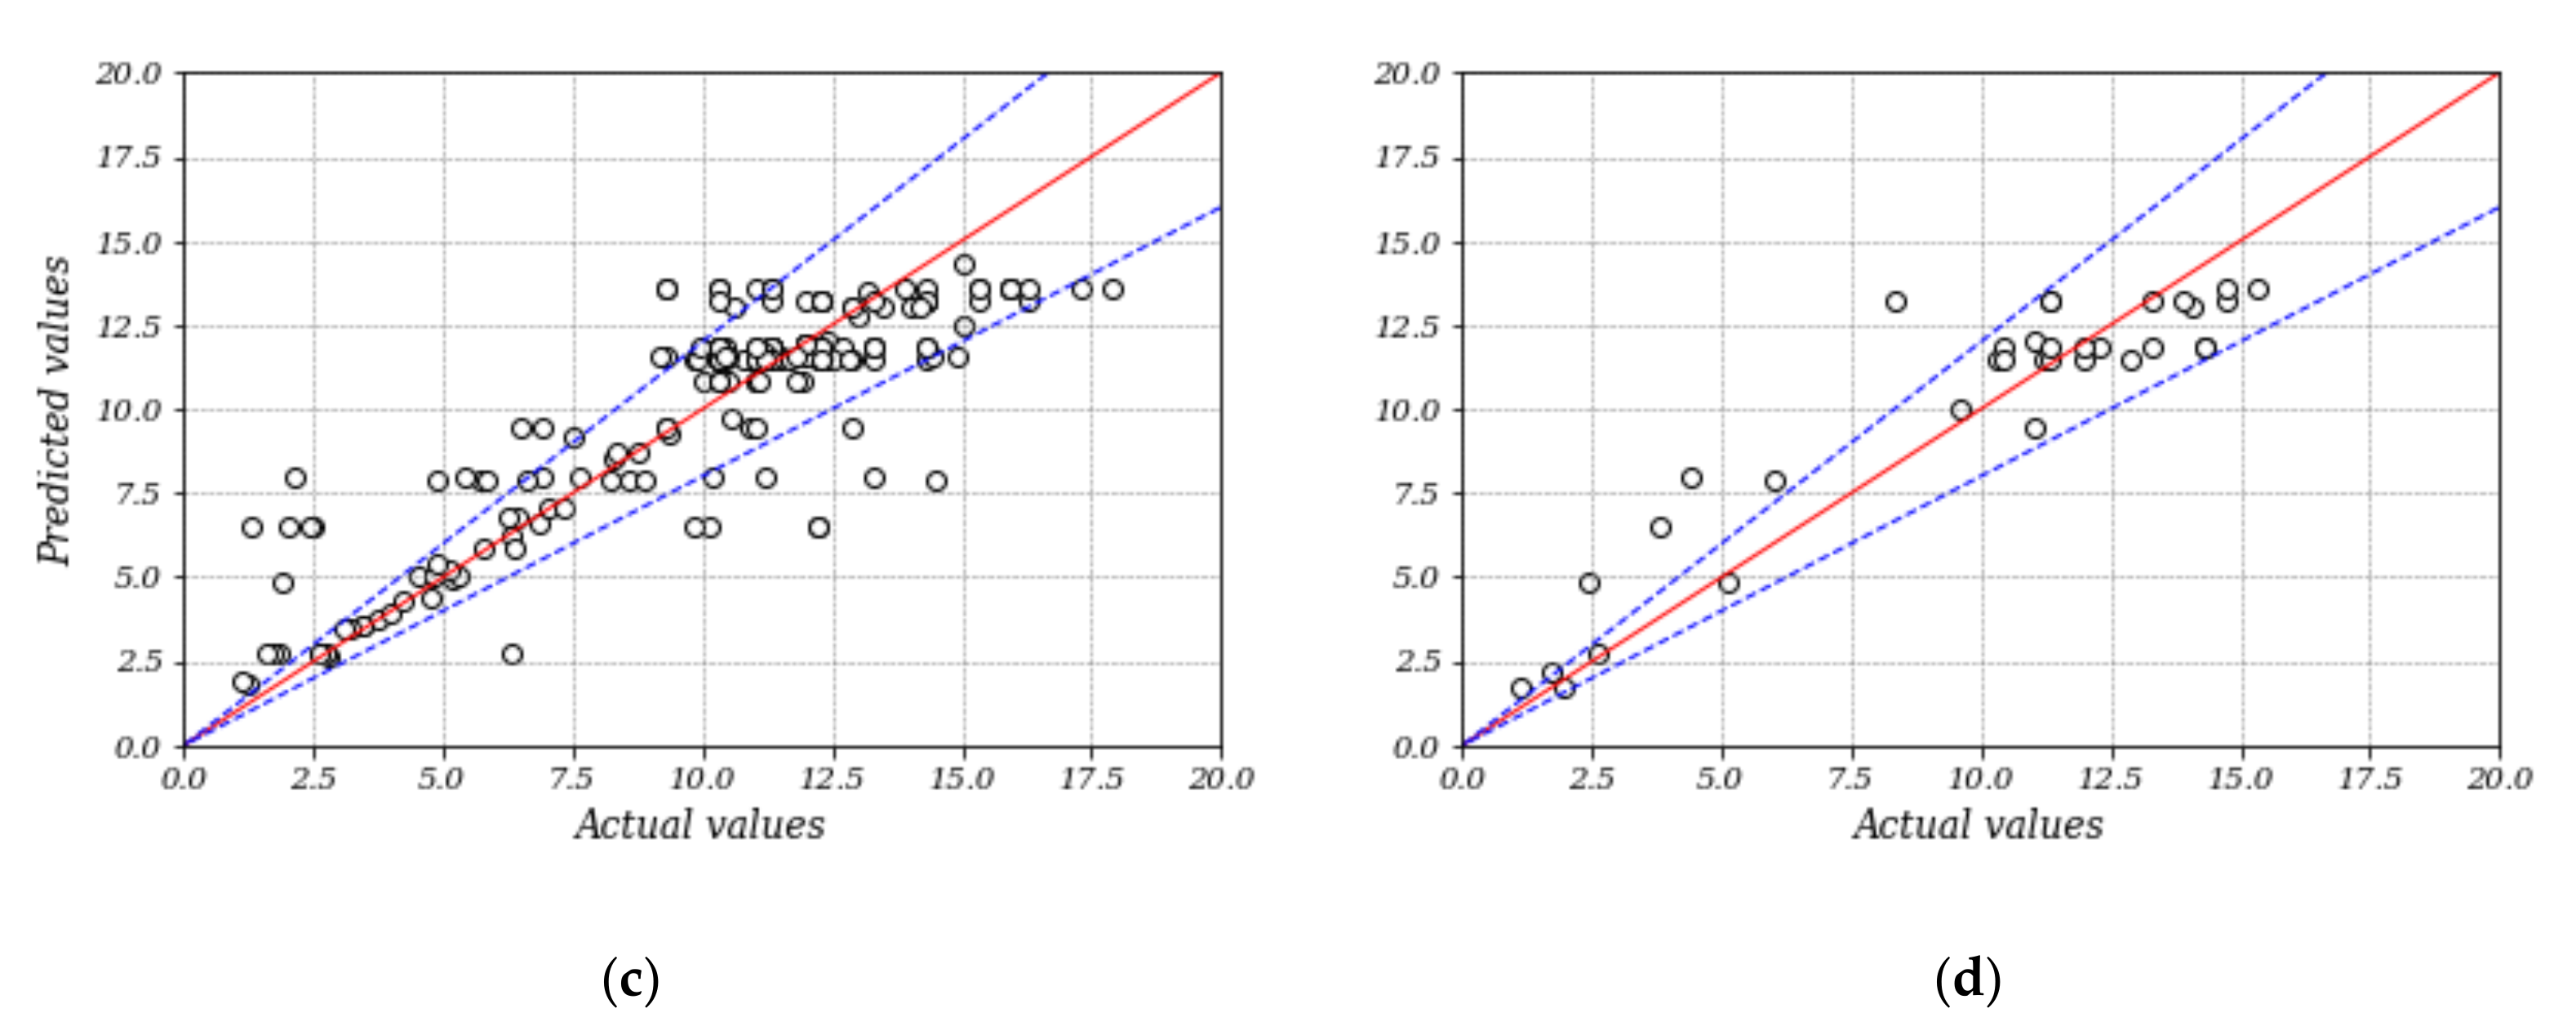
  • The results proved the high ability of both DT and RF models for learning the relationship between input variables and the output. The quick and simple ML-based models proposed in this study, therefore, could be considered as a reliable alternative approach for time-consuming and costly experimental tests.
  • Both the DT and RF model exhibited highly reliable results, with R2 scores higher than 85%. The DT model, however, illustrated higher accuracy (R2 = 89%) compared to the RF model (R2 = 85%). It should be explained that although RF generally leads to more reliable results, in this study, the predicted values obtained by the DT model were more accurate, because the training and testing datasets for each model were selected randomly in order to avoid any human effect on the prediction process. In other words, the training and testing databases were not the same, which caused the slight difference between the models’ accuracy. In order to compare RF and DT more precisely, the same training and testing datasets should be chosen. This study, however, focused on the reliability assessment of Decision Tree and Random Forest models for estimating the ultimate strain of spliced and non-spliced steel bars, and the results proved their acceptable accuracy.
  • It is also noteworthy that comparing the accuracy of the models, which estimates the ultimate strain of bars, for each splice method could be conducted in further studies. To this end, (a) an extensive database including the results of tests on each splice type should be collected; (b) input variables for each method should be specified—as an example, the strength of grout could be considered as one of the inputs for models estimating the mechanical properties of grouted spliced bars; and (c) the databases should be large enough for training the relationships between inputs (which may be different for each splice technique) and output appropriately.
  • The proposed models in this research could be used in a more generalized model for predicting the stress-strain behavior of spliced and non-spliced bars. More clearly, by combining models which predict other parameters (e.g., yield strength and strain) with the models proposed in this study, the stress-strain curve could be estimated without doing experimental tests.

Author Contributions

Conceptualization, V.F. and M.K.; Data curation, H.D., M.J.M. and M.Z.; Formal analysis, H.D., V.F., M.J.M. and M.Z.; Funding acquisition, V.F.; Investigation, H.D. and V.F.; Methodology, H.D. and V.F.; Project administration, M.Z. and M.K.; Software, H.D., M.J.M. and M.Z.; Supervision, V.F.; Validation, M.J.M. and M.K.; Writing—original draft, H.D. and V.F.; Writing—review & editing, H.D. All authors have read and agreed to the published version of the manuscript.

Funding

This research received no external funding.

Institutional Review Board Statement

Not applicable.

Informed Consent Statement

Not applicable.

Data Availability Statement

The data required to reproduce these findings are available on request from the corresponding authors.

Conflicts of Interest

The authors declare no conflict of interest.

Nomenclature

ANNArtificial Neural Network
DTDecision Tree
MAEMean of Absolute Error
MAPEMean of Percentage Error
MLMachine Learning
MSEMean of Square Error
nNumber of datasets
RCReinforced Concrete
RFRandom Forest
RMSERoot of Mean Square Error
y i Actual value
y i ^ Predicted value

References

  1. Zhan, J.; Zhang, F.; Siahkouhi, M.; Kong, X.; Xia, H. A damage identification method for connections of adjacent box-beam bridges using vehicle–bridge interaction analysis and model updating. Eng. Struct. 2021, 228, 111551. [Google Scholar] [CrossRef]
  2. Zhao, E.; Song, C.; Zhang, X.; Zhou, Q.; Yan, K. Experimental study on monotonic, cyclic mechanics and fatigue performance of pressed cone sleeve splices. In Structures; Elsevier: Amsterdam, The Netherlands, 2022; pp. 482–495. [Google Scholar]
  3. Ghayeb, H.H.; Razak, H.A.; Sulong, N.R.; Mo, K.H.; Abutaha, F.; Gordan, M. Performance of mechanical steel bar splices using grouted couplers under uniaxial tension. J. Build. Eng. 2021, 34, 101892. [Google Scholar] [CrossRef]
  4. Zhang, P.; Su, Y.L.; Fan, J.J.; Feng, H.; Shao, J.; Guo, H.; Gao, D.-Y.; Sheikh, S.A. Experimental research on the mechanical behavior of grouted sleeves with fiber-reinforced grouting material under cyclic loading. In Structures; Elsevier: Amsterdam, The Netherlands, 2021; pp. 2189–2204. [Google Scholar]
  5. Xu, L.; Pan, J.; Guo, L. Mechanical performance of precast RC columns with grouted sleeve connections. Eng. Struct. 2022, 252, 113654. [Google Scholar] [CrossRef]
  6. Bompa, D.; Elghazouli, A. Ductility considerations for mechanical reinforcement couplers. In Structures; Elsevier: Amsterdam, The Netherlands, 2017; pp. 115–119. [Google Scholar]
  7. Wu, S.; Li, H.; Wang, X.; Li, R.; Tian, C.; Hou, Q. Seismic performance of a novel partial precast RC shear wall with reserved cast-in-place base and wall edges. Soil Dyn. Earthq. Eng. 2022, 152, 107038. [Google Scholar] [CrossRef]
  8. Alyousef, R.; Topper, T.; Al-Mayah, A. Crack growth modeling of tension lap spliced reinforced concrete beams strengthened with fibre reinforced polymer wrapping under fatigue loading. Constr. Build. Mater. 2018, 166, 345–355. [Google Scholar] [CrossRef]
  9. Dabiri, H.; Kheyroddin, A.; Dall’Asta, A. Splice methods used for reinforcement steel bars: A state-of-the-art review. Constr. Build. Mater. 2022, 320, 126198. [Google Scholar] [CrossRef]
  10. Dahal, P.K.; Tazarv, M. Mechanical bar splices for incorporation in plastic hinge regions of RC members. Constr. Build. Mater. 2020, 258, 120308. [Google Scholar] [CrossRef]
  11. Dabiri, H.; Kheyroddin, A. An experimental comparison of RC beam-column joints incorporating different splice methods in the beam. In Structures; Elsevier: Amsterdam, The Netherlands, 2021; pp. 1603–1613. [Google Scholar]
  12. Kheyroddin, A.; Rouhi, S.; Dabiri, H. An experimental study on the influence of incorporating lap or forging (GPW) splices on the cyclic performance of RC columns. Eng. Struct. 2021, 241, 112434. [Google Scholar] [CrossRef]
  13. Tazarv, M.; Saiidi, M.S. Seismic design of bridge columns incorporating mechanical bar splices in plastic hinge regions. Eng. Struct. 2016, 124, 507–520. [Google Scholar] [CrossRef]
  14. Lu, Z.; Huang, J.; Dai, S.; Liu, J.; Zhang, M. Experimental study on a precast beam-column joint with double grouted splice sleeves. Eng. Struct. 2019, 199, 109589. [Google Scholar] [CrossRef]
  15. Henin, E.; Morcous, G. Non-proprietary bar splice sleeve for precast concrete construction. Eng. Struct. 2015, 83, 154–162. [Google Scholar] [CrossRef]
  16. Sayadi, A.A.; Rahman, A.B.A.; Jumaat, M.Z.B.; Alengaram, U.J.; Ahmad, S. The relationship between interlocking mechanism and bond strength in elastic and inelastic segment of splice sleeve. Constr. Build. Mater. 2014, 55, 227–237. [Google Scholar] [CrossRef]
  17. Hosseini, S.J.A.; Rahman, A.B.A.; Osman, M.H.; Saim, A.; Adnan, A. Bond behavior of spirally confined splice of deformed bars in grout. Constr. Build. Mater. 2015, 80, 180–194. [Google Scholar] [CrossRef]
  18. Lin, F.; Wu, X. Mechanical performance and stress–strain relationships for grouted splices under tensile and cyclic loadings. Int. J. Concr. Struct. Mater. 2016, 10, 435–450. [Google Scholar] [CrossRef] [Green Version]
  19. Bompa, D.; Elghazouli, A. Monotonic and cyclic performance of threaded reinforcement splices. In Structures; Elsevier: Amsterdam, The Netherlands, 2018; pp. 358–372. [Google Scholar]
  20. Bompa, D.; Elghazouli, A. Elevated temperature characteristics of steel reinforcement incorporating threaded mechanical couplers. Fire Saf. J. 2019, 104, 8–21. [Google Scholar] [CrossRef] [Green Version]
  21. Borrero, E.L.; Farhangi, V.; Jadidi, K.; Karakouzian, M. An Experimental Study on Concrete’s Durability and Mechanical Characteristics Subjected to Different Curing Regimes. Civ. Eng. J. 2021, 7, 676–689. [Google Scholar] [CrossRef]
  22. ASTM E8/E8M-16; Standard Test Methods for Tension Testing of Metallic Materials. ASTM International: West Conshohocken, PA, USA, 2018.
  23. Shariati, M.; Mafipour, M.S.; Ghahremani, B.; Azarhomayun, F.; Ahmadi, M.; Trung, N.T.; Shariati, A. A novel hybrid extreme learning machine–grey wolf optimizer (ELM-GWO) model to predict compressive strength of concrete with partial replacements for cement. Eng. Comput. 2020, 38, 757–779. [Google Scholar] [CrossRef]
  24. Kandiri, A.; Golafshani, E.M.; Behnood, A. Estimation of the compressive strength of concretes containing ground granulated blast furnace slag using hybridized multi-objective ANN and salp swarm algorithm. Constr. Build. Mater. 2020, 248, 118676. [Google Scholar] [CrossRef]
  25. Golafshani, E.M.; Rahai, A.; Sebt, M.H.; Akbarpour, H. Prediction of bond strength of spliced steel bars in concrete using artificial neural network and fuzzy logic. Constr. Build. Mater. 2012, 36, 411–418. [Google Scholar] [CrossRef]
  26. Dabiri, H.; Rahimzadeh, K.; Kheyroddin, A. A comparison of machine learning-and regression-based models for predicting ductility ratio of RC beam-column joints. In Structures; Elsevier: Amsterdam, The Netherlands, 2022; pp. 69–81. [Google Scholar]
  27. Khaleghi, M.; Salimi, J.; Farhangi, V.; Moradi, M.J.; Karakouzian, M. Evaluating the behaviour of centrally perforated unreinforced masonry walls: Applications of numerical analysis, machine learning, and stochastic methods. Ain Shams Eng. J. 2022, 13, 101631. [Google Scholar] [CrossRef]
  28. Dabiri, H.; Kheyroddin, A.; Faramarzi, A. Predicting tensile strength of spliced and non-spliced steel bars using machine learning-and regression-based methods. Constr. Build. Mater. 2022, 325, 126835. [Google Scholar] [CrossRef]
  29. Chou, P.-Y.; Tsai, J.-T.; Chou, J.-H. Modeling and optimizing tensile strength and yield point on a steel bar using an artificial neural network with taguchi particle swarm optimizer. IEEE Access 2016, 4, 585–593. [Google Scholar] [CrossRef]
  30. Moradi, M.; Daneshvar, K.; Ghazi-Nader, D.; Hajiloo, H. The prediction of fire performance of concrete-filled steel tubes (CFST) using artificial neural network. Thin-Walled Struct. 2021, 161, 107499. [Google Scholar] [CrossRef]
  31. Ben Seghier, M.E.A.; Ouaer, H.; Ghriga, M.A.; Menad, N.A.; Thai, D.-K. Hybrid soft computational approaches for modeling the maximum ultimate bond strength between the corroded steel reinforcement and surrounding concrete. Neural Comput. Appl. 2021, 33, 6905–6920. [Google Scholar] [CrossRef]
  32. Fu, B.; Chen, S.-Z.; Liu, X.-R.; Feng, D.-C. A probabilistic bond strength model for corroded reinforced concrete based on weighted averaging of non-fine-tuned machine learning models. Constr. Build. Mater. 2022, 318, 125767. [Google Scholar] [CrossRef]
  33. Jing, G.; Yunchang, D.; You, R.; Siahkouhi, M. Comparison study of crack propagation in rubberized and conventional prestressed concrete sleepers using digital image correlation. Proc. Inst. Mech. Eng. Part F J. Rail Rapid Transit 2021, 09544097211020595. [Google Scholar] [CrossRef]
  34. Kheyroddin, A.; Mohammadkhah, A.; Dabiri, H.; Kaviani, A. Experimental investigation of using mechanical splices on the cyclic performance of RC columns. In Structures; Elsevier: Amsterdam, The Netherlands, 2020; pp. 717–727. [Google Scholar]
  35. Bompa, D.; Elghazouli, A. Inelastic cyclic behaviour of RC members incorporating threaded reinforcement couplers. Eng. Struct. 2019, 180, 468–483. [Google Scholar] [CrossRef]
  36. Rowell, S.P.; Grey, C.E.; Woodson, S.C.; Hager, K.P. High Strain-Rate Testing of Mechanical Couplers; Engineer Research and Development Center Vicksburg MS Geotechnical and Structures Lab: Vicksburg, MS, USA, 2009. [Google Scholar]
  37. Jordan, E.J. Experimental Studies of Reinforcing Steel and Shape Memory Alloys in Mechanically Spliced Connections for Seismic Application; University of Nevada: Reno, NV, USA, 2018. [Google Scholar]
  38. Chidambaram, R.S.; Agarwal, P. Performance evaluation of innovative hybrid rebar coupler in reinforced concrete beams subjected to monotonic loading. Struct. Concr. 2018, 19, 892–903. [Google Scholar] [CrossRef]
  39. Lloyd, W. Qualification of the Bar-Lock Rebar Coupler for Use in Nuclear Safety-Related Applications Mechanical Testing Program and Performance Analysis; Report No. INEEL/EXT-02-01387; Idaho National Engineering and Environmental Laboratory Materials Department: Idaho Falls, ID, USA, 2001. [Google Scholar]
  40. Higgins, C.C.; Barbosa, A.; Shrestha, S.; Lostra, M.; Belejo, A. Seismic Retrofits for Square Reinforced Concrete Columns Using Titanium Alloy Bars; School of Civil and Construction Engineering, Oregon State University: Corvallis, OR, USA, 2020. [Google Scholar]
  41. ACI. Building Code Requirement for Structural Concrete and Commentary; American Concrete Institute Committee: Farmington Hills, MI, USA, 2019. [Google Scholar]
  42. Liu, S.; McGree, J.; Ge, Z.; Xie, Y. Computational and Statistical Methods for Analysing Big Data with Applications; Academic Press: Cambridge, MA, USA, 2015. [Google Scholar]
  43. Nisbet, R.; Elder, J.; Miner, G.D. Handbook of Statistical Analysis and Data Mining Applications; Academic Press: Cambridge, MA, USA, 2009. [Google Scholar]
  44. Bellini, T. IFRS 9 and CECL Credit Risk Modelling and Validation: A Practical Guide with Examples Worked in R and SAS; Academic Press: Cambridge, MA, USA, 2019. [Google Scholar]
  45. Xia, Y. Correlation and association analyses in microbiome study integrating multiomics in health and disease. Prog. Mol. Biol. Transl. Sci. 2020, 171, 309–491. [Google Scholar]
  46. Gedeck, P.; Kramer, C.; Ertl, P. Computational analysis of structure–activity relationships. Prog. Med. Chem. 2010, 49, 113–160. [Google Scholar]
  47. Fawagreh, K.; Gaber, M.M.; Elyan, E. Random forests: From early developments to recent advancements. Syst. Sci. Control Eng. Open Access J. 2014, 2, 602–609. [Google Scholar] [CrossRef] [Green Version]
  48. Breiman, L. Random forests. Mach. Learn. 2001, 45, 5–32. [Google Scholar] [CrossRef] [Green Version]
  49. Breiman, L. Bagging predictors. Mach. Learn. 1996, 24, 123–140. [Google Scholar] [CrossRef] [Green Version]
  50. Amit, Y.; Geman, D. Shape quantization and recognition with randomized trees. Neural Comput. 1997, 9, 1545–1588. [Google Scholar] [CrossRef] [Green Version]
  51. Daneshvar, K.; Moradi, M.J.; Amooie, M.; Chen, S.; Mahdavi, G.; Hariri-Ardebili, M.A. Response of low-percentage FRC slabs under impact loading: Experimental, numerical, and soft computing methods. In Structures; Elsevier: Amsterdam, The Netherlands, 2020; pp. 975–988. [Google Scholar]
  52. Moradi, M.J.; Hariri-Ardebili, M.A. Developing a library of shear walls database and the neural network based predictive meta-model. Appl. Sci. 2019, 9, 2562. [Google Scholar] [CrossRef] [Green Version]
Figure 1. Pearson coefficients of the input variables.
Applsci 12 04851 g001
Figure 2. Splice types considered in the database: (a) headed bars, (b) grouted splice, (c) shear-screw, (d) swaged couplers, (e) taper threaded, and (f) threaded [9].
Applsci 12 04851 g002aApplsci 12 04851 g002b
Figure 3. Schematic illustration of length and outer diameter of a mechanical splice.
Applsci 12 04851 g003
Figure 4. Histograms illustrating the distribution of the input and output variables.
Applsci 12 04851 g004
Figure 5. Choosing the optimal number of trees for the RF model.
Applsci 12 04851 g005
Figure 6. Correlation between estimated and actual values: (a) DT: training, (b) DT: testing, (c) RF: training, and (d) RF: testing.
Applsci 12 04851 g006aApplsci 12 04851 g006b
Figure 7. Actual and estimated values: (a) DT: training, (b) DT: testing, (c) RF: training, and (d) RF: testing.
Applsci 12 04851 g007
Figure 8. Comparing the accuracy of the proposed models through a Taylor diagram.
Applsci 12 04851 g008
Table 1. Pearson coefficients determined for the input and output parameters.
Splice TypeSteel GradeBar Diameter (mm)Length of Coupler (mm)Outer Diameter of Coupler (mm)TemperatureUltimate Strain (%)
Splice type1
Steel grade−0.29031
Bar diameter (mm)0.1202−0.67831
Length of Coupler (mm)0.5919−0.54240.34941
Outer diameter of Coupler (mm)0.7556−0.63060.38110.8181
Temperature0.28820.2681−0.2307−0.00250.02571
Ultimate strain (%)−0.5410.2281−0.2471−0.4698−0.4781−0.50921
Table 2. Statistical properties of the input and output parameters.
MinimumMaximumMeanMedianVarianceStandard Deviation
Steel grade60.00500.00310.73500.0046,272.79215.11
Bar diameter (mm)12.0032.2624.1625.0055.257.43
Coupler length (mm)45.00490.5488.800.0020,316.91142.54
Coupler outer diameter (mm)7.2964.0017.230.00519.3422.79
Temperature (°C)20.00600.0061.8225.0015,448.67124.29
Ultimate strain (%)1.0817.909.9311.0015.333.92
Table 3. Performance metrics for the prediction models.
R2RRMSEMSEMAEMAPE
DT0.890.941.381.901.0423.25
RF0.850.921.682.821.2919.72
Publisher’s Note: MDPI stays neutral with regard to jurisdictional claims in published maps and institutional affiliations.

