
Cognitive Diagnostic Assessment in University Statistics Education: Valid and Reliable Skill Measurement for Actionable Feedback Using Learning Dashboards


Abstract
:1. Introduction
1.1. Cognitive Diagnostic Assessment
1.2. Cognitive Model Specification
1.2.1. Attribute Granularity
1.2.2. Item Construction and Q-Matrix Specification
1.3. Diagnostic Assessment in Statistics Education
1.4. Current Study
How can valid and reliable diagnostic information be obtained from online formative assessment to provide actionable feedback via learning dashboards in university statistics education?
2. Attribute Identification
2.1. Methods
2.1.1. Domain Description
2.1.2. Defining Learning Objectives
2.1.3. Defining Attributes
2.1.4. Expert Evaluation
2.2. Results
3. Assessment Construction and Q-Matrix Specification
3.1. Item Collection
3.2. Q-Matrix Specification
4. Assessment Validation
4.1. Qualitative Evaluation
4.1.1. Methods
Participants and Procedures
Analysis
4.1.2. Results
4.2. Quantitative Evaluation
4.2.1. Methods
Participants and Procedures
Analysis
4.2.2. Results
Assumption of Local Independence
Q-Matrix Validation
Attribute Behavior at the Item Level
Final Model
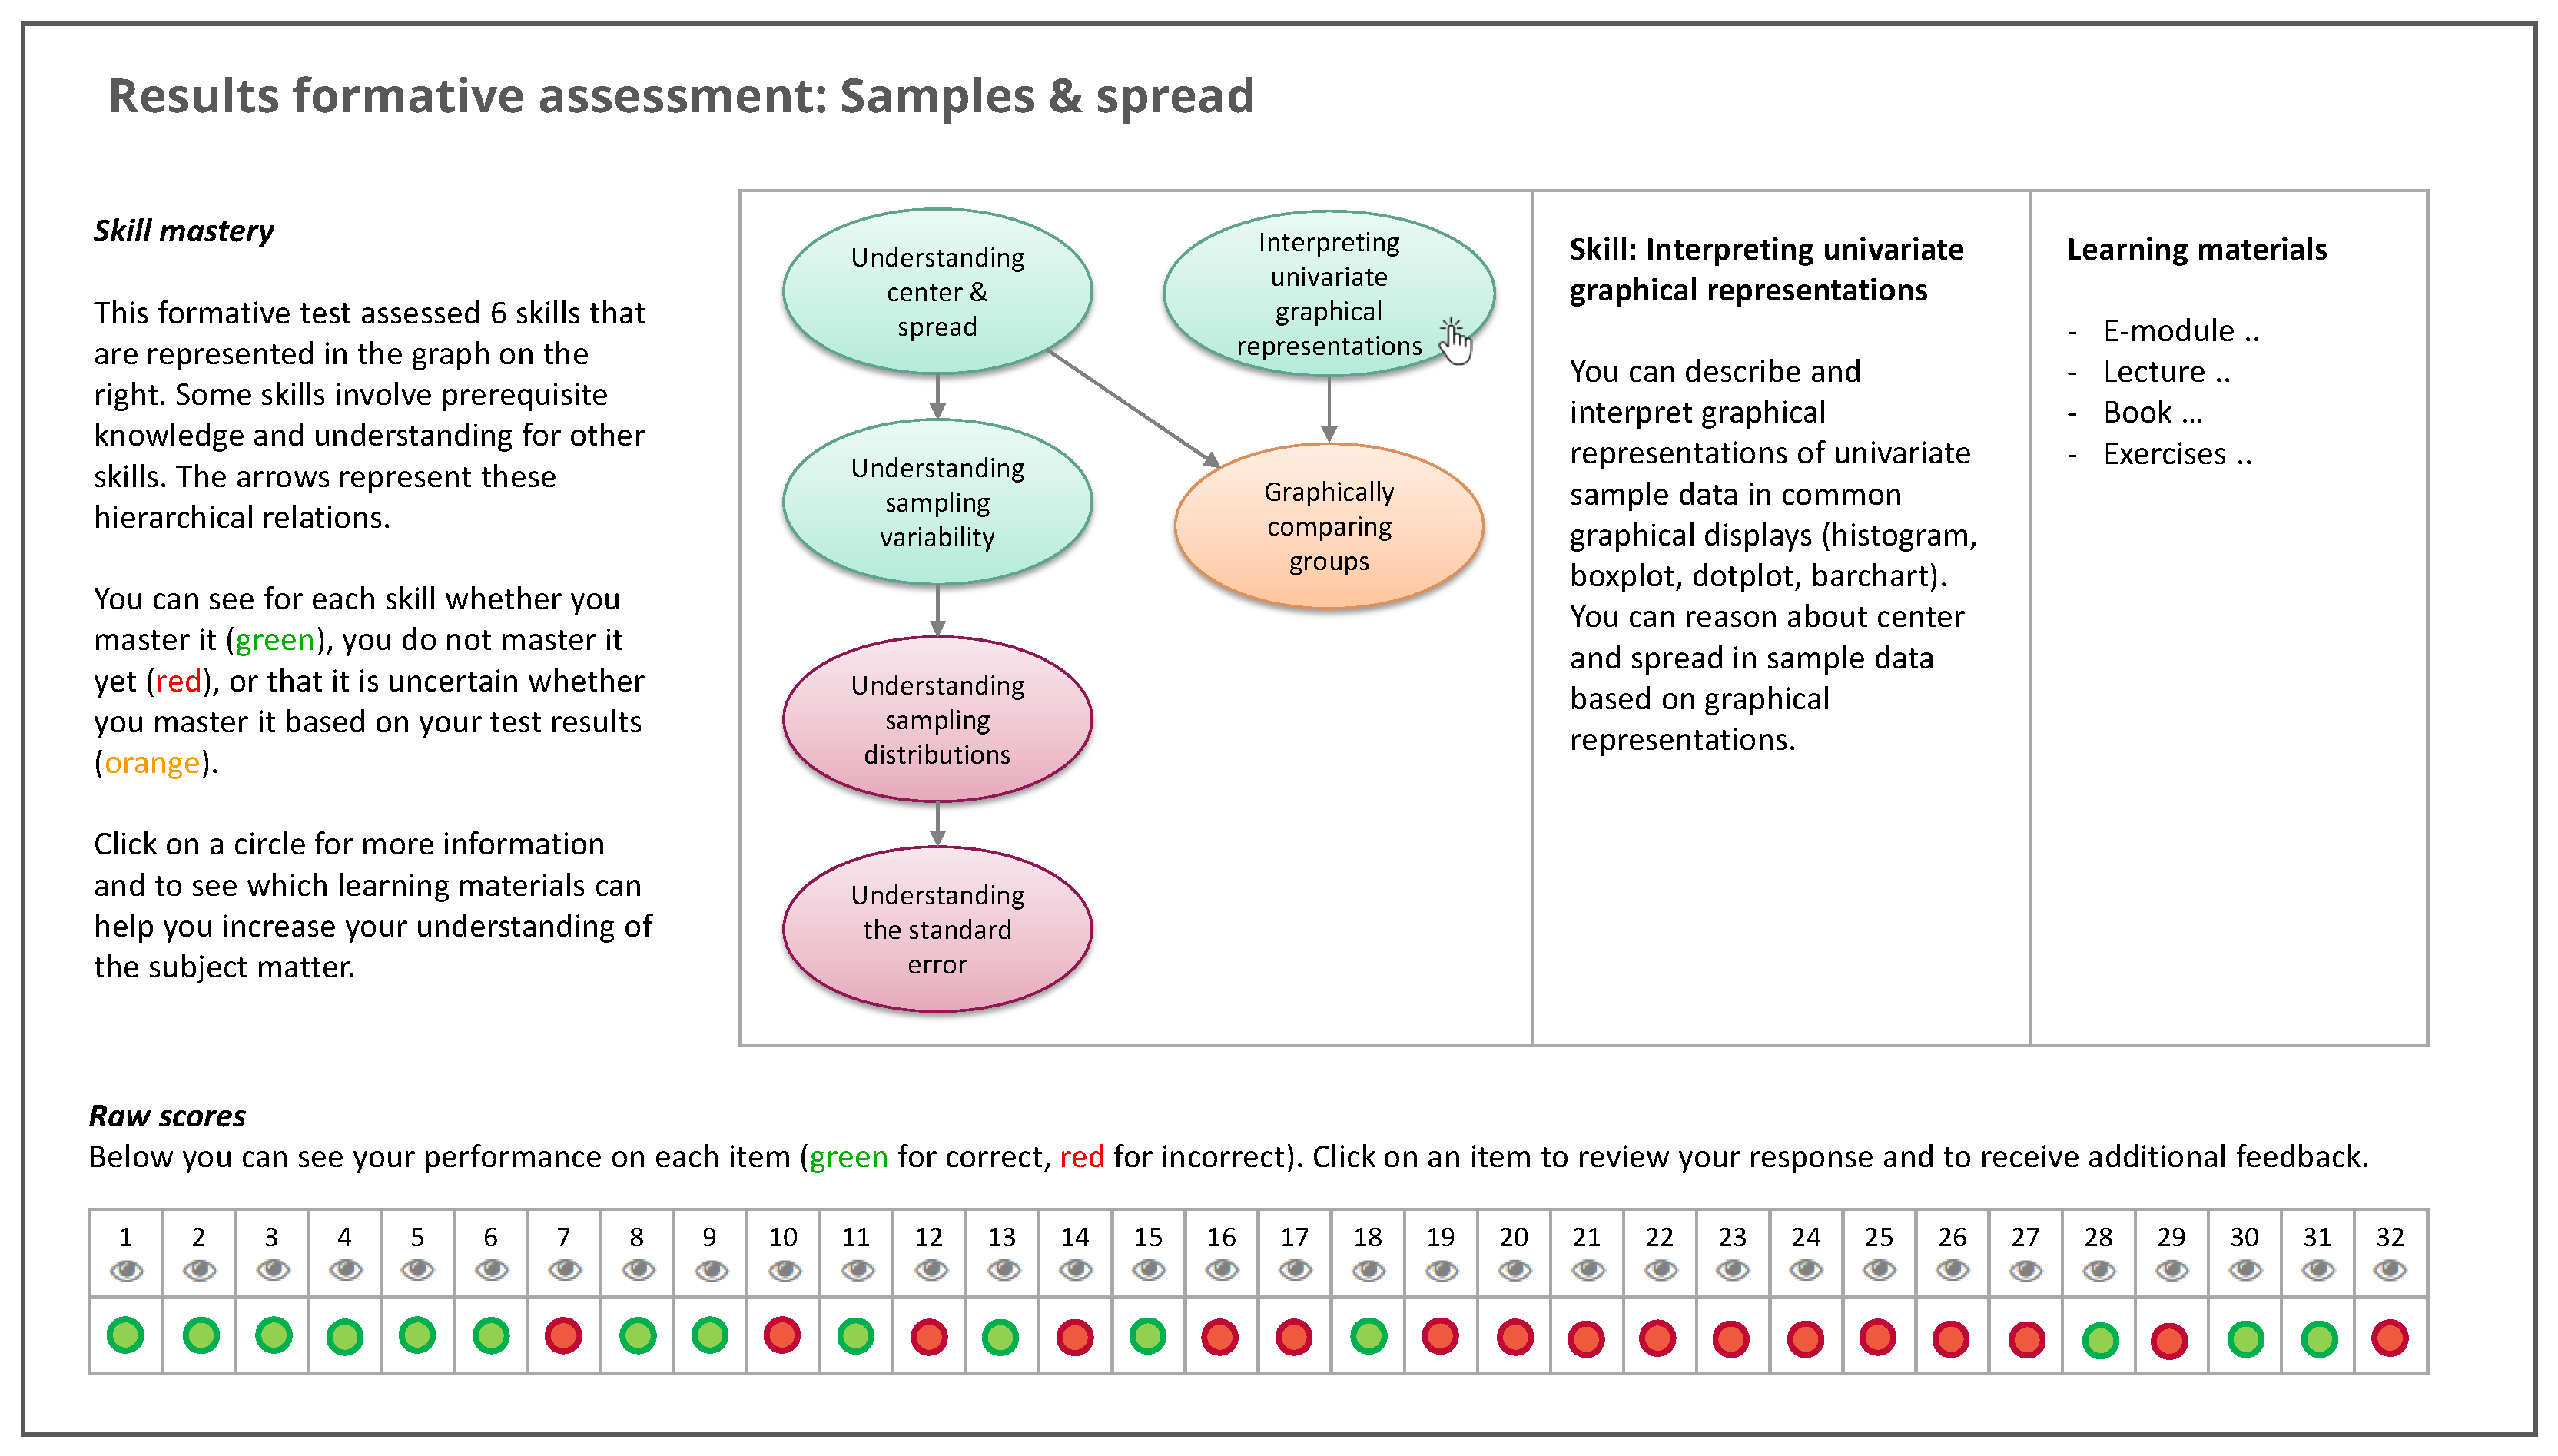
5. Communicating Feedback
5.1. Psychometric Interpretation
5.2. Reporting Results
6. Discussion
6.1. Implications for Educational Practice
6.2. Limitations
6.3. Concluding Remarks
Supplementary Materials
Author Contributions
Funding
Institutional Review Board Statement
Informed Consent Statement
Data Availability Statement
Acknowledgments
Conflicts of Interest
Abbreviations
| DCM | Diagnostic classification model |
| LCDM | Log-linear cognitive diagnosis model |
| DINA | Deterministic inputs, noisy “and” gate |
| DINO | Deterministic inputs, noisy “or” gate |
| A-CDM | Additive cognitive diagnosis model |
| LLM | Linear logistic model |
| R-RUM | Reduced reparameterized unified model |
Appendix A
- Table A1 presents an overview of the 9 attributes that resulted from the attribute identification process, which are comprised of 33 learning objectives. The table includes references to empirical studies that show the relevance of the addressed concepts and the occurrence of misconceptions for each learning objective. In the Supplementary Material, a more detailed description of each attribute and the references to the empirical studies is provided.
- Table A2 presents all items for which modifications to the Q-matrix were suggested in the empirical Q-matrix validation. Argumentation to retain or modify entries is provided along with the final q-vectors.

| A. | Understanding center & spread | |||
| 1. | Understanding of the idea of variability in samples and populations. | - | [73] | |
| 2. | Ability to describe and interpret measures of center (mean, median, mode). | - | [27], Chapter 9 | |
| 3. | Ability to describe and interpret measures of spread (range, interquartile range, variance, standard deviation). | - | [73] | |
| 4. | Understanding of how center and spread are affected by data transformations. | - | [28] | |
| 5. | Understanding of how center and spread are affected by handling of outliers. | - | [27], Chapters 9 and 10 | |
| B. | Interpreting univariate graphical representations | |||
| 6. | Ability to describe and interpret graphical representations of sample data in common univariate graphical displays (histogram, boxplot, dotplot, bar chart), including the ability to reason about center and spread in sample data based on graphical representations. | - | [28,74] | |
| C. | Graphically comparing groups | |||
| 7. | Ability to compare groups on a continuous outcome variable by focusing on data as an aggregate with characteristics such as center, spread, and shape. | - | [27], Chapters 9 and 10; [28,75] | |
| 8. | Ability to make informal inferences about group differences based on graphical representations by comparing variability between and within groups, i.e., by considering both center and spread. | - | [27], Chapter 11; [76] | |
| D. | Understanding sampling variability | |||
| 9. | Understanding that a sample provides incomplete information about the population from which it is drawn and that random sampling forms the basis for statistical inference. | - | [27], Chapter 12; [77] | |
| 10. | Understanding how the set of all possible random samples (with the given size) from the population of interest is considered in inferential statistics, i.e., that the unit of analysis is the entire sample rather than a single observation. | - | [27], Chapters 12 and 13; [78] | |
| 11. | Understanding that not all samples are identical, so not all of them will resemble the population in the same way and to the same extent every time. | - | [79] | |
| 12. | Understanding of expected patterns in sampling variability, in which some values are more or less likely than others to be drawn from a particular population. | - | [27], Chapter 12; [28] | |
| E. | Understanding sampling distributions | |||
| 13. | Ability to describe and distinguish between the sample distribution, sampling distribution, and population distribution. | - | [27], Chapter 12; [79,80] | |
| 14. | Knowing that, given a sufficiently large sample size, the sampling distribution of the mean for a variable will approximate a normal distribution. | - | [27], Chapter 12; [81,82] | |
| 15. | Knowing how the (unknown) population mean, the sample mean, the possible sample mean values for different random samples of the given size, and the theoretical mean of these possible values relate to each other. | - | [27], Chapter 12; [83] | |
| F. | Understanding the standard error | |||
| 16. | Ability to interpret the standard error as a measure of variability of sample means. | - | [27], Chapter 12 | |
| 17. | Understanding that statistics from small samples vary more than statistics from large samples and knowing how the standard error decreases with sample size. | - | [27], Chapter 12; [28,79] | |
| 18. | Understanding of how population variance influences sampling variability and, thus, the standard error. | - | [27], Chapter 12 | |
| 19. | Ability to make informal inferences about sample means based on measures of sampling variability. | - | [28] | |
| G. | Understanding principles of hypothesis testing | |||
| 20. | Understanding of the goals and the logic of significance tests; understanding of the theoretical idea of finding evidence against a null hypothesis. | - | [84] | |
| 21. | Understanding that statistical inferences are not deterministic and NHST results do not prove the null hypothesis to be true or false. | - | [84,85] | |
| H. | Evaluating NHST results | |||
| 22. | Ability to take a correct decision about the null hypothesis based on the significance level and p-value. | - | [86] | |
| 23. | Ability to correctly interpret p-values as the probability of obtaining test results at least as extreme as the results actually observed, under the assumption that the null hypothesis is true. | - | [28,87,88,89,90] | |
| 24. | Ability to describe the concepts Type I error, Type II error, significance level, and statistical power. | - | [86,91] | |
| 25. | Understanding of how increasing the sample size increases power by reducing the standard error. | - | [27], Chapter 13; [86] | |
| 26. | Understanding of how increasing the significance level increases power by enlarging the rejection region. | - | [86] | |
| 27. | Understanding of how larger effect sizes result in higher power by enlarging the difference between the means of the null and alternative distribution. | - | [86] | |
| 28. | Understanding that statistical significance does not imply practical relevance and vice versa. | - | [28,92,93] | |
| I. | Understanding and using confidence intervals | |||
| 29. | Understanding that CIs are used to provide an indication of the precision of an estimate. | - | [28,94,95] | |
| 30. | Ability to correctly interpret CIs in terms of repeated sampling (e.g., if repeated samples were taken and the 95% confidence interval was computed for each sample mean, 95% of the intervals would contain the population mean). | - | [96] | |
| 31. | Understanding of how increasing the sample size decreases CI width by reducing the standard error. | - | [97] | |
| 32. | Understanding of how increasing the confidence level increases CI width by reducing the precision of the estimate. | - | [97] | |
| 33. | Understanding of connections between CIs and hypothesis tests; ability to draw a conclusion about the null hypothesis based on a CI (i.e., if the CI does not contain the null hypothesis value, the results are statistically significant). | - | [98] | |
| Item | q-Vector | Content Re-Evaluation: Theoretical Defensibility | Attribute Use in TA | PVAF | Argumentation | Final q-Vector | |
|---|---|---|---|---|---|---|---|
| Orig. | 110000 | Exclude B: no | B: 100% | 100000: 0.328 | Att. B should be included from a theoretical perspective and explains a substantial proportion of additional variance. | 110000 | |
| Sugg. | 100000 | 110000: 0.816 | |||||
| Orig. | 110000 | Exclude A: no | A: 67% | 010000: 0.464 | Att. A should be included from a theoretical perspective and explains a substantial proportion of additional variance. | 110000 | |
| Sugg. | 010000 | 110000: 0.835 | |||||
| Orig. | 111000 | Exclude A: yes | A: 0% | 001000: 0.959 | Although att. B explains little additional variance, it cannot be excluded from a theoretical perspective. Att. A can be excluded and explains little additional variance; therefore, it is excluded. | 011000 | |
| Sugg. | 001000 | Exclude B: no | B: 100% | 011000: 0.964 | |||
| 111000: 0.985 | |||||||
| Orig. | 011000 | Exclude B: yes | B: 0% | 001000: 0.999 | Att. B can be excluded from a theoretical perspective and explains no additional variance; therefore, it is excluded. | 001000 | |
| Sugg. | 001000 | 011000: 0.999 | |||||
| Orig. | 001000 | Include B: yes | B: 75% | 001000: 0.002 | Although att. C explains a very small proportion of variance, it cannot be excluded from a theoretical perspective. Att. B can be included from a theoretical perspective and explains a substantial proportion of additional variance; therefore, it is included. | 011000 | |
| Sugg. | 010000 | Exclude C: no | C: 100% | 010000: 0.437 | |||
| 011000: 0.469 | |||||||
| Orig. | 011000 | Exclude B: no | B: 100% | 001000: 0.876 | Att. B should be included from a theoretical perspective and explains some additional variance. | 011000 | |
| Sugg. | 001000 | 011000: 0.969 | |||||
| Orig. | 000100 | Include C: no | C: 0% | 000100: 0.056 | Including att. C and excluding att. D is not theoretically defensible. Despite the higher PVAF for att. C, the original q-vector is retained. | 000100 | |
| Sugg. | 001000 | Exclude D: no | D: 60% | 001000: 0.183 | |||
| Orig. | 000110 | Exclude D: yes | D: 0% | 000010: 0.945 | Att. D can be excluded from a theoretical perspective and explains only little additional variance; therefore, it is excluded. | 000010 | |
| Sugg. | 000010 | 000110: 0.986 | |||||
| Orig. | 000011 | Exclude F: no | F: 50% | 000010: 0.949 | Although att. F explains only a small proportion of additional variance; it cannot be excluded from a theoretical perspective. | 000011 | |
| Sugg. | 000010 | 000011: 0.951 | |||||
| Orig. | 000010 | Include A: no | A: 0% | 000010: 0.016 | Including att. A and excluding att. E is not theoretically defensible. Despite the higher PVAF for att. A, the original q-vector is retained. | 000010 | |
| Sugg. | 100000 | Exclude E: no | E: 100% | 100000: 0.597 | |||
| Orig. | 000010 | Include C: no | C: 0% | 000010: 0.232 | Including att. C and excluding att. E is not theoretically defensible. Despite the higher PVAF for att. C, the original q-vector is retained. | 000010 | |
| Sugg. | 001000 | Exclude E: no | E: 100% | 001000: 0.288 | |||
| Orig. | 000010 | Include C: no | C: 0% | 000010: 0.121 | Including att. C and excluding att. E is not theoretically defensible. Despite the higher PVAF for att. C, the original q-vector is retained. | 000010 | |
| Sugg. | 001000 | Exclude E: no | E: 100% | 001000: 0.182 | |||
| Orig. | 000001 | Include E: no | E: 0% | 000001: 0.113 | Including att. E and excluding att. F is not theoretically defensible. Despite the higher PVAF for att. E, the original q-vector is retained. | 000001 | |
| Sugg. | 000010 | Exclude F: no | F: 100% | 000010: 0.379 | |||
| Orig. | 100001 | Exclude F: no | F: 100% | 100000: 0.908 | Although att. F explains only a small proportion of additional variance; it cannot be excluded from a theoretical perspective. | 100001 | |
| Sugg. | 100000 | 100001: 0.958 | |||||
| Orig. | 110 | Exclude G: no | G: 100% | 010: 0.849 | Att. G should be included from a theoretical perspective and explains some additional variance. | 110 | |
| Sugg. | 010 | 110: 0.999 | |||||
| Orig. | 001 | Include H: yes | H: 0% | 001: 0.180 | Att. H can be included from a theoretical perspective and explains a substantial proportion of variance; therefore, it is included. Although att. I explains only little additional variance, it cannot be excluded from a theoretical perspective. | 011 | |
| Sugg. | 010 | Exclude I: no | I: 50% | 010: 0.885 | |||
| 011: 0.897 | |||||||
References
- Sitzmann, T.; Ely, K. A meta-analysis of self-regulated learning in work-related training and educational attainment: What we know and where we need to go. Psychol. Bull. 2011, 137, 421–442. [Google Scholar] [CrossRef] [PubMed]
- Dunlosky, J.; Rawson, K.A. Overconfidence produces underachievement: Inaccurate self evaluations undermine students’ learning and retention. Learn. Instr. 2012, 22, 271–280. [Google Scholar] [CrossRef]
- Lee, K. Rethinking the accessibility of online higher education: A historical review. Internet High. Educ. 2017, 33, 15–23. [Google Scholar] [CrossRef] [Green Version]
- Gikandi, J.W.; Morrow, D.; Davis, N.E. Online formative assessment in higher education: A review of the literature. Comput. Educ. 2011, 57, 2333–2351. [Google Scholar] [CrossRef]
- Brinkhuis, M.J.S.; Cordes, W.; Hofman, A. Governing games: Adaptive game selection in the Math Garden. ITM Web of Conf. 2020, 33, 03003. [Google Scholar] [CrossRef]
- Quilici, J.L.; Mayer, R.E. Teaching students to recognize structural similarities between statistics word problems. Appl. Cogn. Psychol. Off. J. Soc. Appl. Res. Mem. Cogn. 2002, 16, 325–342. [Google Scholar] [CrossRef]
- Guskey, T.R. The case against percentage grades. Educ. Sch. Couns. Psychol. Fac. Publ. 2013, 71, 68–72. [Google Scholar]
- Leighton, J.P.; Gierl, M.J. Why cognitive diagnostic assessment? In Cognitive Diagnostic Assessment for Education; Leighton, J.P., Gierl, M.J., Eds.; Cambridge University Press: New York, NY, USA, 2007; pp. 3–18. [Google Scholar] [CrossRef]
- Huff, K.; Goodman, D.P. The demand for cognitive diagnostic assessment. In Cognitive Diagnostic Assessment for Education; Leighton, J.P., Gierl, M.J., Eds.; Cambridge University Press: New York, NY, USA, 2007; pp. 19–60. [Google Scholar]
- Kanar, A.M.; Bell, B.S. Guiding learners through technology-based instruction: The effects of adaptive guidance design and individual differences on learning over time. J. Educ. Psychol. 2013, 105, 1067–1081. [Google Scholar] [CrossRef] [Green Version]
- Norris, S.P.; Macnab, J.S.; Phillips, L.M. Cognitive modeling of performance on diagnostic achievement tests: A Philosophical Analysis and Justification. In Cognitive Diagnostic Assessment for Education; Leighton, J.P., Gierl, M.J., Eds.; Cambridge University Press: New York, NY, USA, 2007; pp. 61–84. [Google Scholar] [CrossRef]
- Rupp, A.A.; Templin, J.; Henson, R.A. Diagnostic Measurement: Theory, Methods, and Applications; The Guilford Press: New York, NY, USA, 2010. [Google Scholar]
- Maas, L.; Brinkhuis, M.J.S.; Kester, L.; Wijngaards-de Meij, L. Diagnostic classification models for actionable feedback in education: Effects of sample size and assessment length. Front. Educ. 2022, 7, 36. [Google Scholar] [CrossRef]
- Wiggins, G.; McTighe, J. Understanding by Design; Association for Supervision and Curriculum Development: Alexandria, VA, USA, 2005. [Google Scholar]
- Pellegrino, J.W.; Chudowsky, N.; Glaser, R. Knowing What Students Know: The Science and Design of Educational Assessment; National Academy Press: Washington, DC, USA, 2001. [Google Scholar] [CrossRef]
- Thompson, K.; Yonekura, F. Practical guidelines for learning object granularity from one higher education setting. Interdiscip. J.-Learn. Learn. Objects 2005, 1, 163–179. [Google Scholar] [CrossRef] [Green Version]
- Rupp, A.A.; Templin, J. The effects of Q-matrix misspecification on parameter estimates and classification accuracy in the DINA model. Educ. Psychol. Meas. 2008, 68, 78–96. [Google Scholar] [CrossRef]
- Kunina-Habenicht, O.; Rupp, A.A.; Wilhelm, O. The impact of model misspecification on estimation accuracy in diagnostic classification models. J. Educ. Meas. 2012, 49, 59–81. [Google Scholar] [CrossRef]
- Leighton, J.P.; Gierl, M.J. Verbal reports as data for cognitive diagnostic assessment. In Cognitive Diagnostic Assessment for Education; Leighton, J.P., Gierl, M.J., Eds.; Cambridge University Press: New York, NY, USA, 2007; pp. 146–172. [Google Scholar] [CrossRef]
- Tjoe, H.; de la Torre, J. The identification and validation process of proportional reasoning attributes: An application of a cognitive diagnosis modeling framework. Math. Educ. Res. J. 2014, 26, 237–255. [Google Scholar] [CrossRef]
- Ma, W.; de la Torre, J. An empirical Q-matrix validation method for the sequential generalized DINA model. Br. J. Math. Stat. Psychol. 2020, 73, 142–163. [Google Scholar] [CrossRef]
- Castro Sotos, A.E.; Vanhoof, S.; Van den Noortgate, W.; Onghena, P. Students’ misconceptions of statistical inference: A review of the empirical evidence from research on statistics education. Educ. Res. Rev. 2007, 2, 98–113. [Google Scholar] [CrossRef]
- Garfield, J.B.; Ben-Zvi, D.; Chance, B.; Medina, E.; Roseth, C.; Zieffler, A. Assessment in statistics education. In Developing Students’ Statistical Reasoning; Springer: Berlin, Germany, 2008; pp. 82–114. [Google Scholar] [CrossRef]
- Tacoma, S.; Sosnovsky, S.; Boon, P.; Jeuring, J.; Drijvers, P. The interplay between inspectable student models and didactics of statistics. Digit. Exp. Math. Educ. 2018, 4, 139–162. [Google Scholar] [CrossRef] [Green Version]
- Cui, Y.; Roduta Roberts, M. Validating Student Score Inferences With Person-Fit Statistic and Verbal Reports: A Person-Fit Study for Cognitive Diagnostic Assessment. Educ. Meas. Issues Pract. 2013, 32, 34–42. [Google Scholar] [CrossRef]
- delMas, R. A comparison of mathematical and statistical reasoning. In The Challenge of Developing Statistical Literacy, Reasoning and Thinking; Ben-Zvi, D., Garfield, J.B., Eds.; Springer: Dordrecht, The Netherlands, 2004; pp. 79–95. [Google Scholar] [CrossRef]
- Garfield, J.B.; Ben-Zvi, D. Developing Students’ Statistical Reasoning: Connecting Research and Teaching Practice; Springer Science & Business Media: Berlin, Germany, 2008. [Google Scholar] [CrossRef]
- delMas, R.; Garfield, J.B.; Ooms, A.; Chance, B. Assessing students’ conceptual understanding after a first course in statistics. Stat. Educ. Res. J. 2007, 6, 28–58. [Google Scholar] [CrossRef]
- GAISE. Guidelines for Assessment and Instruction in Statistics Education College Report 2016; American Statistical Association: Alexandria, VA, USA, 2016. [Google Scholar]
- Madison, M.J.; Bradshaw, L. The effects of Q-matrix design on classification accuracy in the log-linear cognitive diagnosis model. Educ. Psychol. Meas. 2015, 75, 491–511. [Google Scholar] [CrossRef] [Green Version]
- Garfield, J.B.; Ben-Zvi, D. Research on statistical literacy, reasoning, and thinking: Issues, challenges, and implications. In The Challenge of Developing Statistical Literacy, Reasoning and Thinking; Ben-Zvi, D., Garfield, J.B., Eds.; Springer: Dordrecht, The Netherlands, 2004; pp. 397–409. [Google Scholar] [CrossRef]
- Garfield, J.B.; Chance, B. Assessment in statistics education: Issues and challenges. Math. Think. Learn. 2000, 2, 99–125. [Google Scholar] [CrossRef] [Green Version]
- Gal, I.; Garfield, J.B. Curricular goals and assessment challenges in statistics education. In The Assessment Challenge in Statistics Education; Gal, I., Garfield, J.B., Eds.; IOS Press: Amsterdam, The Netherlands, 1997; pp. 1–13. [Google Scholar]
- Garfield, J.B. Assessing statistical reasoning. Stat. Educ. Res. J. 2003, 2, 22–38. [Google Scholar] [CrossRef]
- Allen, K. The Statistics Concept Inventory: Development and Analysis of a Cognitive Assessment Instrument in Statistics. Ph.D. Dissertation, University of Oklahoma, Norman, OK, USA, 2006. [Google Scholar]
- Haladyna, T.M.; Downing, S.M.; Rodriguez, M.C. A review of multiple-choice item-writing guidelines for classroom assessment. Appl. Meas. Educ. 2002, 15, 309–333. [Google Scholar] [CrossRef]
- Garfield, J.B.; Franklin, C. Assessment of learning, for learning, and as learning in statistics education. In Teaching Statistics in School Mathematics-Challenges for Teaching and Teacher Education; Batanero, C., Burrill, G., Reading, C., Eds.; Springer: Dordrecht, The Netherlands, 2011; pp. 133–145. [Google Scholar] [CrossRef]
- Kirilenko, A.P.; Stepchenkova, S. Inter-coder agreement in one-to-many classification: Fuzzy kappa. PLoS ONE 2016, 11, e0149787. [Google Scholar] [CrossRef]
- Ericsson, K.A.; Simon, H.A. How to study thinking in everyday life: Contrasting think-aloud protocols with descriptions and explanations of thinking. Mind Cult. Act. 1998, 5, 178–186. [Google Scholar] [CrossRef]
- Gu, Y.; Xu, G. Sufficient and Necessary Conditions for the Identifiability of the Q-matrix. Stat. Sin. 2021, 31, 449–472. [Google Scholar] [CrossRef]
- R Core Team. R: A Language and Environment for Statistical Computing; R Foundation for Statistical Computing: Vienna, Austria, 2019. [Google Scholar]
- Chen, W.H.; Thissen, D. Local dependence indexes for item pairs using item response theory. J. Educ. Behav. Stat. 1997, 22, 265–289. [Google Scholar] [CrossRef]
- Holm, S. A simple sequentially rejective multiple test procedure. Scand. J. Stat. 1979, 6, 65–70. [Google Scholar]
- de la Torre, J.; Lee, Y.S. Evaluating the Wald test for item-level comparison of saturated and reduced models in cognitive diagnosis. J. Educ. Meas. 2013, 50, 355–373. [Google Scholar] [CrossRef]
- Ma, W.; Iaconangelo, C.; de la Torre, J. Model similarity, model selection, and attribute classification. Appl. Psychol. Meas. 2016, 40, 200–217. [Google Scholar] [CrossRef]
- Maydeu-Olivares, A.; Joe, H. Limited information goodness-of-fit testing in multidimensional contingency tables. Psychometrika 2006, 71, 713. [Google Scholar] [CrossRef]
- Maydeu-Olivares, A.; Joe, H. Assessing approximate fit in categorical data analysis. Multivar. Behav. Res. 2014, 49, 305–328. [Google Scholar] [CrossRef]
- Chen, J.; de la Torre, J.; Zhang, Z. Relative and absolute fit evaluation in cognitive diagnosis modeling. J. Educ. Meas. 2013, 50, 123–140. [Google Scholar] [CrossRef]
- Wang, W.; Song, L.; Chen, P.; Meng, Y.; Ding, S. Attribute-level and pattern-level classification consistency and accuracy indices for cognitive diagnostic assessment. J. Educ. Meas. 2015, 52, 457–476. [Google Scholar] [CrossRef]
- Templin, J.; Bradshaw, L. Measuring the reliability of diagnostic classification model examinee estimates. J. Classif. 2013, 30, 251–275. [Google Scholar] [CrossRef]
- Haertel, E.H. Using restricted latent class models to map the skill structure of achievement items. J. Educ. Meas. 1989, 26, 301–321. [Google Scholar] [CrossRef]
- Templin, J.; Henson, R.A. Measurement of psychological disorders using cognitive diagnosis models. Psychol. Methods 2006, 11, 287. [Google Scholar] [CrossRef] [Green Version]
- de la Torre, J. The generalized DINA model framework. Psychometrika 2011, 76, 179–199. [Google Scholar] [CrossRef]
- Maris, E. Estimating multiple classification latent class models. Psychometrika 1999, 64, 187–212. [Google Scholar] [CrossRef]
- DiBello, L.V.; Stout, W.F.; Roussos, L.A. Unified cognitive/psychometric diagnostic assessment likelihood-based classification techniques. In Cognitively Diagnostic Assessment; Nichols, P.D., Chipman, S.F., Brennan, R.L., Eds.; Erlbaum: Hillsdale, NJ, USA, 1995; pp. 361–390. [Google Scholar]
- Liu, Y.; Tian, W.; Xin, T. An application of M2 statistic to evaluate the fit of cognitive diagnostic models. J. Educ. Behav. Stat. 2016, 41, 3–26. [Google Scholar] [CrossRef]
- Liu, R.; Huggins-Manley, A.C.; Bulut, O. Retrofitting diagnostic classification models to responses from IRT-based assessment forms. Educ. Psychol. Meas. 2018, 78, 357–383. [Google Scholar] [CrossRef]
- Bradshaw, L.; Levy, R. Interpreting probabilistic classifications from diagnostic psychometric models. Educ. Meas. Issues Pract. 2019, 38, 79–88. [Google Scholar] [CrossRef]
- Aljohani, N.R.; Davis, H.C. Learning analytics and formative assessment to provide immediate detailed feedback using a student centered mobile dashboard. In Proceedings of the 2013 Seventh International Conference on Next Generation Mobile Apps, Services and Technologies, Prague, Czech Republic, 25–27 September 2013; pp. 262–267. [Google Scholar] [CrossRef] [Green Version]
- Verbert, K.; Govaerts, S.; Duval, E.; Santos, J.L.; Van Assche, F.; Parra, G.; Klerkx, J. Learning dashboards: An overview and future research opportunities. Pers. Ubiquitous Comput. 2014, 18, 1499–1514. [Google Scholar] [CrossRef] [Green Version]
- Roduta Roberts, M.; Gierl, M.J. Developing score reports for cognitive diagnostic assessments. Educ. Meas. Issues Pract. 2010, 29, 25–38. [Google Scholar] [CrossRef]
- de la Torre, J.; Minchen, N. Cognitively diagnostic assessments and the cognitive diagnosis model framework. Psicol. Educ. 2014, 20, 89–97. [Google Scholar] [CrossRef] [Green Version]
- Bennett, R.E. Formative assessment: A critical review. Assess. Educ. Princ. Policy Pract. 2011, 18, 5–25. [Google Scholar] [CrossRef]
- Gotch, C.M.; Roduta Roberts, M. A review of recent research on individual-level score reports. Educ. Meas. Issues Pract. 2018, 37, 46–54. [Google Scholar] [CrossRef]
- Roelle, J.; Berthold, K.; Fries, S. Effects of feedback on learning strategies in learning journals: Learner-expertise matters. In Virtual Learning Environments: Concepts, Methodologies, Tools and Applications; Khosrow-Pour, M., Ed.; IGI Global: Hershey, PA, USA, 2012; pp. 710–725. [Google Scholar] [CrossRef]
- Clarebout, G.; Horz, H.; Schnotz, W.; Elen, J. The relation between self-regulation and the embedding of support in learning environments. Educ. Technol. Res. Dev. 2010, 58, 573–587. [Google Scholar] [CrossRef]
- Leighton, J.P. Rethinking think-alouds: The often-problematic collection of response process data. Appl. Meas. Educ. 2021, 34, 61–74. [Google Scholar] [CrossRef]
- DeMars, C.E.; Wise, S.L. Can differential rapid-guessing behavior lead to differential item functioning? Int. J. Test. 2010, 10, 207–229. [Google Scholar] [CrossRef]
- Bradshaw, L.; Madison, M.J. Invariance properties for general diagnostic classification models. Int. J. Test. 2016, 16, 99–118. [Google Scholar] [CrossRef]
- Brinkhuis, M.J.S.; Maris, G. Tracking Ability: Defining Trackers for Measuring Educational Progress. In Theoretical and Practical Advances in Computer-Based Educational Measurement; Veldkamp, B.P., Sluijter, C., Eds.; Methodology of Educational Measurement and Assessment; Springer International Publishing: Cham, Switzerland, 2019; Chapter 8; pp. 161–173. [Google Scholar]
- Kane, M.T. Validating the interpretations and uses of test scores. J. Educ. Meas. 2013, 50, 1–73. [Google Scholar] [CrossRef]
- Hopster-den Otter, D.; Wools, S.; Eggen, T.J.; Veldkamp, B.P. A general framework for the validation of embedded formative assessment. J. Educ. Meas. 2019, 56, 715–732. [Google Scholar] [CrossRef]
- delMas, R.; Liu, Y. Exploring students’ conceptions of the standard deviation. Stat. Educ. Res. J. 2005, 4, 55–82. [Google Scholar] [CrossRef]
- Bakker, A.; Gravemeijer, K.P.E. Learning to reason about distribution. In The Challenge of Developing Statistical Literacy, Reasoning and Thinking; Ben-Zvi, D., Garfield, J.B., Eds.; Springer: Dordrecht, The Netherlands, 2004; pp. 147–168. [Google Scholar]
- Konold, C.; Pollatsek, A.; Well, A.; Gagnon, A. Students analyzing data: Research of critical barriers. In Research on the Role of Technology in Teaching and Learning Statistics; Springer: Dordrecht, The Netherlands, 1997; pp. 151–167. [Google Scholar]
- Garfield, J.B. The challenge of developing statistical reasoning. J. Stat. Educ. 2002, 10. [Google Scholar] [CrossRef]
- Tversky, A.; Kahneman, D. Belief in the law of small numbers. Psychol. Bull. 1971, 76, 105. [Google Scholar] [CrossRef] [Green Version]
- Schuyten, G. Statistical thinking in psychology and education. In Proceedings of the 3rd International Conference on Teaching Statistics: Vol. 2. Teaching Statistics Beyond School Level; Vere-Jones, D., Ed.; ISI Publications in Statistical Education: Dunedin, New Zealand, 1991; pp. 486–490. [Google Scholar]
- Chance, B.; delMas, R.; Garfield, J.B. Reasoning about sampling distribitions. In The Challenge of Developing Statistical Literacy, Reasoning and Thinking; Ben-Zvi, D., Garfield, J.B., Eds.; Springer: Dordrecht, The Netherlands, 2004; pp. 295–323. [Google Scholar]
- Lipson, K. The role of computer based technology in developing understanding of the concept of sampling distribution. In Proceedings of the 6th International Conference on Teaching Statistics, Cape Town, South Africa, 7–12 July 2002. [Google Scholar]
- Batanero, C.; Tauber, L.M.; Sánchez, V. Students’ reasoning about the normal distribution. In The Challenge of Developing Statistical Literacy, Reasoning and Thinking; Ben-Zvi, D., Garfield, J.B., Eds.; Springer: Dordrecht, The Netherlands, 2004; pp. 257–276. [Google Scholar] [CrossRef]
- Bower, K.M. Some Misconceptions about the Normal Distribution; Six Sigma Forum; American Society for Quality: Milwaukee, WI, USA, 2003. [Google Scholar]
- Batanero, C.; Godino, J.D.; Vallecillos, A.; Green, D.e.; Holmes, P. Errors and difficulties in understanding elementary statistical concepts. Int. J. Math. Educ. Sci. Technol. 1994, 25, 527–547. [Google Scholar] [CrossRef]
- Vallecillos, A. Understanding of the logic of hypothesis testing amongst university students. J.-Math.-Didakt. 2000, 21, 101–123. [Google Scholar] [CrossRef]
- Falk, R.; Greenbaum, C.W. Significance tests die hard: The amazing persistence of a probabilistic misconception. Theory Psychol. 1995, 5, 75–98. [Google Scholar] [CrossRef]
- Perezgonzalez, J.D. Fisher, Neyman-Pearson or NHST? A tutorial for teaching data testing. Front. Psychol. 2015, 6, 223. [Google Scholar] [CrossRef] [Green Version]
- Haller, H.; Krauss, S. Misinterpretations of significance: A problem students share with their teachers. Methods Psychol. Res. 2002, 7, 1–20. [Google Scholar]
- Falk, R. Misconceptions of statistical significance. J. Struct. Learn. 1986, 9, 83–96. [Google Scholar]
- Vallecillos, A.; Batanero, C. Conceptos activados en el contraste de hipótesis estadísticas y su comprensión por estudiantes universitarios [Activated concepts in statistical hypothesis testing and their understanding by university students]. Rech. Didact. Math. 1997, 17, 29–48. [Google Scholar]
- Williams, A.M. Students’ understanding of the significance level concept. In Proceedings of the 5th International Conference on Teaching Statistics, Singapore, 21–26 June 1998; pp. 743–749. [Google Scholar]
- Mittag, K.C.; Thompson, B. Research news and Comment: A National Survey of AERA Members’ Perceptions of Statistical Significance Tests and Other Statistical Issues. Educ. Res. 2000, 29, 14–20. [Google Scholar] [CrossRef]
- Gliner, J.A.; Leech, N.L.; Morgan, G.A. Problems with null hypothesis significance testing (NHST): What do the textbooks say? J. Exp. Educ. 2002, 71, 83–92. [Google Scholar] [CrossRef]
- Gagnier, J.J.; Morgenstern, H. Misconceptions, misuses, and misinterpretations of p values and significance testing. J. Bone Jt. Surg. 2017, 99, 1598–1603. [Google Scholar] [CrossRef]
- Cumming, G.; Williams, J.; Fidler, F. Replication and researchers’ understanding of confidence intervals and standard error bars. Underst. Stat. 2004, 3, 299–311. [Google Scholar] [CrossRef]
- Fidler, F. Should psychology abandon p-values and teach CIs instead? Evidence-based reforms in statistics education. In Proceedings of the 7th International Conference on Teaching Statistics, Salvador, Brazil, 2–7 July 2006. [Google Scholar]
- Hoekstra, R.; Morey, R.D.; Rouder, J.N.; Wagenmakers, E.J. Robust misinterpretation of confidence intervals. Psychon. Bull. Rev. 2014, 21, 1157–1164. [Google Scholar] [CrossRef]
- Kalinowski, P. Identifying misconceptions about confidence intervals. In Proceedings of the 8th International Conference on Teaching Statistics, Ljubljana, Slovenia, 11–16 July 2010. [Google Scholar]
- Belia, S.; Fidler, F.; Williams, J.; Cumming, G. Researchers misunderstand confidence intervals and standard error bars. Psychol. Methods 2005, 10, 389. [Google Scholar] [CrossRef] [Green Version]

| A. | Understanding center & spread |
| B. | Interpreting univariate graphical representations |
| C. | Graphically comparing groups |
| D. | Understanding sampling variability |
| E. | Understanding sampling distributions |
| F. | Understanding the standard error |
| G. | Understanding principles of hypothesis testing |
| H. | Evaluating NHST results |
| I. | Understanding and using confidence intervals |
| Item | Att. A | Att. B | Att. C | Att. D | Att. E | Att. F | Att. G | Att. H | Att. I | n |
|---|---|---|---|---|---|---|---|---|---|---|
| ARTIST_sc_MS_05 | 67% | - | - | - | - | - | - | - | - | 3 |
| ARTIST_sc_MS_01 | 100% | - | - | - | - | - | - | - | - | 4 |
| ARTIST_sc_MC_05 | 100% | - | - | - | - | - | - | - | - | 4 |
| ARTIST_sc_MC_06 | 100% | - | - | - | - | - | - | - | - | 4 |
| ARTIST_db_MS_Q0490 | 100% | - | - | - | - | - | - | - | - | 4 |
| CAOS_14 | 100% | 100% | - | - | - | - | - | - | - | 4 |
| CAOS_15 | 100% | 100% | - | - | - | - | - | - | - | 4 |
| CAOS_08 | 67% | 100% | - | - | - | - | - | - | - | 3 |
| CAOS_09 | 67% | 100% | - | - | - | - | - | - | - | 3 |
| CAOS_10 | 100% | 100% | - | - | - | - | - | - | - | 3 |
| CAOS_11 | - | 67% | 100% | - | - | - | - | - | - | 3 |
| CAOS_12 | - | 100% | 100% | - | - | - | - | - | - | 3 |
| CAOS_13 | - | - | - | - | - | - | - | - | - | 3 |
| SRA_015 | - | 75% | 100% | - | - | - | - | 25% | - | 4 |
| ARTIST_db_CG_Q0840 | 50% | 100% | 100% | - | - | - | - | - | - | 4 |
| ARTIST_sc_SV_01 | - | 67% | - | 33% | 33% | - | - | - | - | 3 |
| CAOS_17 | - | - | - | 100% | - | - | - | - | - | 4 |
| ARTIST_sc_SV_03 | - | - | - | 100% | - | 100% | - | - | - | 4 |
| ARTIST_sc_SV_14 | 67% | - | - | 100% | - | 33% | - | - | - | 3 |
| ARTIST_sc_SV_04 | - | - | - | 60% | 100% | - | - | - | - | 5 |
| ARTIST_sc_SV_10 | - | - | - | - | 100% | - | - | - | - | 4 |
| ARTIST_sc_SV_11 | - | - | - | 25% | 100% | 50% | - | - | - | 4 |
| ARTIST_sc_SV_09 | - | 50% | - | 50% | 100% | 50% | - | - | - | 4 |
| ARTIST_db_SS_Q0061A | - | - | - | 50% | 100% | - | - | - | - | 4 |
| ARTIST_db_SS_Q0061B | - | - | - | - | 100% | 25% | - | - | - | 4 |
| ARTIST_db_SS_Q0061C | - | - | - | - | 100% | 25% | - | - | - | 4 |
| ARTIST_db_SS_Q0061D | - | - | - | - | 100% | 25% | - | - | - | 4 |
| ARTIST_db_SS_Q0061E | 50% | - | - | - | 75% | 100% | - | - | - | 4 |
| ARTIST_sc_SV_05 | - | - | - | 50% | 100% | - | - | - | - | 4 |
| CAOS_16 | - | - | - | 100% | - | 100% | - | - | - | 4 |
| CAOS_32 | 20% | - | - | 40% | - | 100% | - | - | - | 5 |
| SCI_2004_20 | 100% | - | - | 75% | - | 100% | - | - | - | 4 |
| GRASPLE_DP_SE_40985 | - | - | - | - | - | 100% | - | - | - | 3 |
| ARTIST_db_SS_Q1437 | - | - | - | - | - | 67% | - | - | - | 3 |
| ARTIST_db_SS_Q0614 | - | - | - | - | - | 100% | - | - | - | 3 |
| CAOS_40 | - | - | - | - | - | - | 100% | 60% | - | 5 |
| ARTIST_sc_TS_01 | - | - | - | - | - | - | 100% | - | - | 4 |
| ARTIST_db_TSG_Q1182 | - | - | - | - | - | - | 100% | 25% | - | 4 |
| CAOS_23 | - | - | - | - | - | 25% | 100% | 75% | - | 4 |
| CAOS_24 | - | - | - | - | - | - | 100% | 25% | - | 4 |
| ARTIST_db_TSG_Q1392 | - | - | - | - | - | - | - | 60% | - | 5 |
| CAOS_25 | - | - | - | - | - | - | - | 75% | - | 4 |
| CAOS_26 | - | - | - | - | - | - | - | 100% | - | 4 |
| CAOS_27 | - | - | - | - | - | - | - | 100% | - | 4 |
| ARTIST_sc_TS_04 | - | - | - | - | - | - | 100% | 50% | - | 4 |
| ARTIST_sc_TS_10 | - | - | - | - | - | - | 100% | 100% | - | 4 |
| ARTIST_sc_TS_07 | 33% | - | - | 33% | - | - | 33% | 100% | - | 3 |
| ARTIST_sc_TS_09 | - | - | - | - | - | - | 75% | 100% | - | 4 |
| SCI_2004_22 | - | - | - | - | - | - | - | 100% | - | 3 |
| ARTIST_db_TSG_Q1007 | - | - | - | - | - | 25% | 25% | 50% | - | 4 |
| ARTIST_sc_CI_05 | - | - | - | 25% | - | - | - | - | 75% | 4 |
| ARTIST_sc_CI_03 | - | - | - | - | - | - | - | - | 67% | 3 |
| ARTIST_sc_CI_02 | - | - | - | - | - | - | - | - | 75% | 4 |
| ARTIST_sc_CI_01 | - | - | - | - | - | - | - | - | 100% | 3 |
| ARTIST_sc_CI_07 | - | - | - | - | - | - | - | - | 100% | 3 |
| ARTIST_sc_CI_06 | - | - | - | - | - | - | - | - | 67% | 3 |
| ARTIST_sc_CI_10 | - | - | - | - | - | - | - | - | 100% | 3 |
| ARTIST_db_CIOSM_Q1394 | - | - | - | - | - | - | 25% | - | 50% | 4 |
| ARTIST_db_CIOSM_Q1387 | - | - | - | - | - | - | - | - | 100% | 3 |
| Assessment 1 | Attribute | Reduced | Assessment 2 | Attribute | Reduced | |||||||
|---|---|---|---|---|---|---|---|---|---|---|---|---|
| Item | A | B | C | D | E | F | Model | Item | G | H | I | Model |
| ARTIST_sc_MS_05 | 1 | 0 | 0 | 0 | 0 | 0 | - | CAOS_40 | 1 | 0 | 0 | - |
| ARTIST_sc_MS_01 | 1 | 0 | 0 | 0 | 0 | 0 | - | ARTIST_sc_TS_01 | 1 | 0 | 0 | - |
| ARTIST_sc_MC_05 | 1 | 0 | 0 | 0 | 0 | 0 | - | ARTIST_db_TSG_Q1182 | 1 | 0 | 0 | - |
| ARTIST_sc_MC_06 | 1 | 0 | 0 | 0 | 0 | 0 | - | CAOS_24 | 1 | 0 | 0 | - |
| ARTIST_db_MS_Q0490 | 1 | 0 | 0 | 0 | 0 | 0 | - | ARTIST_db_TSG_Q1392 | 0 | 1 | 0 | - |
| CAOS_14 | 1 | 1 | 0 | 0 | 0 | 0 | DINA | CAOS_25 | 0 | 1 | 0 | - |
| CAOS_15 | 1 | 1 | 0 | 0 | 0 | 0 | DINA | CAOS_26 | 0 | 1 | 0 | - |
| CAOS_08 | 1 | 1 | 0 | 0 | 0 | 0 | DINA | ARTIST_sc_TS_04 | 1 | 1 | 0 | DINA |
| CAOS_09 | 0 | 1 | 0 | 0 | 0 | 0 | - | ARTIST_sc_TS_10 | 0 | 1 | 0 | - |
| CAOS_10 | 1 | 1 | 0 | 0 | 0 | 0 | LLM | ARTIST_sc_TS_07 | 0 | 1 | 0 | - |
| CAOS_12 | 0 | 1 | 1 | 0 | 0 | 0 | R-RUM | ARTIST_sc_TS_09 | 0 | 1 | 0 | - |
| CAOS_13 | 0 | 0 | 1 | 0 | 0 | 0 | - | SCI_2004_22 | 0 | 1 | 0 | - |
| SRA_015 | 0 | 1 | 1 | 0 | 0 | 0 | R-RUM | ARTIST_db_TSG_Q1007 | 0 | 1 | 0 | - |
| ARTIST_db_CG_Q0840 | 0 | 1 | 1 | 0 | 0 | 0 | R-RUM | ARTIST_sc_CI_05 | 0 | 0 | 1 | - |
| ARTIST_sc_SV_01 | 0 | 1 | 0 | 0 | 1 | 0 | DINA | ARTIST_sc_CI_02 | 0 | 0 | 1 | - |
| CAOS_17 | 0 | 0 | 0 | 1 | 0 | 0 | - | ARTIST_sc_CI_01 | 0 | 0 | 1 | - |
| ARTIST_sc_SV_03 | 0 | 0 | 0 | 1 | 0 | 1 | LLM | ARTIST_sc_CI_07 | 0 | 0 | 1 | - |
| ARTIST_sc_SV_14 | 0 | 0 | 0 | 1 | 0 | 0 | - | ARTIST_sc_CI_06 | 0 | 0 | 1 | - |
| ARTIST_sc_SV_04 | 0 | 0 | 0 | 1 | 0 | 0 | - | ARTIST_sc_CI_10 | 0 | 0 | 1 | - |
| ARTIST_sc_SV_10 | 0 | 0 | 0 | 0 | 1 | 0 | - | ARTIST_db_CIOSM_Q1394 | 0 | 1 | 1 | DINA |
| ARTIST_sc_SV_11 | 0 | 0 | 0 | 0 | 1 | 1 | A-CDM | ARTIST_db_CIOSM_Q1387 | 0 | 0 | 1 | - |
| ARTIST_sc_SV_09 | 0 | 0 | 0 | 0 | 1 | 1 | R-RUM | |||||
| ARTIST_db_SS_Q0061A | 0 | 0 | 0 | 0 | 1 | 0 | - | |||||
| ARTIST_db_SS_Q0061B | 0 | 0 | 0 | 0 | 1 | 0 | - | |||||
| ARTIST_db_SS_Q0061C | 0 | 0 | 0 | 0 | 1 | 0 | - | |||||
| ARTIST_db_SS_Q0061D | 0 | 0 | 0 | 0 | 1 | 0 | - | |||||
| ARTIST_sc_SV_05 | 0 | 0 | 0 | 0 | 1 | 0 | - | |||||
| CAOS_16 | 0 | 0 | 0 | 1 | 0 | 1 | LLM | |||||
| CAOS_32 | 0 | 0 | 0 | 0 | 0 | 1 | - | |||||
| SCI_2004_20 | 1 | 0 | 0 | 0 | 0 | 1 | LLM | |||||
| ARTIST_db_SS_Q1437 | 0 | 0 | 0 | 0 | 0 | 1 | - | |||||
| ARTIST_db_SS_Q0614 | 0 | 0 | 0 | 0 | 0 | 1 | - | |||||
| RMSEA | SRMSR | Max Transformed Correlation * | Max Log-Odds Ratio * | ||
|---|---|---|---|---|---|
| Assessment 1 | 591.4 () | 0.025 | 0.042 | 0.128 () | 0.982 () |
| Assessment 2 | 212.1 () | 0.014 | 0.038 | 0.104 () | 0.850 () |
| Assessment 1 | Assessment 2 | ||||||||
|---|---|---|---|---|---|---|---|---|---|
| Attribute | A | B | C | D | E | F | G | H | I |
| Accuracy | 0.89 | 0.83 | 0.90 | 0.89 | 0.82 | 0.82 | 0.82 | 0.84 | 0.88 |
| Reliability | 0.87 | 0.69 | 0.89 | 0.87 | 0.68 | 0.67 | 0.67 | 0.76 | 0.85 |
Publisher’s Note: MDPI stays neutral with regard to jurisdictional claims in published maps and institutional affiliations. |
© 2022 by the authors. Licensee MDPI, Basel, Switzerland. This article is an open access article distributed under the terms and conditions of the Creative Commons Attribution (CC BY) license (https://creativecommons.org/licenses/by/4.0/).
Share and Cite
Maas, L.; Brinkhuis, M.J.S.; Kester, L.; Wijngaards-de Meij, L. Cognitive Diagnostic Assessment in University Statistics Education: Valid and Reliable Skill Measurement for Actionable Feedback Using Learning Dashboards. Appl. Sci. 2022, 12, 4809. https://doi.org/10.3390/app12104809
Maas L, Brinkhuis MJS, Kester L, Wijngaards-de Meij L. Cognitive Diagnostic Assessment in University Statistics Education: Valid and Reliable Skill Measurement for Actionable Feedback Using Learning Dashboards. Applied Sciences. 2022; 12(10):4809. https://doi.org/10.3390/app12104809
Chicago/Turabian StyleMaas, Lientje, Matthieu J. S. Brinkhuis, Liesbeth Kester, and Leoniek Wijngaards-de Meij. 2022. "Cognitive Diagnostic Assessment in University Statistics Education: Valid and Reliable Skill Measurement for Actionable Feedback Using Learning Dashboards" Applied Sciences 12, no. 10: 4809. https://doi.org/10.3390/app12104809
APA StyleMaas, L., Brinkhuis, M. J. S., Kester, L., & Wijngaards-de Meij, L. (2022). Cognitive Diagnostic Assessment in University Statistics Education: Valid and Reliable Skill Measurement for Actionable Feedback Using Learning Dashboards. Applied Sciences, 12(10), 4809. https://doi.org/10.3390/app12104809