Abstract
Following the paradigm shift in the pharmaceutical industry from batch to continuous production, additional instrumentation and revision of control strategies to optimize material flow throughout the downstream processes are required. Tableting manufacturing is one of the most productive in terms of turnover and investment into new sensor technologies is an important decision-making step. This paper proposes a continuous solution to detect changes in material properties, and a control algorithm to aid in minimizing risk at the end-product line. Some of the sub-processes involved in tableting manufacturing perform changes in powder and liquid mixtures, granulation, density, therefore changing flow conditions of the raw material. Using impedance spectroscopy in a continuous sensing and monitoring context, it is possible to perform online identification of generalized (fractional) order parametric models where the coefficients are correlated to changes in material properties. The model parameters are then included in a self-tuning control gain used in ratio control as part of the local process control loop. The solution proposed here is easy to implement and poses a significant added value to the current state of art in pharmaceutical manufacturing technologies.
1. Introduction
A core challenge of Industry 4.0 is the demand for versatile manufacturing that can cope with material availability and variability, which is relevant to the field of personalized medicine goals [1]. Recent advances in technology and instrumentation have pushed forward the transition from batch to continuous process control in the pharmaceutical industry [2,3]. One of the main advantages of continuous manufacturing is that it enables demand-driven scaling of production volume and product specifications. As a sensing technology, impedance spectroscopy is a powerful instrument with significant added value in optimizing control of manufacturing industries [4,5].
The tableting industry has the highest production volume and thus changes in the manufacturing process have a significant impact on the overall production costs. The gold standard in pharmaceutical manufacturing of oral solid dosage forms is still batch-wise production [6]. In the fields of automotive, food, and petrochemical industries continuous manufacturing has been successfully implemented and has resulted in improved productivity and reduced costs in comparison to batch production [6].
However, the appearance of changes in raw material properties, equipment status with respect to physical wear and varying material properties along the production lines contribute to time-varying disturbances which in turn demand continuous corrective actions during production [7]. Delayed corrective measures (i.e., end of the batch line) and sub-optimal controller settings lead to sub-standard quality of end-product and consequently cost-related economic losses.
Some of the commonly encountered sub-unit processes in tablet manufacturing are: direct compaction, dry granulation, wet granulation, extrusion, granule lubrication, tablet pressing, coating, splitting, etc. [8]. The material mixtures are essentially non-Newtonian in terms of fluid properties and classical characterization through modeling no longer captures the essential properties [9]. Moreover, the models tend to be computationally demanding and not suitable for real-time parametric estimations. Fast and slow anomalous transport phenomena can be described by time-fractional diffusion equations of fractional order. These are commonly encountered in media with fractal, porous, or combined properties. The material used for making a tablet varies in its density and geometry as it transits a set of physical states: liquid, powder, granules, etc. When describing nonlinear transport phenomena such as anomalous diffusion of mixed materials, one must also account for memory effects, which are typically arising as a non-Brownian random walk motion Equation [10,11]. These are linked to density variations of non-Newtonian fluids, an initial state of material incipient properties in the pharmaceutical industry. Lumped parameter models of generalized (fractional) orders have been shown to be excellent tools in detecting and quantifying changes in material flow density from impedance spectroscopy data [9,12].
Furthermore, anomalous diffusion in porous media, e.g., granulated materials, is important as it enables to increase the effectiveness of various processes, such as absorption, catalysis, etc, by controlling the regime of mass flow transport. The diffusion coefficient representing the speed of molecule transitions has a strong dependence on porosity [13,14,15]. Surface area and pore volume are key properties and the direct result of the controlled environment of pharmaceutical products and one of the main sub-processes in tablet manufacturing.
A tablet comprises a mixture of active substances and excipients, usually in powder form, pressed or compacted from a powder, through mixed liquid into a solid dose. The excipients can include diluents, binders or granulating agents, flow aids and lubricants to ensure efficient tableting. A polymer coating is often applied to make the tablet smoother and easier to swallow, to control the release rate of the active ingredient, to make it more resistant to the environment (extending its shelf life), or to enhance its appearance. In short, the production thereof is a complex multivariable process and (intermediate) material properties variability can have important implications on the efficiency of the production process (e.g., changes in powder stickiness or mixture viscosity). Hence optimal control of production efficiency and product properties are essential to guarantee a manufacturing process that is adaptive while maintaining (semi-)finite product quality at all times [16,17].
In this paper, we propose a theoretical framework to characterize material properties in non-Newtonian fluids and anomalous diffusion in porous materials. This original and innovative approach allows using lumped fractional order parametric models for online estimations of material properties which in turn enable a self-tuning function for ratio control of material flows. While the concepts are generically applicable to other domains such as food and chemical industries, the particular application discussed in this work is the wet/dry granulation tableting process in the pharmaceutical industry.
The paper is structured as follows. A theoretical background is given in the next section on the anomalous diffusion of species. This is followed by a summary of the use of impedance spectroscopy as a sensing tool. Next, afferent generalized parametric models are proposed capturing variations in material properties related to anomalous diffusion. The third section refers to the potential application to ratio control and a conclusion section summarizes the main outcome of this work.
2. Materials and Methods
2.1. Anomalous Diffusion
Diffusion kinetics in porous media is described by the second Fick’s law:
where C is the linear concentration of diffusion species in mole/m; D is the diffusion coefficient in porous media in m/s, t is time in seconds and x is the spatial coordinate in metres. For time-fractional diffusion, a temporal derivative becomes a time-fractional derivative of order , accounting for sub-diffusion () and for supra-diffusion () dynamics:
where K denotes fractional diffusion coefficient in units ms. A direct consequence of these time-fractional units in media is the intrinsic characterization of memory effects such as in non-Newtonian fluids [9] and viscoelastic materials, polymers and biological tissues [10]. The analytical solution can be obtained applying the Caputo definition of the time-fractional derivative:
with for sub-diffusion and for supra-diffusion, and is the Euler gamma function.
Applying spatial Fourier and temporal Laplace transform to (2) provides the space-time fractional diffusion Equation [18]:
with . Using the Mittag–Leffler function
and inverse Laplace transform gives
which enables to characterize short and long time diffusion patterns separately through approximations:
and
respectively.
If mass transfer in the diffusion molecule is described using (1), we can impose initial condition and boundary condition . The flow of diffusing species leaving the porous grain is defined as the difference between the concentration in the grain in mole/m and the linear concentration C at the longitudinal size of the grain L. Notice that extrapolation to granular flow mass becomes the concentration at the sensing site. The boundary condition at site is given by:
as a function of A the transversal area of the grain in m, and linear diffusion velocity coefficient in m/s. Mass balance relation is:
with V grain volume in m and v is volumetric flow of species diffusion in m/s.
The asymptotic solution using Green function for normal diffusion is given by:
and is linearized in logarithmic coordinates for short time as - and for long time as -t. The relation between normal to time-fractional diffusion analytical solution is derived in [13,14,15]. The time-fractional diffusion equation for short times is
and for long times is
Diffusion transport phenomena can be thus fitted using these equations on experimental data as time varying property of the material.
Consider a material transiting as a granular flow. The diffusion of species will depend on material properties and follow the Stokes–Einstein relation [19]:
where is the Boltzman constant in kgm/Ks, is viscosity in kg/ms, T is the absolute temperature in Kelvin and r the radius in m of the granular sphere or its approximation as a sphere. Diffusion depends on size and geometry (shape) of the grain as well as the viscosity of the material in flow conditions. For a sphere, its surface is given by and its volume by . Under the conditions of a variable r, the efficacy of diffusion is given by the ratio:
This relation suggests that the diffusion efficacy decreases with the increase of sphere size.
2.2. Measuring Impedance in Non–Newtonian Materials
From seminal [20] to more recent developments [21,22], emerging concepts of fractional calculus enabled modeling non-Newtonian flow dynamic properties in a computationally attractive framework [23]. Electrochemical properties of materials have been successfully characterized with impedance spectroscopy and frequency response models [12,24]. Impedance spectroscopy was also used to capture time-varying non-Newtonian fluid properties by means of frequency-domain fractional order models [9].
A comprehensive summary of classes of non-Newtonian fluid properties is given in [9]. From the time-dependent properties, the most important one when closed-loop control is envisaged is the fluid (mixture) density variability. This is of particular importance in mixtures based on feedforward and ratio control structures [25,26].
2.2.1. Impedance Spectroscopy
When non–Newtonian fluids are treated as electrochemical systems, they can be studied from impedance measurement data [4,5,12]. The measurement involves the application of a small perturbation, alternatively to classical identification methods based on linear sweep or potential step which perturbs the nonlinear dynamics far from a piecewise linear equilibrium. A small imposed perturbation can be of applied potential, of applied current or, with hydrodynamic electrodes of convection rate. The fact that the perturbation is small brings advantages in terms of the solution of the relevant mathematical equations, i.e., the systems behave piecewise linear time-invariant systems with the relative simplifying assumptions when applying frequency domain analysis [12]. The response to the applied perturbation, which is generally sinusoidal, can differ in phase and amplitude from the applied signal. Measurement of the phase difference and the amplitude, i.e., the impedance, permits analysis of the electrode process in relation to contributions from diffusion, kinetics, Debye effects, coupled homogeneous reactions, etc. [27,28].
The main flowchart of the procedure used in this work, called Phase-sensitive detectors and transfer function analysers, is showed in Figure 1. The detector compares the signal applied to the system and its response, giving the phase difference and the ratio of the amplitudes. In our case the reference signal is applied by means of a potentiostat (PSTAT) and then through the frequency response analyser (FRA) the actual measurement of the impedance can be carried out, processed and cleaned. When used in online estimation mode, the high frequency sampling raw data recordings are downloaded on a computer where a spectral analysis algorithm estimates time and frequency domain response for further use such as parametric modeling. The user-defined range of test frequencies is relatively wide, i.e., from Hz to MHz.
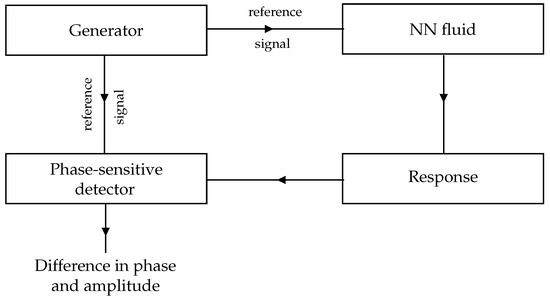
Figure 1.
Generic principle of a phase-sensitive detector functionality.
2.2.2. An Example: Randle’s Circuit
Any electrochemical cell can be represented in terms of an equivalent electrical circuit that comprises a combination of resistances and capacitances (inductances only for very high frequencies) [4,5]. This circuit should contain at the very least components to represent:
- The double material layer: a pure capacitor of capacity ,
- The impedance of the faradaic process ,
- The uncompensated resistance, , which is usually the solution resistance between working and reference electrodes.
The textbook combination of these elements is shown in Figure 2 and known as Randle’s circuit, with and in parallel arrangement. The impedance can be further subdivided in two equivalent ways:
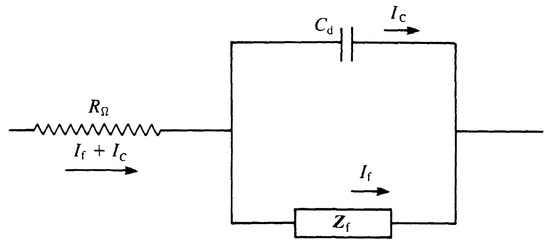
Figure 2.
Randle’s circuit: equivalent electrical circuit of an electrochemical cell for a simple electrode process. can be substituted with the series of and .
- Subdivision into a resistance, , in series with a pseudo-capacitance ,
- Subdivision into a resistance, accounting for the resistance to charge transfer, , and an impedance that measures the difficulty of mass transport of the electroactive species, called the Warburg impedance, .
The last equivalence is often used because of its physical meaning: for kinetically-favoured reactions and predominates, while for difficult reactions and predominates. More detail about mathematical formulations, based on electrochemical reaction, of the Warburg impedance and thus of the faradaic impedance can be found in [4,5].
The impedance for Randle’s circuit will be a complex number which can be represented in its polar plot formalism for all tested frequencies. The explicit real and imaginary parts are given by:
where is a coefficient depending on a combination of different material constants, and is the frequency in rad/s. Notice the presence of a fractional-order exponent in the model which allows a frequency-dependent real part of impedance (as opposed to classical integer-order impedance whose linear components have a real part constant with frequency).
It is further useful to look at the polar plot of the functions in (14), also known in chemistry as Cole–Cole plot, as shown in Figure 3. From this figure is possible to appreciate the division in two regions: one represents the behaviour of a kinetically favoured reaction, while the other one shows the predominance of the mass transfer effect.
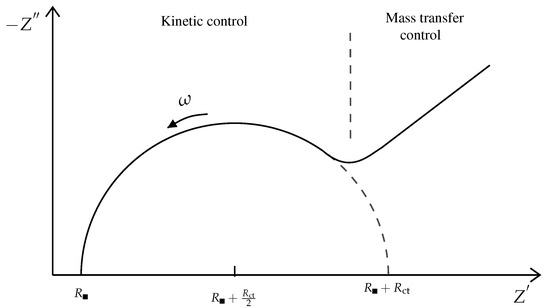
Figure 3.
Illustration of a polar plot for the Randle’s circuit impedance.
It is also interesting to discuss the polar plot in Figure 3, bearing in mind the (14) and studying their limiting forms:
- The low-frequency behaviour is represented by the straight line of the unit slope and corresponds to a reaction controlled by sole diffusion, the impedance though assumes the form of the Warburg impedance, which dominates.
As observed in Figure 3 this semi-circle has a radius of and the ideal intercepts on the real axis are and . Its success as a sensory instrument is that one can directly extract from a graphical inspection of the polar plot these values. It is also important to understand the physical meaning of the semi-circle, directly linked with the system’s characteristic. For very high frequency the imaginary part in (16), which can be approximated as , becomes very small, behaving like a short-circuit. The peak value of the semi-circle is instead reached for the maximum of in the frequency responsible for the time response (and this results in pole locations of the transfer function of the linear approximated system). For very low frequency it behaves like an open circuit and the current flows through and .
2.2.3. Spectroscopy Analysis Device
Impedance measurements have been performed with a state-of-the-art infrastructure, i.e., a Solatron modulabXm impedance analyzer (Solatron Analytical, UK), see Figure 4. Through the Solatron analyzer a 100 mV r.m.s. sinusoidal voltage has been applied to the outer couple of electrodes of the measurement probe which was immersed into the glass tube containing the analyzed sample. The impedance of the samples has been analyzed in the 1 Hz–1 MHz frequency range. The electrochemical cell consisted of a plastic cylindrical tank with an inner diameter of 20 mm and a length of 30 mm. The electrodes used to perform the experiments were screen-printed electrodes from Dropsens. These electrodes are chosen since they exhibit high electrochemical activity and good repeatability [29]. The counter and working electrodes are platinum (4 mm diameter) and the reference electrode is silver.
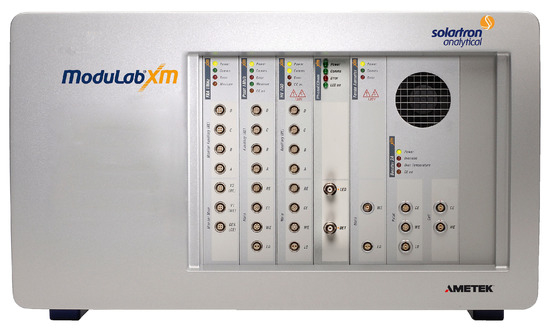
Figure 4.
ModuLab Xm measuring device, by Solartron Analytics.
The Modulab XM is a highly versatile electrochemical test system that measures the characteristics of a wide range of electrochemical systems including organic/inorganic, specialized corrosion, electroplating and energy cells. Reference grade system components (potentiostat/ galvanostat, frequency response analyser and optional high voltage amplifier) are combined in a single unit, avoiding the need for stacking and wiring separate units. The device communicates via an Ethernet link to an external PC, running XM-studio ECS software for control and monitoring purposes. A very high sampling rate is available for recording the data samples and stored in real-time in situ buffer memory slots. The system can export data in real-time (in stack data format) for raw data processing or can deliver at end-experiment the estimated impedance. For a broader scope of utility of raw data samples, a time- and frequency domain analysis can be performed, hence providing both time-based signals (impedance) as well as image-based data formats (spectrograms). This mixed time-and-image information is of particular interest for applying deep learning tools, as we recently did in a medical application [30].
2.3. Lumped Fractional Order Parametric Models
Our previous work and original contributions in modeling biological tissues have already long shown the success story of using lumped general order parametric models to capture complex phenomena [9]. Recent works have introduced such models into the control and system theory for use in control applications [31].
When describing time-varying properties of these static characteristics of stress–strain relationships [10], it is very practical to use generalized order models with electrical equivalent notations for material dynamic properties:
where is the electrical resistance related to material resistance, the inductance related to inertance or molecular accelerations and the compliance value as the inverse of the electrical capacitance. The units depend on the physical units used to derive the impedance from their time-domain measured signals. For electrical circuits, these time signals are in Volts, while for air/liquid measurements the time signals are in pressure (Pa) and flow in liters/s. The elements in this model have been in detail derived from mechanical and electrical equivalent properties analogy in [32]. When interpreting the model at a micro-scale level, the model refers to the diffusion process of glucose molecules in the simulated environment [12]:
Hence, the complex representation in frequency domain of this generic fractional order model is:
When identifying real data samples, the real and imaginary parts can be evaluated in the cost function of a regressor estimator:
In [12], this model was successfully employed to fit the impedance of non-Newtonian solutions like water mixed with glucose and its parameters correlated to different concentrations.
When the material properties behave as an electrical circuit that has one resistor and two fractional order capacitors, also known as constant phase elements, the number of model parameters can be significantly reduced:
This was shown to be the case in non-Newtonian fluids with thixotropic properties [9]. In this model, can be fixed per tablet geometrical properties, while and are related to dynamic changes in viscosity and density of the material mixture. The drawback of this model structure is that its accuracy is limited over a rather small frequency interval (i.e., 1–2 decade interval).
An alternative solution for a much broader (i.e., several decades) frequency interval dependence of the polar plot representation is the model:
which is a four parameters model, a lumped version of that proposed in [33]. Several comparisons of estimators on various non-Newtonian fluids have been reported in our prior work in [9]. In this model, all parameters were sensitive to changes in material properties, and the results suggested that in order to increase the detectability of material properties, correlation matrices can be used to calibrate it for particular applications at hand. When parameters , , are fixed to the material specifications, the parameter p has an excellent sensitivity to capture changes in viscosity.
3. Results and Discussion
In this paper, the application to ratio control has been investigated for the specific pharmaceutical process units (i.e., feeder and blender). A benchmark simulator has been proposed in [8] describing tableting production using wet/dry granulation for simulation, analysis and control design and validation purposes. The continuous manufacturing using the wet and dry granulation flowcharts is depicted in Figure 5. In our open-source MATLAB/Simulink simulation platform the wet and dry granulation route is implemented [34], however, a model library is available for simulating the user-specified sub-processes production line. The entire manufacturing process is described in [8]. Of particular interest is the blender unit, where the powder and excipient are mixed to produce a material that is granular in form.
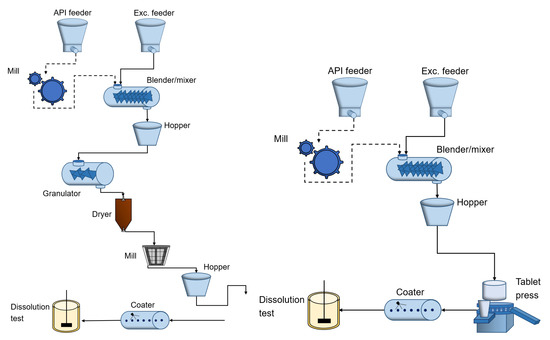
Figure 5.
Continuous pharmaceutical tablet manufacturing processes: wet granulation (left) and direct compaction (right) routes.
A population balance modeling approach has been used to model the blending process [8]:
which represents the powder distribution of both the active pharmaceutical ingredient (API) and the excipient in each compartment. The corresponding flows are obtained from:
where represents the speed of the blender in rpm and the coefficients are parameters estimated from experimental data to calibrate the model. The combined flow is given by:
Consequently, the outlet concentration () is given by:
and the relative standard deviation ():
Essentially, this process requires ratio control as a natural solution for mixing flows. A proposed solution is given in Figure 6.

Figure 6.
A ratio control structure solution for the blender unit.
All transfer functions implemented in the benchmark pharma simulator are based on literature models. Every process unit is characterized by a specific transfer function representing the process dynamics. For the feeder unit, a simplified semi-empirical first-order model (FOPDT) is utilized for modeling the feeder unit [35]. The relationship between the screw speed and the mass flow rate of the feeder is accurately predicted. It requires extra parameters, such as the vertical stress (), the density constant (), the mass and radius of the blade ( and ), etc. The paper [36] presents a FOPDT model as well, like in [37]. The difference is that the mass flow rate is calculated via a physics-based approach from the bulk density of the powder, the screw speed, the volumetric efficiency and the twin screws geometry. It would be more interesting to use this model since it points out where the time constant and delay are coming from. Unfortunately, no parameter data is available. These models are relatively new since no significant work has been done before. Because of that, they used a FOPDT model where the parameters were purely determined experimentally like in [38]. The work in [39] even uses the same loss-in-weight (LIW) model as in [40]. All models described in these papers are very similar, making them more or less even accurate. The availability of parameter data was the decisive factor for choosing the model in [40].
For the blender unit, transfer function models have been derived from the population balance models given in Equations (24)–(28). This process is rather complex and due to the lack of numeral parameters and the complexity of the process, a simpler transfer function model has been implemented in the simulator platform [41]. In the simulator library, the wet granulator contains sub-modules where the particle size specifications are explicitly used, as depicted in Figure 7.

Figure 7.
Example of simulator library modules for specifying the grain size in granulator unit. These are part of the process start-up settings given by the operator.
All process parameters are detailed in Table 1.

Table 1.
Parameters for the blending process unit.
For two different species, the following impedance have been obtained, as illustrated in Figure 8 bottom. We compare the frequency response estimation against the parametric model estimation with one pole or two poles in the transfer function from (23). It turned out the result with one pole was sufficiently accurate. The methods for identification have been described in detail in [9]. The identified optimal parameters are listed in Table 2.
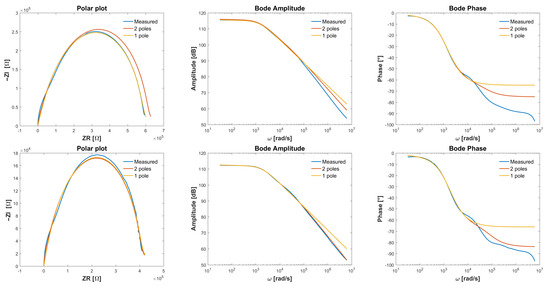

Table 2.
Reduced order model parameters (23) for two species of different viscosity.
If the grain particle size is decreasing, the number of particles per volume unit is increasing and viscosity is increasing to decrease flow. To maintain a constant flow of species in the blender, we need to adapt the ratio controller gains. An example of the relationship between the particle size and flow of species is given in Figure 9.
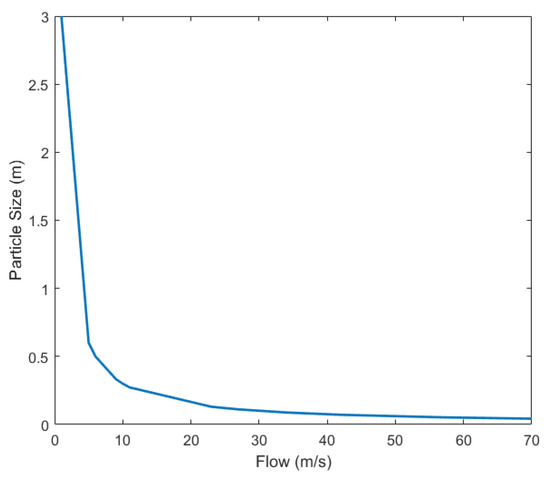
Figure 9.
An example of how the particle size of species influences the flow as part of the ratio control algorithm.
Using mapping as that given in Figure 9, adaptation to context variations in terms of material properties can be done. Context-aware control is a major trend in current engineering applications, and the pharmaceutical industry offers a great opportunity to pick up emerging solutions from more established fields of control applications [16].
This very complex process of tablet manufacturing is described by several sub-processes (e.g., dispensing, blending, granulation, drying, tableting) as depicted in Figure 5. To ensure optimal production each unit needs to operate such that to assure the critical quality attributes. The development of advanced inline monitoring techniques (e.g., the sensing spectroscopy) tracks the product at each individual stage of manufacturing and eventually saves additional analysis time, thereby enabling the direct release of the continuously manufactured batch into the market without delay.
The production thereof is a complex multivariable process and modifications to any of the mentioned components can have important implications on the efficiency of the production process (e.g., changes in powder stickiness or mixture viscosity). Therefore, optimal control of production efficiency and product properties is essential to guarantee a manufacturing process that is adaptive while maintaining quality at all times. This implies that every unit in the production line has to be controlled such that the manufactured tablets are within the very strict performance criteria. However, the focus of this paper is not on the control of the continuous manufacturing line, but to show the potential of sensing spectroscopy for the self-tuning ratio control.
4. Conclusions
In this paper, we have investigated a new approach for material properties analysis in the pharmaceutical industry using impedance spectroscopy sensing. It aimed to enable the use of material properties in varying conditions to self-tune control algorithms. The solution proposed here exploits the capability of generalized order lumped parametric models to capture material properties and their suitability for online estimations. The results indicate the potential of the proposed methodology for self-tuning ratio control, where the model parameters obtained using impedance spectroscopy will be then used for the self-tuning control gain. This constitutes a step forward in the paradigm shift from batch to continuous manufacturing in the pharma industry as the end-to-end process consists of different control loops. Moreover, the algorithm is a versatile theoretical framework and can be extended to other industries, e.g., food, oil, petrochemical. The particular application presented in this paper is to show the feasibility of the proposed theoretical framework to a real-life industrial process, enhancing the advantage of modeling and control techniques in the field of pharmaceutical applications to facilitate the transition from batch-wise production to continuous manufacturing.
Author Contributions
Conceptualization, C.M.I.; methodology, D.C., M.G. and I.B.; software, D.C. and I.B.; validation, D.C. and I.B.; formal analysis, D.C., I.B. and M.G.; investigation, M.G., D.C. and I.B.; resources, I.N., D.C. and I.B.; data curation, I.N., D.C. and I.B.; writing—original draft preparation, M.G.; writing—review and editing, all authors; visualization, D.C. and M.G.; supervision, C.M.I.; project administration, C.M.I. and D.C.; funding acquisition, C.M.I., M.G., D.C. and I.B. All authors have read and agreed to the published version of the manuscript.
Funding
This research was supported by Research Foundation Flanders (FWO) under doctoral grants 1184220N (M. Ghita), 1S04719N (I. Birs) and post-doctoral fellowship No. 12X6819N (D. Copot). This research has also been supported by the Ghent University Special Research Fund STG 020-18 MIMOPREC, partially by the National Natural Science Fund for Distinguished Young Scholars 61725301 and by the International (Regional) Cooperation and Exchange Project 61720106008.
Institutional Review Board Statement
Not applicable.
Informed Consent Statement
Not applicable.
Data Availability Statement
The MATLAB/Simulink simulator is available at this link: Mathworks file Exchange, File nr 102769; Available online: https://nl.mathworks.com/matlabcentral/fileexchange/102769-benchmark-simulator-for-continuous-manufacturing (accessed on 1 December 2021).
Conflicts of Interest
The authors declare no conflict of interest.
Nomenclature
| Symbol | Name | Units |
| C | linear concentration | mole/m |
| t | time | s |
| fractional time (memory) | s | |
| D | diffusion coefficient | m/s |
| , | fractional orders | |
| m | delimits sub-/supra-diffusion | |
| (x) | Gamma function | |
| x | space | m |
| projection plane variable | ||
| s | Laplace Operator | |
| K | diffusion coefficient in space-time | m/s |
| k | local space operator | m |
| n | sample number | |
| concentration in grain | mole/m | |
| L | grain size | m |
| A | transversal area of grain | m |
| V | grain volume | m |
| S | surface area of grain | m |
| v | volumetric flow of diffused species | m/s |
| linear diffusion velocity | m/s | |
| initial concentration | mole/m | |
| T | temperature | K |
| Boltzman constant | (m·kg)/(K·s) | |
| r | radius of sphere | m |
| viscosity | kg/(m·s) | |
| specific material coefficient | ||
| angular frequency | rad/s | |
| resistance | ||
| inertance | Pa·m·s | |
| capacitance | F |
References
- Samad, T. A survey on industry impact and challenges thereof. IEEE Control Syst. 2017, 37, 17–18. [Google Scholar] [CrossRef]
- Alemão, D.; Rocha, A.D.; Barata, J. Smart Manufacturing Scheduling Approaches—Systematic Review and Future Directions. Appl. Sci. 2021, 11, 2186. [Google Scholar] [CrossRef]
- Reschke, J.; Gallego-García, S. A Novel Methodology for Assessing and Modeling Manufacturing Processes. Appl. Sci. 2021, 11, 10117. [Google Scholar] [CrossRef]
- Ensafi, A. Electrochemical Biosensors, 1st ed.; Elsevier: Amsterdam, The Netherlands, 2019. [Google Scholar]
- Patel, B. Electrochemistry for Bioanalysis, 1st ed.; Elsevier: Amsterdam, The Netherlands, 2021. [Google Scholar]
- Vanhoorne, V.; Vervaet, C. Recent progress in continuous manufacturing of oral solid dosage forms. Int. J. Pharm. 2020, 579, 119194. [Google Scholar] [CrossRef] [PubMed]
- Ryckaert, A.; Ghijs, M.; Portier, C.; Djuric, D.; Funke, A.; Vervaet, C.; De Beer, T. The influence of equipment design and process parameters on granule breakage in a semi-continuous fluid bed dryer after continuous twin-screw wet granulation. Pharmaceutics 2021, 13, 293. [Google Scholar] [CrossRef]
- Malevez, D.; Copot, D. From batch to continuous tablet manufacturing: A control perspective. IFAC PapersOnLine 2021, 54, 562–567. [Google Scholar] [CrossRef]
- Ionescu, C.M.; Birs, I.R.; Copot, D.; Muresan, C.I. Mathematical modeling with experimental validation of viscoelastic properties in non-Newtonian fluids. Philos. Trans. R. Soc. A-Math. Phys. Eng. Sci. 2020, 378, 20190284. [Google Scholar] [CrossRef] [PubMed]
- Ionescu, C.; Kelly, J.F. Fractional calculus for respiratory mechanics: Power law impedance, viscoelasticity and tissue heterogeneity. Chaos Solit. Fractals 2017, 102, 433–440. [Google Scholar] [CrossRef]
- Clemens, C.; Radschum, M.; Jobst, A.; Himmel, J.; Kanoun, O. Detection of density changes in soils with impedance spectroscopy. Appl. Sci. 2021, 11, 1568. [Google Scholar] [CrossRef]
- Copot, D.; De Keyser, R.; Juchem, J.; Ionescu, C.M. Fractional order impedance model to estimate glucose concentrations: In vitro analysis. Acta Polytech. Hungarica 2017, 14, 207–220. [Google Scholar] [CrossRef]
- Gul, H.; Alrabaiah, H.; Ali, S.; Shah, K.; Muhammad, S. Computation of solution to fractional order partial reaction diffusion equations. J. Adv. Res. 2020, 25, 31–38. [Google Scholar] [CrossRef] [PubMed]
- Shah, K.; Jarad, F.; Abdeljawad, T. Stable numerical results to a class of time-fractional partial differential equations via spectral method. J. Adv. Res. 2020, 25, 39–48. [Google Scholar] [CrossRef] [PubMed]
- Zhokh, A.A.; Strizhak, P.E. Experimental verification of the time-fractional diffusion of methanol in silica. J. Appl. Nonlinear Dyn. 2017, 6, 135–151. [Google Scholar] [CrossRef]
- Diaz, R.A.C.; Ghita, M.; Copot, D.; Birs, I.R.; Muresan, C.; Ionescu, C. Context aware control systems: An engineering applications perspective. IEEE Access 2020, 8, 215550–215569. [Google Scholar] [CrossRef]
- Vilanova, R.; Visioli, A. PID Control in the Third Millennium: Lessons Learned and New Approaches; Springer: London, UK, 2012. [Google Scholar]
- Huang, F.; Liu, F. The space-time fractional diffusion equation with Caputo derivatives. J. Appl. Math. Comput. 2005, 19, 179–190. [Google Scholar] [CrossRef]
- Cussler, E.L. Diffusion: Mass Transfer in Fluid Systems, 3rd ed.; Cambridge University Press: Cambridge, UK, 2009. [Google Scholar]
- Leal, L.G. The motion of small particles in non-Newtonian fluids. J. Nonnewton Fluid Mech. 1978, 5, 33–78. [Google Scholar] [CrossRef]
- Mathai, P.P.; Berglund, A.J.; Liddle, J.A.; Shapiro, B.A. Simultaneous positioning and orientation of a single nano-object by flow control: Theory and simulations. New J. Phys. 2011, 13, 013027. [Google Scholar] [CrossRef][Green Version]
- Feng, L.; Liu, F.; Turner, I.; Zhuang, P. Numerical methods and analysis for simulating the flow of a generalized Oldroyd-B fluid between two infinite parallel rigid plates. Int. J. Heat Mass Transf. 2017, 115, 1309–1320. [Google Scholar] [CrossRef]
- Dekemele, K.; Ionescu, C.M.; De Doncker, M.; De Keyser, R. Closed loop control of an electromagnetic stirrer in the continuous casting process. In Proceedings of the IEEE European Control Conference (ECC), Aalborg, Denmark, 29 June–1 July 2016. [Google Scholar] [CrossRef]
- Vazquez-Nambo, M.; Gutierrez-Gnecchi, J.-A.; Reyes-Archundia, E.; Yang, W.; Rodriguez-Frias, M.-A.; Olivares-Rojas, J.C.; Lorias-Espinoza, D. Experimental study of electrical properties of pharmaceutical materials by electrical impedance spectroscopy. Appl. Sci. 2020, 10, 6576. [Google Scholar] [CrossRef]
- Hägglund, T.; Guzman, J.L. Development of basic process control structures. IFAC-PapersOnLine 2018, 51, 775–780. [Google Scholar] [CrossRef]
- Hägglund, T. The tracking ratio station. Control Eng. Pract. 2017, 69, 122–130. [Google Scholar] [CrossRef]
- Lataoui, R.; Triki, A.; Hcini, S.; Zemni, S.; Dhari, J.; Kanoun, O. Structural, morphologic and dielectric analysis of La1-xSrxFeO3 solid solutions. Appl. Phys. A Mater. Sci. Process. 2021, 127, 721. [Google Scholar] [CrossRef]
- Kallel, A.Y.; Bouchaala, D.; Kanoun, O. Critical implementation issues of excitation signals for embedded wearable bioimpedance spectroscopy systems with limited resources. Meas. Sci. Technol. 2021, 32, 084011. [Google Scholar] [CrossRef]
- Kadara, R.; Jenkinson, N.; Banks, C. Characterisation of commercially available electrochemical sensing platforms. Sens. Actuators Chem. 2009, 138, 556–562. [Google Scholar] [CrossRef]
- Heynen, J.; Copot, D.; Ghita, M.; Ionescu, C. Using convolutional neural network online estimators for predicting pain-level variability enables predicitve control of anesthesia. In Proceedings of the IEEE Int Conf on System Theory, Control and Computing, Iasi, Romania, 20–23 October 2021; pp. 194–199. [Google Scholar] [CrossRef]
- Birs, I.; Nascu, I.; Ionescu, C.; Muresan, C. Event-based fractional order control. J. Adv. Res. 2020, 25, 191–203. [Google Scholar] [CrossRef] [PubMed]
- Ionescu, C.M. The Human Respiratory System: An Analysis of the Interplay between Anatomy, Structure, Breathing and Fractal Dynamics; Springer: London, UK, 2013. [Google Scholar]
- Ghita, M.; Copot, D.; Ghita, M.; Duarte, V.; Ionescu, C.M. Online identificaton of pain model in postanesthesia care unit for drug infusion optimization. In Proceedings of the IEEE International Conference on System Theory, Control and Computing, Iasi, Romania, 20–23 October 2021; pp. 188–193. [Google Scholar] [CrossRef]
- Mathworks file Exchange, File nr 102769. Available online: https://nl.mathworks.com/matlabcentral/fileexchange/102769-benchmark-simulator-for-continuous-manufacturing (accessed on 1 December 2021).
- Tian, G.; Koolivand, A.; Arden, N.; Lee, S.; O’Connor, T.F. Quality risk assessment and mitigation of pharmaceutical continuous manufacturing using flowsheet modeling approach. Comput. Chem. Eng. 2019, 128, 106508. [Google Scholar] [CrossRef]
- Bascone, D.; Galvanin, F.; Shah, N.; Garcia-Munoz, S. modeling and Nonlinear Model Predictive Control of a Twin Screw Feeder. IFAC-PapersOnLine 2019, 52, 156–161. [Google Scholar] [CrossRef]
- Su, Q.; Moreno, M.; Giridhar, A.; Reklaitis, G.; Nagy, Z. A Systematic Framework for Process Control Design and Risk Analysis in Continuous Pharmaceutical Solid-Dosage Manufacturing. J. Pharm. Innov. 2017, 12, 327–346. [Google Scholar] [CrossRef]
- Rogers, A.J.; Inamdar, C.; Ierapetritou, M.G. An integrated approach to simulation of pharmaceutical processes for solid drug manufacture. Ind. Eng. Chem. Res. 2014, 53, 5128–5147. [Google Scholar] [CrossRef]
- Wang, Z.; Escotet-Espinoza, M.S.; Ierapetritou, M. Process analysis and optimization of continuous pharmaceutical manufacturing using flowsheet models. Comput. Chem. Eng. 2017, 107, 77–91. [Google Scholar] [CrossRef]
- Escotet Espinoza, M. Phenomenological and Residence Time Distribution Models for Unit Operations in a Continuous Pharmaceutical Manufacturing Process; Rutgers University-School of Graduate Studies: New Brunswick, NJ, USA, 2018. [Google Scholar]
- Baserinia, R.; Sinka, I.C. Mass flow rate of fine and cohesive powders under differential air pressure. Powder Technol. 2018, 334, 173–182. [Google Scholar] [CrossRef]
Publisher’s Note: MDPI stays neutral with regard to jurisdictional claims in published maps and institutional affiliations. |
© 2022 by the authors. Licensee MDPI, Basel, Switzerland. This article is an open access article distributed under the terms and conditions of the Creative Commons Attribution (CC BY) license (https://creativecommons.org/licenses/by/4.0/).