Article

Exploring the Determinants of Service Quality of Cloud E-Learning System for Active System Usage

by
Quadri Noorulhasan Naveed
1,*,
Mohammad Mahtab Alam
2,
Adel Ibrahim Qahmash
3 and
Kahkasha Moin Quadri
4
1
College of Computer Science, King Khalid University, Abha 62529, Saudi Arabia
2
College of Applied Medical Sciences, King Khalid University, Abha 62529, Saudi Arabia
3
College of Education, King Khalid University, Abha 62529, Saudi Arabia
4
Department of English, Dr Babasaheb Ambedkar Marathwada University, Aurangabad 431004, India
*
Author to whom correspondence should be addressed.
Appl. Sci. 2021, 11(9), 4176; https://doi.org/10.3390/app11094176
Submission received: 2 April 2021 / Revised: 26 April 2021 / Accepted: 28 April 2021 / Published: 3 May 2021
(This article belongs to the Special Issue Innovations in the Field of Cloud Computing and Education)

Abstract

:
E-Learning through a cloud-based learning management system, with its various added advantageous features, is a widely used pedagogy at educational institutions in general and more particularly during and post Covid-19 period. Successful adoption and implementation of cloud E-Learning seems difficult without significant service quality. Aims: This study aims to identify the determinant of cloud E-Learning service quality. Methodology: A theoretical model was proposed to gauge the cloud E-Learning service quality by extensive literature search. The most important factors for cloud E-Learning service quality were screened. Instruments for each factor were defined properly, and its content validity was checked with the help of Group Decision Makers (GDMs). Empirical testing was used to validate the proposed theoretical model, the self-structured closed-ended questionnaire was used to conduct an online survey. Findings: Internal consistency of the proposed model was checked with reliability and composite reliability and found appropriate α ≥ 0.70 and CR ≥ 0.70. Indicator Reliability was matched with the help of Outer Loading and found deemed fit OL ≥ 0.70. To establish Convergent Validity Average Variance Extracted, Factor Loading and Composite Reliability were used and found deemed suitable with AVE ≥ 0.50. The HTMT and Fornell–Lacker tests were applied to assess discriminant validity and found appropriate (HTMT ≤ 0.85). Finally, the Variance Inflation Factor was used to detect multicollinearity if any and found internal and external VIF < 3. Conclusions: Theoretical model for cloud E-Learning service quality was proposed. Information Quality, Reliability, Perceived ease of use and Social Influence were considered as explanatory variables whereas actual system usage was the dependent variable. Empirical testing on all parameters stated that the proposed model was deemed fit in evaluating cloud E-Learning service quality.

1. Introduction

Cloud computing is considered as among the most important computer technologies. Many industries are switching to cloud computing for support in IT services; it has grown in popularity and had a significant impact on people’s lives [1]. Many companies are turning to cloud computing to help them get through the current economic downturn [2]. Cloud computing can offer a variety of IT services, particularly data centre services, without requiring a significant financial investment in a physical data centre [3,4].
Cloud E-Learning is a paradigm shift in teaching-learning technology that can be used with the help of a digital environment, and it is designed to assist in improving the education system [5]. E-Learning systems are free from the limitations of time and location and helpful in teaching and learning with new digital form [1]. The availability and popularity of access to the World Wide Web and the presence of different internet tools such as highly configurable computers, laptops, and smartphones help E-Learning in its widespread growth [6]. Students can make their custom-made way to learn with the help of E-Learning. New IT technologies and applications are coming into the market, which also help in the effective implementation of the E-Learning System, and it is reaching the masses [7]. It is noted that the E-Learning system is practised and massively adopted in many developed and developing countries for enhancing comfort in teaching-learning with the help of the Learning Management System (LMS). In the UK, around 95% of higher education institutes are using the support of LMSs during their educational programs [8].
Besides its advantages, complete and effective implementation of E-Learning remains to be accomplished [9]. If E-Learning is effectively applied in educational institutions, we can notice its many potential benefits in teaching and learning. In past studies, many researchers [10,11] studied to identify crucial critical success factors, and they also gave attention to study the success factors for effective E-Learning systems [12]. Some researchers studied direct relationships of different quality factors and usage and satisfaction of the E-Learning system by using the classic technology acceptance models and service quality factors [13,14,15,16] to maximize the effectiveness of the E-Learning system.
Service quality is used to measure the quality of different management practices and culture for the benefit of the customers of the organization. Various evaluation techniques, web tools or user expectation appraisal models are also available to check the quality of web-based services such as online selling and purchasing and delivery of different items, as well as web-based communication [17]. All attentive service providers give importance to service quality and listen gently to their users’ feedback so that they can achieve more satisfaction and loyalty from them by enhancing the quality of their services as per the wish of their users [18].
Different studies have focused on the E-Learning service quality factors, for example, Uppal A. M. et al. (2018) [19] focused on issues of E-Learning quality (ELQ) of service in higher education environments. They proposed an extended SERVQUAL model, the ELQ model, which in addition to crucial service constructs, facilitates consideration of both information and system quality factors. Their proposed model comprises of three dimensions; (1) the Service dimension, consisting of five independent variables; “Responsiveness,” “Reliability,” “Tangibility,” “Assurance” and “Empathy,” (2) the Information dimension, comprising of “Learning Content” and (3) the System dimension, comprising of “Course Website.” They propose that in addition to “service,” consideration of “information” and “system” quality are vital to achieving the overall perception of quality for E-Learning systems.
Haryaka et al. (2017) [20] critically analyzed the Technology Acceptance Model (TAM), the Information System Success Model (IS Model) and the User eLearning Satisfaction Model. The study evaluated user acceptance and satisfaction for E-Learning, service quality, information quality, user participation, and benefit.
Kimiloglu et al. (2017) [21] conducted an exploratory study with the aims to examine the attitudes of usage of E-Learning for corporate training. The study critically examined the IS success model of DeLone and McLean [22], the E-Learning system success model (ELSS) of Wang, Wang and Shee (2007) [23], the Technology Acceptance Model (TAM) of Davis (2000) [24] and the extended TAM model of Lee, Hsieh and Chen (2013) [25]. The study constructed its model by highlighting the advantages and disadvantages of E-Learning from a literature search.
The factors that may have a substantial effect on the service quality of Cloud E-Learning were investigated in this regard. A modified model is prepared by incorporating factors from SERVQUAL and technology acceptance theories such as DeLone and McLean, TAM and UTAUT.
The objectives of the present research are as follows:
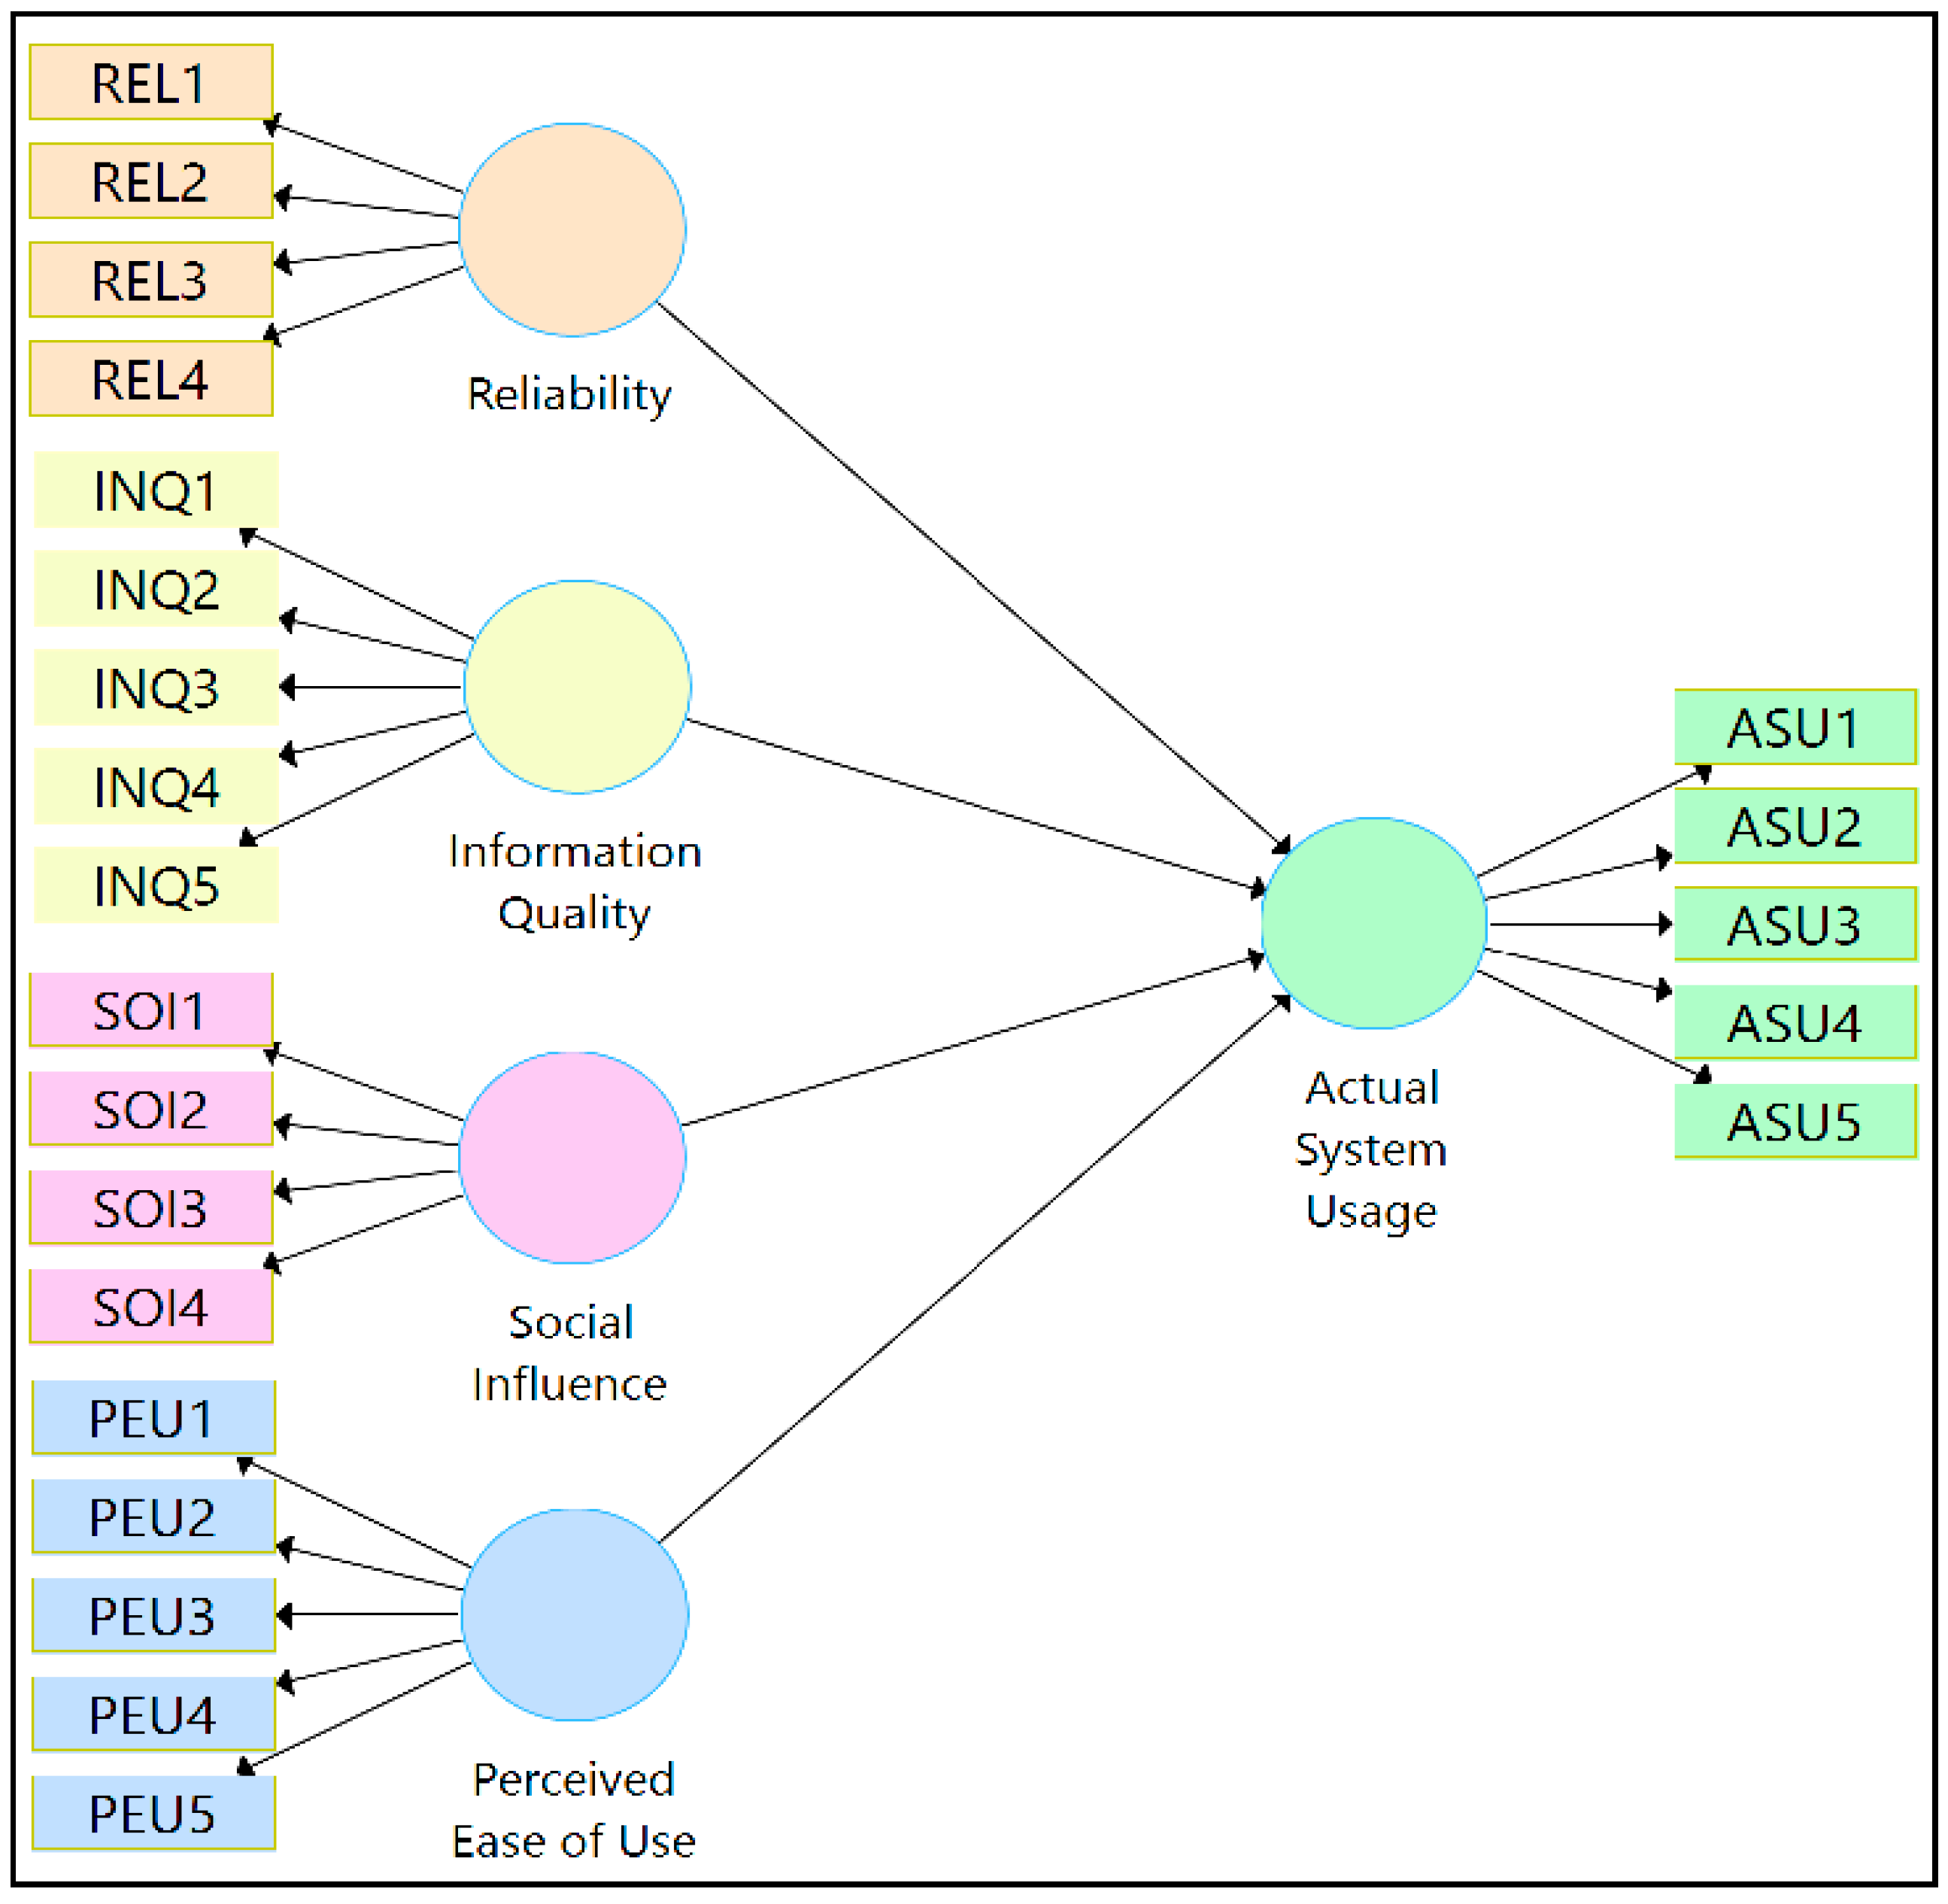
  • To check the impact of reliability on actual system usage.
  • To assess the influence of information quality on actual system usage.
  • To identify the consequence of social influence on actual system usage.
  • To inspect the effect of perceived ease of use on actual system usage.
Thus, the present research aims to study the service quality factors that affect students’ acceptance of the Cloud E-Learning system at the Saudi Arabian university. Four research hypotheses encompassing the multifold objectives are formulated and tested using a questionnaire survey. This proposed model is tested empirically through survey data gathered from 474 students at the Saudi Arabian universities.
The present research study has been organized as follows: Section 2 discusses E-Learning service quality and the technology acceptance theories to propose a research model. It also articulates the hypothesis backed by rigorous literature review classified in different subsections. Section 3 discusses the adopted research methodology. In Section 4, the collected survey data is analyzed, and relevant findings are discussed, along with subsequent results. Discussion and recommendations are provided in Section 5 and Section 6, respectively. The last section provides the conclusion of the present study.

2. Theoretical Foundation of Framework

E-Learning has increased steadily with several new technologies and ICT tools, such as computers, laptops, and highly configurable smartphones and tablets for teaching and learning services. A new technology created new opportunities for the education system. Earlier, physical presence was needed for receiving learning material; today, all types (audio, video, text etc.) of learning material are readily available due to the internet-based E-Learning system for self-paced learning [8]. Researchers defined E-Learning systems as “an information system that can integrate a wide variety of instructional material (via audio, video, and text mediums) conveyed through e-mail, live chat sessions, online discussions, forums, quizzes, and assignments” [25]. In the present study, E-Learning is considered as an Information System (IS), and its success is regarded as an IS success.
Widespread literature has been reviewed to understand the current trends, theories, and models of IS technology acceptance and important factors for university level usage of E-Learning. Different researchers have used different factors from different models to measure the service quality of E-Learning. Some researchers applied SERVQUAL [26,27], Unified Theory of Acceptance and Use of Technology (UTAUT) [21], Technology Acceptance Model (TAM) [8,20,28] and DeLone and McLean [6,15,29]. The details of the different models used by different researchers are given in Appendix B.
After an extensive literature review, we found that further research is needed to find the actual use of E-Learning systems by Saudi university students; as well, it is also essential to know the critical factors from different models which were frequently used in various studies. These factors were examined, analyzed, and further assessed. Initially, sixteen items are selected for further discussion with decision-makers (DMs), who are expert practitioners in E-Learning teaching-learning systems. A single decision-maker (DM) may give a prejudiced personal view, which may result in an inaccurate decision. To eradicate prejudices in decision-making, the final factors were selected with the help of three DMs who know and use E-Learning systems.
The final factors were selected by the two-stage process, initially through systematic literature review. Secondly, thorough expert opinions were taken from expert decision-makers. Different perceptions such as service quality, information quality, peers’ influence and system usage comfortability were also carefully considered for evaluating the success of the E-Learning system. A Nominal group technique (NGT) was adopted to combine SERVQUAL and other models such as DeLone and McLean, UTAUT and TAM to propose an E-Learning SQ Model (E-LSQM) by assimilating five constructs, as shown in Figure 1. The proposed model plays a vital role in exploring the effect of E-Learning service quality. The proposed model comprises of four independent variables/factors (IVs) and one dependent variable/factor (DV). Reliability is derived from SERVQUAL, and Information Quality is taken from DeLone and McLean, Social Influence is derived from UTAUT, and Perceived Ease of Use and Actual System Usage are taken from TAM.
Figure 1 depicts the E-Learning SQ Model (E-LSQM). The following sub-sections further explain the selected constructs.

2.1. Reliability

SERVQUAL [30] is a widely used customer-driven instrument for research. It is used to know the preferences and expectations of the services received by the customer. Many researchers used this scale in different industries, from retail to hospitality and consulting. It is using in assessing the service delivery of E-Learning quality as well [31]. It has five different dimensions which are assumed to reflect the quality of service. Reliability is one of the essential dimensions of SERVQUAL.
Reliability is the capacity to carry out the promised operation consistently and reliably [31]. It is the ability to survey the services offered with reliability and accuracy. It is one of the five dimensions presented in the SERVQUAL model survey of quality models of e-learning systems [32]. Reliability is good working efficiency of the overall structure and function of the E-Learning system or website and dealing with the technical issues of the interface of the E-Learning users; it also includes accuracy of the system as well as providing all the services as promised by the system [17]. An increase in Reliability will motivate the user to use the system. Based on these research studies, it is observed the E-Learning system Reliability will increase satisfaction and influence to increase its usage among the university students. Thus, the following hypothesis is proposed:
Hypothesis 1 (H1).
Reliability of the system influences the actual system usage.

2.2. Information Quality

Information quality is a crucial and essential element in assessing the information performance of Cloud E-Learning systems. It plays a vital role in knowledge delivery and achieving teaching and learning goals [19]. Serious problems can arise due to inadequate information quality of the E-Learning System [33]. The Delone and Maclean model considered Information quality as a very crucial dimension of the success of information systems [22]. Good Information quality of the E-Learning System can increase the satisfaction of the user and rise to the usage of the system by the students [34]. So, it is considered that good information quality will motivate the user and increase the use of the actual system and proposed the following hypothesis:
Hypothesis 2 (H2).
Information Quality of the system affects the actual system usage.

2.3. Social Influence

Social Influence is an essential dimension of the UTAUT model. It is a person’s consideration of other peers’ opinions about using the new technology or system. Social influence is a huge boost in a person’s use of the latest technology or system as it is affected by people’s motivation and the circumstance around them [35]. Nikolić (2018) [32] also studied different E-Learning factors and including Social Influence for making the E-Learning satisfaction model for the E-Learning users. Nikolić (2018) [32] analyzed and reviewed a comprehensive E-Learning model for developing countries and found social support and influence is suitable for Cloud E-Learning users. Thus, the following hypotheses concern to Social Influence is proposed:
Hypothesis 3 (H3).
Social Influence impacts the actual system usage.

2.4. Perceived Ease of Use

Perceived Ease of Use positively affects and enhances students’ intentions to use the services provided by the Cloud E-Learning System. Different studies suggested that Perceived Ease of Use is the main determining factor that positively affects the intention to use the existing system [28]. Everyone loves joy, happiness, fun, gratification and liveliness in their work, and the presence of these factors motivates their usage and acceptance of the online web-based system [28]. The study of Lee et al., [36] also suggests that perceived playfulness or ease of use significantly influenced the usage of the internet-based learning system [37]. Thus, this study hypothesized the following:
Hypothesis 4 (H4).
Perceived Ease of Use of the system impacts the actual system usage.

2.5. Actual System Usage

Usage of the actual system is an essential measure in different models such as TAM [24] and Delone and McLean [22]. Good reliability through system quality, proper information contents quality can affect users’ frequency to use the system. Increased features and facilities of the system also increase motivation and satisfaction in the use of the actual system [20].

3. Research Methodology

This section deals with the various aspects of the research design used in the present study and how they are documented. It helps the researcher to understand the research study, ways and means of data gathering and subsequent analysis to accomplish the research objectives [38]. The research began by exploring the requisite knowledge, objectives, and a hypothesis from the framework [39]. The present study uses a quantitative method for construct testing in the conceptual model. The approach uses top-down deductive, imbibing framework formation and hypothesis development.
The primary data is collected through a questionnaire survey administered among the identified respondents as given in Appendix A. The questionnaire survey has both multiple-choice answers in the demographics section and a closed-ended question which has the 5-point Likert scale. The questionnaire survey is developed in 3 different sections. In Section 1, the researcher introduces himself and the objective of the study. Section 2 consists of a respondent’s profile demographic items and a survey based on constructs related to the service quality of E-Learning is discussed in Section 3. The validity of this instrument was tested by published research studies and backed by six E-Learning expert peers. The expert group has E-Learning experience of more than five years and the experts belong to different universities. The expert group was selected voluntarily from engineering, medicine, computer science, science and humanities and social science disciplines.
The pilot study is used for finding errors and ambiguity in the questionnaire [40]. It measures the instrument by conducting content reliability. The reliability is carried out based on the pilot study data obtained from 30 randomly selected respondents from the engineering, science, and computer science faculty. Later, these respondents were excluded from the actual data survey. An instrument consisting of several items must be subjected to a consistency check, which is usually accomplished using the Cronbach coefficient (α) [41]. The questionnaire items or statements have a coefficient measure varying from 0 to 1 unit. The use of the Cronbach coefficient as a tool to measure the reliability of an instrument is undisputable.
Upon establishing an acceptable level of reliability in the pilot study, the researchers collected data confidently using the instrument developed for this study. Data were gathered from Saudi Arabian universities. In total, 497 responses were received from the respondents. However, 27 responses were rejected due to incomplete information; later, these 27 responses were removed from the analyses. Thus, in total, 474 valid responses were identified for subsequent data analysis. For the present study, a non-probability and convenience sampling design was used.

4. Analysis and Findings

The data were analyzed with the use of structural equation modelling for the proposed conceptual model of service quality of E-Learning. The proposed model is designed and presented in Figure 2 with the use of SmartPLS (v. 3.3.2).
The results of the demographic section of the participants are described in Table 1. The results of the demographic profile state that more than half (62.4%) of respondents are female. The highest percentage (37.1%) of participants belong to the age group of 21–28 years, whereas the lowest percentage of (15.2%) respondents belong to the age group of above 25 years. In terms of the E-Learning experience, more than half (56.1%) of therespondents used E-Learning services for less than one year while approximately five per cent (5.3%) respondents used E-Learning services for more than five years. Types of E-Learning are explained in five categories depending on the weightage of E-Learning and traditional learning. Basics is the first among five, which has only 10% of the weightage of assessment for course design or description, assessment criteria, contact hours, discussion, announcements, and forum. Blended-1 is a mixture of 30% online teaching and 70% face-to-face classroom teaching whereas blended-2 is a mixture of 50% online teaching and 50% face-to-face teaching in the classroom. Blended-3 is a mixture of 70% online teaching and 30% face-to-face teaching in the classroom whereas full E-Learning includes 100% online teaching. Under types of E-Learning users, a maximum (35%) number of respondents belong to blended-1 courses followed by those (28.3%) from basics courses, (27%) full E-Learning courses, (5.3%) blended-3 courses and (4.4%) blended-2 courses. The area of study is explained in three categories as Medical and Health Science which includes medicine, dentistry, pharmacy, nursing, physical therapy, laboratory science, radiology science and health administration. Engineering and Computer Science includes all branches of engineering, computer science and information systems. Humanities and Social Sciences includes language and translation, Islamic studies, and studies from the college of business administration. Most of the respondents (43.2%) belong to Engineering and Computer Science followed by (30.2%) those from Medical and Health Science whereas the lowest (26.6%) number of respondents belong to Humanities and Social Sciences. In terms of E-Learning usage, 38.6% of respondents spent 1–2 h daily for E-Learning, 22.6% spent 3–4 h, 21.9% spent more than 4 h and 16.9% spent less than one hour.
To check the reliability of the proposed model Cronbach’s alpha was used. Composite reliability was applied to measure internal consistency, while indicator reliability was tested using outer loadings. To ensure validity, average variance extraction and the Heterotrait–Monotrait relationship were used. Several studies suggested to [36] retain the indicators if the outer loading (OL) exceeds 0.70. The relationship needs to be investigated using average variance extracted and composite reliability if the outer loading ranges from 0.40 to 0.70. If AVE and CR meet the inclusion criteria, the indicators are kept; otherwise, they are excluded from further consideration.
Apart from one factor of actual system use (ASU1-0.691), factor loading is greater than 0.70 in Table 2. However, the CR (0.925) and AVE (0.712) are higher than the required level for retaining any construct item. Finally, in a proposed model for E-Learning service efficiency, all constructs were kept in their initial state. To evaluate the validity of the model Cronbach’s alpha was calculated and to examine internal consistency composite reliability and average variance were calculated and depicted in Table 2. Composite reliability and Cronbach’s alpha were greater than 0.70, indicating that they met the minimum [42] criterion for further investigation. For the proposed E-Learning service quality model, all constructs were found to be valid. Average variance extracted for all constructs was greater than 0.50 and met the standard inclusion criteria [43]. Therefore, all five constructs were considered as deemed suitable for assessing E-Learning service quality.
The result of the Fornell–Larcker criteria illustrates that the value in the diagonal is higher as compared to the other values of the same constructs, as shown in Table 3. Heterotrait–Monotrait (HTMT) analysis was used to evaluate discriminant validity, as suggested by [44]. The association between the same construct in a different time frame is known as HTMT correlation.
Table 4 states that the value of correlation with the same constructs under acceptable range (HTMT < 0.85). Finally, the outcome of the Fornell–Larcker Criterion and Heterotrait–Monotrait Ratio is evident enough for the proposed model in measuring E-Learning Service Quality.
Hair et al. state: “A common threshold is a VIF value above 10 initially”. Just after a few years, R. B. Kline [45] proposed a VIF value of 5 as the threshold in the context of covariance-based SEM. Finally, R. T. Cenfetelli and G. Bassellier [39] recommended 3.3 as the VIF threshold in the context of variance-based SEM but in discussions of formative latent variable measurement [45]. By considering all aspects this study considered the VIF threshold as 3.3, where the indicators are predictors of the latent variable score.
As depicted in Table 5, VIF is less than 3 for all independent constructs and their instruments. It is evident from VIF results that no multicollinearity exists.
The Structural Path Coefficients (β values) were calculated using SmartPLS (v. 3.3.2) and are depicted in Figure 2, Figure 3 and Figure 4; the figures show the path coefficient diagram. T-tests with their significance level were determined and presented in Table 6 to measure the significant level of path coefficients (β values). As shown in Figure 2, the four constructs, namely Reliability, Information Quality, Social Influence, and Perceived Ease of Use, explained 67.4 per cent of actual device use.
Among the four independent constructs, perceived ease of use contributes the maximum (29.1%) in actual system usage, followed by (27.4%) social influence, (26.1%) reliability and the least (12.9%) information quality in determining the actual system usage of E-Learning.
The result of path coefficients (β values), t-test indicators and p values are shown in Table 6, which demonstrates that the association between information quality and actual system usage is significant (p < 0.05) with a 95% confidence level. A significant association was observed between actual system usage and perceived ease of use (p < 0.05). The correlation between social influence and reliability was significant (p < 0.05) with a 95% confidence level. The significant level of all four constructs was confirmed with a greater t value (T > 1.650). Finally, results indicate that all four independent constructs found significant in determining the actual system usage of E-Learning.

5. Discussion

The study’s findings back up Hypothesis H1, indicating that Actual System Usage and Information Quality are directly and significantly related. Moreover, Actual System Usage highly depends on the five identified instruments of Information Quality such as I use the E-Learning System in an enjoyable way to improve my studies, I use the E-Learning System for storing and sharing course-related documents, I recommend the E-Learning System for others use, I use the E-Learning System in my studies, and the E-Learning System has helped me to achieve my learning goals.
Hypothesis H2 is supported and accepted. In other words, Perceived Ease of Use and Actual System Usage are positively and significantly associated with each other, which clearly states that higher the perceived ease of use leads to greater Actual System Usage. Perceived Ease of Use is explained by four instruments such as the E-Learning System is easy to use, the knowledge from the E-Learning System is easy to understand, the E-Learning system has ease in distributing data and information and the E-Learning system has ease of communication with other friends and Instructors. Other researchers [28,46,47,48] studied the effect of perceived ease of use on Actual System Usage which shows the current finding is like the previous findings.
Hypothesis H3 is not rejected, stating that there is a highly positive association between reliability and actual system use. The instruments of reliability like the E-Learning system runs in a correct reliable way, the E-Learning system is reliable for providing correct information when needed, the Instructors of the E-Learning system are dependable for the appropriate course contents, and the E-Learning support unit is ready to help whenever I need support with the system, having a strong influence on the Actual System Usage. The higher value of the reliability of learners influences them towards Actual System Usage. Several researchers [8,19,32] also studied the effect of the user’s reliability on Actual System Usage, which shows the current findings confirm the previous findings.
Hypothesis H4 was supported, which states that Social Influence is highly positive, and significantly associated with the Actual System Usage. The items of Social Influence like students who influence me to think that I should use the E-Learning system, friends who are essential to me think that usage of my E-Learning system will increase my grades, and Instructors who are helping during the usage of the system. E-learning deanship will give full support with training that has a more significant positive impact on the Actual System Usage. Previous studies [15,22] examined the Social Influence’s effect on the Actual System Usage, and their finding is as the result of the current study.
Previous research has looked into Actual System Use [15,20,32,48,49] and found that Information Quality, Perceived Ease of Use, Reliability, and Social Influence are among the most important constructs and explanatory variables for Actual System Use, among others. The current study concludes that four factors, namely, Information Quality, Perceived Ease of Use, Reliability, and Social Influence, have the greatest impact on Actual System Use.

6. Conclusions

Initially, the determinant of E-Learning service quality was established with the use of an extensive literature review. The four most influencing factors (Information Quality, Perceived ease of use, Reliability and Social Influence) for E-Learning service were extracted from existing literature. Reliability derived from SERVQUAL, Information Quality derived from DeLone and McLean, Social Influence derived from UTAUT, Perceived Ease of Use and Actual System Usage derived from the TAM model. The proposed theoretical model was tested empirically for its academic sustenance. Outer loading of each instrument was calculated and found suitable for inclusion in the proposed model (OL ≥ 0.70). The Cronbach Alpha of each construct was calculated to check its reliability and found appropriate (α ≥ 0.70). To check the internal consistency of scale items, composite reliability was calculated and found deemed fit (CR ≥ 0.70). To test the validity of the proposed model, the Average Variance Extracted was calculated and found deemed valid for inclusion (AVE ≥ 0.50). The Discriminant validity was performed to check the degree of difference between overlapping constructs. The Fornell–Lacker criterion was used to compare the square root of the average variance extracted with the correlation of latent constructs and found appropriate. The Heterotrait–Monotrait ratio of correlation was applied to check the lack of discriminant validity with a threshold value of 0.85. To detect the multicollinearity, the Variance Inflation Factor was used and found no multicollinearity existed, as each construct and their instruments had their VIF < 3. Finally, all four parameters of empirical testing, namely Internal Consistency, Indicator Reliability, Convergent Validity and Discriminant Validity were checked and found appropriate to assess E-Learning acceptance. A future study might be conducted with a larger data set and inclusion of extraneous variables to further enhance the coefficient of model explanation which is presently 0.674.

Author Contributions

Conceptualization, Q.N.N. and M.M.A.; methodology, Q.N.N. and M.M.A.; software, Q.N.N. and M.M.A.; validation, Q.N.N., M.M.A. and A.I.Q.; formal analysis, Q.N.N. and M.M.A.; resources, A.I.Q.; data curation, Q.N.N., M.M.A. and A.I.Q.; writing—original draft preparation, Q.N.N.; writing—review and editing, Q.N.N., M.M.A., A.I.Q. and K.M.Q.; visualization, Q.N.N. and M.M.A.; supervision, A.I.Q. and K.M.Q.; project administration, A.I.Q.; funding acquisition, Q.N.N. and A.I.Q. All authors have read and agreed to the published version of the manuscript.

Funding

The authors extend their appreciation to the Deanship of Scientific Research at King Khalid University for funding and support of this work under Research grant award number RGP. 1/370/42.

Institutional Review Board Statement

Not applicable.

Informed Consent Statement

Informed consent was obtained from all subjects involved in the study.

Conflicts of Interest

The authors declare no conflict of interest.

Appendix A

Table A1. Construct Measurements and Sources.
ConstructItemMeasureSource
ReliabilityREL1The Cloud E-Learning System runs in a reliably right away.[8]
REL2The Cloud E-Learning System is reliable for providing correct information when needed.[6]
REL3The Instructors of the Cloud E-Learning System are dependable for the appropriate course contents.[8]
REL4The Cloud E-Learning support unit is ready to help whenever I need support with the system.[6]
Information
Quality
INQ1The Cloud E-Learning System uses audio elements properly.[31]
INQ2The Cloud E-Learning System offers accurate, up-to-date information.[19,43]
INQ3The Cloud E-Learning System provides complete relevant and useful information.[19,28]
INQ4The Cloud E-Learning System gives course information in easy to understand language.[31]
INQ5The Cloud E-Learning System provides teaching materials that fit with the course learning objectives.[28]
Social
Influence
SOI1Students who influence me think that I should use Cloud E-Learning System.[32]
SOI2Friends who are important to me think that usage of my Cloud E-Learning system will increase my grades.[32]
SOI3Instructors help during the usage of the system.[32]
SOI4E-Learning Deanship will give full support with training.[32]
Perceived
Ease of Use
PEU1The Cloud E-Learning System is easy to use.[28]
PEU2The knowledge from the Cloud E-Learning system is easy to understand.[28]
PEU3The Cloud E-Learning system has ease in distributing data and information.[8]
PEU4The Cloud E-Learning system has ease of communication with other friends and Instructors.[8]
Actual System UsageASU1I use the the Cloud E-Learning System in an enjoyable way to improve my studies.[31]
ASU2I use the Cloud E-Learning System for storing and sharing course-related documents.[31]
ASU3I recommend the Cloud E-Learning System for others’ use.[31]
ASU4I use the Cloud E-Learning System in my studies.[31]
ASU5The Cloud E-Learning System has helped me in achieving my learning goals.[8]

Appendix B

Table A2. E-Learning Service Quality Models and Factors.
Research TitleFactorsModel/Theory
(If Any)
Ref.
Evaluating E-learning systems success: An empirical studyLearner QualityTAM, DeLone and McLean information systems, EESS Model[8]
Learner’s Attitude, Learner’s Behavior, Learner’s Anxiety, Previous Experience, Learner’s Self-Efficacy
Instructor Quality
Instructor’s Attitude, Enthusiasm, Responsiveness, Subjective Norm, Communication
Service Quality
Providing Guidance and Training, Providing Help, Staff Availability, Fair Understanding, Responsiveness
Information Quality
Accessibility, Understandability, Usability, Content Design Quality, Up to Date Content, Conciseness and Clarity
Technical System Quality
Ease of Use, Ease to Learn, User Requirements, System Features
System Availability, System Reliability, System Fulfilment, Security, Personalization
Education System Quality
Assessment Materials, Diversity of Learning Styles, Effective Communication, Interactivity and Communication
Support System Quality
Ethical Issues, Legal Issues, Promotion and Trends
E-learning success determinants: Brazilian empirical studyCollaboration Quality, Service Quality, Information Quality, System Quality, Learner Computer Anxiety, Instructor Attitude Toward E-Learning, Diversity in Assessment, Learner Perceived Interaction with Others, User Perceived Satisfaction, Use, Individual ImpactDeLone and McLean information systems,
E-Learning satisfaction
[50]
Factors determining e-learning service qualityService Quality (SERQUAL)SERVQUAL, DeLone and McLean information systems[19]
Reliability, Assurance, Tangibility, Empathy, Responsiveness
Information Quality (Learning Content)
Presentation, Structure, Interactivity, Language, Delivery Modes
System Quality (Course Website)
Interface Design, Navigation, Attractiveness, Ease of Use
Survey of quality models of e-learning systemTeaching, Learning environment, Efficiency, Performance, Reliability, Usability, Interface, Interaction, Social, Services, Personalization Learning activates, Access, Cost, Technology, Learner, Admin, Institution, Instructor, Evaluation, Delivery, Content [51]
A model for evaluating e-learning systems quality in higher education in
developing countries
Course DevelopmentDeLone and McLean information systems And others[32]
Course Information, Course Structure, Course Organization, Course Layout
Institutional
Funding, Policies, Infrastructure
Learner Support
Content Support, Social Support, Admin Support
Overall
User satisfaction Performance, Learning effectiveness, Cost effectiveness, Academic achievement
Assessment
Assignments, CATS, Examinations
User satisfaction model for e-learning using smartphone
Demeanor, Responsiveness, Competence, Tangible, Completeness, Relevance, Accuracy, Currency, Training provider, Easier to the Job, Increase ProductivityTAM, DeLone and McLean information systems[20]
Mediating Role of Student Satis. on the Rela. Between Edu. Quality, Service Quality and Adoption of ELearningEducational quality, Service quality, student satisfaction, integration of e-learning [47]
Perceptions about and attitude toward the usage of e-learning in
corporate training
Advantages Factors [21]
Employee Commitment and Motivation, Convenience and Accessibility, Customization and Outsourcing, Cost Effectiveness
Disadvantages Factors
Personal Disadvantages, Organizational Disadvantages
Framework to improve e-learner satisfaction and further strengthen e-learning implementationLearner dimension [46]
Learner Attitude Towards E-course, Learner Computer Anxiety, Learner Internet Self Efficacy
Instructor dimension
Instructor Presence and Guidance, Instructors Ability in Internet based Course
Course dimension
ELearning course flexibility, ELearning course quality
Technology dimension
Technology Quality, Internet Quality
Design dimension
Perceived Usefulness, Perceived Ease of Use
Environmental dimension
Diversity in Assessment, Learner Perceived Interaction with other, University support and Services
Integration of web services with E-Learning for knowledge societyFeedback/Evaluation, Technological Infrastructure, Communication tools, Resources Knowledge Sharing, Content Course Management, Knowledge content/digital resources, Suitable ELearning environment [52]
Measuring information, System and Service Qualities for the Evaluation of E-Learning Systems in PakistanSystem quality, service quality, information quality, user satisfactionDeLone and McLean information systems[15]
Factors Influence e-Learning Utilization in Jordanian Uni. Academic Staff PerspectivesSelf-Efficacy, Facilitation Conditions, Technology Facilitating Conditions, Resource Facilitating Conditions, Facilitating Government SupportDecomposed Theory of Planned Behavior (PBC)[13]
Assessment criteria of E-learning environments qualityContent of e-platform course, e-platform modules, tools for content delivery, technological features, management tools [53]
Service quality perceptions in higher education institutions: the case of a Colombian universityQuality of the object (education or research itself), Quality of the Process, Quality of infrastructure, Quality of interaction and communication, Quality of the atmosphere5Qs Model (originally proposed by Zineldin 2006)[54]
A hybrid approach to develop an analytical model for enhancing the service quality of e-learningHuman resource, Operating abilities, Service process, Information requirements, Management system, Curriculum development, Teaching materials, Instructional design, Instructional process, Navigation & tracking, Instructional media, Instructor support, Technology, Evaluation [14]
A model for measuring e-learning systems success in universitiesTechnical quality of the system, Educational quality of the system, Content and Information quality, Service quality, User satisfaction, Intention to use, Use of the system, loyalty to system, Intention to use, Goals achievementDeLone and McLean information systems[29]
Using SERVQUAL to assess the quality of e-learning experienceAssurance, Empathy, Responsiveness, Reliability, Web site content, E-learning quality, Satisfaction, Behavioral intentions, Grade expectationsSERVQUAL,
Behavioral intention
[31]
How do Students Measure Service Quality in e-learning A Case Study Regarding an Internet-based Universitylearning process, administrative processes, teaching
materials and resources, User’s interface, Relationships with the community network, Fees and compensations
Critical Incident Technique (CIT)[55]
Learners’ acceptance of e-learning in South Korea: Theories and resultsInstructor characteristics, Teaching materials, Design of learning contents, Playfulness, Perceived usefulness, Perceived ease of use, Intention to use e-learning.TAM[28]

References

  1. Naveed, Q.N.; Qureshi, M.N.; Shaikh, A.A.; Alsayed, O.; Sanober, S.; Mohiuddin, K. Evaluating and Ranking Cloud-based E-Learning Critical Success Factors (CSFs) using Combinatorial Approach. IEEE Access 2019, 157145–157157. [Google Scholar] [CrossRef]
  2. Agrawal, S. A Survey on Recent Applications of Cloud Computing in Education: COVID-19 Perspective. J. Phys. Conf. Ser. 2021, 1828, 12076. [Google Scholar] [CrossRef]
  3. Davrena, F.; Gotter, F. Technological Development and Its Effect on IT Operations Cost and Environmental Impact. Int. J. Sustain. Eng. 2021, 1, 12. [Google Scholar]
  4. Naveed, Q.N.; Ahmad, N. Critical Success Factors (CSFs) for Cloud-Based e-Learning. Int. J. Emerg. Technol. Learn 2019, 14, 1. [Google Scholar] [CrossRef]
  5. AlAjmi, Q.; Arshah, R.A.; Kamaludin, A.; Al-Sharafi, M.A. Developing an Instrument for Cloud-Based E-Learning Adoption: Higher Education Institutions Perspective. In Advances in Computer, Communication and Computational Sciences; Springer: Singapore, 2021; pp. 671–681. [Google Scholar]
  6. Naveed, Q.N.; Hoda, N.; Ahmad, N. Enhancement of E-Learning performance through OSN. In Proceedings of the 2018 IEEE 5th International Conference on Engineering Technologies and Applied Sciences (ICETAS), Bangkok, Thailand, 22–23 November 2018; IEEE: Bangkok, Thailand, 2018. [Google Scholar]
  7. Sarbaini, S. Managing e-learning in public universities by investigating the role of culture. Manag. E-LEARNING PUBLIC Univ. BY Investig. ROLE Cult. 2019, 20, 1. [Google Scholar]
  8. Al-Fraihat, D.; Joy, M.; Masa’deh, R.; Sinclair, J. Evaluating E-learning Systems Success: An Empirical Study. Comput. Hum. Behav. 2019, 102, 67–86. [Google Scholar] [CrossRef]
  9. QNaveed, N.; Muhammad, A.; Sanober, S.; Qureshi, M.R.N.; Shah, A. A Mixed Method Study for Investigating Critical Success Factors (CSFs) of E-Learning in Saudi Arabian Universities. Int. J. Adv. Comput. Sci. Appl. 2017, 8, 171–178. [Google Scholar]
  10. Sawangchai, A.; Prasarnkarn, H.; Kasuma, J.; Polyakova, A.G.; Qasim, S. Effects of covid-19 on digital learning of entrepreneurs. POLISH J. Manag. Stud. 2020, 22, 2. [Google Scholar] [CrossRef]
  11. Smolkag, K.; Slusarczyk, B.; Kot, S. The role of social media in management of relational capital in universities. Prabandhan Indian J. Manag. 2016, 9, 34–41. [Google Scholar] [CrossRef]
  12. Naveed, Q.N.; Qureshi, M.R.N.; Tairan, N.; Mohammad, A.; Shaikh, A.; Alsayed, A.O. Evaluating critical success factors in implementing E-learning system using multi-criteria decision-making. PLoS ONE 2020, 15, e0231465. [Google Scholar] [CrossRef]
  13. Khasawneh, M. Factors Influence e-Learning Utilization in Jordanian Universities—Academic Staff Perspectives. Procedia—Soc. Behav. Sci. 2015, 210, 170–180. [Google Scholar] [CrossRef] [Green Version]
  14. Wu, H.Y.; Lin, H.Y. A hybrid approach to develop an analytical model for enhancing the service quality of e-learning. Comput. Educ. 2012, 58, 1318–1338. [Google Scholar] [CrossRef]
  15. Kanwal, F.; Rehman, M. Measuring Information, System and Service Qualities for the Evaluation of E-Learning Systems in Pakistan. Pak. J. Sci. 2016, 68, 302–307. [Google Scholar]
  16. Alam, M.M.; Ahmad, N.; Naveed, Q.N.; Patel, A.; Abohashrh, M.; Khaleel, M.A. E-Learning Services to Achieve Sustainable Learning and Academic Performance: An Empirical Study. Sustainability 2021, 13, 2653. [Google Scholar] [CrossRef]
  17. Nemati, B.; Gazor, H.; MirAshrafi, S.; Ameleh, K. Analyzing e-service quality in service-based website by E-SERVQUAL. Manag. Sci. Lett. 2002, 2, 727–734. [Google Scholar] [CrossRef]
  18. Gazor, H.; Nemati, B.; Ehsani, A.; Ameleh, K. Analyzing effects of service encounter quality on customer satisfaction in banking industry. Manag. Sci. Lett. 2012, 2, 859–868. [Google Scholar] [CrossRef]
  19. Uppal, M.A.; Ali, S.; Gulliver, S.R. Factors determining e-learning service quality. Br. J. Educ. Technol. 2018, 49, 412–426. [Google Scholar] [CrossRef]
  20. Haryaka, U.; Agus, F.; Kridalaksana, A.H. User satisfaction model for e-learning using smartphone. Procedia Comput. Sci. 2017, 116, 373–380. [Google Scholar]
  21. Kimiloglu, H.; Ozturan, M.; Kutlu, B. Perceptions about and attitude toward the usage of e-learning in corporate training. Comput. Hum. Behav. 2017, 72, 339–349. [Google Scholar] [CrossRef]
  22. Delone, W.H.; McLean, E.R. The DeLone and McLean model of information systems success: A ten-year update. J. Manag. Inf. Syst. 2003, 19, 9–30. [Google Scholar]
  23. Wang, Y.-S.; Wang, H.-Y.; Shee, D.Y. Measuring e-learning systems success in an organizational context: Scale development and validation. Comput. Hum. Behav. 2007, 23, 1792–1808. [Google Scholar] [CrossRef]
  24. Venkatesh, V.; Davis, F.D. A theoretical extension of the technology acceptance model: Four longitudinal field studies. Manag. Sci. 2000, 46, 186–204. [Google Scholar] [CrossRef] [Green Version]
  25. Lee, Y.-H.; Hsieh, Y.-C.; Hsu, C.-N. Adding innovation diffusion theory to the technology acceptance model: Supporting employees’ intentions to use e-learning systems. J. Educ. Technol. Soc. 2011, 14, 124–137. [Google Scholar]
  26. Ali, S.; Uppal, M.A.; Gulliver, S.R. A conceptual framework highlighting e-learning implementation barriers. Inf. Technol. People 2018, 31, 156–180. [Google Scholar] [CrossRef]
  27. Mahboobi, M.R.; Shirkhani, S.; Sharifzade, M. Evaluation of the Quality of Educational Services in Entrepreneurship Course, Using SERVQUAL Model (Case Study: Gorgan University of Agricultural Sciences and Natural Resources). J. Entren. Agric. 2020, 6, 86–97. [Google Scholar]
  28. Lee, B.C.; Yoon, J.O.; Lee, I. Learners’ acceptance of e-learning in South Korea: Theories and results. Comput. Educ. 2009, 53, 1320–1329. [Google Scholar] [CrossRef]
  29. Hassanzadeh, A.; Kanaani, F.; Elahi, S. A model for measuring e-learning systems success in universities. Expert Syst. Appl. 2012, 39, 10959–10966. [Google Scholar] [CrossRef]
  30. Parasuraman, A.; Zeithaml, V.; Berry, L. SERVQUAL: A multiple-item scale for measuring consumer perceptions of service quality. Retail. Crit. Concepts 2002, 64, 140. [Google Scholar]
  31. Udo, G.J.; Bagchi, K.K.; Kirs, P.J. Using SERVQUAL to assess the quality of e-learning experience. Comput. Hum. Behav. 2011, 27, 1272–1283. [Google Scholar] [CrossRef]
  32. Hadullo, K.; Oboko, R.; Omwenga, E. A model for evaluating e-learning systems quality in higher education in developing countries. Int. J. Educ. Dev. Using ICT 2017, 13, 185–204. [Google Scholar]
  33. L-Sabawy, A.Y.A. Measuring E-Learning Systems Success; University of Southern Queensland: Queensland, Australia, 2013. [Google Scholar]
  34. Halawi, L.A.; McCarthy, R.V.; Aronson, J.E. An empirical investigation of knowledge management systems’ success. J. Comput. Inf. Syst. 2008, 48, 121–135. [Google Scholar]
  35. Brata, A.H.; Amalia, F. Impact Analysis of Social Influence Factor on Using Free Blogs as Learning Media for Driving Teaching Motivational Factor. In Proceedings of the 4th International Conference on Frontiers of Educational Technologies, Moscow, Russian, 25–27 June 2018; pp. 29–33. [Google Scholar]
  36. Lee, M.K.O.; Cheung, C.M.K.; Chen, Z. Acceptance of Internet-based learning medium: The role of extrinsic and intrinsic motivation. Inf. Manag. 2005, 42, 1095–1104. [Google Scholar] [CrossRef]
  37. Stuss, M.M.; Woszczyna, K.S.; Makiela, Z.J. Competences of graduates of higher education business studies in labor market I (results of pilot cross-border research project in Poland and Slovakia). Sustainability 2019 11, 4988. [CrossRef] [Green Version]
  38. Frankfort-Nachmias, C.; Nachmias, D. Study Guide for Research Methods in The Social Sciences; Macmillan: New York, NY, USA, 2007. [Google Scholar]
  39. Malhotra, N.K. Marketing Research: An Applied Orientation, 5/e; Pearson Education India: Delhi, India, 2008. [Google Scholar]
  40. Fowler, F.J., Jr. Applied Social Research Methods Series; SAGE Publications: Thousand Oaks, CA, USA, 2003. [Google Scholar]
  41. Hayes, B.E. Measuring Customer Satisfaction and Loyalty: Survey Design, Use, and Statistical Analysis Methods; ASQ Quality Press: Milwaukee, WI, USA, 2008. [Google Scholar]
  42. Hair, J.; Black, W.; Babin, B.; Anderson, R. Exploratory Factor Analysis. In Multivariate Data Analysis, 7th Pearson New International ed; UK Pearson Educ: Harlow, UK, 2014. [Google Scholar]
  43. Fornell, C.; Larcker, D.F. Evaluating structural equation models with unobservable variables and measurement error. J. Mark. Res. 1981, 18, 39–50. [Google Scholar] [CrossRef]
  44. Henseler, J.; Ringle, C.M.; Sarstedt, M. A new criterion for assessing discriminant validity in variance-based structural equation modeling. J. Acad. Mark. Sci. 2015, 43, 115–135. [Google Scholar] [CrossRef] [Green Version]
  45. Cenfetelli, R.T.; Bassellier, G. Interpretation of formative measurement in information systems research. MIS Q. 2009, 33, 689–707. [Google Scholar] [CrossRef]
  46. Asoodar, M.; Vaezi, S.; Izanloo, B. Framework to improve e-learner satisfaction and further strengthen e-learning implementation. Comput. Hum. Behav. 2016, 63, 704–716. [Google Scholar] [CrossRef]
  47. Al-Joodeh, M.N.A.; Poursalimi, M.; Lagzian, M. Mediating Role of Student Satisfaction on the Relationship between Educational Quality, Service Quality and the Adoption of E-Learning. J. Econ. Manag. Perspect 2017, 11, 1772–1779. [Google Scholar]
  48. Nulty, D.D. The adequacy of response rates to online and paper surveys: What can be done? Assess. Eval. High. Educ. 2008, 33, 301–314. [Google Scholar] [CrossRef] [Green Version]
  49. Zhang, T.; Shaikh, Z.A.; Yumashev, A.V.; Chlkad, M. Applied Model of E-Learning in the Framework of Education for Sustainable Development. Sustainability 2020, 12, 6420. [Google Scholar] [CrossRef]
  50. Cidral, W.A.; Oliveira, T.; di Felice, M.; Aparicio, M. E-learning success determinants: Brazilian empirical study. Comput. Educ. 2018, 122, 273–290. [Google Scholar] [CrossRef] [Green Version]
  51. Nikolić, V. Survey of quality models of e-learning system. Phys. A Stat. Mech. Appl. 2018, 511, 324–330. [Google Scholar] [CrossRef]
  52. Pattnayak, J.; Pattnaik, S. Integration of web services with e-learning for knowledge society. Procedia Comput. Sci. 2016, 92, 155–160. [Google Scholar] [CrossRef] [Green Version]
  53. Grigoracs, G.; D\uanciulescu, D.; Sitnikov, C. Assessment criteria of e-learning environments quality. Procedia Econ. Financ. 2014, 16, 40–46. [Google Scholar] [CrossRef] [Green Version]
  54. Cardona, M.M.; Bravo, J.J. Service quality perceptions in higher education institutions: The case of a colombian university. Estud. Gerenc. 2012, 28, 23–29. [Google Scholar] [CrossRef] [Green Version]
  55. Martínez-Argüelles, M.; Castán, J.; Juan, A. How do students measure service quality in e-learning? A case study regarding an internet-based university. In Proceedings of the 8th European Conference on eLearning 2009 (ECEL 2009), Bari, Italy, 29–30 October 2009; Volume 8, pp. 366–373. [Google Scholar]
Figure 1. Cloud E-Learning SQ Model (E-LSQM).
Applsci 11 04176 g001
Figure 2. Conceptual model for E-Learning Service Quality.
Applsci 11 04176 g002
Figure 3. Structural Path Model Coefficient.
Applsci 11 04176 g003
Figure 4. Path Coefficient Diagram; (a) Information Quality to Actual System Usage; (b) Reliability to Actual System Usage; (c) Perceived Ease of Use to Actual System Usage; and (d) Social influence to Actual System Usage.
Applsci 11 04176 g004
Table 1. Demographic profile of respondents.
n%
GenderMale17837.6
Female29662.4
Age (in Years)Under 188417.7
18–2117637.1
22–2514230.0
Above 257215.2
E-Learning Experience (in Years)Less than 126656.1
1–212927.2
3–55411.4
More than 5255.3
Types of E-Learning SystemBasics13428.3
Blended-116635.0
Blended-2214.4
Blended-3255.3
Full E-Learning12827.0
Area of StudyMedical and Health Science14330.2
Engineering and Computer Science20543.2
Humanities and Social Sciences12626.6
Daily use of E-Learning (in hours)Less than 18016.9
1–218338.6
3–410722.6
More than 410421.9
Table 2. Factor analysis (OU), reliability (α), composite reliability (CR) and average variance extracted (AVE).
ConstructsItemsOuter
Loading
Cronbach’s
Alpha
Composite
Reliability
Average
Variance
Extracted
OL ≥ 0.70α ≥ 0.70CR ≥ 0.70AVE ≥ 0.50
Actual System UsageASU10.6910.8960.9250.712
ASU20.857
ASU30.876
ASU40.801
ASU50.807
Information QualityINQ10.7440.8670.9030.651
INQ20.810
INQ30.805
INQ40.820
INQ50.809
Perceived Ease of UsePEU10.8170.9290.9460.779
PEU20.834
PEU30.827
PEU40.810
PEU50.864
ReliabilityREL10.8220.8770.9160.734
REL20.842
REL30.824
REL40.781
Social InfluenceSOI10.8390.8610.9050.705
SOI20.836
SOI30.838
SOI40.834
Table 3. Farnell–Larcker Criterion.
Actual System UsageInformation QualityPerceived Ease of UseReliabilitySocial
Influence
Actual System Usage0.824----
Information Quality0.6920.807---
Perceived Ease of Use0.7310.6780.823--
Reliability0.6370.6400.4930.826-
Social Influence0.7490.7260.8160.5480.819
Table 4. Heterotrait–Monotrait Ratio.
Actual System UsageInformation QualityPerceived Ease of UseReliabilitySocial
Influence
Actual System Usage-----
Information Quality0.766----
Perceived Ease of Use0.7140.732---
Reliability0.7080.7310.543--
Social Influence0.7340.6050.7080.630-
Table 5. Variance Inflation Factor (VIF).
Actual System UsageASU11.4051.537
ASU22.408
ASU31.174
ASU41.342
ASU52.232
Information QualityINQ11.8092.670
INQ21.483
INQ32.933
INQ42.249
INQ52.207
Perceived Ease of UsePEU12.6602.135
PEU21.384
PEU32.391
PEU41.817
PEU52.867
ReliabilityREL12.0351.739
REL22.265
REL32.026
REL41.699
Social InfluenceSOI11.9822.632
SOI22.187
SOI31.963
SOI42.015
Table 6. T-Test with a Significance Level.
Hypo.Pathβ ValueT Statisticsp ValuesDecision
H1Information Quality–
Actual System Usage
0.1292.3530.019Accept
H2Perceived Ease of use–
Actual System Usage
0.2915.925<0.001Accept
H3Reliability–Actual System Usage0.2616.162<0.001Accept
H4Social Influence–Actual System Usage0.2745.312<0.001Accept
Publisher’s Note: MDPI stays neutral with regard to jurisdictional claims in published maps and institutional affiliations.

