1. Introduction
Much attention is currently being devoted to the personalization of e-learning systems [
1,
2,
3]. However, there are some challenges in developing personalized learning systems. One of the challenges is the adaptation of learning material to fit learners’ needs and the improvement of learning efficiency [
1,
3]. This includes task identification and selection of the right difficulty level [
4,
5]. Only tasks of the right complexity increase a learner’s motivation and cause a state of flow. Flow is “the state in which people are so intensely involved in an activity that nothing else seems to matter; the experience itself is so enjoyable that people will do it even at great cost, for the sheer sake of doing it” [
4]. One way to feel the flow is “when a person’s skills are fully involved in overcoming a challenge that is just about manageable, so it acts as a magnet for learning new skills and increasing challenges. If challenges are too low, one gets back to flow by increasing them. If challenges are too great, one can return to the flow state by learning new skills” [
5]. Therefore, learners need to be given tasks and learning material of the right complexity which are presented in the right order. To achieve this, an adaptive knowledge assessment system that would propose questions based on previous correct and/or incorrect answers in real-time is needed. However manual design and monitoring of students’ learning paths are resource-consuming and time-inefficient tasks, and automation is preferable in this area [
6]. In adaptive learning, the same learning material might be presented in a different form or different order to provide an individualized learning path. Therefore, it is important to store learning material in a form suitable for reuse and transformation into different forms.
The need for resource reuse and usage variety is very noticeable in the knowledge evaluation area: the same question/task can be used in different courses or tests; the purpose of the testing might vary from knowledge evaluation to self-assessment, etc. Therefore, this paper aims to increase e-evaluation resource adaptability, mimicking the face-to-face evaluation feature to select the next question based on evaluative purposes and a given student’s response to a current task. To achieve this goal, the following key challenges have to be resolved:
Find the appropriate structure to store a tasks dataset for usage in adaptive learning.
Offer automatic test transformation/generation from the stored tasks dataset, dedicated for different purpose knowledge assessment tests.
By solving these rising challenges, new ideas were proposed in this paper. One idea involved the improvement of the competence tree-based structure for a more accurate competence difficulty ranking. Another one involved two different transformations from a competence tree-based structure to a graph-based e-evaluation structure. Those transformations support any material reusability requirement and, at the same time, increase e-evaluation adaptability, as they incorporate different approaches for e-evaluation. All the mentioned ideas allow for a transition from human-based learning resource reusability to different forms and/or purpose knowledge evaluations resources.
The structure of the paper is as follows. Related works in the field of adaptive learning and automated knowledge evaluation are reviewed in
Section 2.
Section 3 presents new ideas for the improvement of the competence tree to increase its adaptability for automated e-evaluation.
Section 4 presents proposed methods dedicated to transforming the competence tree into different graph-based automated e-evaluation systems. The proposed storage structure and transformations are validated in
Section 5 by comparing the results with contextual graphs and their transformations. The paper is summarized with the conclusion and future works section.
2. Related Works
2.1. Existing Models for Adaptive E-Learning
The development of e-learning environments has highlighted the importance of setting learners’ initial levels of knowledge to provide course material appropriate to these levels of knowledge. Jagadeesan and Subbiah [
1] created a skill-based e-learning environment in which all learners, after a skill test (which consists of five questions), are categorized into three levels (basic, normal, and advanced). Learning content is provided only based on skill evaluation reports. Unfortunately, this solution lacks dynamics. As such, Athanasiadis et al. [
2] developed a “Learning’ platform” to introduce a personalization mechanism that automatically changes system complexity levels based on the flow of the student who interacts with the platform. Meanwhile, Nabizadeh et al. [
3] describe two approaches to maximize user grades for a course while respecting their time constraints. These approaches recommend successful paths based on available time and a user’s initial knowledge level.
Troussas et al. [
7] present a hybrid model for detecting misconceptions using machine learning, as well as a technique for automatically modeling student learning and forgetting processes using a fuzzy inference system. The fuzzy inference system takes as input the level of knowledge of each student in one language and can diagnose his/her level of knowledge in another language. This allows the system to create an adaptive learning environment for each student. Hariyanto and Kohler [
8] take not one input but propose an adaptive e-learning system based on different inputs for learning style and initial knowledge of learners, as measured by a preliminary evaluation across five sections. If the evaluation result meets or exceeds the standard grade set by the teacher, the student passes the section. If the result does not correspond to the standard grade, the student does not pass the section. These conditions affect the appearance of links in the menu area.
Some researchers in e-learning systems have suggested adapting tests to learners’ levels of knowledge. Mustakerov and Borissova [
9] suggested an educational web-based e-evaluation system, which can be used by students for self-evaluation or by tutors for official examination. The test questions are marked as easy or advanced. This allows students to choose easy, advanced, or all questions in passing modes. Arif et al. [
10] expanded this approach and proposed a multilayer, intelligent, agent-based architecture for e-evaluation and e-learning systems. They increased test difficulty levels to three (easy, medium, and difficult) and divided them further into sub-levels to filter students who could take the difficult test. The easy level was divided into five sub-levels and the medium level was divided into three sub-levels. A learner first has to pass three easy level sub-tests and two sub-tests from medium level, and only then will they be able to take the advanced level tests.
All these examples of adaptive e-learning and e-evaluation demonstrate a different logic that might be used for learning path construction, as well as different levels of adaptability which might be implemented, from material selection based on knowledge evaluation marks to an adaptive selection of further steps or tasks.
2.2. Data Structures Used for E-Evaluation Tests and Its Tasks Storage
To create an adaptive knowledge assessment system, the presentation of tasks must be carried out semantically. It is important to prepare the tasks and to establish the correct relationships between them. For this reason, it is important to choose the right task for storage structure.
P. Brezillon [
11,
12] suggests using contextual graphs for real-time decision making. According to P. Brezzilon, “the contextual graph is a context-based representation of a task execution” and, as it is an acyclic graph, a user’s tasks are usually arranged in order [
13]. From these properties, it can be used to form a way of presenting tasks in adaptive tests. As such, Aukstakalnis et al. [
14] used the contextual graph in simulation-based e-evaluation systems.
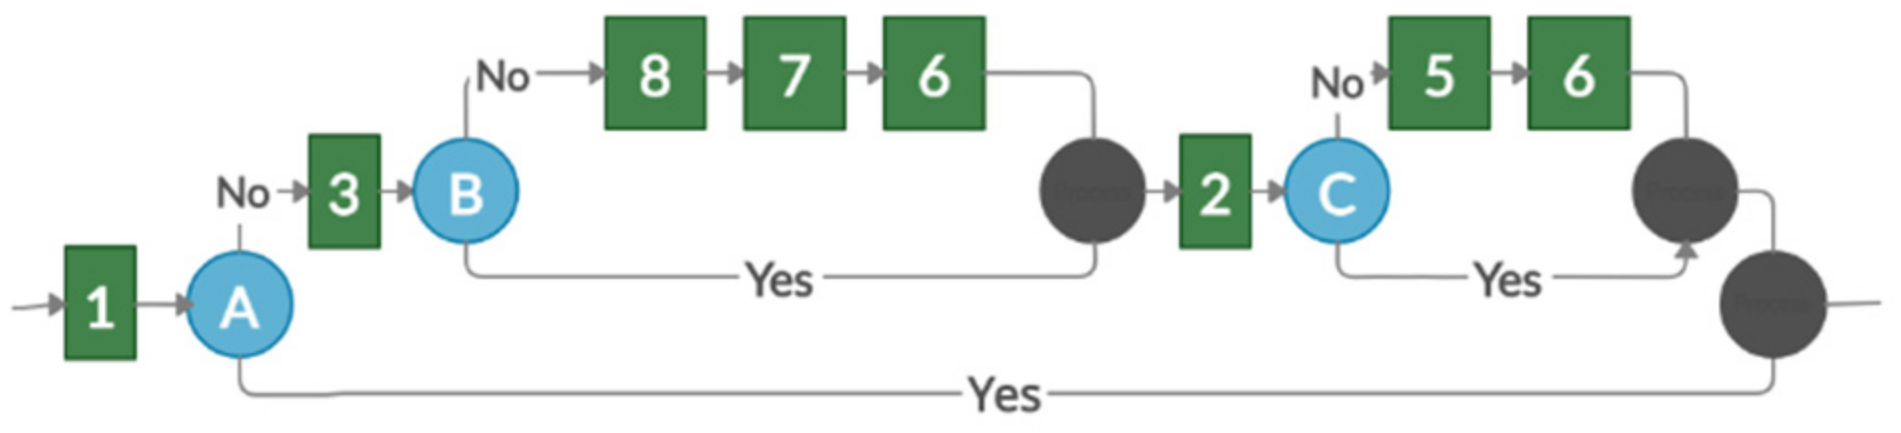
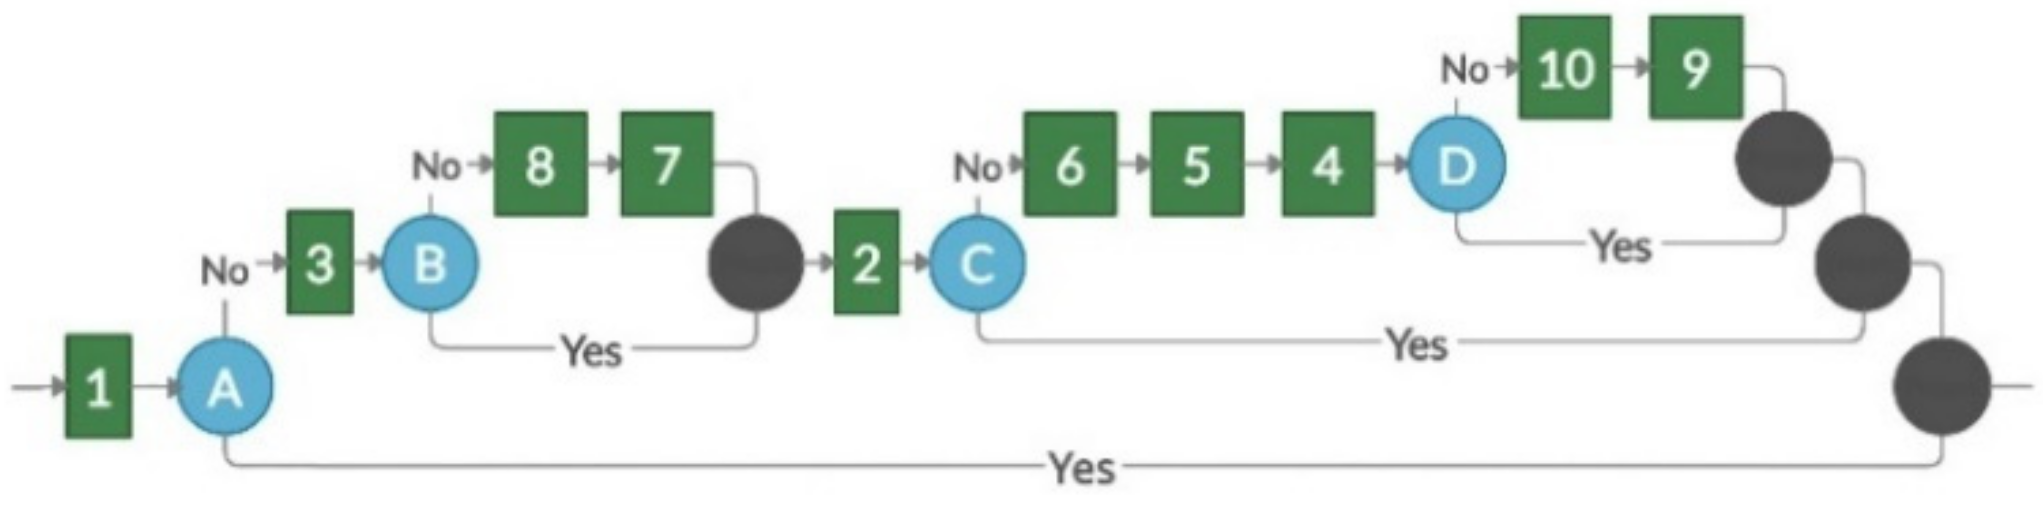
Figure 1 provides a simple example that demonstrates the use of a contextual graph in task selection.
The contextual graph in
Figure 1 depicts two types of objects: actions and contextual elements. The action is the basis for modeling, according to the detail provided (represented by a green square). The contextual element is a pair of nodes—contextual and recombination (contextual nodes are shown in blue numbered circles and recombinant nodes are depicted in black circles). Contexts have one input and
N outputs corresponding to
N known values of the contextual element. A recombination node is a ratio of [
N, 1], to which the instantiation of the contextual element does not matter [
15]. The numbers on the action elements are identifiers that indicate which element from the competency tree is represented in the context graph. Capital letters identify contextual nodes.
Liang et al. [
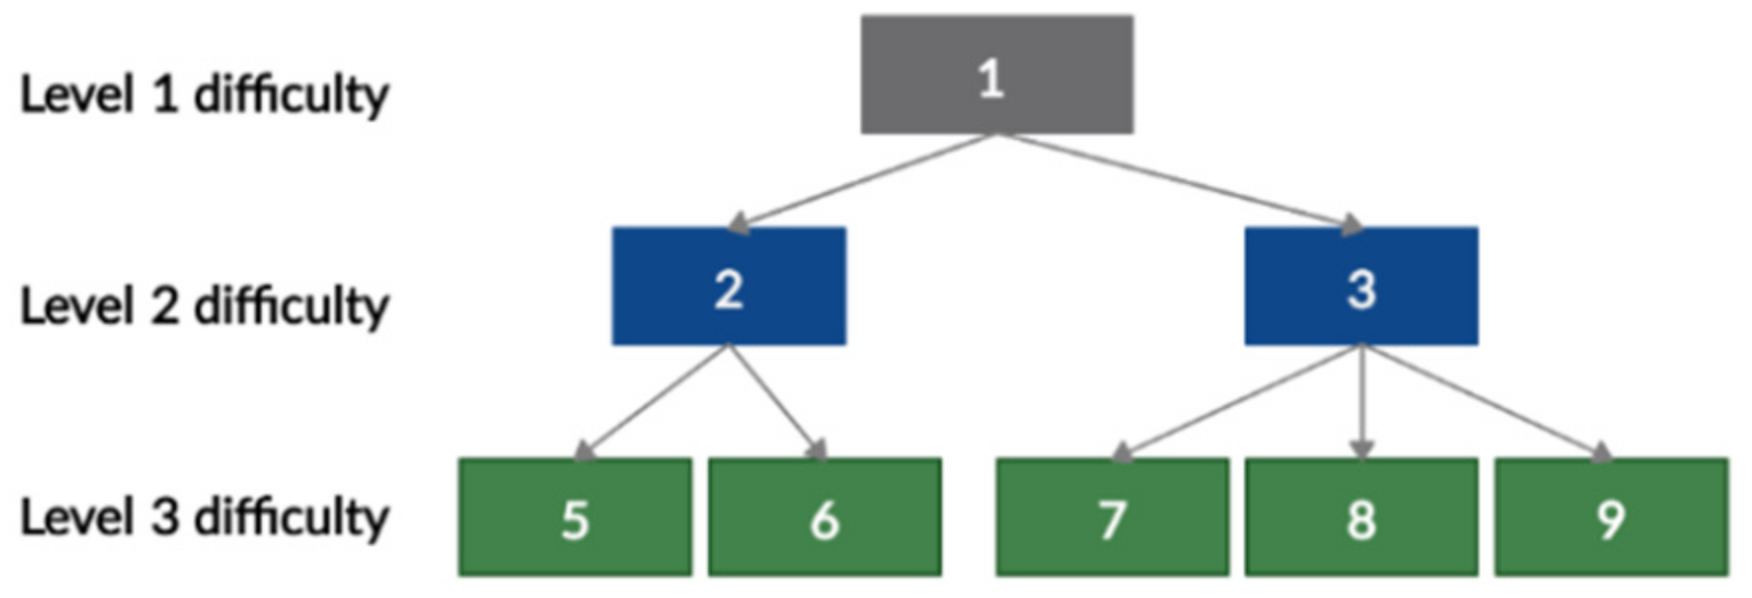
16] argue that a hierarchy-based structure is well-suited for assessing students with different levels of preparation. More advanced students can skip easier (lower level) tasks and start with more difficult (higher level) tasks. Ramanauskaite and Slotkiene [
17] suggest that the competence tree is suitable for developing a study program, a course, or for evaluating students. An example of a competency tree is shown in
Figure 2. The competence “1” is the most advanced, as it requires an integration of both competencies “2” and “3”; these two competencies have an internal composition of other competencies. Each task is associated with one or multiple competencies in the tree. Therefore, a tree of tasks can be generated from it.
The use of a competence tree for adaptive knowledge evaluation is also useful for teachers, because, when it is used:
It is convenient to check whether appropriate tasks of different complexity have been prepared to check all competencies.
Once properly designed, it can be used to create tests for a variety of course topics, and it eliminates the need to recreate test tasks for each topic, as the instructor only needs to select the required tree branches or indicate the appropriate level of complexity of the tasks.
The connections between tasks are presented.
However, the competence tree presents the relationship between different levels as parent–child, and there is no logic for the definition of the relationship between the same level of competencies.
2.3. Existing Task Dataset Form Transformation Methods
Hong et al. [
18] state that a series–parallel graph can be represented as a decomposition tree. Since contextual graphs also belong to series–parallel graphs, a contextual graph can also be transformed into a decomposition tree [
19].
A contextual graph can be difficult to follow when performing tasks that involve many contextual elements arranged in a graph [
15,
19]. For this reason, Kimberly García and Patrick Brézillon proposed a transformation method from a contextual graph to a practice tree [
15]. Experimentally, they found that this method works well with a graph of a predominant parallel structure, but, if the graph is of a predominant series structure, then a tree is obtained with hundreds or thousands of branches that are almost identical and differ from one other in just a few steps. Such a tree can be difficult to analyze and quickly identify relationships between nodes. A generated “Practice Tree” image file is too large to display on a normal-sized screen, and software performance in computing the tree also decreases. Thus, decision makers are encouraged to create contextual graphs with a parallel structure. However, it has been observed that novice users typically create graphs with a predominant series structure.
Papers on competence tree transformation to graph have not been noticed in scientific papers yet.
3. Proposed Competence Tree Improvements for Increase of Tasks Dataset Flexibility
One idea of competence tree-based e-evaluation is a student’s ability to select the learning path by themselves [
17]. However, this approach has its limitations as, in some situations, the learning path flexibility is not acceptable or is in conflict with the student’s profile. Sometimes learning paths should be generated to minimize a student’s choices. While learning path generation strategies vary depending on a given situation, two main student-oriented strategies for knowledge evaluation paths exist: (i) incremental knowledge evaluation [
20] and (ii) shortest path evaluation [
21].
Incremental knowledge evaluation requires taking into account task complexity and cognitive load. The evaluation path should start from simpler tasks and grow step by step to more complex tasks. Therefore, this method is more suitable for learning process personalized implementation when the base flaws of students’ knowledge are identified, and material is provided to fill the gap.
Shortest path evaluation is more appropriate for knowledge evaluation when a student should demonstrate which level of knowledge they managed to achieve. Students with sufficient knowledge prefer to do as few tasks as possible rather than repetitively demonstrate the same skills and knowledge in different tasks. Therefore, evaluation paths should start with the most complex task. If the student is not able to solve the task, the complexity could be reduced step by step to obtain the achieved knowledge level of the student.
Both of these knowledge evaluation paths take into account task complexity. However, one starts from the lowest level of complexity and increases if a student manages to solve it, while the other one starts from the highest complexity tasks and reduces the complexity if a student fails to solve it.
Contextual graphs do not directly take into account task complexity, and a learning path strategy is constructed by the test designer. Competence trees present the relative complexity of tasks in different levels of the competence tree. However, there are no data on task complexity comparisons between tasks at the same level. Therefore, we add few small adjustments to the design and storage of the competence tree:
All sub-competencies should be arranged based on their relative complexity. Therefore, in each branch of the competence tree, lower complexity tasks will be presented on the left and complexity will increase going to the right. This should be performed by the competence tree designer and might be based on personal opinion or historical data, which can be used to compare the complexity of competencies as well as tasks.
Competence should define whether a child’s competencies are sequentially dependent or independent of each other. This is required to understand whether it is worth giving a sibling task of higher complexity if the student failed the lower complexity task.
The modifications are minor; however, they are necessary for higher flexibility, adaptability, and transformation to graph-based e-evaluation solutions. The modifications require additional work from the competence tree designer. All sibling competencies should have their relative difficulty, and, in some cases, it might be difficult to identify them. However, spending time on the implementation of those modifications might generate new features for e-evaluation resource automated transformation and reusability.
4. Proposed Competence Tree Transformations to Graph-Based E-Evaluation Structure
Taking into account the different forms of knowledge evaluation path, the usage of a graph-based knowledge evaluation path in adaptive learning, and the implemented modifications for the competence tree, two main transformations from competence tree to graph-based e-evaluation structure are proposed:
From the top of the competency tree to the bottom (TBCG) for shortest path e-evaluation [
21].
From the bottom of the competence tree to the top (BTCG) for incremental knowledge e-evaluation [
20].
The above transformation will be adapted to automated knowledge evaluation only. This means each task has one possible answer which can be solved correctly or not. Therefore, it is not possible to evaluate which competence in the combined task is missing (all or nothing approach). As for presentation simplification, we assume one task will be given and its correctness will be evaluated. In practice, multiple tasks might be given, and the decision might be made based on the correctness of the tasks set.
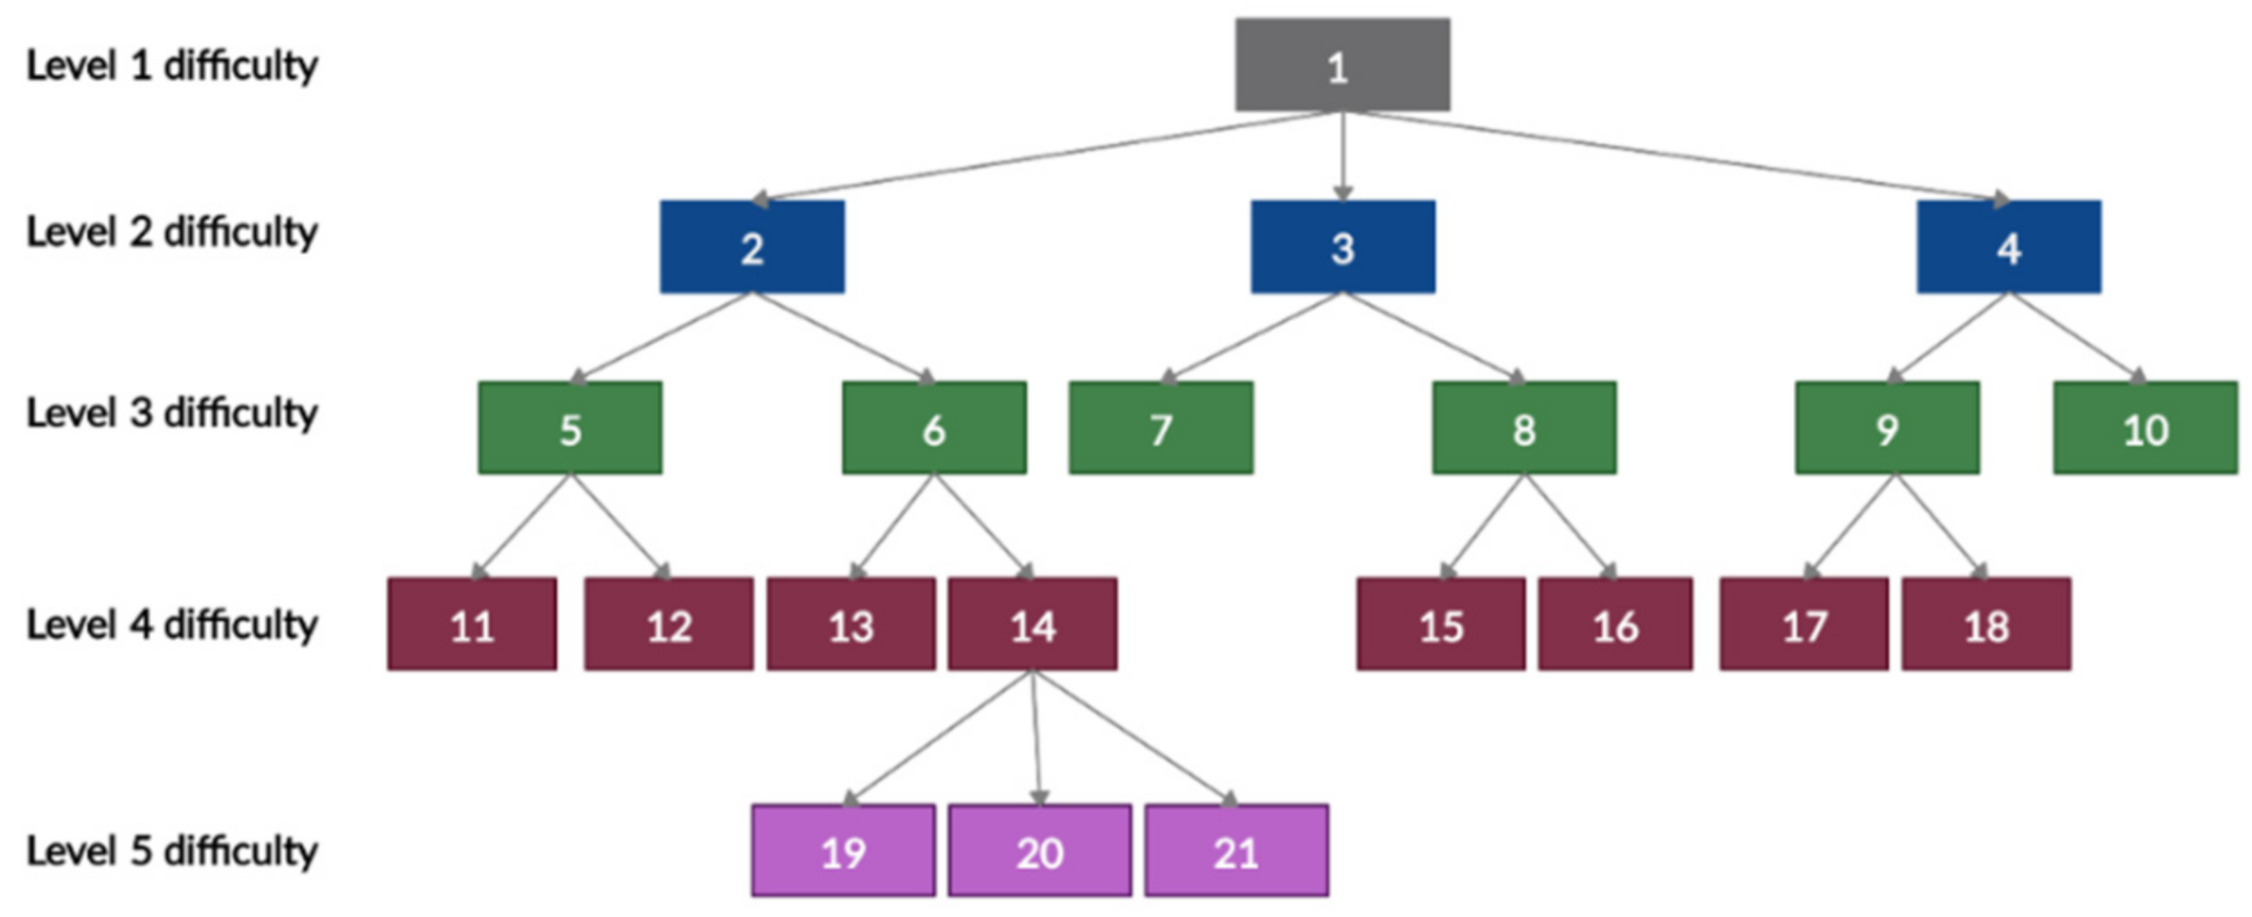
The proposed transformation will convert a competence tree-based tasks dataset to a graph-based e-evaluation structure. This will be directed to the automated generation of different contextual graphs. For visualization, we use a competence tree example, presented in
Figure 3. In this paper we do not present the exact area, presented in the competence tree, as the content of the tree does not influence the transformation, and structure is more important to inspect a transformation’s suitability.
For visualization purposes, the tree and graph notation will be used as described in
Section 2.2; tasks are notated as rectangles, with a number identifying task ID; decision making will be notated as blue or yellow circles, with a letter or number defining decision node—blue circles indicate a task as being solved correctly or not, while yellow circles indicate that it has previously been solved and now needs to go to a higher level (noted by the number, ID); the joining of several learning paths will be notated as black circles (it notates where learning paths crosses).
4.1. TBCG Transformation for Shortest Path E-Evaluation
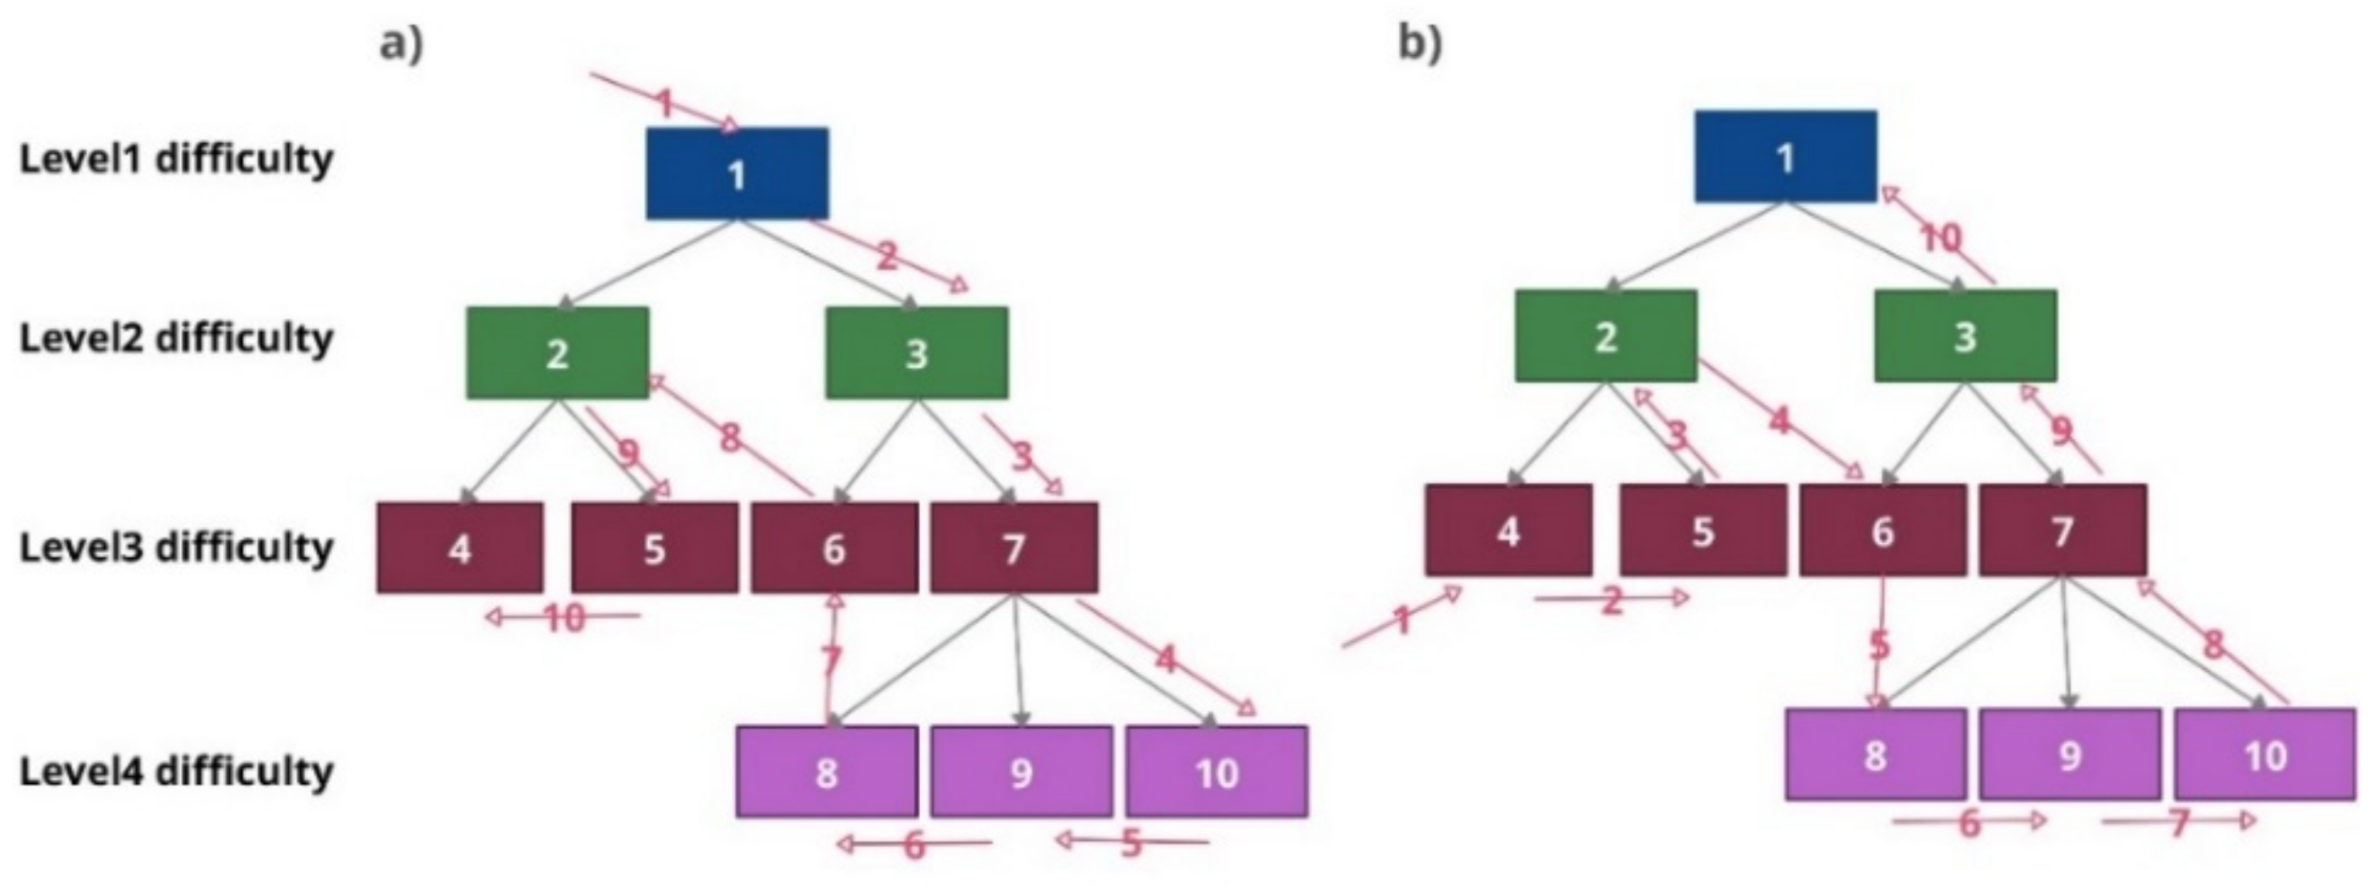
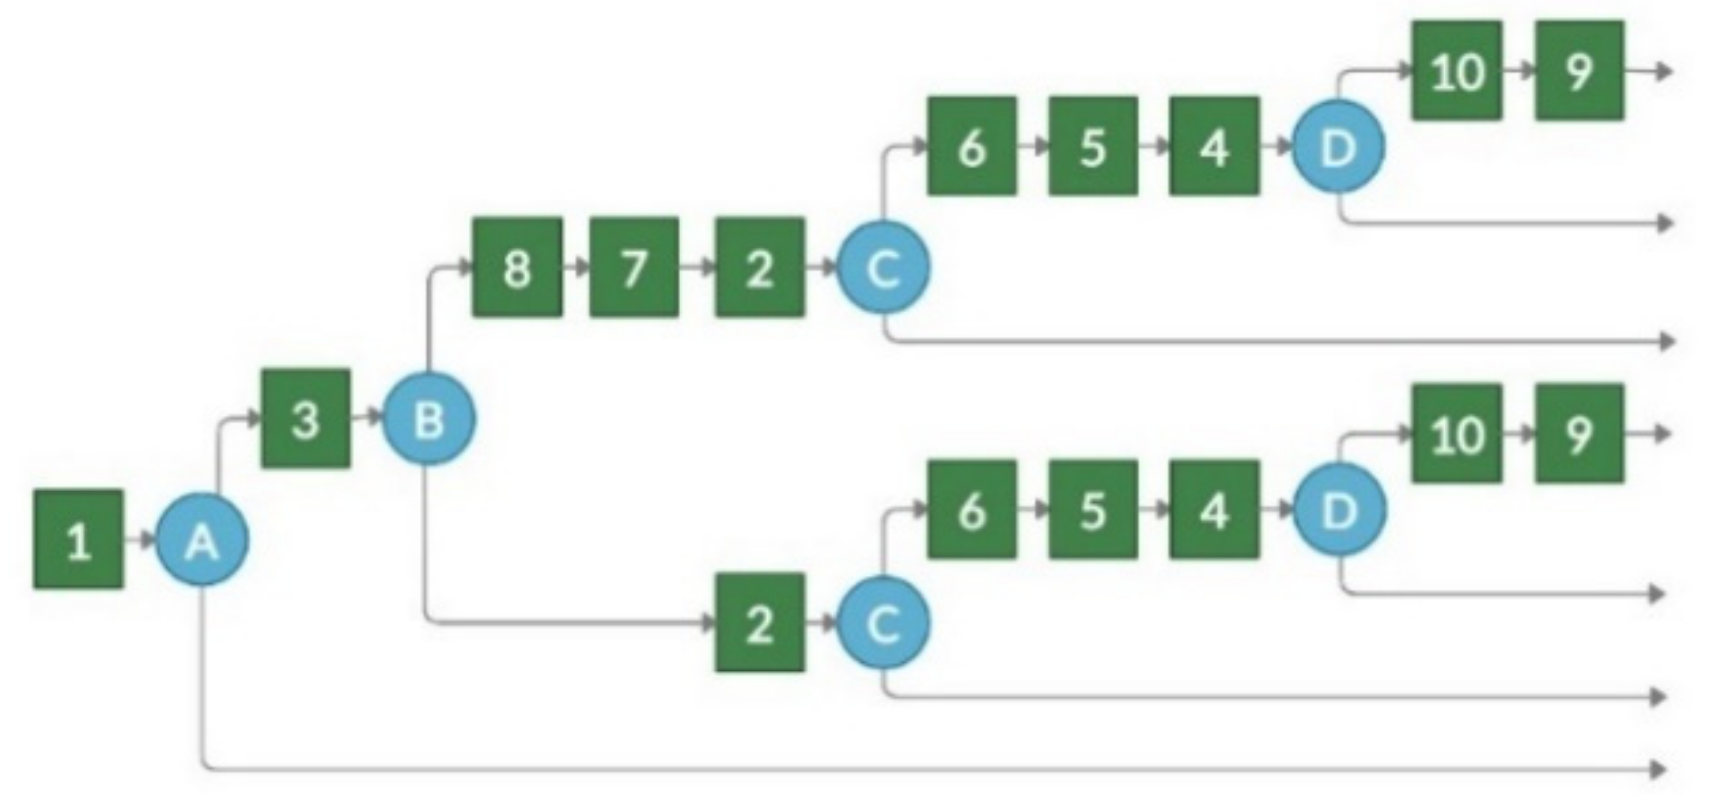
In the TBCG case, a contextual graph is started from the action of the upper node (see node 1 in
Figure 3), and then a contextual element with two branches is created. One branch refers to the actions that will be performed if the learner performs the task correctly, and the other branch points to the actions that will be performed if the task is performed incorrectly. If the task is completed correctly, e-evaluation is complete. It means the student can solve the most complex task in the test, the task which evaluates all competencies associated with the test, and, therefore, there is no need to solve other tasks.
In case the learner incorrectly solves the first task, they will need to solve all the tasks in difficulty level 2 (tasks 4, 3, and 2 in
Figure 3). This corresponds to a situation when a student is not able to apply multiple competencies at the same time; therefore, it is worth evaluating whether they are able to demonstrate each competence separately. When the learner completes all difficulty level 2 tasks correctly, e-evaluation will be completed. If they fail in any of those tasks, the evaluation path will be supplemented with lower-level competence tasks of the failed task. Therefore, after each task, the evaluation path is forked, and additional tasks are presented in case the student fails. This is repeated while the lowest levels of the competence tree are added to the graph.
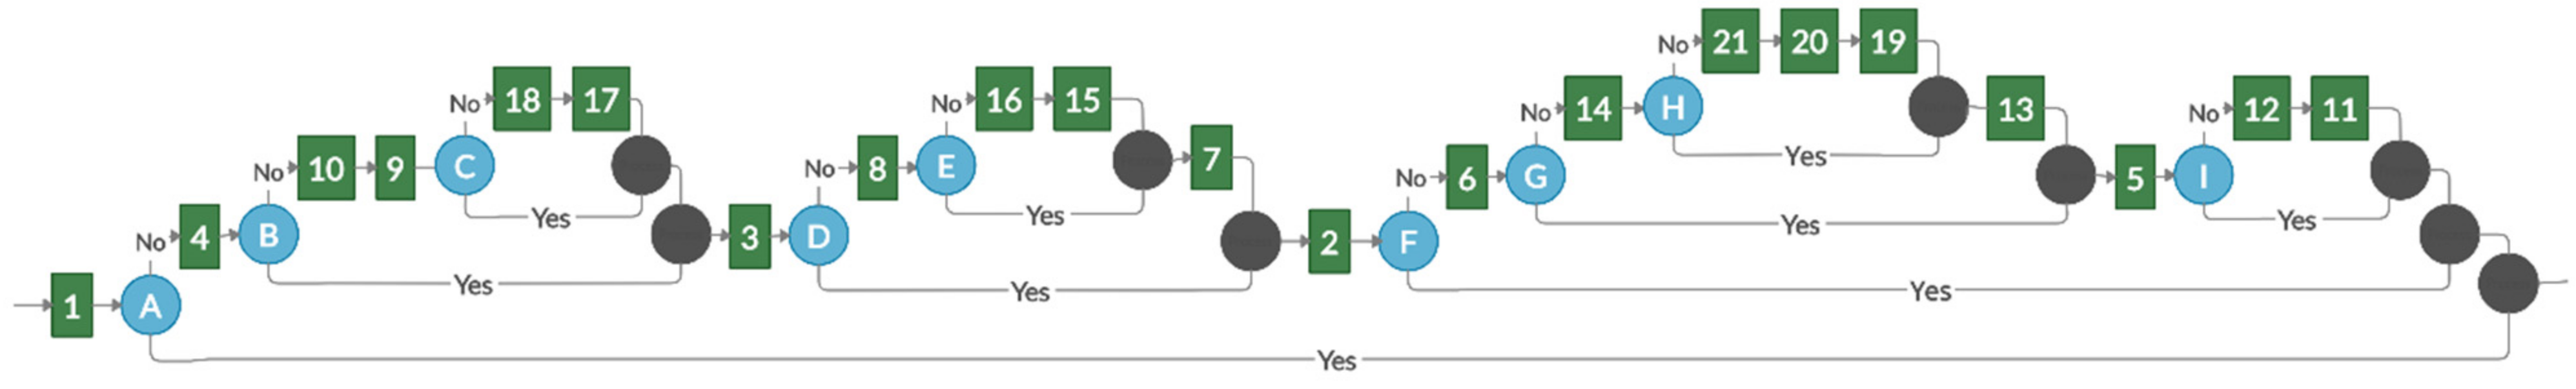
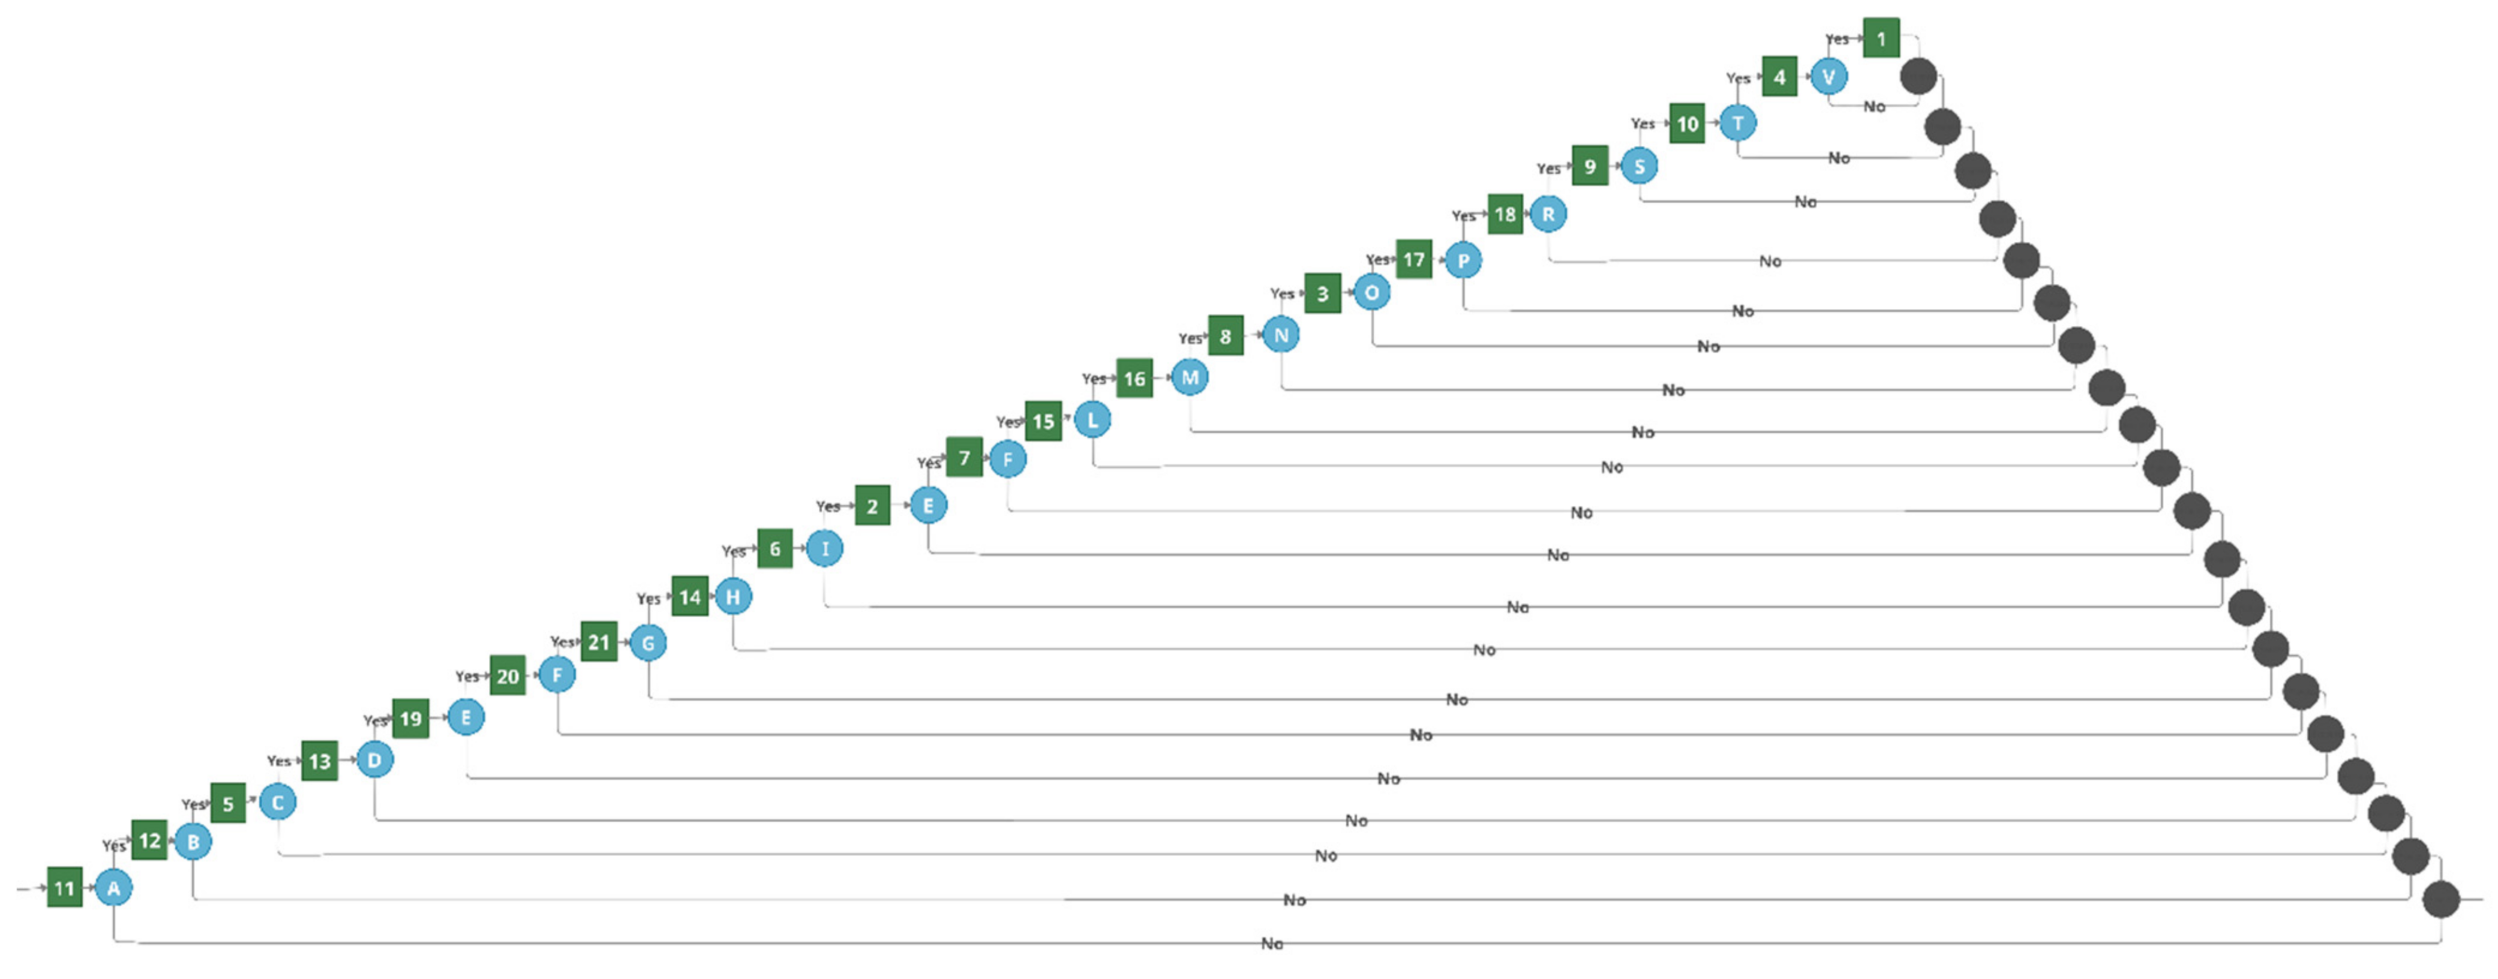
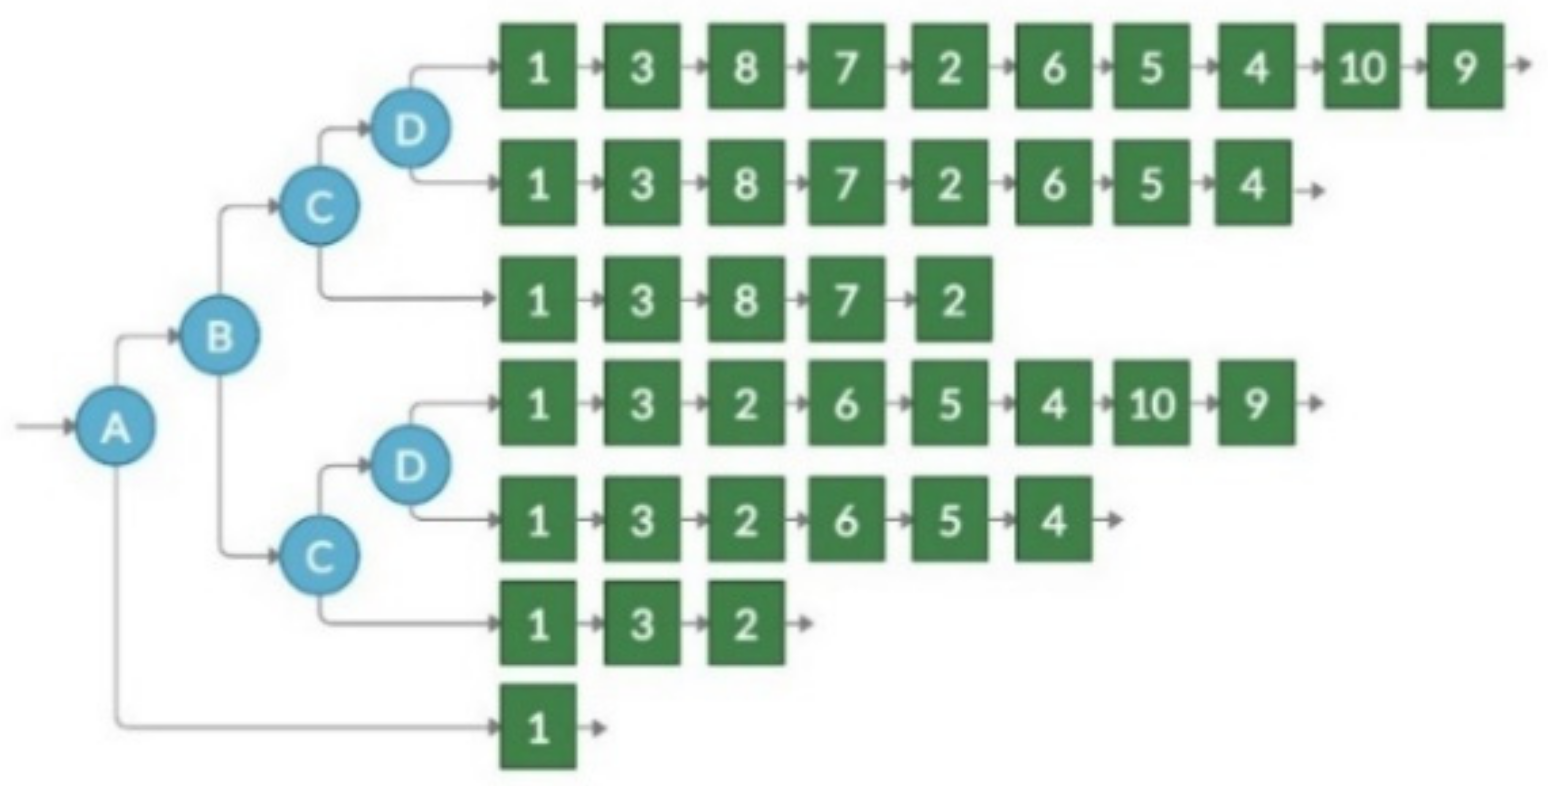
The TBCG transformation result for the example competency tree (see
Figure 3) is presented in
Figure 4, while the pseudocode of the transformation is presented in Algorithm 1.
| Algorithm 1 Pseudocode of TBCG transformation. |
| 1: | root = root competence of the competence tree |
| 2: | add task T of competence root to the test flow |
| 3: | TBCGstep(root) |
| 4: | TBCGstep(cComp) |
| 5: | if competence cComp has child competences then |
| 6: | connect T to new decision node D to indicate whether task T was solved correctly |
| 7: | add negative and positive paths for decision D, with merge in the end |
| 8: | for each child competence C of competence cComp (going from right to left) do |
| 9: | add task T of competence C to the negative path of the decision node D |
| 10: | TBCGstep(C) |
| 11: | end for |
| 12: | end if |
The TBCG transformation does not require data on child competency serial dependency. Relative difficulty is not necessary (all child competency tasks will be given to solve if the parent competency task failed); however, it would be a benefit to keep the idea of presenting tasks from more complex to lower level complexity tasks.
4.2. BTCG Transformation for Incremental Knowledge E-Evaluation
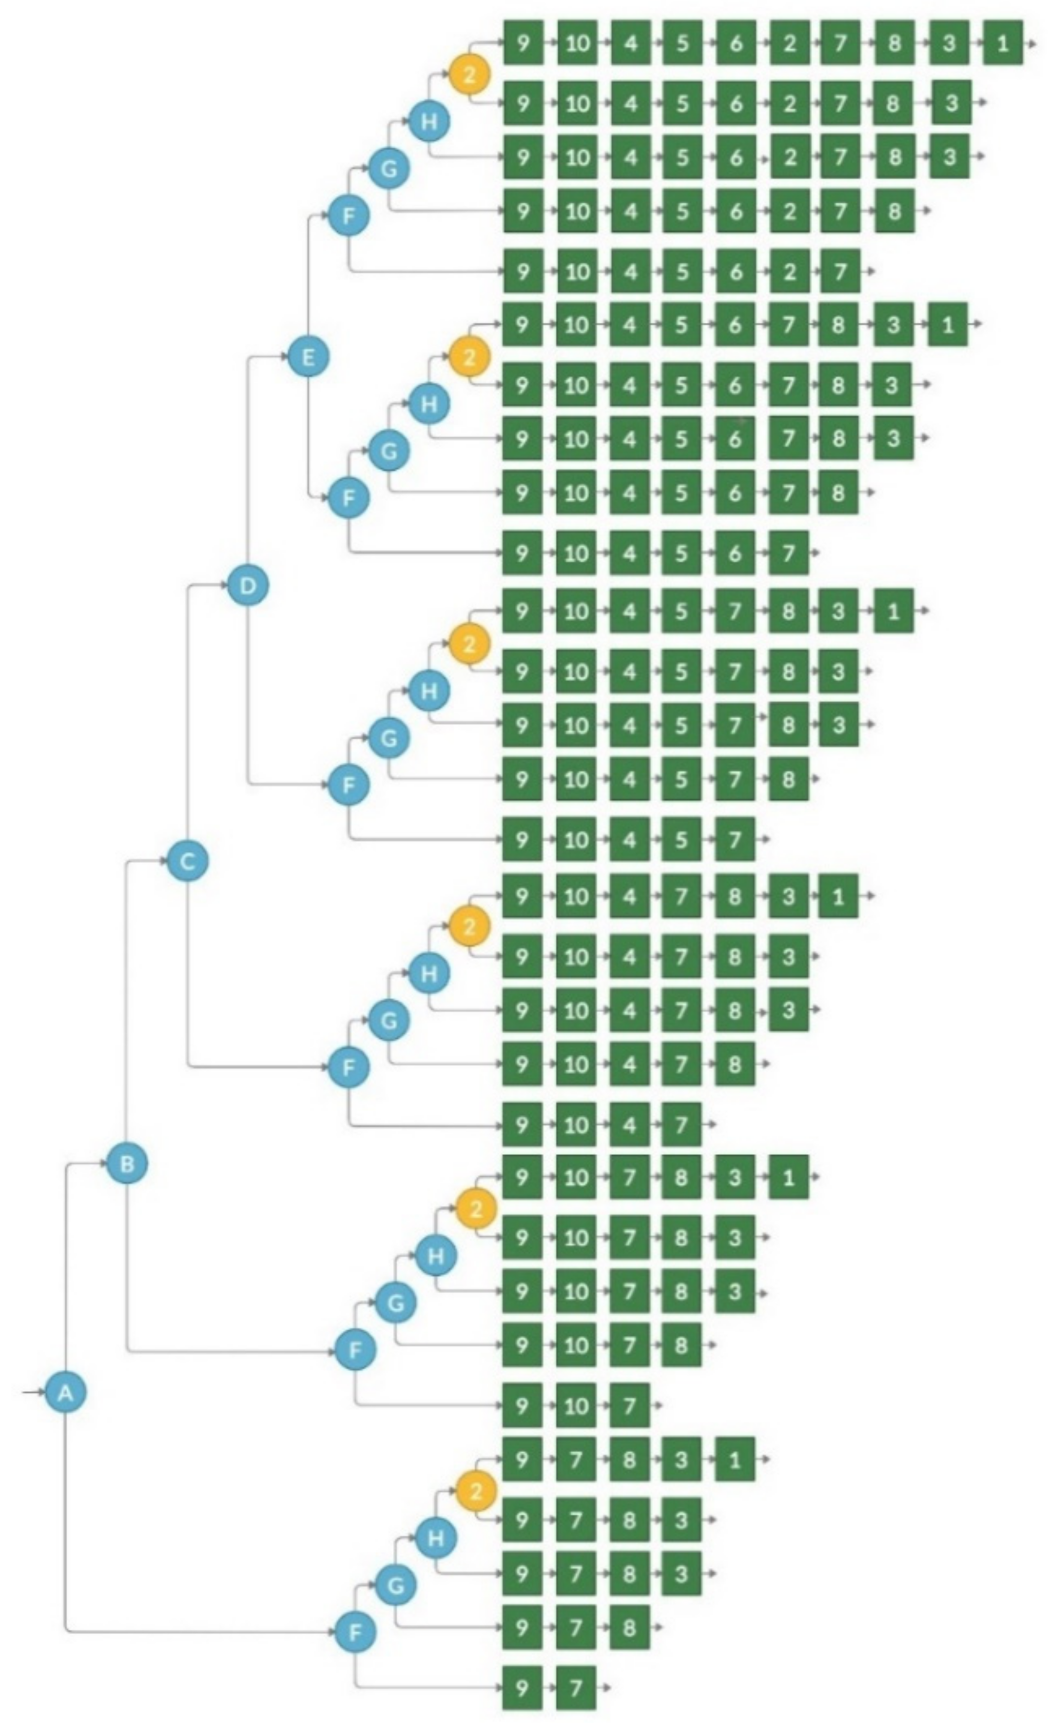
The BTCG transformation is similar to the inversion of the TBCG—tasks are presented to students from the lowest complexity to greater complexity, and only if the task is solved correctly (in TBCG transformation additional tasks were given if the student fails the task). While the task sequence in the case of all success cases in the BTCG transformation is identical to the inverted order results of the TBCG transformation in the case of all fail cases (see
Figure 5), the graph structure cannot be obtained by changing the order of the graph.
To implement BTCG transformation, the start point is the leftmost and lowest node in the competence tree, illustrating the task of lowest complexity (see node 11 in
Figure 3). If a student fails the task, the sequential dependency between sibling competencies in the tree structure must be inspected. If the sequential dependency exists at the same level, it means the student is missing essential knowledge to move further with a more difficult task, and the evaluation will be finished (as a result, material related to this missing competence will be provided for the student to obtain the needed competencies).
If sequential dependency at this level does not exist, sibling competence tasks (node 12 in
Figure 3) will be presented for the student to solve; however, the parent competence task (node 5 in
Figure 3) will not be given to the student. This is based on the idea that, without having some competence, the student will not be able to solve more difficult tasks, which include the missing competence as one of the elements in the task’s solution.
Whether the evaluation finishes after at least one fail in one level of the competency tree depends on sequential dependency in the tree structure. By recursively analyzing the parent competencies, if a competency with non-sequential dependency child competencies exists, the evaluation will not be finished. It means other competencies are independent of the ones the student failed. Therefore, it can be evaluated in the same test. Therefore, when competency with non-sequential dependency child competencies is indicated in the path to root competency, the lowest level (the most left bottom level) competency task of such competency will be added (node 7 in
Figure 3, if only node 1 has sequentially independent competencies 2, 3 and 4) to the test as an additional element in the graph.
Success means the student has the competence; therefore, more difficult tasks can be given to him or her. As such, if there is a sibling competence task in the right, it will be given to the student (see node 12 in
Figure 3), regardless of whether it is sequentially independent or not. If there are no additional sibling competencies in the right, the parent competence task (node 5 in
Figure 3) should be analyzed for presentation in the test. However, the parent competency task will be included in the test only if all child competence tasks are solved correctly. If at least one child competence task is unsuccessfully solved, it means some competencies are missing to solve the parent competence task.
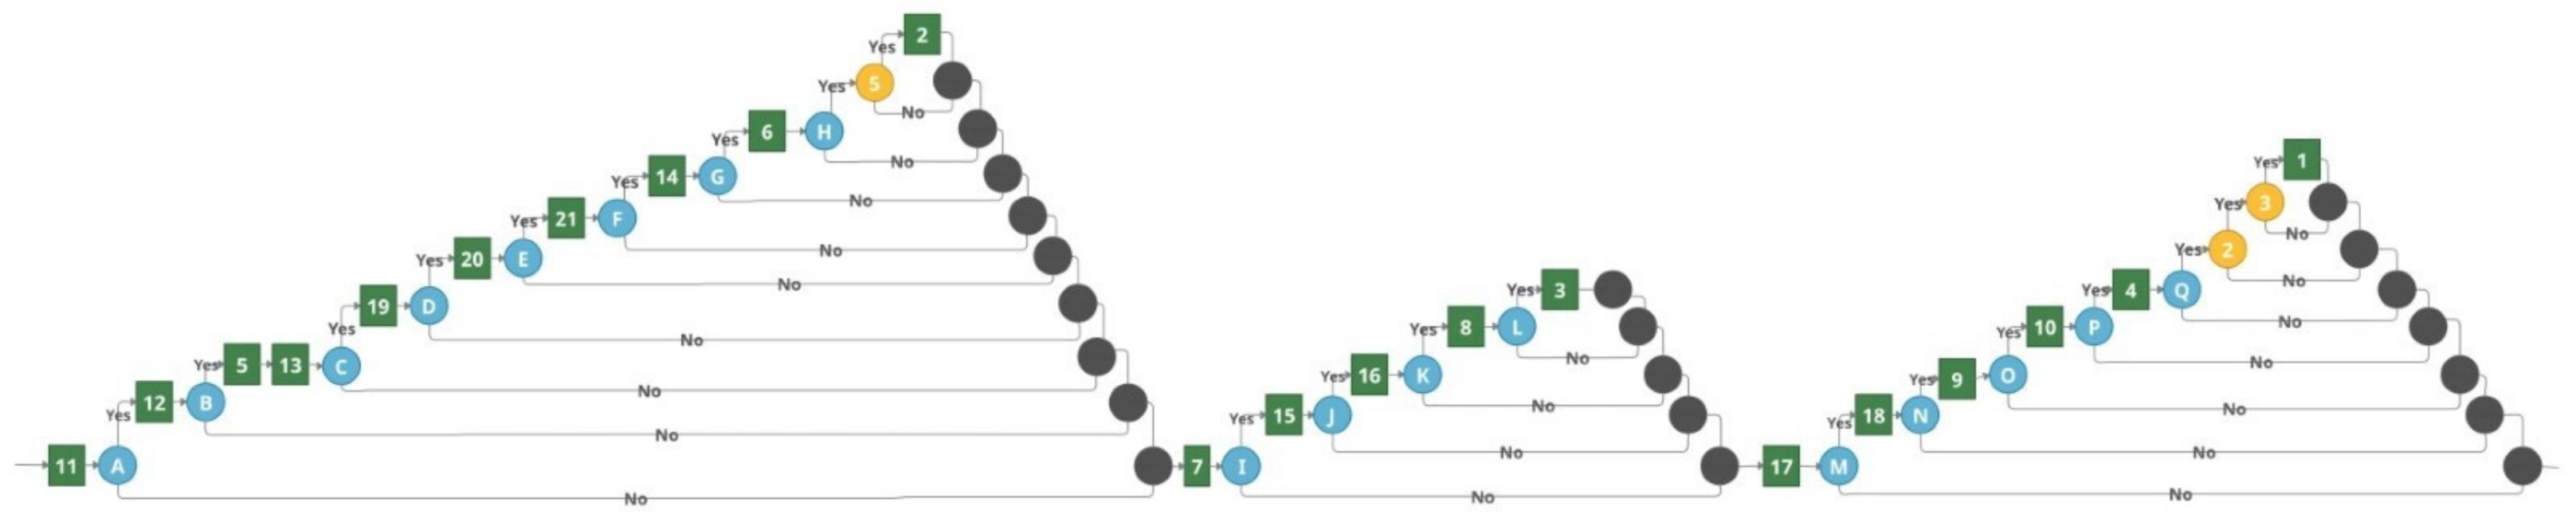
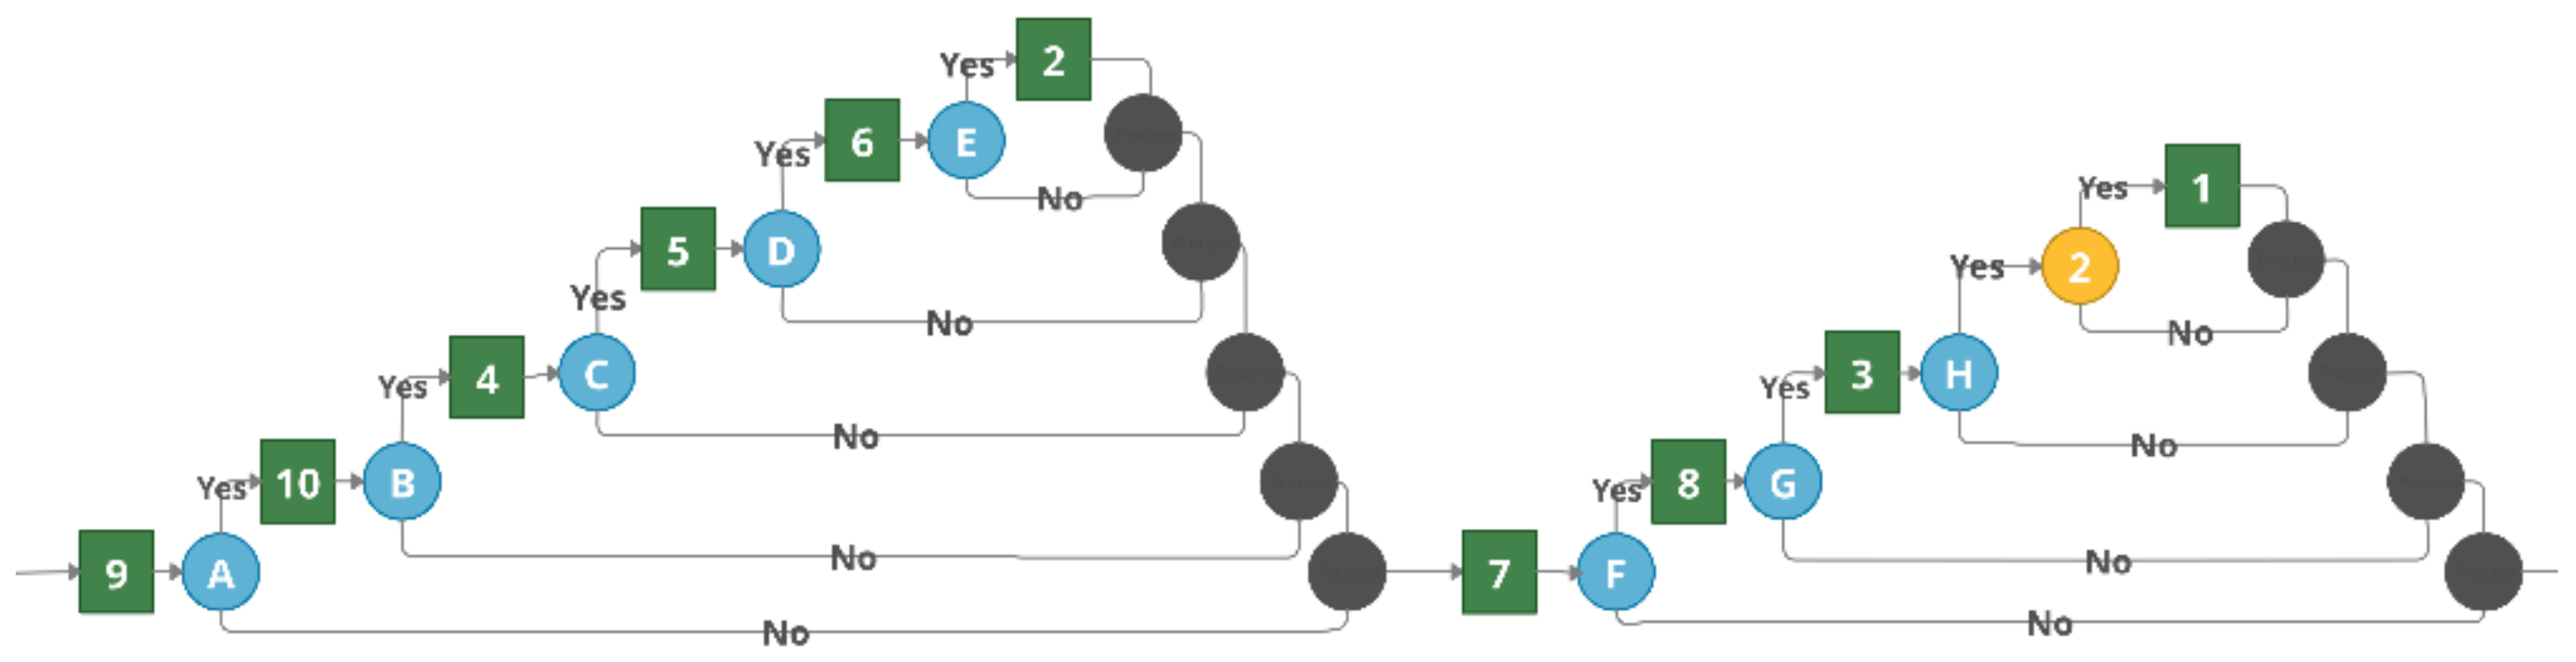
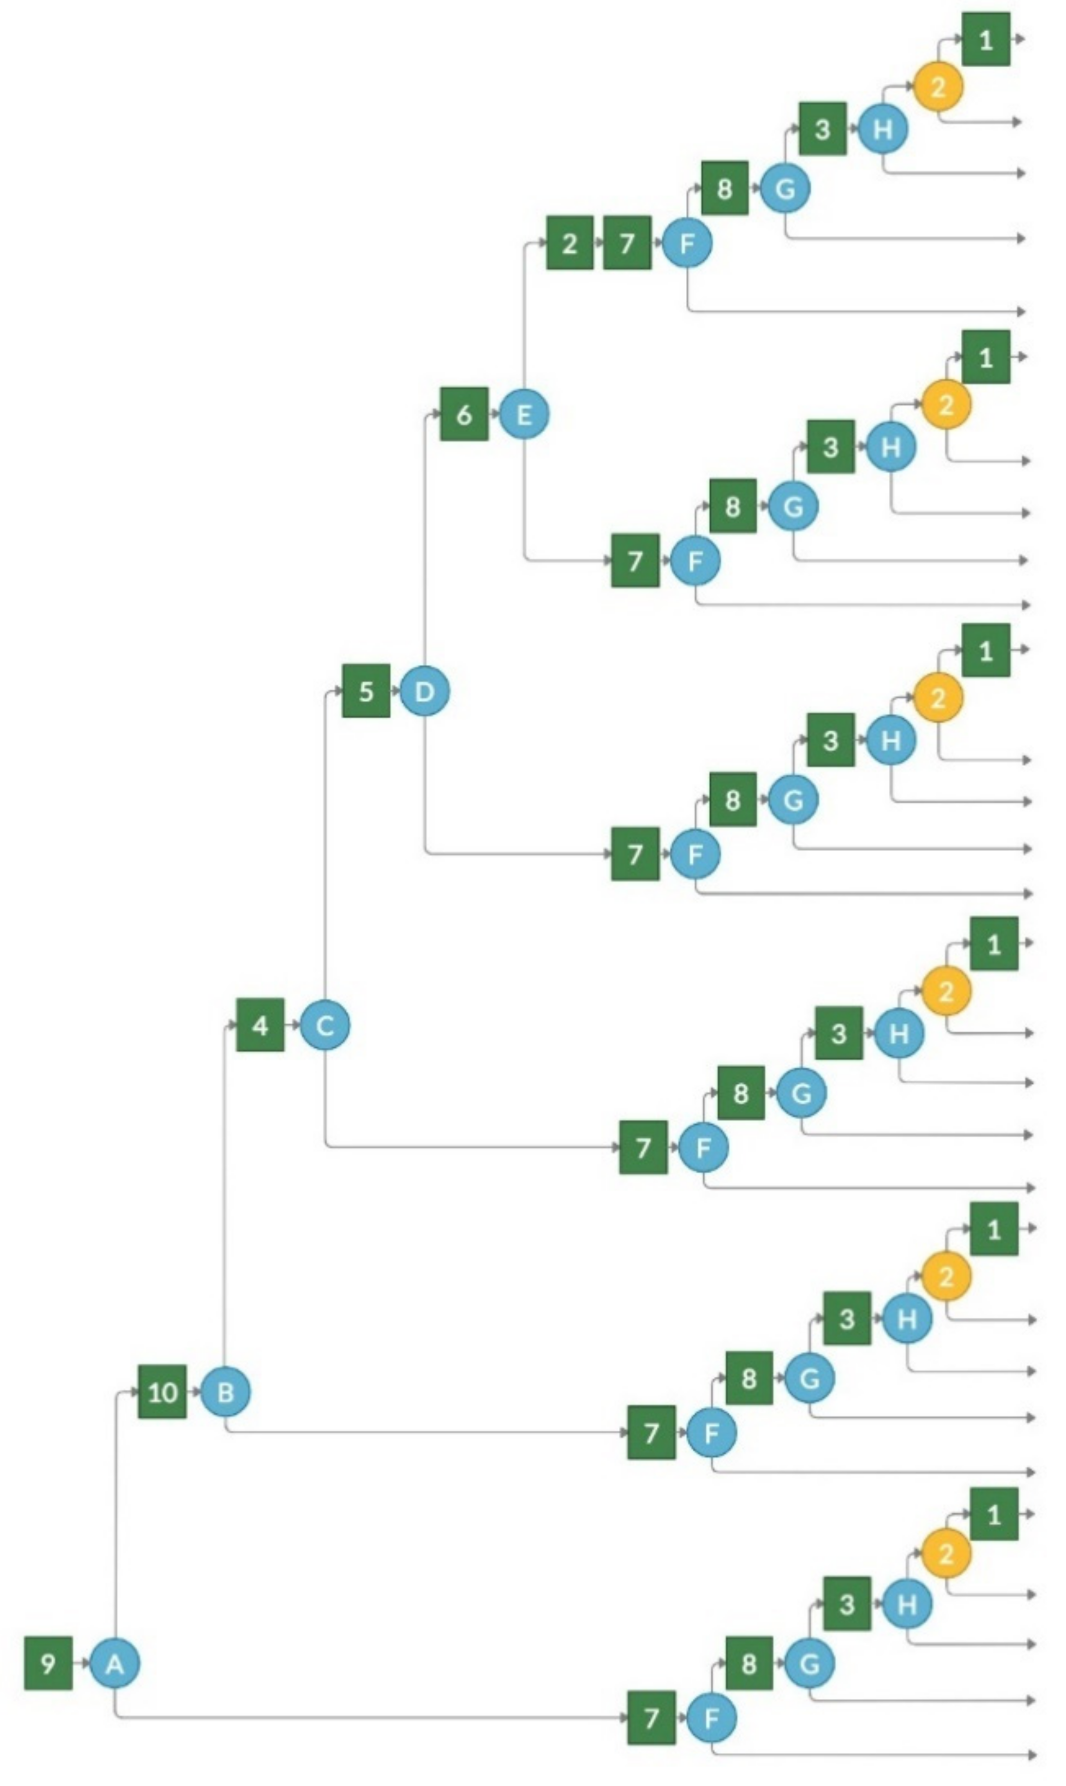
All the processes are repeated recursively for each competency included in the graph-based e-evaluation solution. The BTCG pseudocode is presented in Algorithm 2. Transformation results for the competence tree (presented in
Figure 3), when all competencies are sequentially dependent, are presented in
Figure 6. When all competencies except second level competencies (nodes 2, 3, and 4 in
Figure 3) are sequentially independent, they are transformed to different graph-based structures. The results are presented in
Figure 7.
| Algorithm 2 Pseudocode of BTCG transformation. |
| 1: | root = root element of the competence tree |
| 2: | cPath = None |
| 3: | cLast = None |
| 4: | BTCG(root, cPath, cLast) |
| 5: | BTCG(cComp, cPath, cLast): |
| 6: | if competence cComp has child competences then |
| 7: | for each child competence C of competence cComp (going from left to right) do |
| 8: | if competence C has no sequential dependency with sibling competences then |
| 9: | cPath = end of the test flow |
| 10: | end if |
| 11: | BTCG(C, cPath, cLast) |
| 12: | if cLast == None then |
| 13: | add task T of competence cComp to the test flow |
| 14: | cLast = C |
| 15: | cPath = path from task T |
| 16: | else |
| 17: | if competence C has sequential dependency with sibling competences then |
| 18: | connect cLast to new node D to indicate weather task T was solved correctly |
| 19: | add negative and positive paths for decision D |
| 20: | cPath = positive path of decision node D |
| 21: | add new task T of competence C to cPath |
| 22: | cLast = C |
| 23: | merge positive and negative flows of cPath |
| 24: | else |
| 25: | if cLast <> None then |
| 26: | connect cLast to new node D to indicate weather task T was solved correctly |
| 27: | add negative and positive paths for decision D |
| 28: | cPath = positive path of decision node D |
| 29: | add new task T of competence C to cPath |
| 30: | merge positive and negative flows of cPath |
| 31: | cPath = end of the test flow |
| 32: | cLast = None |
| 33: | else |
| 34: | add new task T of competence C to cPath |
| 35: | end if |
| 36: | end if |
| 37: | end if |
| 38: | end for |
| 39: | if competence C has no sequential dependency with sibling competences then |
| 40: | connect T to new node D to indicate whether all sibling tasks solved correctly |
| 41: | add negative and positive paths for decision D |
| 42: | cPath = positive path of decision node D |
| 43: | merge positive and negative flows of cPath |
| 44: | end if |
| 45: | end if |
| 46: | if cLast == None then |
| 47: | add new decision node D to indicate whether task all sibling tasks solved correctly |
| 48: | add negative and positive paths for decision D |
| 49: | cPath = positive path of decision node D |
| 50: | add new task T of competence C to cPath |
| 51: | merge positive and negative flows of cPath |
| 52: | else |
| 53: | add task T of competence cComp to the cPath |
| 54: | end if |
The result of BTCG transformation demonstrates strong dependency on competence complexity, as well as sequential dependency between sibling competencies. Therefore, a different output might be generated depending on these two parameters and competence tree structure.
The proposed transformations can convert any competence tree to a graph structure. However, for cases with no sequential dependencies and full sequential dependency, the generated graph structures will not ensure enough adaptability possibilities. This illustrates the transformation will not be enough for e-evaluation adaptability—the key factor is competence tree design. If all tasks have no relation and relative complexity, there will be no difference in how these tasks will be ordered into an e-evaluation system.
5. Analysis of Transformation Results and Comparison to Contextual Graph to Practice Tree Transformation
The results of the transformation might not be measured by one quantitative metric. Therefore, we summarize the transformation results with several different metrics. First of all, we measure the transformation results based on: (i) generated graph structure suitability for graph-based e-evaluation systems (does the graph starts with one action node and do all paths end up in one final node); and (ii) proportion between the number of task nodes in a graph-based e-evaluation structure and the number of task nodes in a competence tree e-evaluation structure.
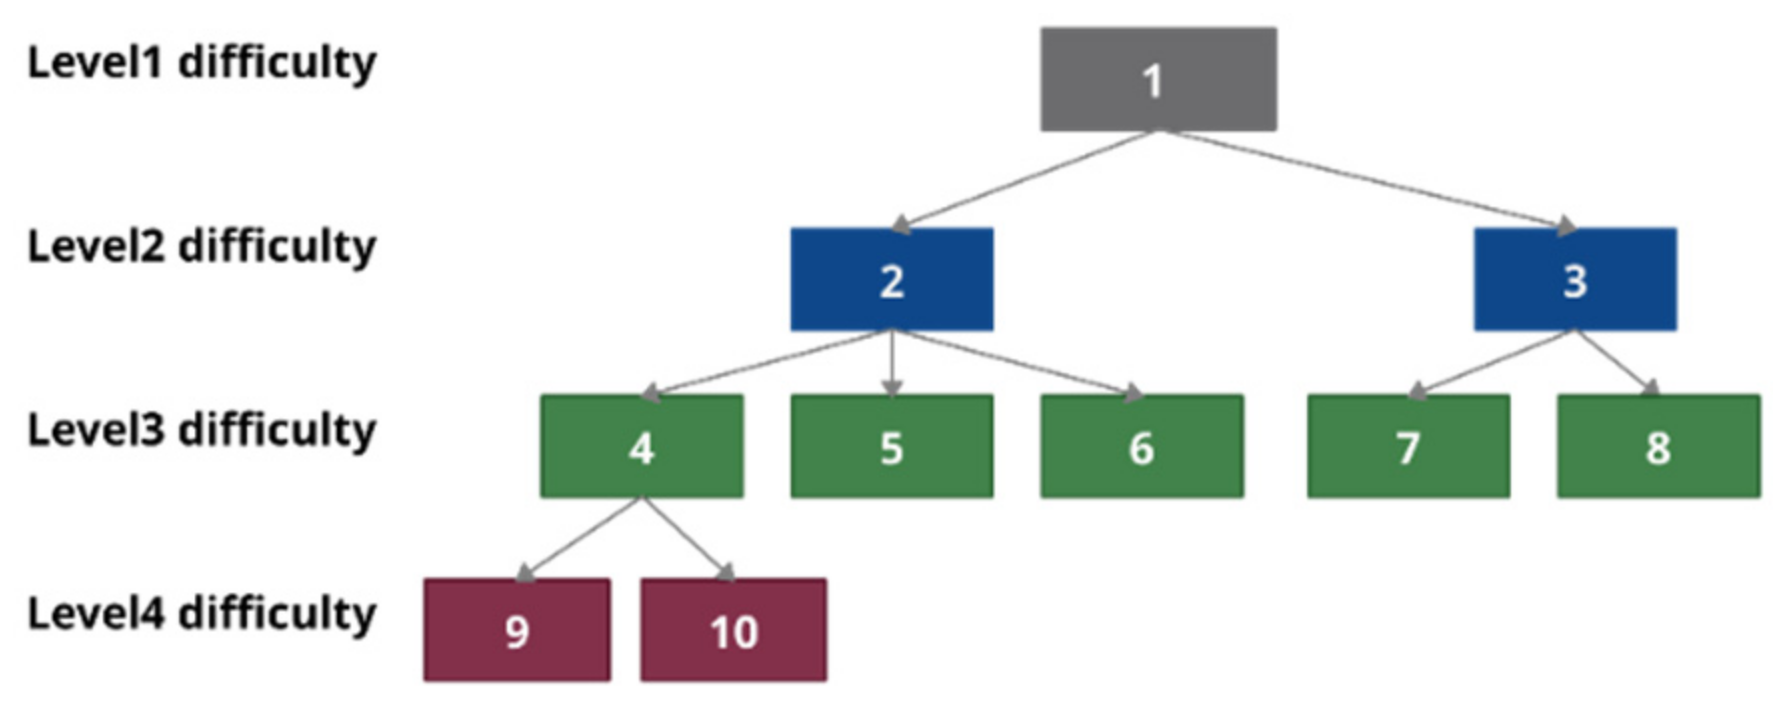
For the transformation suitability measurement, we use the example presented in
Figure 3. Additionally, a smaller competence tree was used (see
Figure 8) for the suitability measurement.
Consequently, the results of TBCG and BTCG transformation are presented in
Figure 9 and
Figure 10, respectively.
The transformation result suitability metrics are presented in
Table 1. They demonstrate all graphs are suitable for graph-based e-evaluation systems. At the same time, the generated graph has no repetition of the same tasks in different branches. It is not a very important factor for the knowledge evaluation path, however illustrated the relative storage need to store the same test resources in different formats.
To compare e-evaluation resources in a different form and transform them into another structure, and additional experiment was executed—generated graphs were used as input for transformation from a contextual graph to a Practice tree, proposed by Brezillon [
15,
19]. The BTCG transformation with full sequential dependencies was eliminated from the experiment, as the transformation result would cause no significant change to the structure.
The original solution, as well as the modified version of the Practice tree, were analyzed. A modification was needed, as the original solution generated a tree of the decision and at the end of the last decision, which presented a list of tasks that should be done. This structure is not suitable for adaptive learning, as it could take into account only user and system-related context, not the provided solutions to each of the tasks. Therefore, based on the task, sequences matching tasks in each of the paths were identified to understand its possible location in the decision tree structure. This modification allowed for the adaptation of a contextual graph transformation to a tree structure for adaptive knowledge e-evaluation purposes. However, the modification did not allow the generation of competence tree analog, as some tasks were duplicated in multiple places.
The transformation results’ suitability metrics are presented in
Table 2, while the generated trees are presented in
Appendix A.
Appendix A includes original and modified transformations from the contextual graph to Practice tree, or tree structure for graphs presented in
Figure 9 and
Figure 10. Results for
Figure 4 and
Figure 7 are not presented because of their huge number of nodes.
The transformation from contextual graphs does not produce a tree suitable to use as a competence tree—tasks are not organized based on the commodity and variation of competencies, and the same tasks are repeated in different branches of the tree. The number of test nodes’ relative storage increases approximately more than 7.5 times. The same test nodes are stores in different places of the e-evaluation tree. While, if additional tree optimization methods were not used, relative storage would be approximately more than 80 times bigger. This is not suitable for e-evaluation systems with a big number of tests and tasks in them. The number of decision nodes also increases to follow the number of repetitive task nodes.
6. Conclusions and Future Works
An analysis of existing adaptive e-evaluation solutions reveals they lack transformation from one form to another. At the same time, the existing Brezillon graph transformation to tree structure has only one possible result—there are no variations of the transformation. This leads to a problem regarding e-evaluation system adaptation to different purposes or students’ needs (personalization)—learning and evaluation processes are different; therefore, automated knowledge evaluation for self-learning and knowledge evaluation should be different as well. To increase automated e-evaluation system adaptability, more reusable e-evaluation structures should be used, with multiple transformations to different structures. This would allow the generation of different types and purpose e-evaluation solutions from the same e-learning material, and minimal resource designer interaction.
The proposed competence tree transformation to a graph-based e-evaluation structure is adapted to different students’ needs (TBCG approach for knowledge e-evaluation, while BTCG approach for adaptive learning). The generated graphs meet the requirements of a graph-based e-evaluation structure, and do not increase the e-evaluation system complexity, as the number of task nodes remains the same (no duplication of the same nodes). The existing transformation from a graph-based e-evaluation structure to a tree-based structure does not allow for a recreation of a competence tree, and drastically increases both the number of task nodes and decision nodes in the e-evaluation environment. This proves the competence tree structure is more promising for e-learning material storage, as it can be transformed into different graph-based e-evaluation solutions.
To increase e-evaluation adaptability and personalization, research on e-evaluation strategy should be executed. Research could examine learning style influence on preferred e-evaluation environments and evaluation types. Its results would allow for the identification of which type of transformation would be the best choice for a specific user and/or situation.
At the same time, the development of an e-evaluation system dedicated to different automated e-evaluation structures and their transformation would benefit the practical usage of resource reuse and evaluation adaptability. Existing tools would reduce teacher efforts to prepare adaptive evaluation tests for different purposes and, at the same time, would provide a platform to design competency-based learning material and share it with other colleagues.


