1. Introduction
The elimination of staffing and computing resource costs for companies that use Cloud Computing is one of the most notable features of this service [
1]. Its implementation in education follows the same idea, resulting in the incorporation and establishment of ICT in educational institutions [
2].
The three types of services offered by Cloud Computing are classified as SaaS (Software as a Service), PaaS (Platform as a Service), and IaaS (Infrastructure as a Service) [
3]. Among them, SaaS, where an example is email, and IaaS, where data storage is an example, are the types that started to be used in education and are now fully implemented [
4].
An important milestone in the incorporation of Cloud Computing in education has been social software 2.0, such as social networks, blogs and wikis [
5]. Their use in education has several benefits, as students are already accustomed to using these programs, and there are learning theories focused on collaboration, cooperation, and connectivism [
6].
The effect of Covid-19 on society is another significant milestone of Cloud Computing, as the use of teleworking, videoconferencing, telecare, and online teaching has increased. Cloud Computing systems have been widely used in education for the development of learning competencies that were traditionally done face-to-face [
7,
8,
9,
10,
11].
Recent studies have particular relevance in this regard, as they have performed reviews of the existing literature on the use of Cloud Computing in education. These reviews indicate and prove the need to focus on the evaluation of the specific educational benefits of this application, as well as to analyze its impact through active methodologies, such as Flipped Classroom [
12]. However, there has been a lack of research on the effect of Cloud Computing on educational processes [
13].
On the other hand, in education processes based on Cloud Computing, it acts as a mediating element between teachers and students, as it provides support for activities that enable the acquisition of learning competencies. This same support emerges from student collaboration, interaction, and the outcomes of learning tasks and activities [
14]. As a result, Cloud Computing is a place where all learning evidence can be found. The management of this evidence may form the basis of a new model, with Cloud Computing acting as a catalyst for change [
15].
This management of evidence generated by Cloud Computing in education can be done in a way that is transparent to the student. As a result, the student is aware of the progress of his or her own learning process. But transparency is a feature that is associated with new ways of teaching, such as open education and open science [
16,
17,
18]. Likewise, data transparency through open knowledge is one of the options that studies of Cloud Computing literature point to as a solution to one of Cloud Computing’s problems of data confidentiality and security [
19,
20,
21,
22].
This work applies an educational methodology based on the cooperation and interaction of students and generates evidence through a Cloud Computing system. This evidence is analyzed to determine the learning progress of each student, and this analysis is made transparent to the students through the technologies that make up the Cloud Computing system. As a result, in this research, a Cloud Computing-based training model is used, which can be applied to a variety of educational processes and approaches.
However, one of the challenges of teamwork is the difficulty in identifying evidence that can be used to measure an individual’s workload in relation to the team [
23,
24]. To be able to identify individual evidence (that affects each student), group evidence (that affects a group of students), and collective evidence (that affects the entire group of students in a class), the proposed model is implemented, along with an active learning methodology, during the development of teamwork, where the aforementioned three types of evidence are generated [
25,
26]. Finally, the proposal’s premise is that by making evidence management transparent throughout the learning process, it is possible to improve individual, group, and collective learning.
The context of this research was higher education and working specifically with students of the first academic year. To make this study transferable to any assignment, rather than focusing on the assignment in which teamwork is performed, it focuses on the student’s own acquisition of teamwork skills.
The hypothesis of research work is that transparency of individual, group, and collective evidence improves team member involvement, improves the learning of their own competence, and results in a more homogeneous involvement of different work teams.
The following section illustrates the proposed educational model, which is based on Cloud Computing and has been obtained by incorporating learning methods that have been validated in mixed training (face-to-face and distance). Following that, the context in which this research was conducted will be described. The analysis of results will continue through ongoing evaluations of learning progress and effect on student motivation, and the study will be completed by presenting the discussion and conclusions.
2. Proposal for an Educational Model Based on Cloud Computing
The proposed educational model is based on Cloud Computing. This should allow for flexibility when using it in various circumstances and educational environments, as it is structured as a series of interconnected layers that can be adapted when other methodologies are used. As a result, each layer must have a distinct capability, with clearly defined procedures, where different Cloud Computing-based methods can be used.
On the other hand, the model must allow for the following: the use of an active educational method based on Cloud Computing, the execution of processes to produce individual and collective evidence, and the analysis of evidence in real-time.
This necessarily involves a disclosure process on two levels: internally and externally to the team. Each team member can see what is going on within his or her own team on an internal level. Individual evidence (messages in the forums), group evidence (phase results), and follow-up evidence (tables that are filled in during the development) can all be used to achieve this. At the external level, each student can compare and contrast the evidence of other teams with that of his or her own. It is the responsibility of the teaching staff to share the evidence in order for this to happen. In this case, the evidence of each team’s relative participation is used, as well as the sharing of the group evidence of each team.
TRansparent InterAction in TEamwork Competence Acquisition within a cloud computing ecosystem (TRIATECA) is the proposed model’s name, and it is structured in three layers to include all of the features of cooperation, active learning, evidence generation and analysis, and decision-making transparency:
Layer 1: Learning method. It includes the training method using Cloud Computing tools and comprises educational processes such as active learning methodologies (Flipped Classroom, Gamification, and Challenge Based Learning, among others) [
27].
Layer 2: Transparency process based on evidence for teamwork. This is the method for organizing teamwork so that all interactions between students, teachers, and activity performance leave analyzable evidence [
28].
Layer 3: Evidence analysis. A Learning Analytics system is used to analyze the evidence of the interaction in layer 2 [
29].
The TRIATECA model’s layers are outlined in detail below.
2.1. Layer 1- Learning Methodology
The mission of layer 1 is to provide an active learning method based on a fully online training modality. The Hybrid Flipped Classroom method was used, which is a fully online adaptation of the Flipped Classroom method used in face-to-face training [
30].
From its inception, the Flipped Classroom method has been based on taking theory teaching out of the classroom and allowing students to obtain theoretical concepts before entering the classroom [
31,
32]. As a result, during class, students engage in active and cooperative learning based on their prior experience [
33,
34].
There are several variations of the Flipped Classroom technique. The degree of communication between previous activities and those carried out in the classroom is one way of classifying the various methods [
35]. In this sense, the techniques are divided into three categories: (a) those with no interaction between the activities, (b) those in which the students’ learning from the previous activity is tested in class, and (c) those that use the results of the previous activities to work in the face-to-face class. The method that will be used to create the hybrid model is of type (c). It is called MicroFlipTeaching (MFT), and its use has been validated in theoretical classes [
36], practical classes [
37], and teamwork competency training [
38].
The functional model used in face-to-face training and its adaptation to fully online training (layer 1) are shown in
Figure 1. In face-to-face training, the MFT method is shown in
Figure 1a. The following tasks are carried out remotely prior to the face-to-face class: concept acquisition through videos, doubt resolutions and discussions among students, and a practical task that applies the concepts covered in the video. The results obtained by the students when completing the practical task are used as resources in the face-to-face class to provide feedback on the learning process. The students generate knowledge that they integrate into their work space as a result of this feedback. All of this is combined with micro-lectures, which are used to either extend concepts or explain the following sessions.
The MFT model has been adapted to Cloud Computing, as shown in
Figure 1b. We know that communication through a cloud system can be synchronous (when the interlocutors’ temporal coincidence is required) or asynchronous (when the interlocutors’ temporal coincidence is not required). This same feature is used in the MFT model, which divides the learning process into two stages: asynchronous learning (when teachers and students do not need to be on the same time to complete learning activities) and synchronous learning (when teachers and students must be on the same time to complete learning activities).
As a result, the MFT Cloud model adapts distance tasks and turns them into asynchronous learning, while synchronous learning includes face-to-face activities.
2.2. Layer 2- Transparency through the Generation of Evidence
The aim of layer 2 is to generate evidence through the interactions between students and the Cloud Computing system while developing different phases of teamwork.
The method used is Tuckman’s for small teams, in which the teams must go through four phases: Forming, Storming, Norming, Performing, and Adjourning [
39]. Tuckman’s method has been extensively used by prestigious universities such as MIT [
40] and organizations that use the International Project Management Association (IPMA) model [
41,
42]. As a result, the Tuckman model’s phases have been modified and expanded; Adjourning being replaced by Delivery and Documentation, and a new phase on Lessons Learned to apply to future projects being added.
This research uses the CTMTC model (Comprehensive Training Model of Teamwork Competence) [
43], which provides group evidence that allows for the assessment of each phase’s development (Forming, Storming, Norming, Performing, Delivery, and Documentation).
Each phase has its own set of goals, as well as a set of collective and individual evidence that can be used to verify that these objectives have been met:
Forming defines the team’s formation and the coordinator’s election. Individual evidence is focused on messages exchanged to identify the team leader selection process. Group evidence is the team management structure itself (e.g., coordinator and sub-coordinator).
Storming is a phase in which the team may have disputes and conflicts. The team determines the theme of the task, the mission, the objectives, the need, and the rationale of the work’s outcome in this phase of the CTMTC method. Individual evidence is messages that the team exchanges in order to accomplish the objectives, while group evidence is a document that contains the mission and objectives, as well as the justification and need for them. Likewise, the roles of each team member are established. A map of responsibilities is created using the CTMTC process, which reflects the sections of the work that each member will be responsible for: expertise to use the Cloud Computing system, monitoring-leadership, and content creation tasks. Each team member should have all three responsibilities, and each member’s role is defined by their collection of responsibilities. The group evidence is a table that shows who is responsible for what in the team. Individual evidence is messages exchanged between team members in order to complete this phase.
Norming is a phase where the team is ready to begin working, and rules are defined to ensure the team’s proper functioning. A set of mandatory rules is drawn up in the CTMTC method to regulate the team’s day-to-day work as well as the consequences of not following the rules.
Performing is the phase in which the entire team works together to accomplish the project’s objectives and milestones. The CTMTC method establishes evidence for this phase in the form of a work schedule and a follow-up table that represents individual and group activities carried out week by week. The activities in the follow-up table are compared to the map of responsibilities to determine individual involvement. Individual evidence, as with the other phases, includes messages exchanged for phase completion and a work diary in which each team member reflects on the activities carried out together in real-time, including any form of incident or comment.
Documentation. These are the temporary documents and lessons learned that were generated during the process. Individual evidence includes video recordings of the lessons learned (all team members participate). The partial resources created and their organization are the group evidence. The resources are stored using Google Drive and a custom knowledge management system.
Delivery. The deliverables are as follows. The CTMTC system uses a web page that displays the final work and is incorporated into TRIATECA, as well as a video presentation of the final work’s outcome. The evidence, in this case, is limited to group evidence.
Lessons Learnt. These are resources that contain the information gained from a specific experience or activity. These are created for future teamwork, both within the team and for other work teams. Teams make videos with lessons learned about the different phases of the CTMTC method.
The students use three types of communication for each phase: a forum discussion thread, a wiki where progress tables are created, and a cloud storage system to identify, organize, and store the resources obtained in each phase. Similarly, each team member has a personal thread in a team forum that serves as a work diary, as well as a separate set of threads for following up on work, incidents, or thematic meetings. The generation of individual and group evidence by using the CTMTC method, which allows monitoring the acquisition of teamwork competence, has been validated in previous research [
44,
45].
This layer 2 of the model is represented in
Figure 2, and the evidence is divided into two categories: individual and group. Individual ones are extracted from messages that each team member contributes to interactions with other team members, as well as from his or her work diary.
The work team’s members use the Cloud Computing system to exchange information in the following ways: by participating in forums, collaboratively creating tables, and sharing resources. The above-mentioned communication elements assist each phase of teamwork.
The transparency of each team’s learning progress is achieved by the following actions, as shown in
Figure 2:
Responsibilities map: where each team member’s responsibilities are expressed. Each team member is responsible for three types of activities: designing tasks that contribute to the work’s final outcome, interacting with the Cloud Computing system, and leadership responsibilities. Each team has a leader who is in charge of the team’s activities. However, some of these roles are shared among the group’s members.
Individual monitoring maps (each student indicates the activities he/she is carrying out), and group monitoring maps (the group indicates the evolution of the work by linking the individual activities weekly).
Collaborative learning outcomes from the completion of the CTMTC phases are exchanged in real-time in the Cloud Computing system.
Each work team can keep track of each member’s activities (tasks, interactions with the Cloud Computing system, and leadership) in real-time (transparent processes for the team). As all of this is mirrored in the Cloud Computing system, the team will track the progress of the work being done and the fulfillment of each member’s commitments.
2.3. Layer 3- Analysis of Evidence
This layer’s aim is to examine the evidence gathered in the previous layer in order to monitor learning and identify the most common errors. The use of the Flipped Classroom method in an online environment produces group evidence, and teamwork in an online environment allows for access to individual evidence in collaborative production [
46].
Individual monitoring is achieved with the aid of a Learning Analytics system that searches all of a forum’s threads for messages exchanged between team members [
47]. The interaction of each team member in different phases of the development of the teamwork, in the work diary and in the other threads used for coordination, is obtained in this manner.
The Learning Analytics system also compares the number of messages exchanged in various teams and analyzes each team’s global involvement. Individual workloads, group workloads, and job completion dates can all be seen using this analytics [
26]. This allows you to look at not just the workload but also how the work is organized (e.g., whether they have left everything to the last minute or have distributed it properly over time).
The monitoring of group evidence, which is obtained by evaluating the monitoring tables and the resources provided in each phase of the development of teamwork, is used to identify common errors (CTMTC). The common mistakes made by students during the production of each phase of teamwork are identified following the study.
Figure 3 shows the working scheme of this layer 3. A few hours before the synchronous session, the teacher analyzes the individual and group evidence and then presents it to all of the students in the teaching group, resulting in the collective evidence.
Analysis of individual evidence. The messages and views reflected in each forum’s threads are analyzed using a Learning Analytics system. Since each phase of teamwork is linked to at least one forum thread, each team member’s involvement in the phase’s development can be monitored. Additionally, the start and end dates of each phase and each member’s role in the overall development of the teamwork can be monitored. If the individual evidence has been compiled, the teacher compares the findings (among the members of each team and among the teams) and transmits them to all of the teaching group’s students. The flow (a) of
Figure 3 depicts the entire procedure.
Analysis of group evidence. The teaching staff is in charge of the evidence analysis. They can be of two types: results from each phase (for example, rules established during the “norming” phase) and monitoring tables that show each team’s progress. The teacher presents the findings to the entire teaching group, highlighting the most common errors in each phase as well as the teams responsible for them.
Figure 3 illustrates the entire process.
In addition to error identification, other aspects associated with the responses are identified, such as severity, complexity and creativity.
Severity: Errors can have various levels of impact, from mild to severe. In this model, the severity is measured along with the error through the color of the traffic light, with green being slight errors, medium errors being yellow, and serious errors being red.
Complexity: Often, the result of a task does not have a single answer, and even the answer may be conditioned by other variables external to the problem. Such as subjectivity, which from one point of view makes the answer correct and from another point of view it is not. Answers of this type are used as a tool to encourage discussion in face-to-face/synchronous sessions.
Creativity: Some groups obtain adequate results by following processes to develop an activity that is different from the one expected by the teacher. This degree of creativity is used by teachers to explain different processes that lead to good results, which contributes to deeper learning of knowledge.
3. The TRIATECA Model’s Implementation Context
The model was applied in the first year of the Biotechnology degree program at the Technical University of Madrid in the subject “Fundamentals of Programming”.
The experience involved a total of 91 students: 48 from the morning teaching group and 43 from the afternoon teaching group. The part of the course in which the study was completed (teamwork) accounts for 30% of the overall grade. The aim of this part of the course is for students to enhance teamwork skills by completing a project in which they must improve the course’s content while also adding their experience to the course’s learning process.
Individual competence (involvement of each student in teamwork), group competence (development of teamwork stages), and final outcomes are the three components of teamwork assessment (final result of the teamwork). Each component accounts for a third of the overall teamwork grade. All team members share in the grading of group competency and the final outcome. Each team member has an individual competency grade, and it has an effect on the rest of the assessment. For example, even though the final results are well graded, if a student fails the individual competency, he or she will fail the teamwork. As a consequence, there might be students who pass and those who fail in the same team.
Because of the influence of the situation resulting from COVID-19, the classes were conducted entirely online using Cloud Computing. We used an eco-system consisting of a Moodle e-learning platform, 2.0 tools (wiki and online storage), Microsoft Teams for videoconferencing system, Youtube to manage the videos made, and a knowledge management system of our own design [
45] to organize all of the resources generated during the teamwork’s development.
The Hybrid Flipped Classroom was chosen as the teaching method, as described in layer 1 of the TRIATECA model. Microsoft Teams was used to teach eight synchronous two-hour sessions between September and December 2020. Students worked asynchronously between synchronous sessions, using Moodle, a Wiki, Youtube, cloud storage, and the own knowledge management system to organize their partial results.
During the asynchronous sessions, students worked in teams to complete the teamwork phases as well as to build the final work. During the synchronous sessions, the entire teaching group participated in group sharing, and new topics and activities were clarified.
The students used Moodle forums to interact with each other and collaboratively developed both the contents of the final work and the resources associated with each teamwork phase. The forum messages are the individual evidence and the contents, together with the intermediate resources created, are the group evidence.
The teachers reviewed the group evidence shortly before the synchronous session to get a summary of the results of each team’s activities and prepare a document with the errors they made. Individual evidence, on the other hand, was analyzed using the Learning Analytics system to assess the workload of each team member.
A control group and an experimental group were chosen from among all of the students involved in the research. The errors made by the different teams were shown in the control group. Following that, each form of error was solved in collaboration with the students. Finally, micro-lessons were given to clarify the next steps to be carried out, overcoming doubts and energizing debates. The control group was made up of 48 students who were divided into eight teams and were part of the morning teaching group.
The experimental group’s sessions followed the same dynamics as the control group’s sessions. The difference was that, in addition to identifying errors by team (as in the control group), color was added to show the magnitude of the error, and the progress of the work was identified in comparison to previous phases. That is, each team’s involvement was compared (based on the total number of messages exchanged), and the people in each team who had worked the least were listed (by analyzing the messages in each team). The experimental group consisted of 43 students from the afternoon teaching group, who were divided into seven teams.
Since the students in the experimental and control groups cannot be selected at random, the research is quasi-experimental. The reason for this is the experiment must be done with a full teaching group (since it is carried out during the synchronous session, and this must be given to the whole group). The experimental group was selected at random from the morning and afternoon groups, and it fixed the control group.
The same Cloud Computing system was used in both the experimental and control groups, ensuring that all students have the same educational model and the variables that support the research work’s hypothesis can be contrasted: the mechanism of transparency in the management of evidence. The results obtained in the research are shown and contrasted below.
4. Results
The validity of contrasting the experimental and control groups is demonstrated in the first subsection (
Section 4.1). The equivalence in the profile of the students and the treatment received by the teachers was investigated for this purpose. The results of group evidence transparency are shown in the second subsection (
Section 4.2), collective evidence transparency in the third (
Section 4.3), and individual evidence in the fourth (
Section 4.4).
4.1. Homogeneity of the Expzerimental and Control Groups
The homogeneity of the control and experimental groups was established using a survey. Homogeneity is investigated from two perspectives: the student profile and teacher treatment.
The survey was completed by 83 students out of a total of 96 students, representing an 86.45% response rate. Out of a total of 44 people, 36 joined in the experimental group, accounting for 81%. In the control group, 47 people out of 51 took part, accounting for 92% of the total.
4.1.1. Homogeneity of The Experimental and Control Groups with Respect to Student Profile and Team Creation
The equivalence is investigated to ensure that both groups are homogeneous by asking the following questions:
Q1—university entrance qualification
Q2—the total number of times the student has enrolled in the course
Q3—gender
Q4—the method by which you joined the team. In this case, the possible values are as follows:
- ○
Some of the members of the team were friends of mine
- ○
I knew a few of the team members
- ○
I did not know anyone on the team
- ○
I was the team’s first sign-up
To determine if the distribution is normal, the Shapiro–Wilk test is used first. The
p-value of the data series for both the control and experimental groups is shown in
Table 1.
Table 1 shows that all of the values have a
p-value of less than 0.01; hence, none of the data series are normal.
Equivalence has been investigated using the Wilcoxon
p-value for unpaired samples to see if there are any major differences. All samples are categorized by group (experimental and control) and compared for the following data sets: university entrance qualification, gender, and team creation (
Table 2).
All of the p-values obtained are greater than 0.01; thus, the student body profile is equivalent.
4.1.2. Homogeneity in the Way the Teachers Treat Their Students
Part of the MUSIC
® Model of Motivation Inventory test was included in the survey [
48], which is a model described as usable: “in any subject area (a) to design instruction that motivates students, (b) to diagnose strengths and weakness of instruction, and (c) to research relationships among factors critical to student motivation.” The model defines five fundamental principles [
49,
50]:
Feel empowered by having the ability to make decisions about some aspects of their learning.
Understand why what they are learning is useful for their short- or long-term goals.
Believe that they can succeed if they put forth the effort required.
Are interested in the content and instructional activities.
Believe that the instructor and others in the learning environment care about their learning and them as a person.
Here, we focus on the findings of the set of questions that measure the part “Caring” (the fifth principle, on the instructor’s care for students), despite the fact that we completed the test in its entirety. The following are the questions that make up the Caring indicator out of the total of 26 that make up the MUSIC®:
Q16.4 The teachers are available to answer my questions about the course work.
Q16.16 The teachers are willing to help me if I need help in the subject.
Q16.20 The teachers care about how I am doing in the subject.
Q16.22 The teachers respect me.
Q16.24 The teachers are friendly.
Q16.27 The teachers care about my feelings.
As in the previous section, we used the Shapiro–Wilk
p-value test to determine whether the individual data series have a normal distribution (
Table 3). Additionally, we used the Wilcoxon
p-value for unpaired samples to determine whether they are equivalent (
Table 4).
All of the p-values are less than 0.01; thus, none of the response distributions to the different questions are normal.
The Wilcoxon test is used on two unpaired samples to see if they are equivalent (
Table 4). The equivalence between the groups (experimental and control) and the corresponding variable is represented in each row of the matrix.
All of the p-values obtained are greater than 0.01; thus, the treatment of the teachers in the experimental and control groups is equivalent.
Table 5 shows the mean values and standard deviations for each of the “Caring” indicator questions. The “Caring” measurement received a 5.3 out of 6 average.
4.2. Impact of Cloud Computing Transparency on Group Evidence
The errors made by the teams during the preceding asynchronous activities were displayed in each synchronous session. Each error is assigned a code and assigned to the corresponding team.
Figure 4 depicts an example from the Performing phase. The errors found in the teamwork phases were presented with a code, and the team that committed the error in the control group (
Figure 4a).
In the experimental group (
Figure 4b,c), a traffic light indicating the seriousness of the error was shown for each team in addition to the errors found and the team making the errors (green with a mark between 7 and 10, yellow for passing with a mark between 5 and 6, and red for failing, with less than 5). The traffic light technique is widely used to monitor data because it has been demonstrated to provide a fast and easy view of data processing through a dashboard [
51]. The traffic light is used in the following situations:
The correction of previous phases’ errors by each team (
Figure 4b).
The severity of each team’s error in the corresponding phase (
Figure 4c).
Each error has a code that corresponds to:
E-1: It is very generic, and no details are given.
E-2: The resource is unavailable.
E-3: A part of the phase is missing.
E-4: The technology is not included.
E-5: There are repeated tasks.
E-6: Does not apply to this phase.
E-7: Work log is missing.
Once the collective evidence was exposed to the teaching group, the development of the synchronous session was exactly the same for each group: the errors and their solutions were explained (each error was corrected for a specific team), and the rest of the teams were instructed to correct the error if they had it.
The final evaluation of teamwork took place after the course had ended but before the date of the course’s final exam.
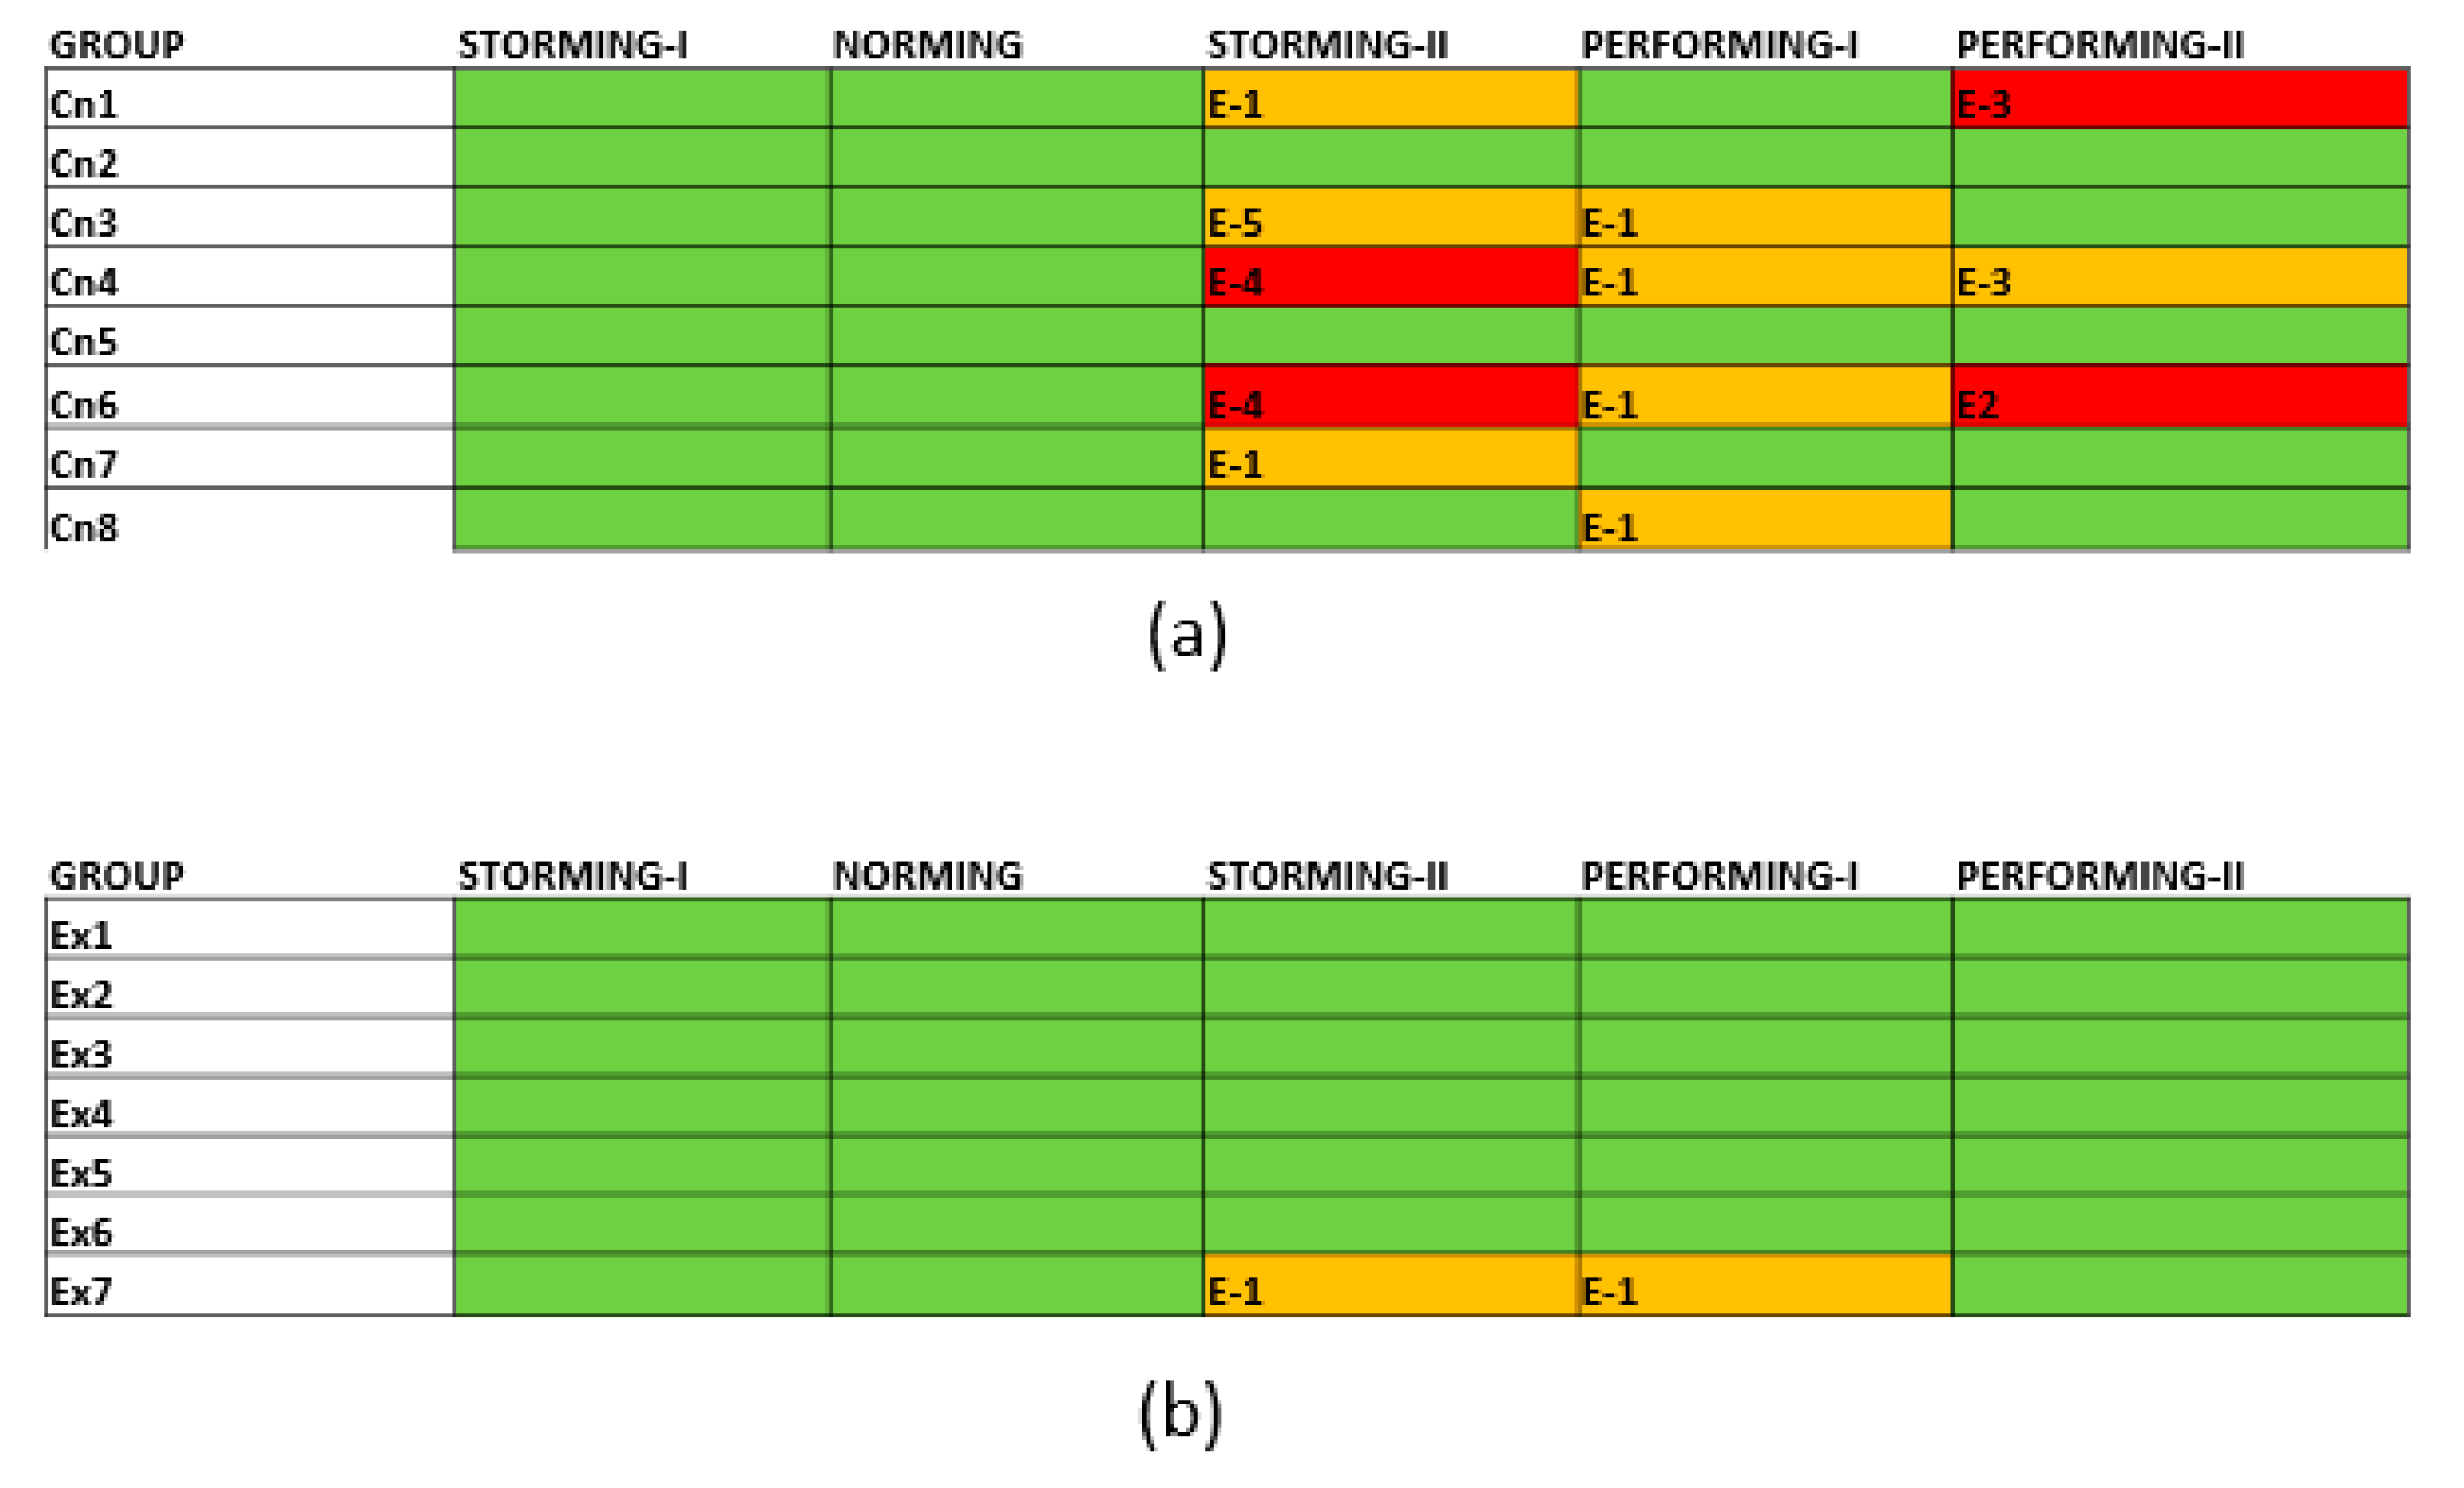
The results of the evolution of the errors in the final evaluation are shown in
Figure 5. The results of the control group teams’ errors are shown in
Figure 5a. The majority of the teams’ errors have not been corrected, as can be seen.
Figure 5b shows that the majority of the teams of the experimental group have corrected their errors.
Everything looks green during the Storming-I and Norming phases for the following reasons:
Storming-I: Each team selects the work’s theme from a list of three choices (each option corresponds to a part of the subject). As a result, whatever the team chooses is accepted as correct.
Norming: Each team suggests its own norms during this phase, so the one defined by the team is accepted. The norms are shared for all teams during the synchronous session. Any rule from another team can be incorporated by each team. As a result, the final rules selected are deemed correct.
In this case, there is no distinction between the teams of the experimental and control groups during the Storming and Norming phases. There is, nonetheless, a difference between the phases of the responsibility map (Storming-II), planning (Performing-I) and execution (Performing-II).
Table 6 shows the error percentage in each phase according to the color of the traffic light for the experimental and control groups.
When we look at the individual scores for each student in each phase, we see that they all have a non-normal distribution since the Shapiro–Wilk test shows that they all have a value less than 0.01, as shown in
Table 7.
The Wilcoxon
p-value for unpaired samples was used to see if there were any significant differences in the scores achieved by members of the experimental and control groups.
Table 8 displays the results.
As a result, there are significant differences in learning between the experimental and control groups, as all of the p-value are below 0.01.
4.3. Impact of Cloud Computing Transparency on Collective Evidence
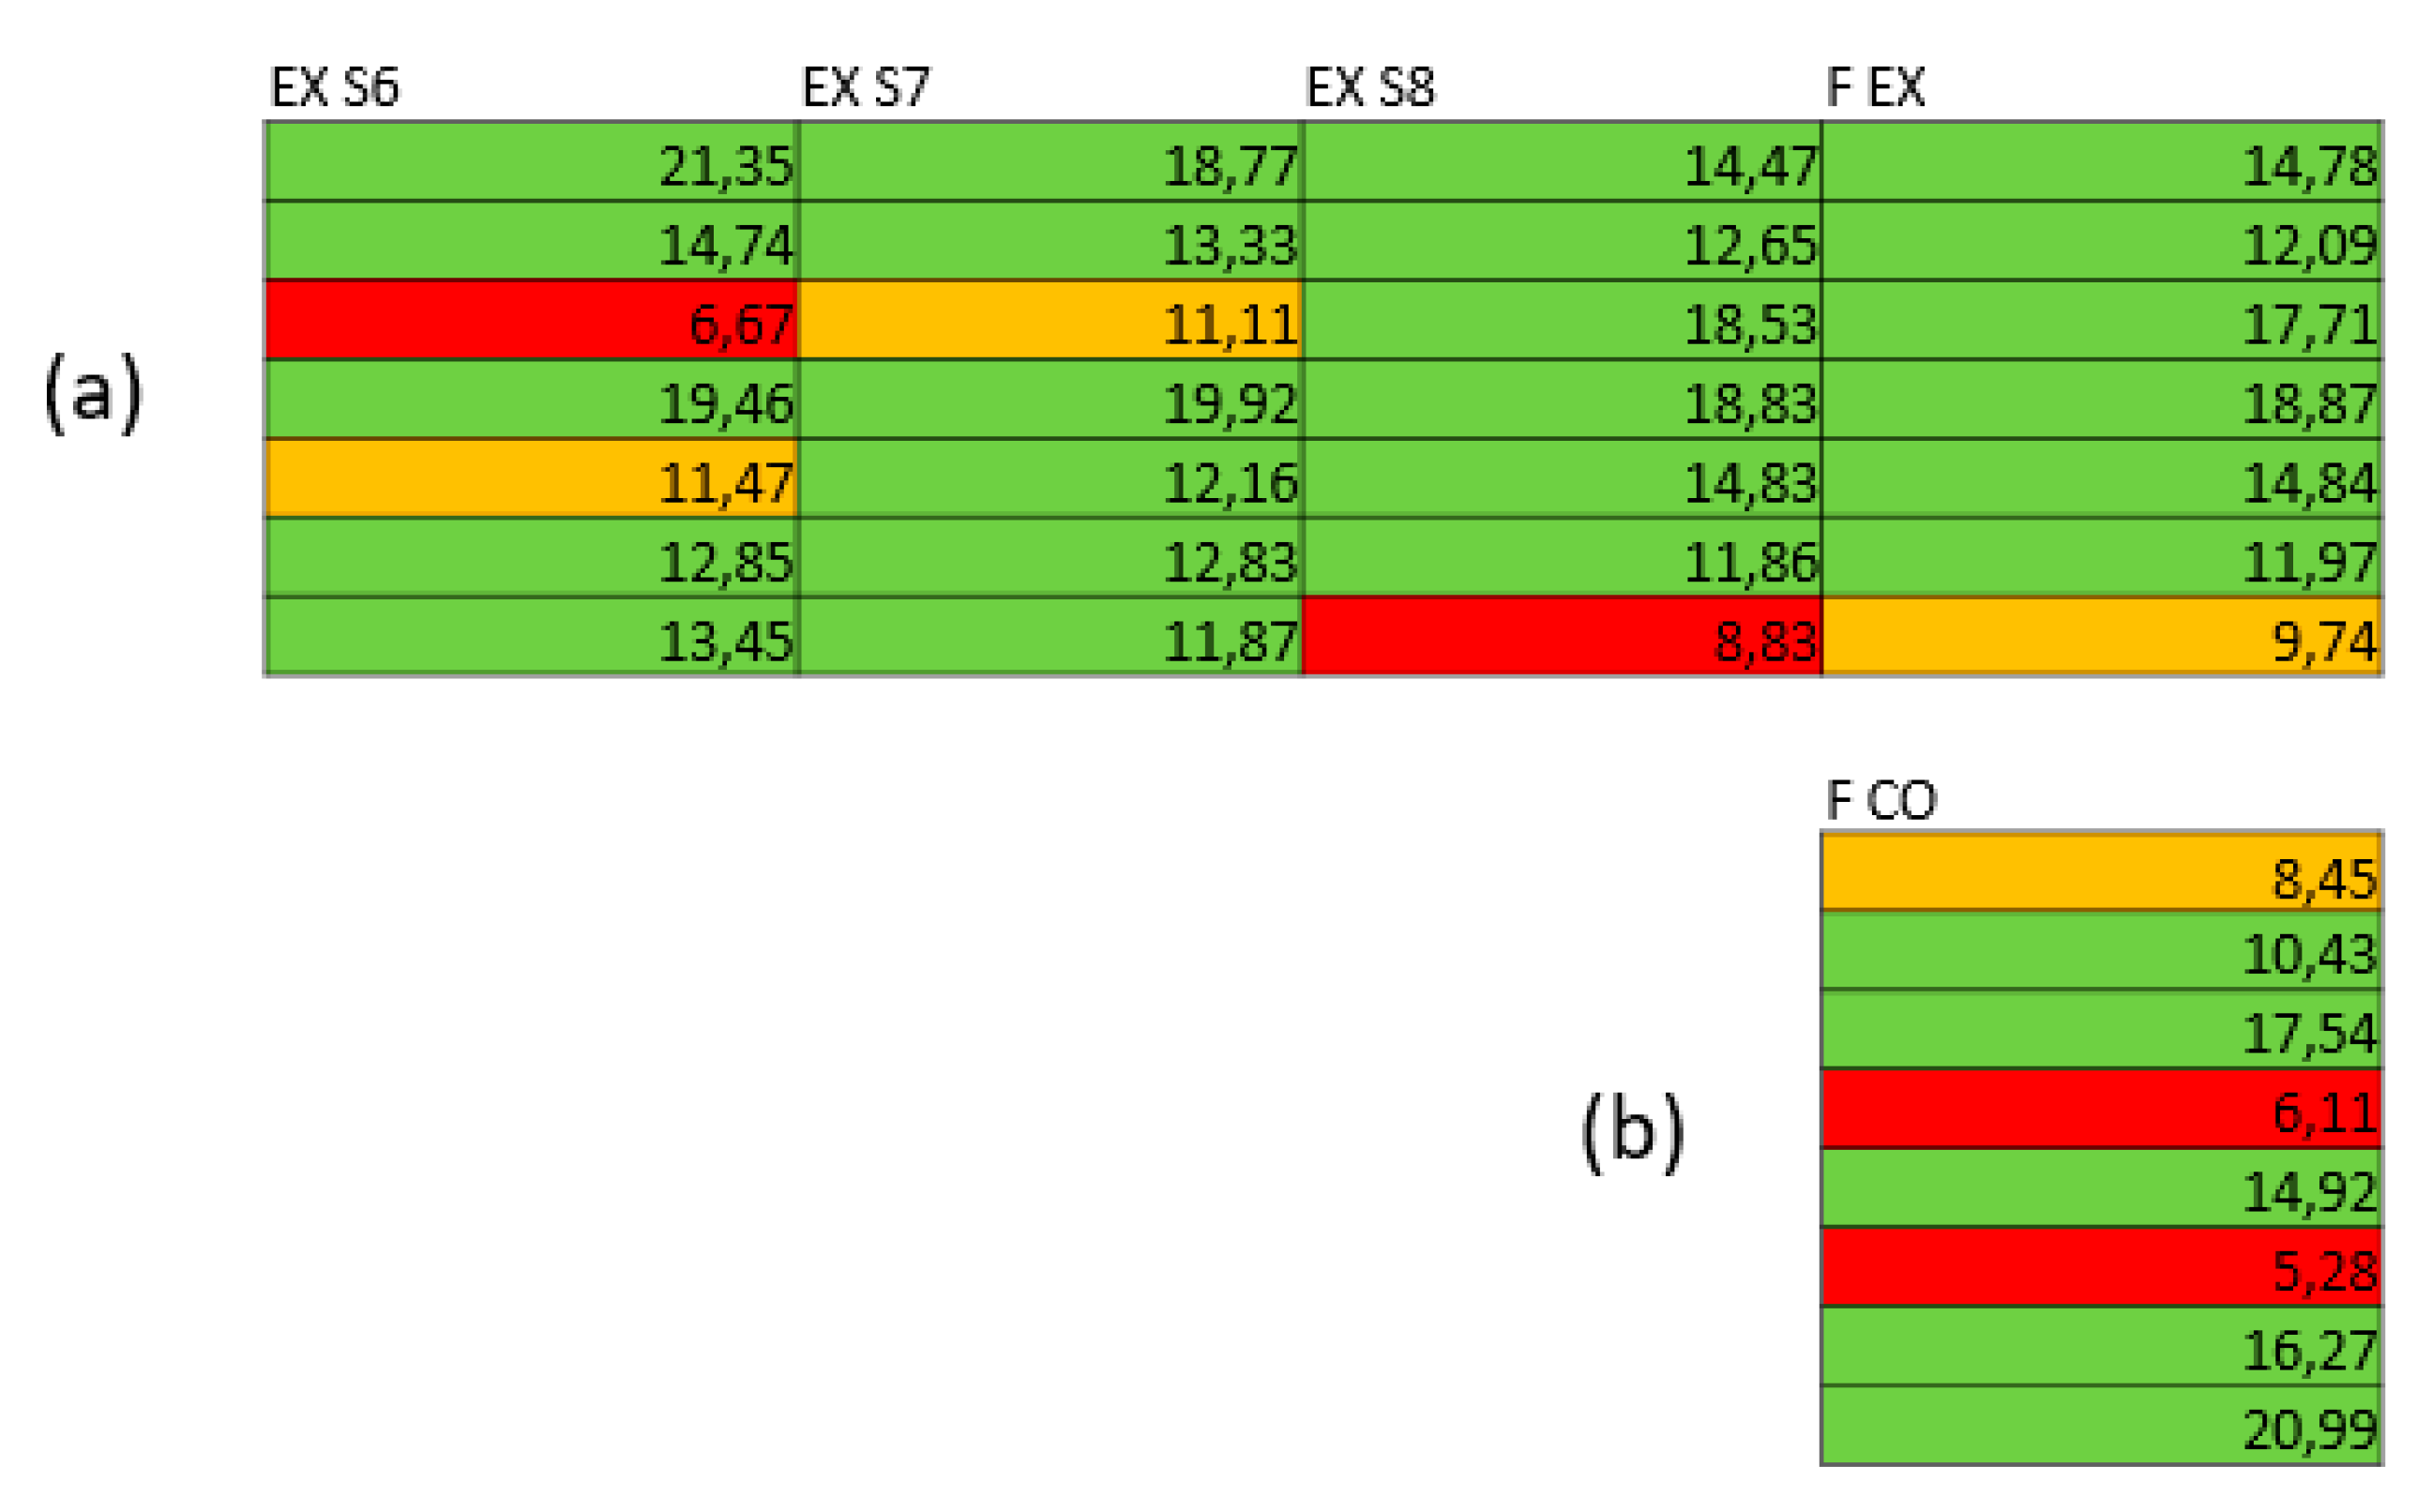
No percentage of the workload per team was shown in each synchronous session with the control group. In the experimental group, the relative participation of each team in comparison to the others was shown, as well as the load situation from the start of teamwork to the date of the synchronous session where this exposition was made.
The alarm level is shown using three colors, with M representing the average workload of the experimental group teams.
Green: the workload is higher than M-(M*0.19).
Yellow: the workload is in the range between M-M*0.20 and M-M*0.39. This is a pre-alert state with the goals of advertising the danger of entering the red alert state and encouraging them to pass to the green alert.
Red: The workload is in the (M-M*0.40) range. Actually, this is the most important color because it shows that the teams in this category work considerably less than the rest of the teams, and these are the cases that need to be addressed.
Figure 6a depicts the alertness levels of the seven teams in the experimental group during the last three sessions: EX S6, EX S7, and EX S8. The result of the experimental group’s final evaluation, F EX, is also shown. The final evaluation of the 8 teams of the control group F CO is shown in
Figure 6b.
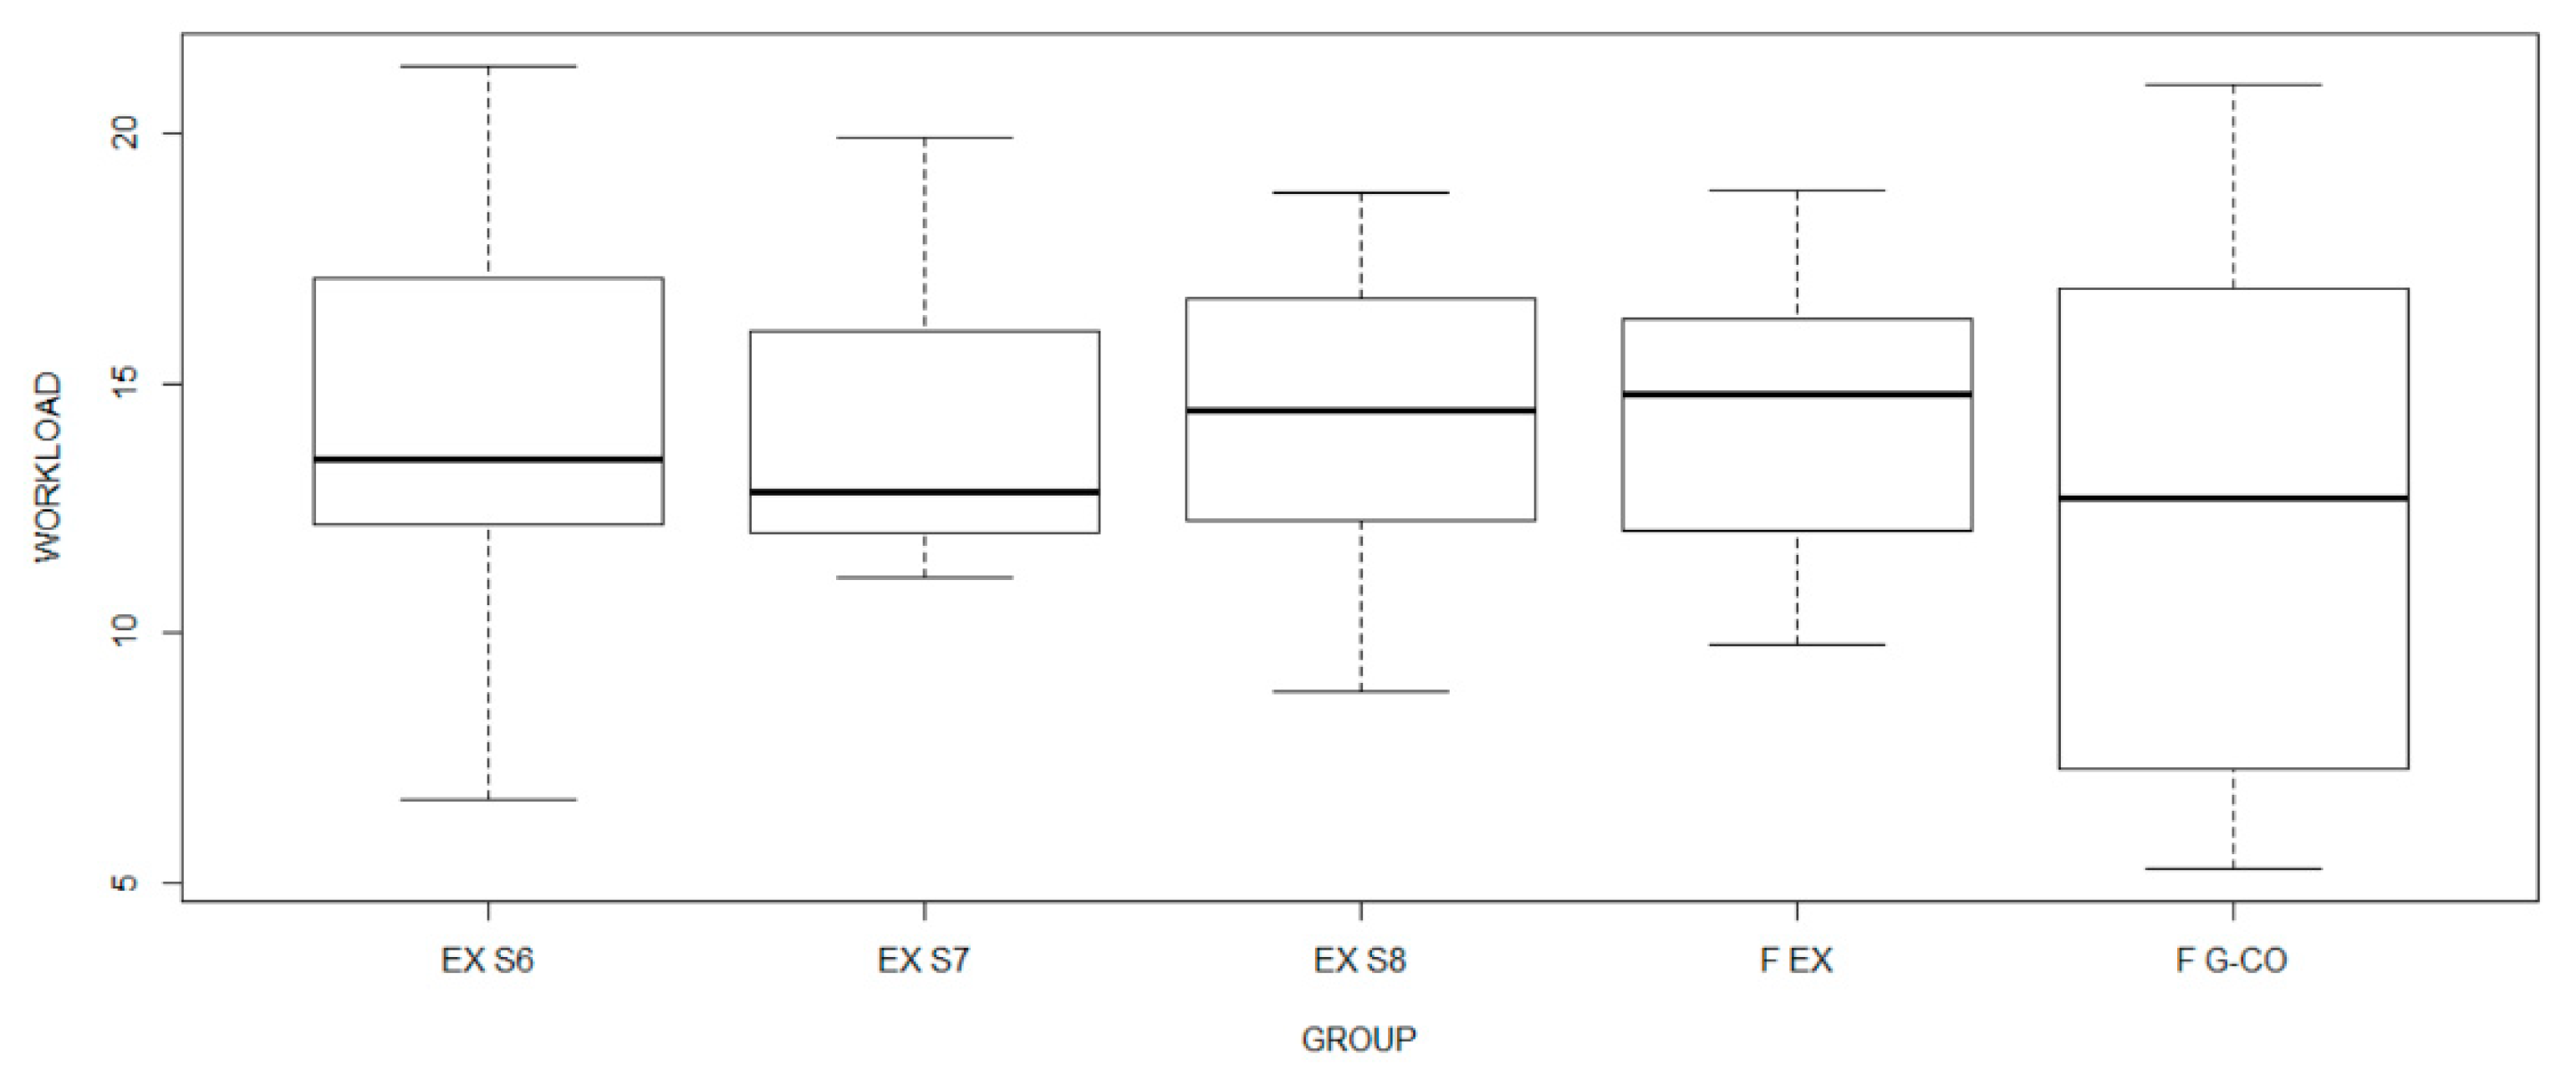
Box plots of the maximum and minimum values, the median, and the workload distribution by quartiles used to visualize the workload distribution. The box plots are depicted in
Figure 7.
It can be seen that as the experimental group progresses, the workload of the teams converges, eliminating the extreme loads. Only one final measurement was taken in the control group, and it is more similar to the experimental group’s first measurement in terms of extreme values.
In
Figure 6, we observe that 6 of the 7 experimental groups have the green color in the final evaluation F EX (85.7%), 1 of the 7 groups has the yellow color (14.3%), and the red color does not appear.
Table 9 shows the percentage of collective evidence depending on the error severity (the color of traffic light) for experimental (7 groups) and control groups (8 groups).
4.4. Impact of Cloud Computing System Transparency on Individual Evidence
The existence of individuals who work considerably less than the rest of the team is one of the issues that arise in the development of teamwork. It is critical to identify these team members so that they can be redirected or expelled by the team.
The number of messages exchanged in the forums to improve each phase of teamwork is one way to measure individual involvement. In this case, it is not so much the total number of messages sent by an individual as it is the percentage of those sent in comparison to the rest of the team.
It is possible to determine the number of messages exchanged by the components of each team using the Learning Analytics tool described in the model, either by phase or in total. The following thresholds were established to determine if a person works less than the rest of the team:
Table 10 depicts the colors associated with the alert level in relation to the number of messages posted in each team member’s forums. This serves to notify the teachers of each member’s behavior when interacting with the other members of his or her team.
The control group received no warning signs from the teachers. The experimental group was shown the alert levels in the last three sessions, with special attention paid to the students who were at the yellow or red level (
Figure 8a). Individual participation was evaluated using the Learning Analytics system.
Figure 8b shows that no one with the red alert level was detected in the experimental group, while they were detected in two teams in the control group.
A contingency table with the total percentage of alarm frequencies is shown in
Table 11. The proportion of the green level in the control and experimental groups is the same. The experimental group has more yellow alerts, while the control group has considerably more red alerts, which are the most dangerous.
5. Discussion
In the context of this study, Cloud Computing technologies were of mandatory use because it was conducted in a pandemic situation. Therefore, a discussion could be established as to whether the methodology could work without Cloud Computing.
From a methodological point of view, Cloud Computing is a tool; therefore, the proposed methodology could also be considered to work without it. However, it would be extremely difficult to implement it for two reasons: on the one hand, less evidence would be generated, since much of it can be captured through student interaction with the Cloud Computing tools, and on the other hand, the effort to manage the whole process would be unfeasible without technology in contexts similar to the one in the research work (around 100 students per teaching group), as has been demonstrated in previous research [
47].
Transparency is linked to citizen science as a means of broadening and extending the scope of research in research centers [
18]. Transparency is also used in this work to move toward a learning process in which the students’ progress is made visible to them, both individually and collectively.
Students expect feedback from their teachers when they build knowledge and share it, according to previous research [
44]. Based on this feedback, the learner should either improve his or her understanding or share it with the assurance that it is correct. This work applies this principle to the process of learning. Students consciously (e.g., by solving a problem) and unconsciously (e.g., by completing a task) produce evidence of their progress (e.g., with the messages they exchange with other students). As a result, in this research project, the teacher interprets the evidence and visualizes the individual, team, and collective progress [
52].
It can be thought of as a continuous, diagnostic, and reverse-formative assessment process. Teachers use diagnostic and formative assessments in traditional methods to take various corrective actions if necessary [
53,
54,
55,
56]. The teacher makes the process transparent in this approach, so the students themselves take corrective actions, as shown in this work.
Students’ participation in the learning process itself [
57,
58,
59,
60,
61] is one way to improve the learning process, and active methodologies [
62,
63,
64,
65] should be used in conjunction with continuous learning assessment [
66,
67,
68,
69,
70,
71].
6. Conclusions
Making the progress and evolution of learning-related aspects, such as errors and workload, transparent has had a significant impact on both learning and participation levels.
Both the type of error and the proportion of errors committed by work teams are very similar in the control and experimental groups at any given phase (see
Figure 4a,b). The transparency process, in this case, consists of displaying the seriousness of the error (traffic light in
Figure 4b) as well as the progression of errors committed in previous phases.
All of the teams, both the control and experimental groups, are given instructions on how to correct their errors. However, as shown in
Figure 5 (evaluation at the end of the course), the experimental group’s teams have corrected the errors (
Figure 5b), while the control group’s teams have not (
Figure 5a).
Table 7 shows that the scores obtained by the teams in the control group and those in the experimental group are not equivalent in all phases analyzed, as determined by the
p-value obtained by applying Wilcoxon. This shows that the transparency process affects the teams’ learning (as they correct their mistakes) and the outcomes of the various phases of teamwork; namely, it produces an improvement of the teamwork competence.
The workload of each team in the experimental group was also shown, which was calculated based on the messages exchanged by team members during the work.
Figure 6a shows the workload evolution in the experimental teams. When a team has a red color (meaning its workload is considerably lower than the rest of the teams), the teams in the group become increasingly homogeneous. The evolution of those in red turns to yellow, then to green, and the different teams converge in terms of workload, as shown in
Figure 6. As a result, it would take three sessions for the teams that work much less to stabilize.
In terms of the post-course evaluation,
Figure 6 (F CO for the control group and F EX for the experimental group) shows that the control group has teams with red alerts, while the experimental group has none.
Figure 7 shows, using box plots, that the experimental groups’ first measurement (EX S6) is similar to the control group’s first measurement (F CO), indicating that both groups have teams with extreme values (both at the top and bottom). The boxes, on the other hand, show that the workload evolution of the experimental group’s teams, as shown in three synchronous sessions (EX S6, EX S7, and EX S8), tends to converge. There are no longer any teams with significant differences, and learning is becoming more homogeneous (the boxes are flattening).
As a result, it has been shown that having the workload visible continuously (in each synchronous session) results in a workload that is similar for all teams, varying between the average to 20% of the average. As a result, this transparency technique is perfect for ensuring that the workloads of different teams working on the same task are similar.
On the other hand, visibility of evidence on each team member’s individual workload has been critical, as team members strive to achieve a homogeneous workload. The same transparency technique was used for team workloads, i.e., a level of warning (traffic light) was displayed based on each member’s individual workload in relation to the other members of his team. There is no standardized transition between the different colors of the traffic light in this case since the red color can stay the same or change from yellow to red, or vice versa, as shown in
Figure 8a. This does not necessarily mean that the person who is red for two sessions is the same person, and it may be a different member of the same team. In any case, the objective is for no one in the team to function significantly less than the rest of the team. It can be shown that no team in the experimental group has the red color in the final assessment process, although there are teams in the red color in the control group (
Figure 8b).
Table 10 shows that 20% of the teams in the control group had members with a significantly lower workload (yellow and red colors), whereas no team in the experimental group had a red color. As a result, gradually exposing team members’ workloads to a red alertness level causes these members to raise their workload until it is homogeneous with the rest of the team.
The research team intends to carry out future work on the application of the TRIATECO model in types of learning other than teamwork and different training contexts. On the other hand, the research was conducted in a technological university and with first-year students. In these circumstances, cooperative work and technology are commonly used, and the incidence of these factors has not been analyzed in this research work. Therefore, the transfer of this methodology to other areas, such as non-university education, where Cloud Computing technologies and/or cooperative work are not commonly used, should be the subject of a future study.


 ,
, 


