
Multichannel Real-Time Electronics Platform for the Estimation of the Error in Impact Localization with Different Piezoelectric Sensor Densities †


Abstract
1. Introduction
2. Impact Detection and Localization
3. Experimental Set-Up and Electronic Equipment
3.1. Electronic Instrument Design for SHM Evaluation
3.2. Experimental Set-Up
- VGA gain from 54 to 90 dB to adjust for different sensor sensitivities
- High voltage, up to 100 V, for active mode operation
- Square wave burst (1–16 cycles), up to 500 kHz, for active mode operation
- 12-bit resolution
- 16 channels at 20 MSps
- Storage: 1 MS per channel
- (1)
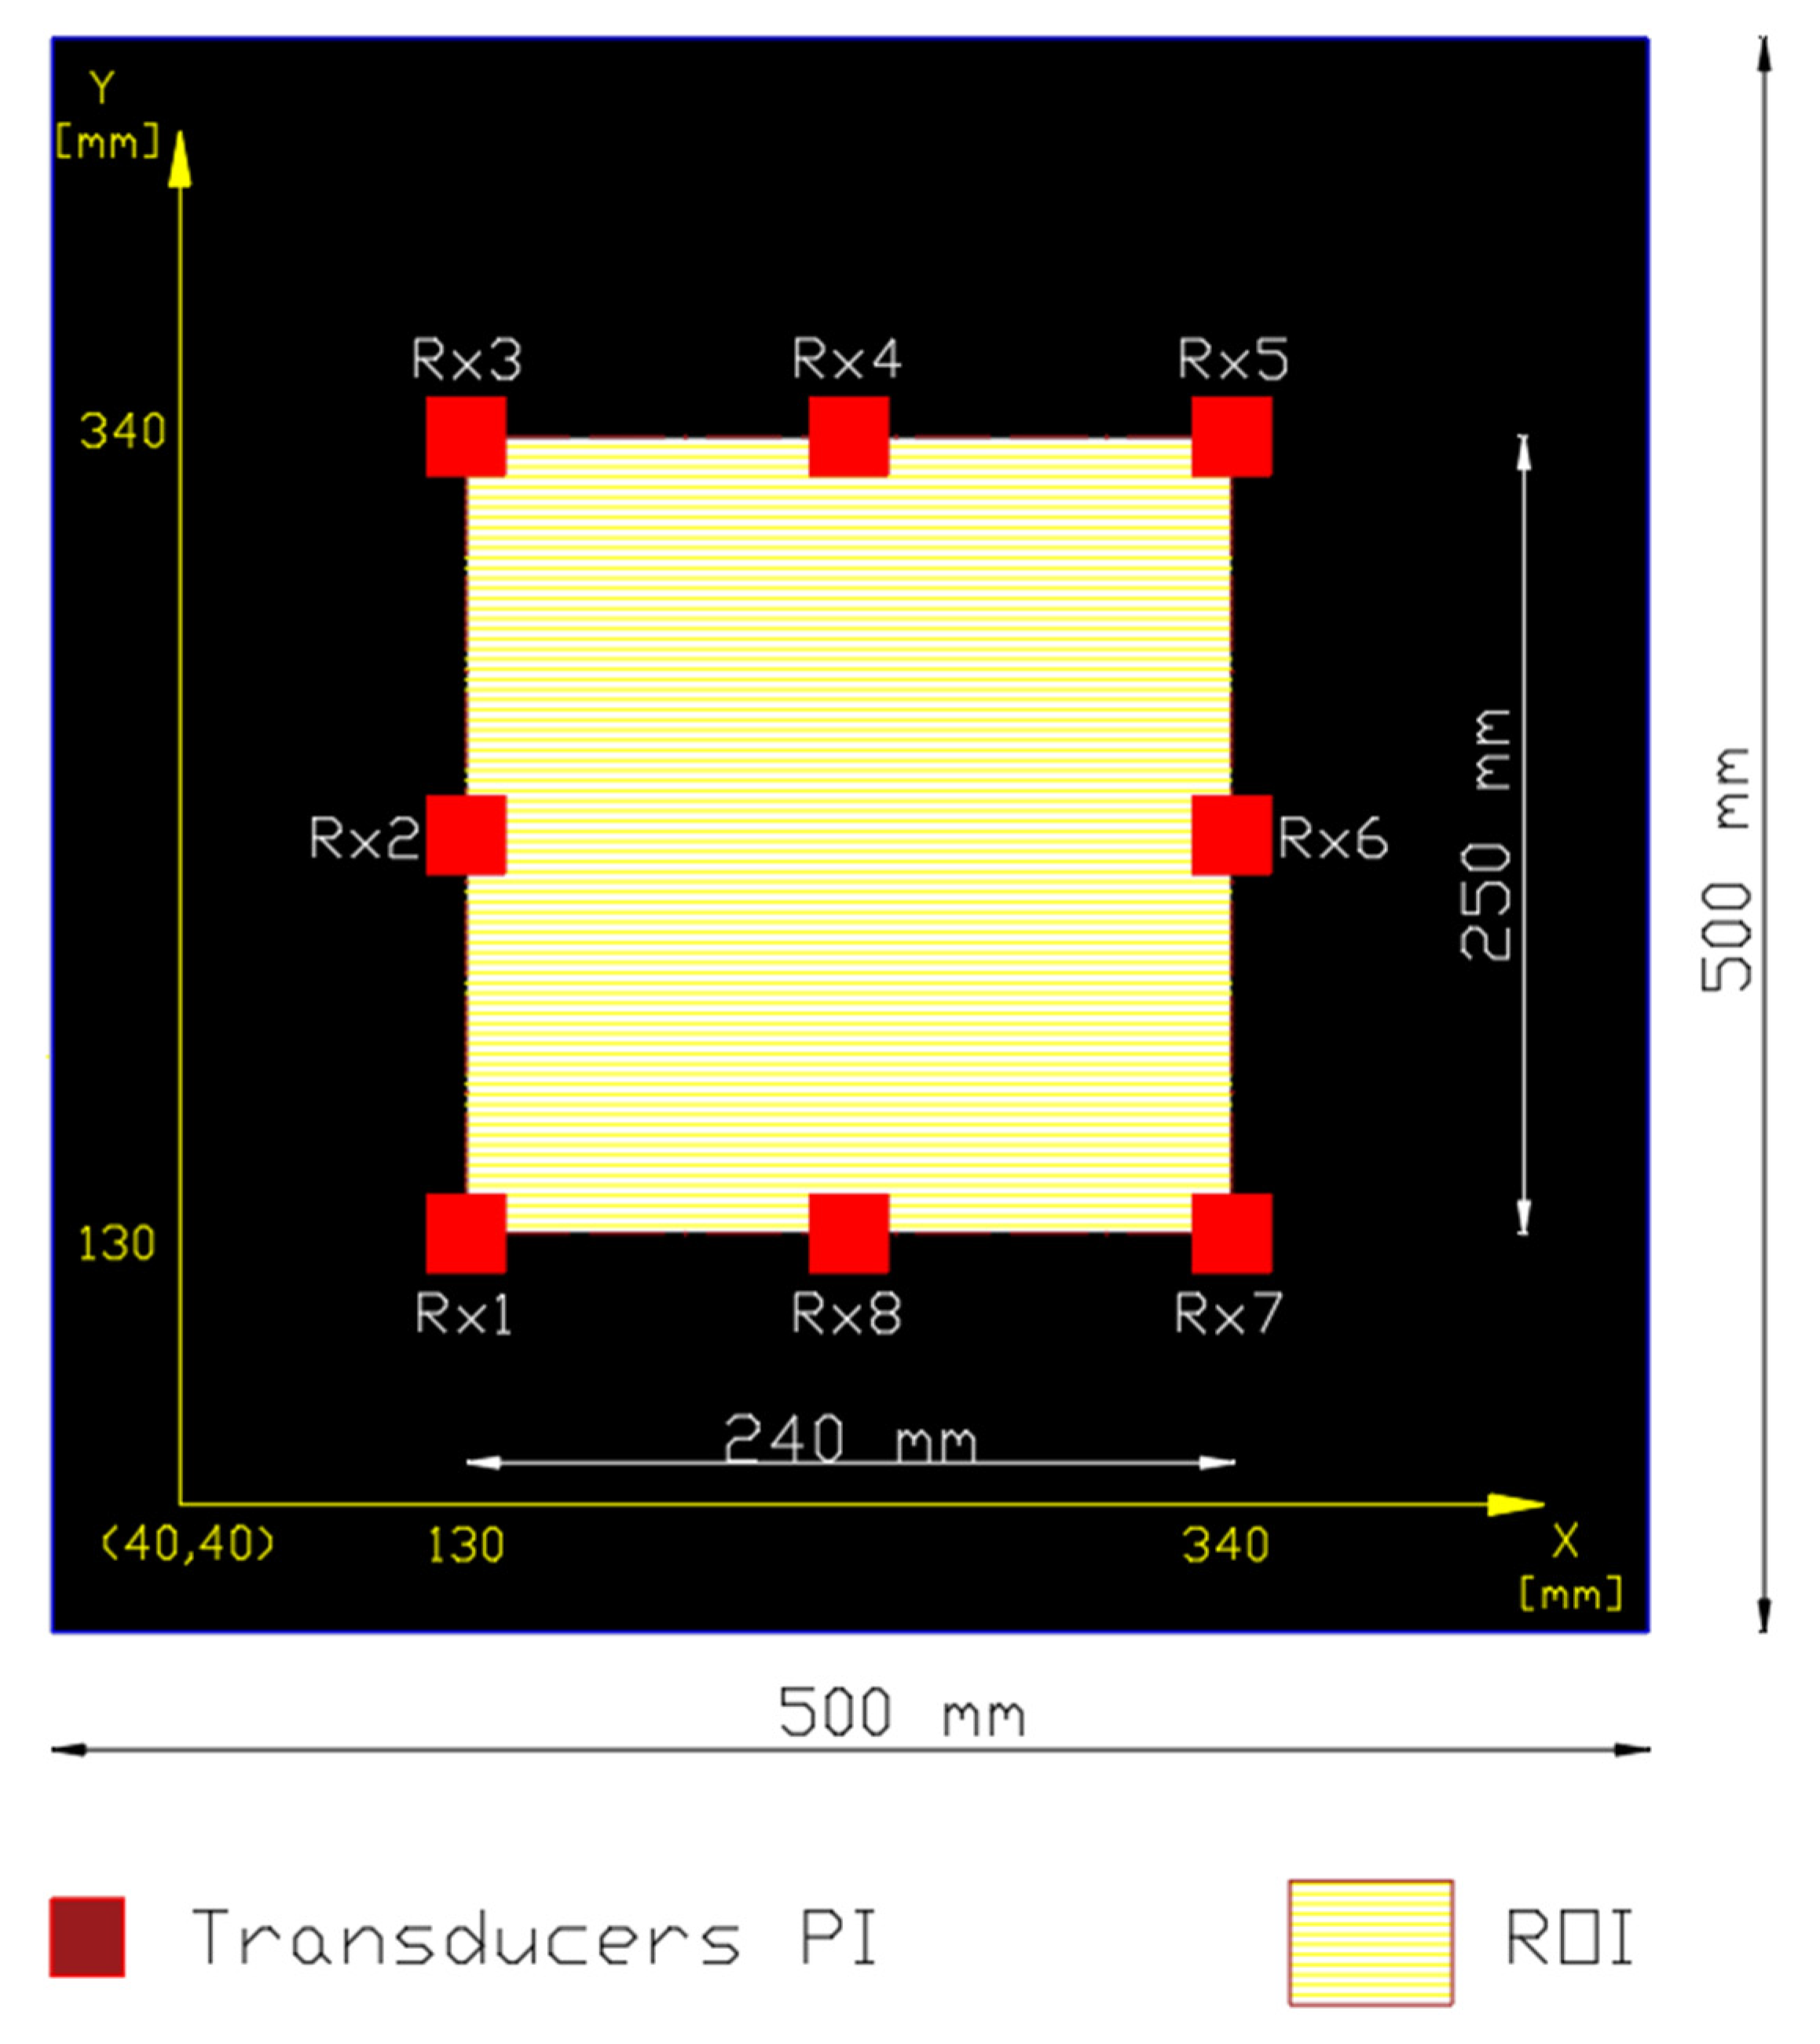
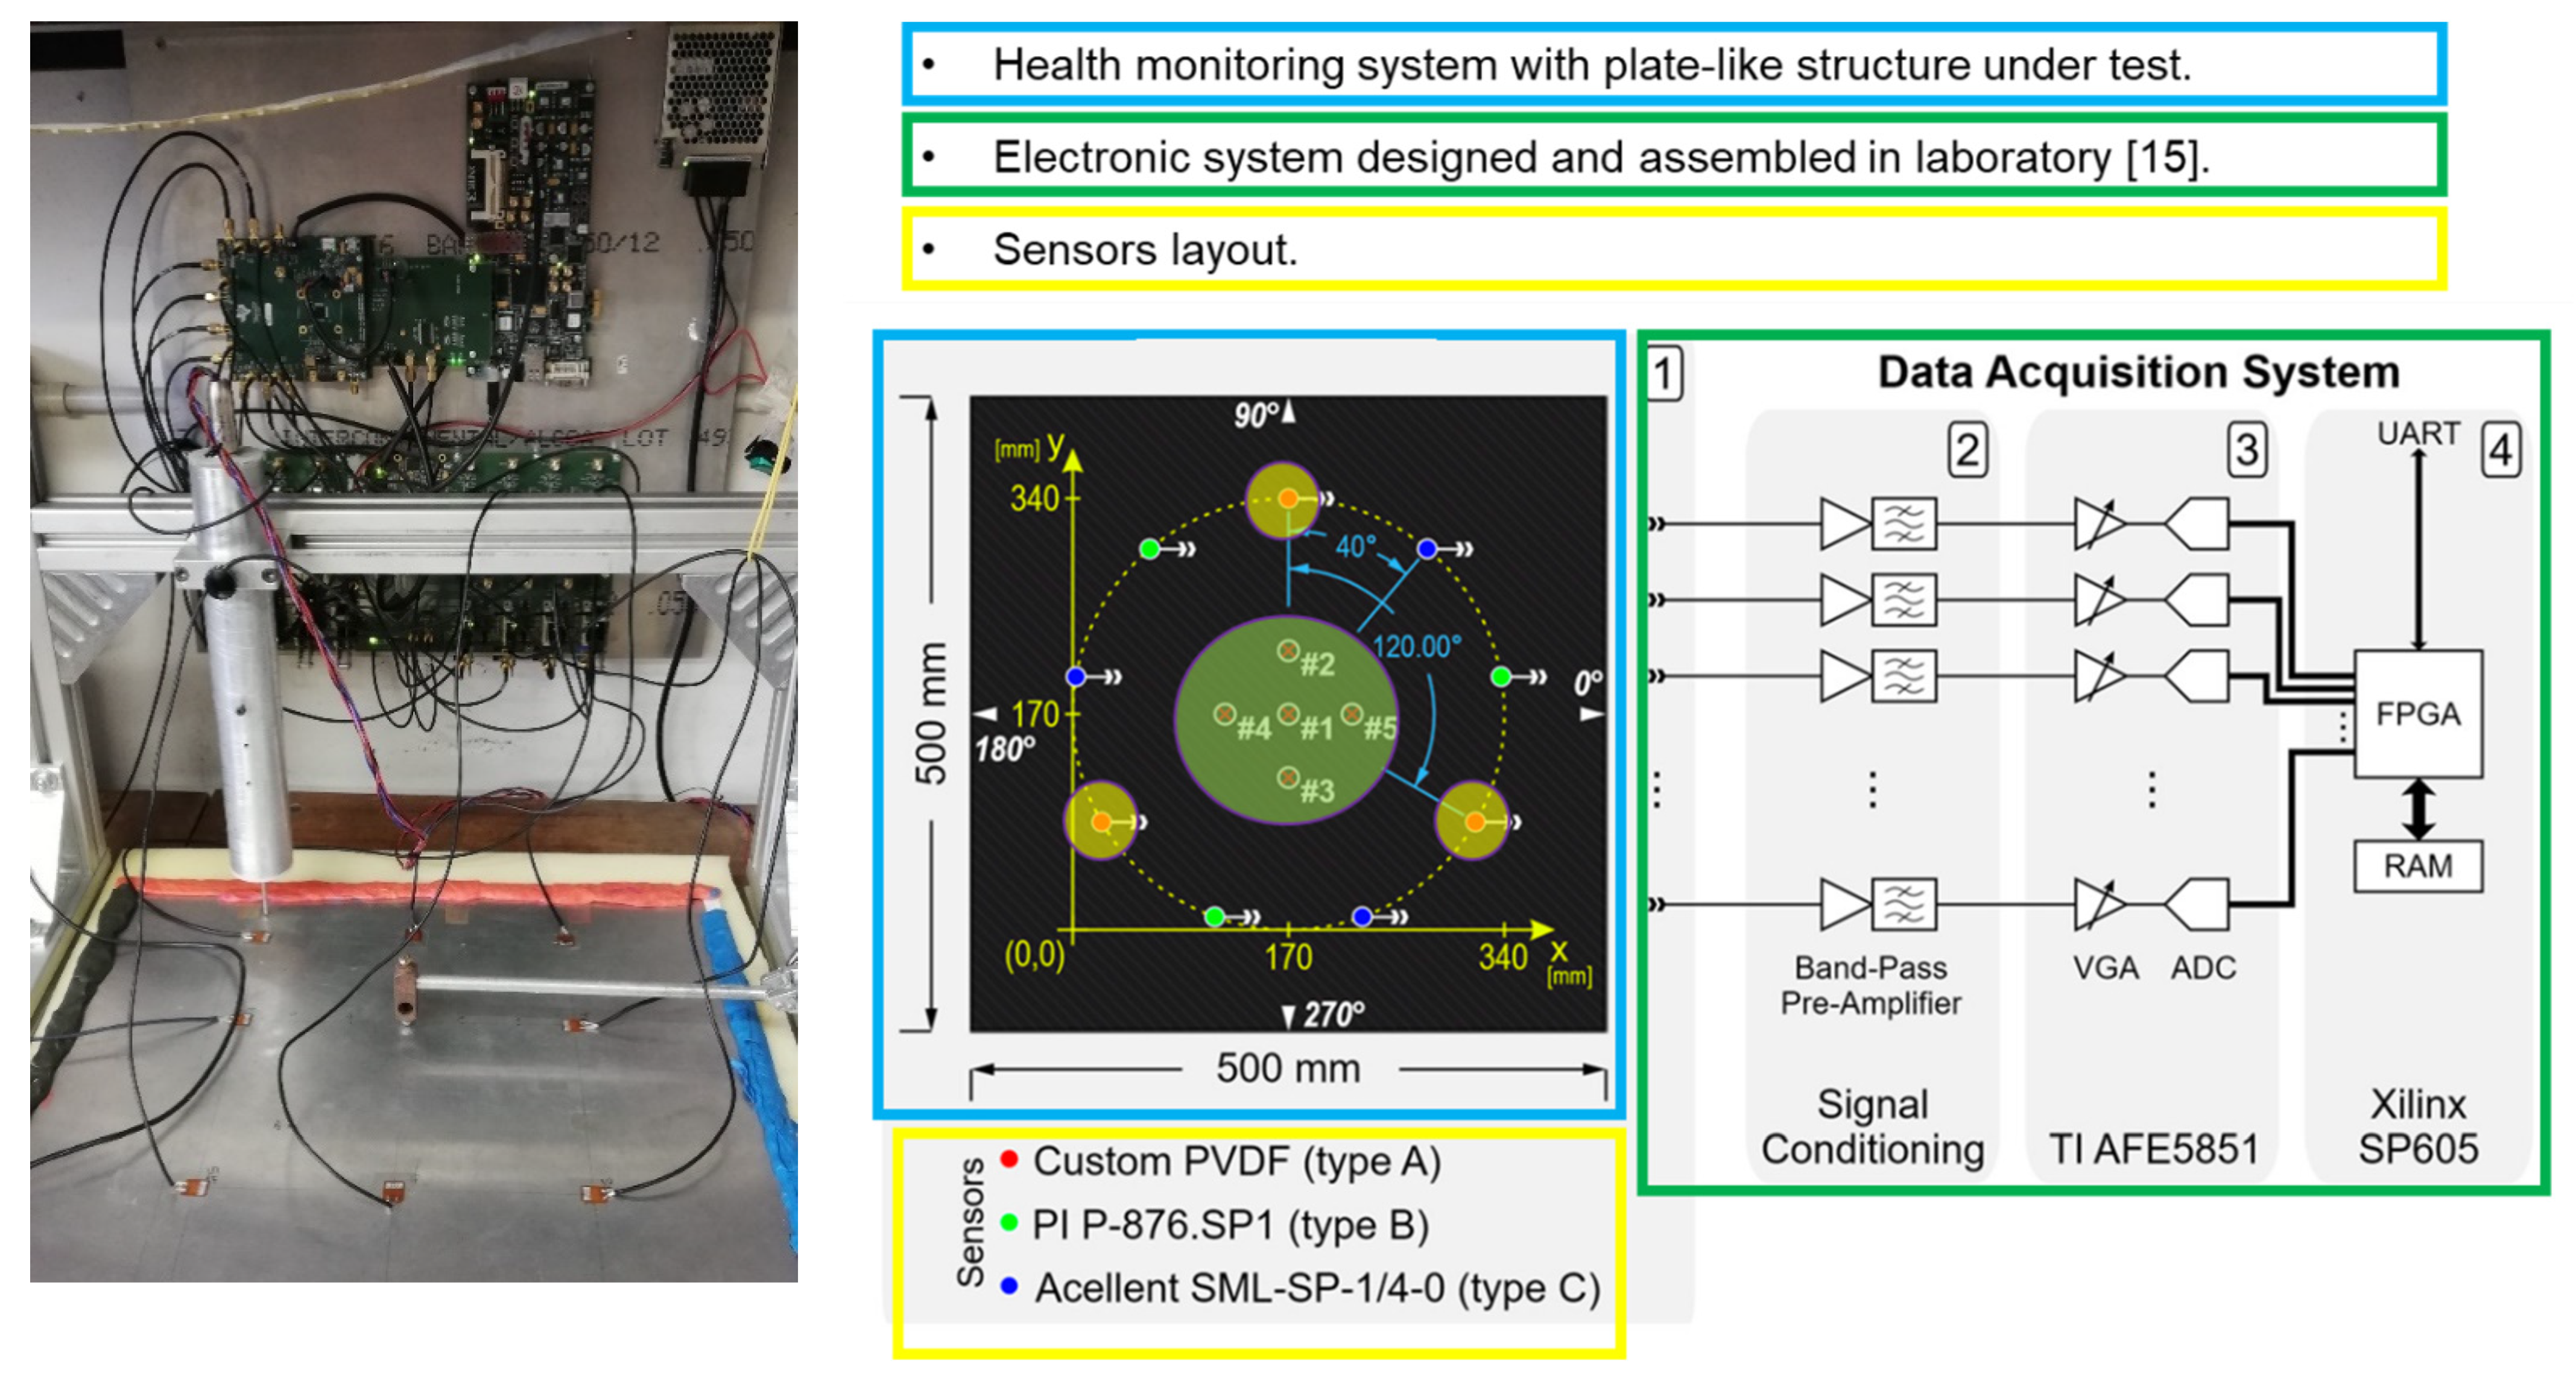
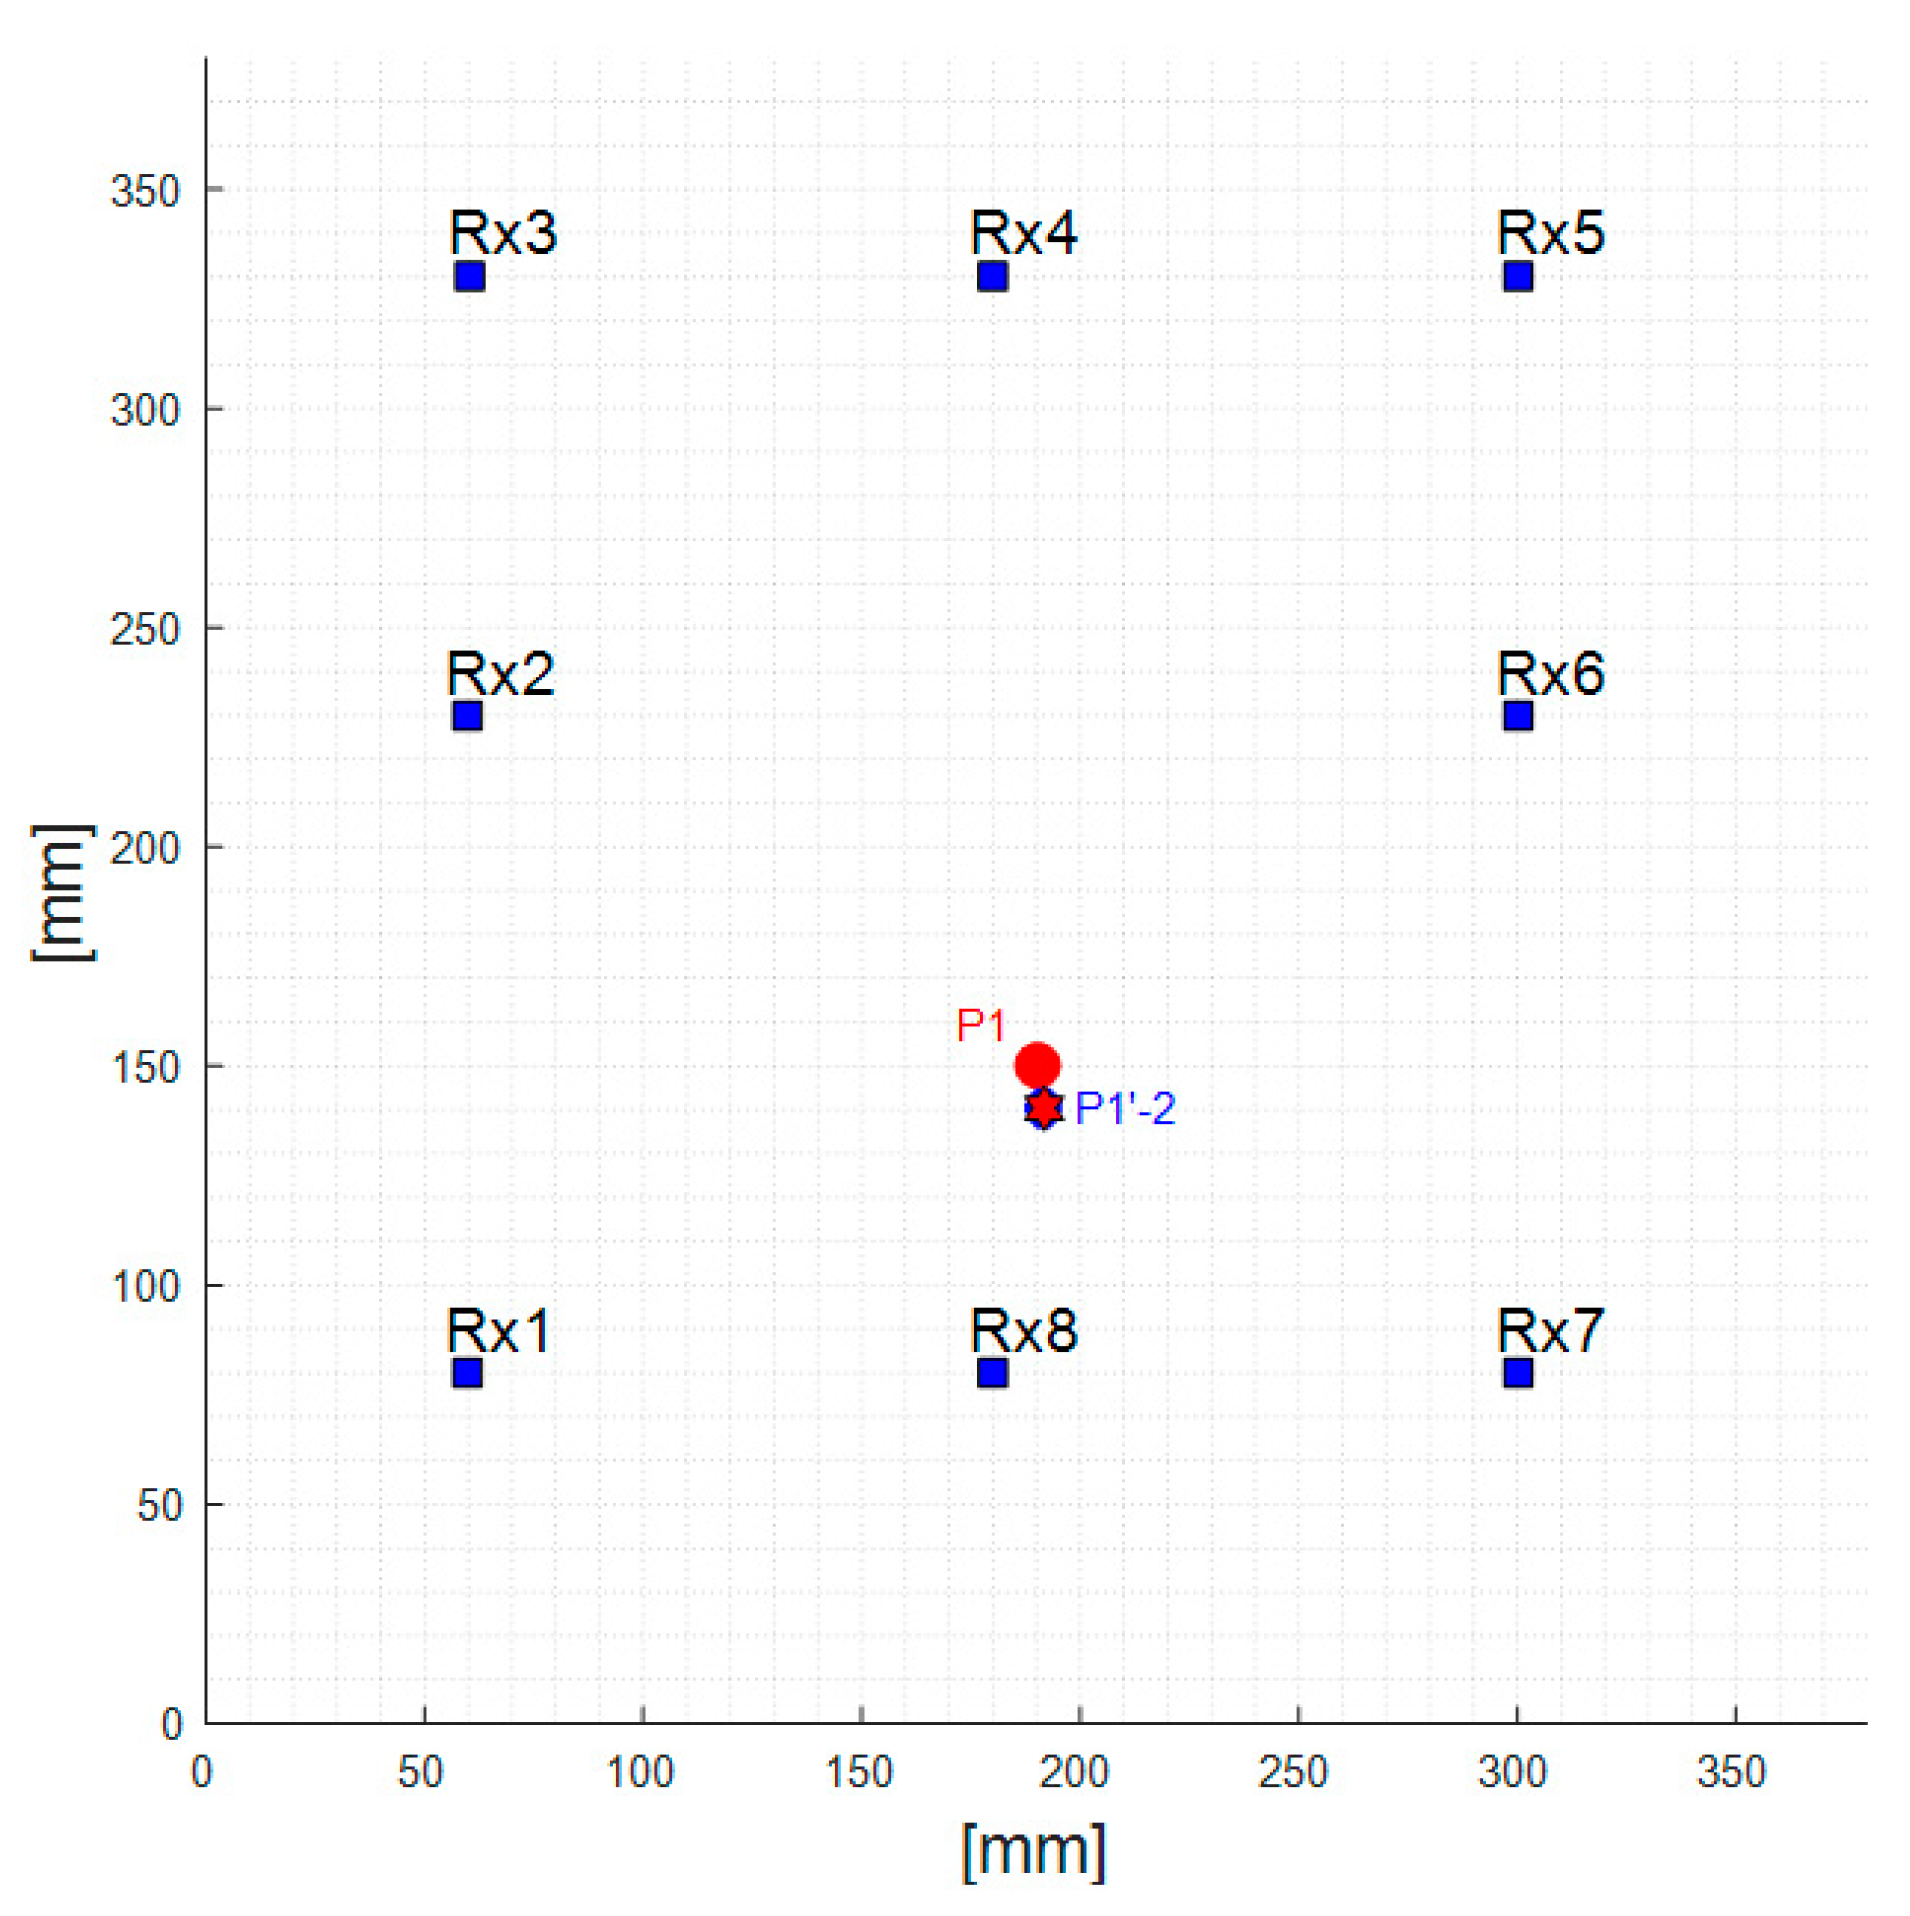
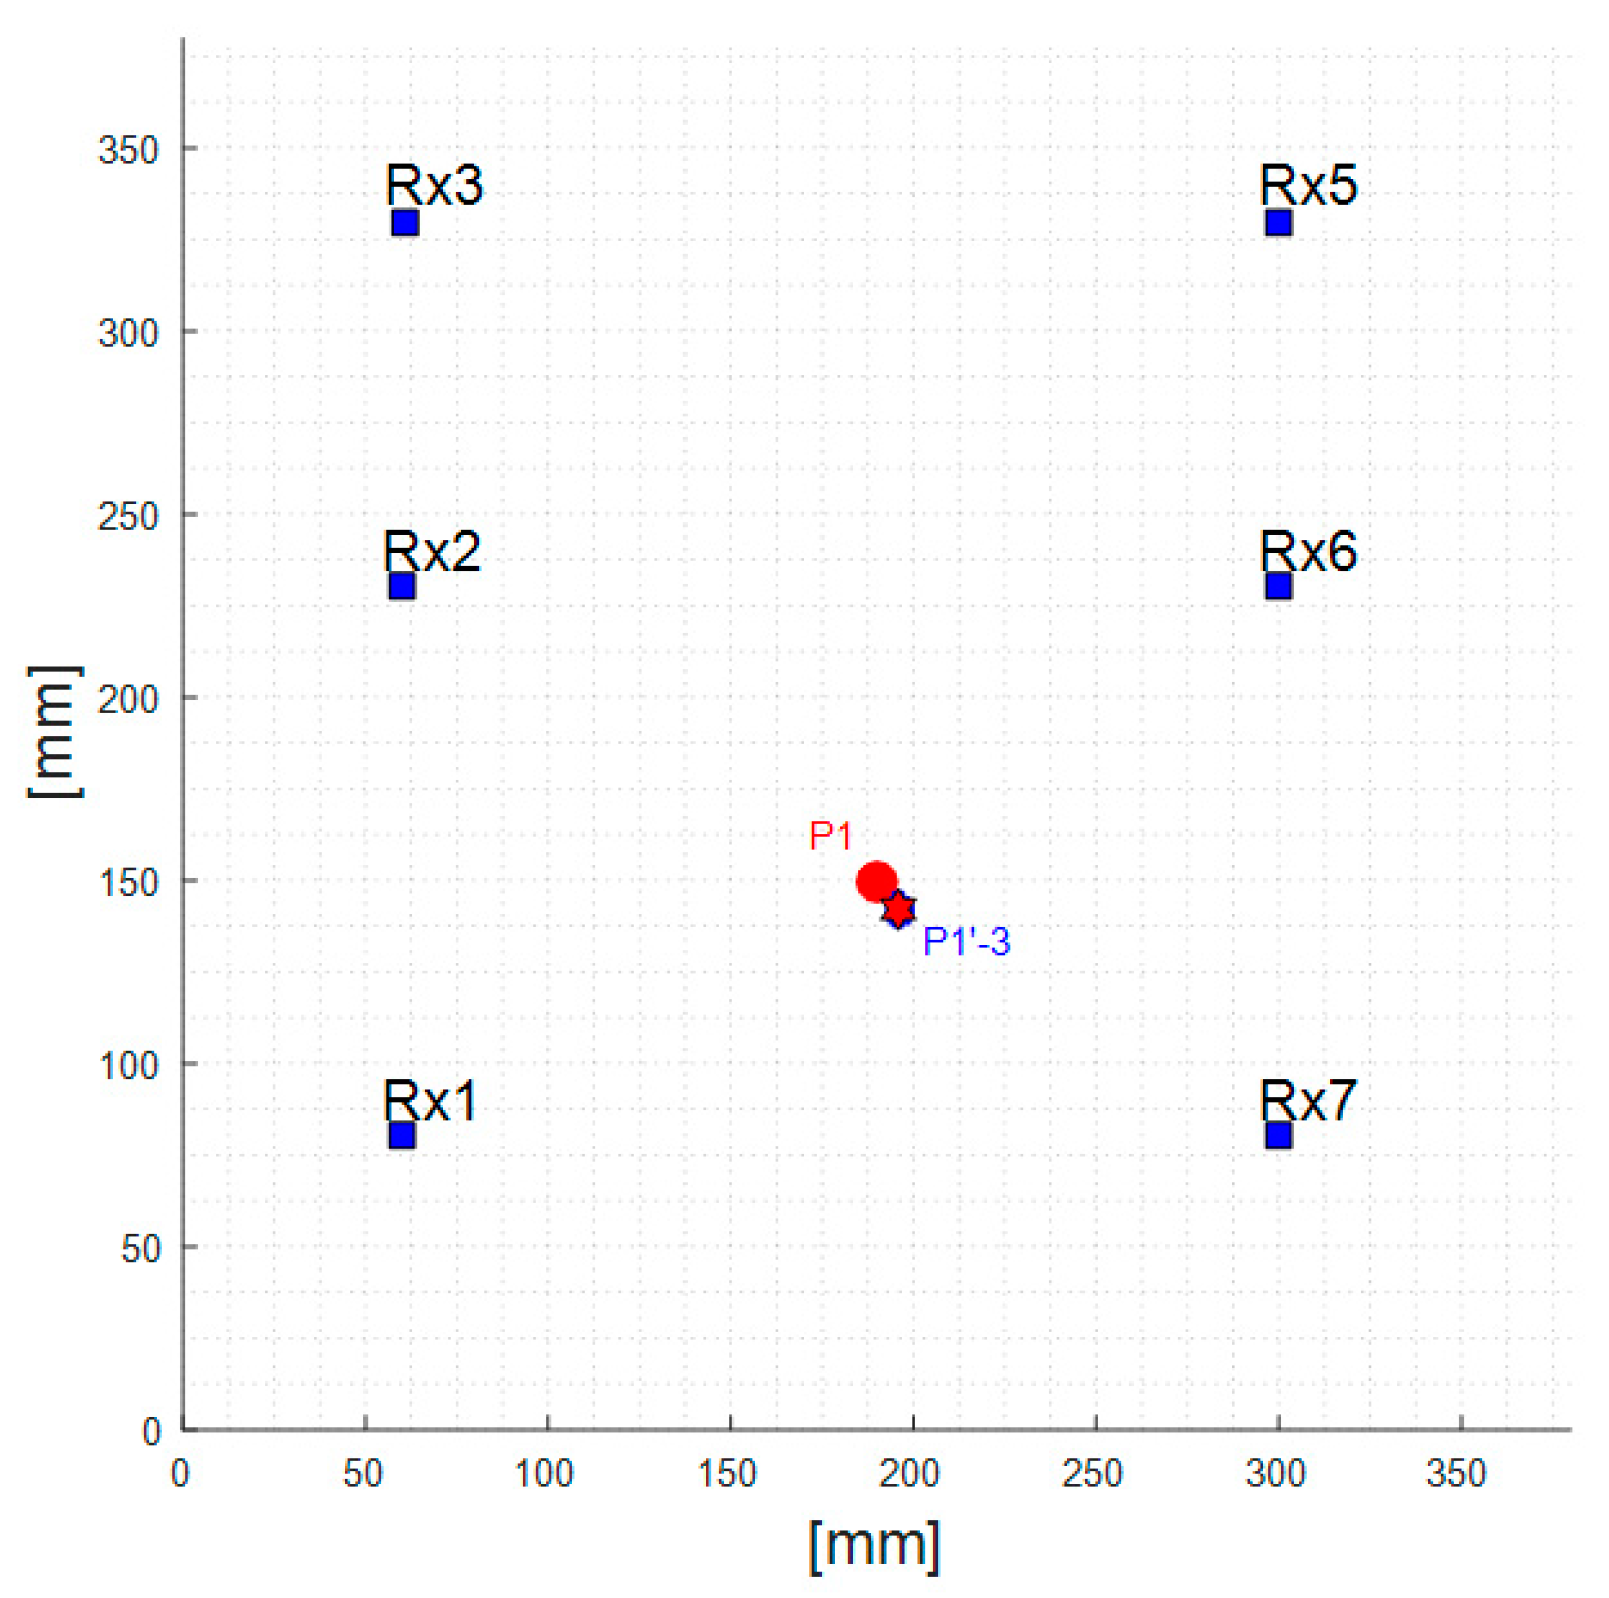
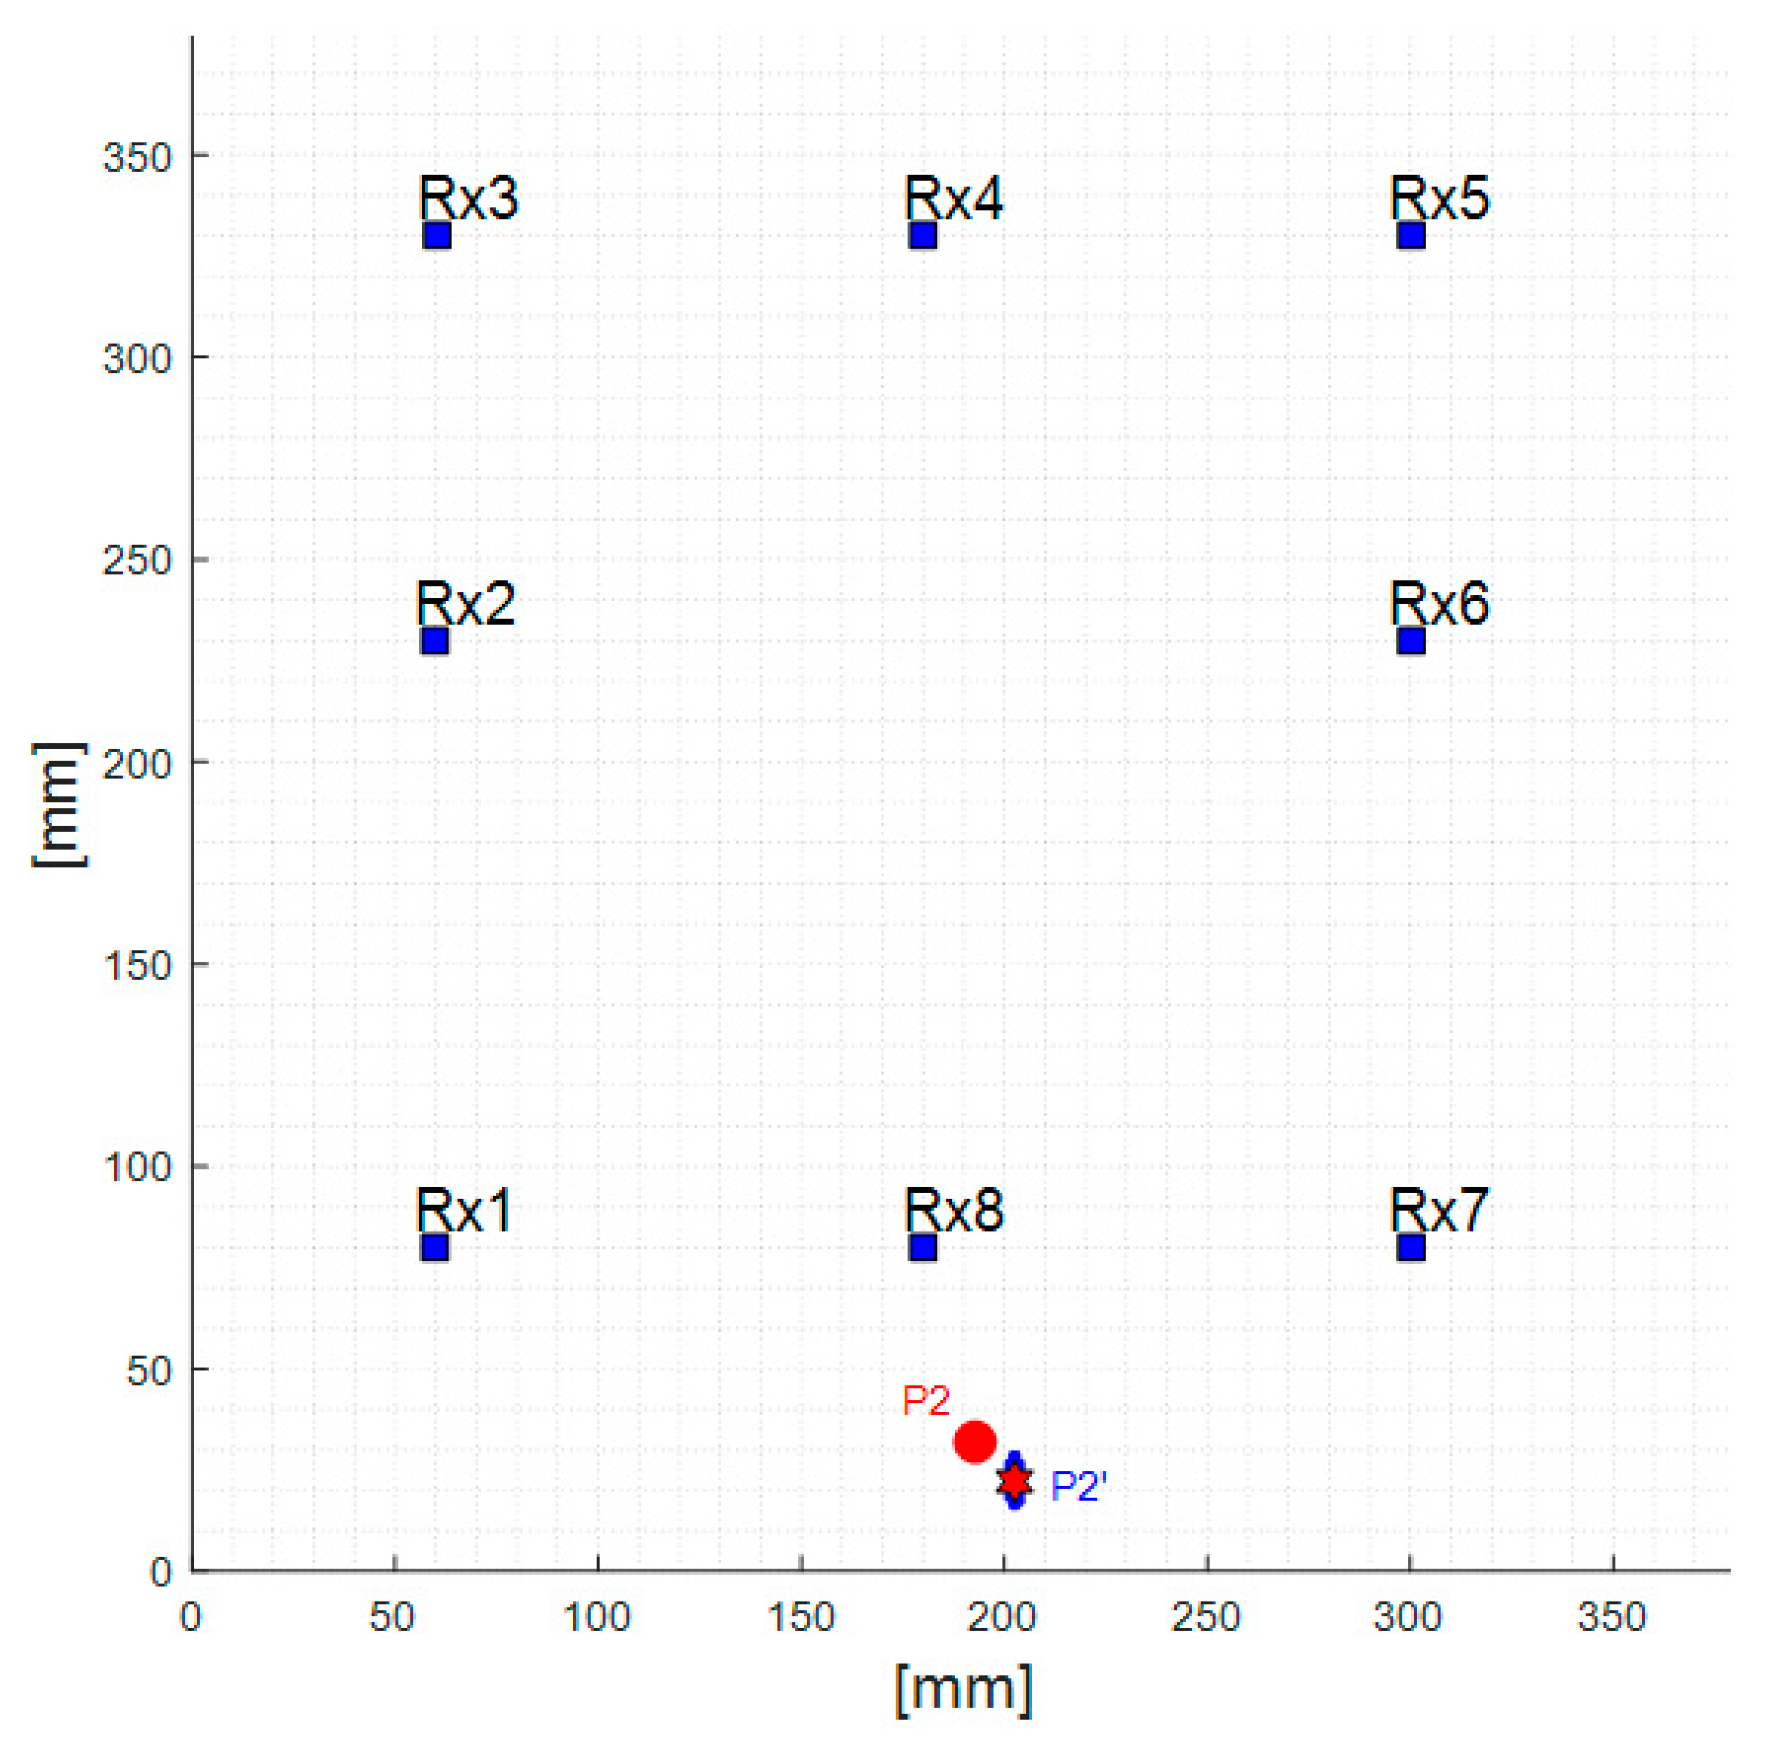
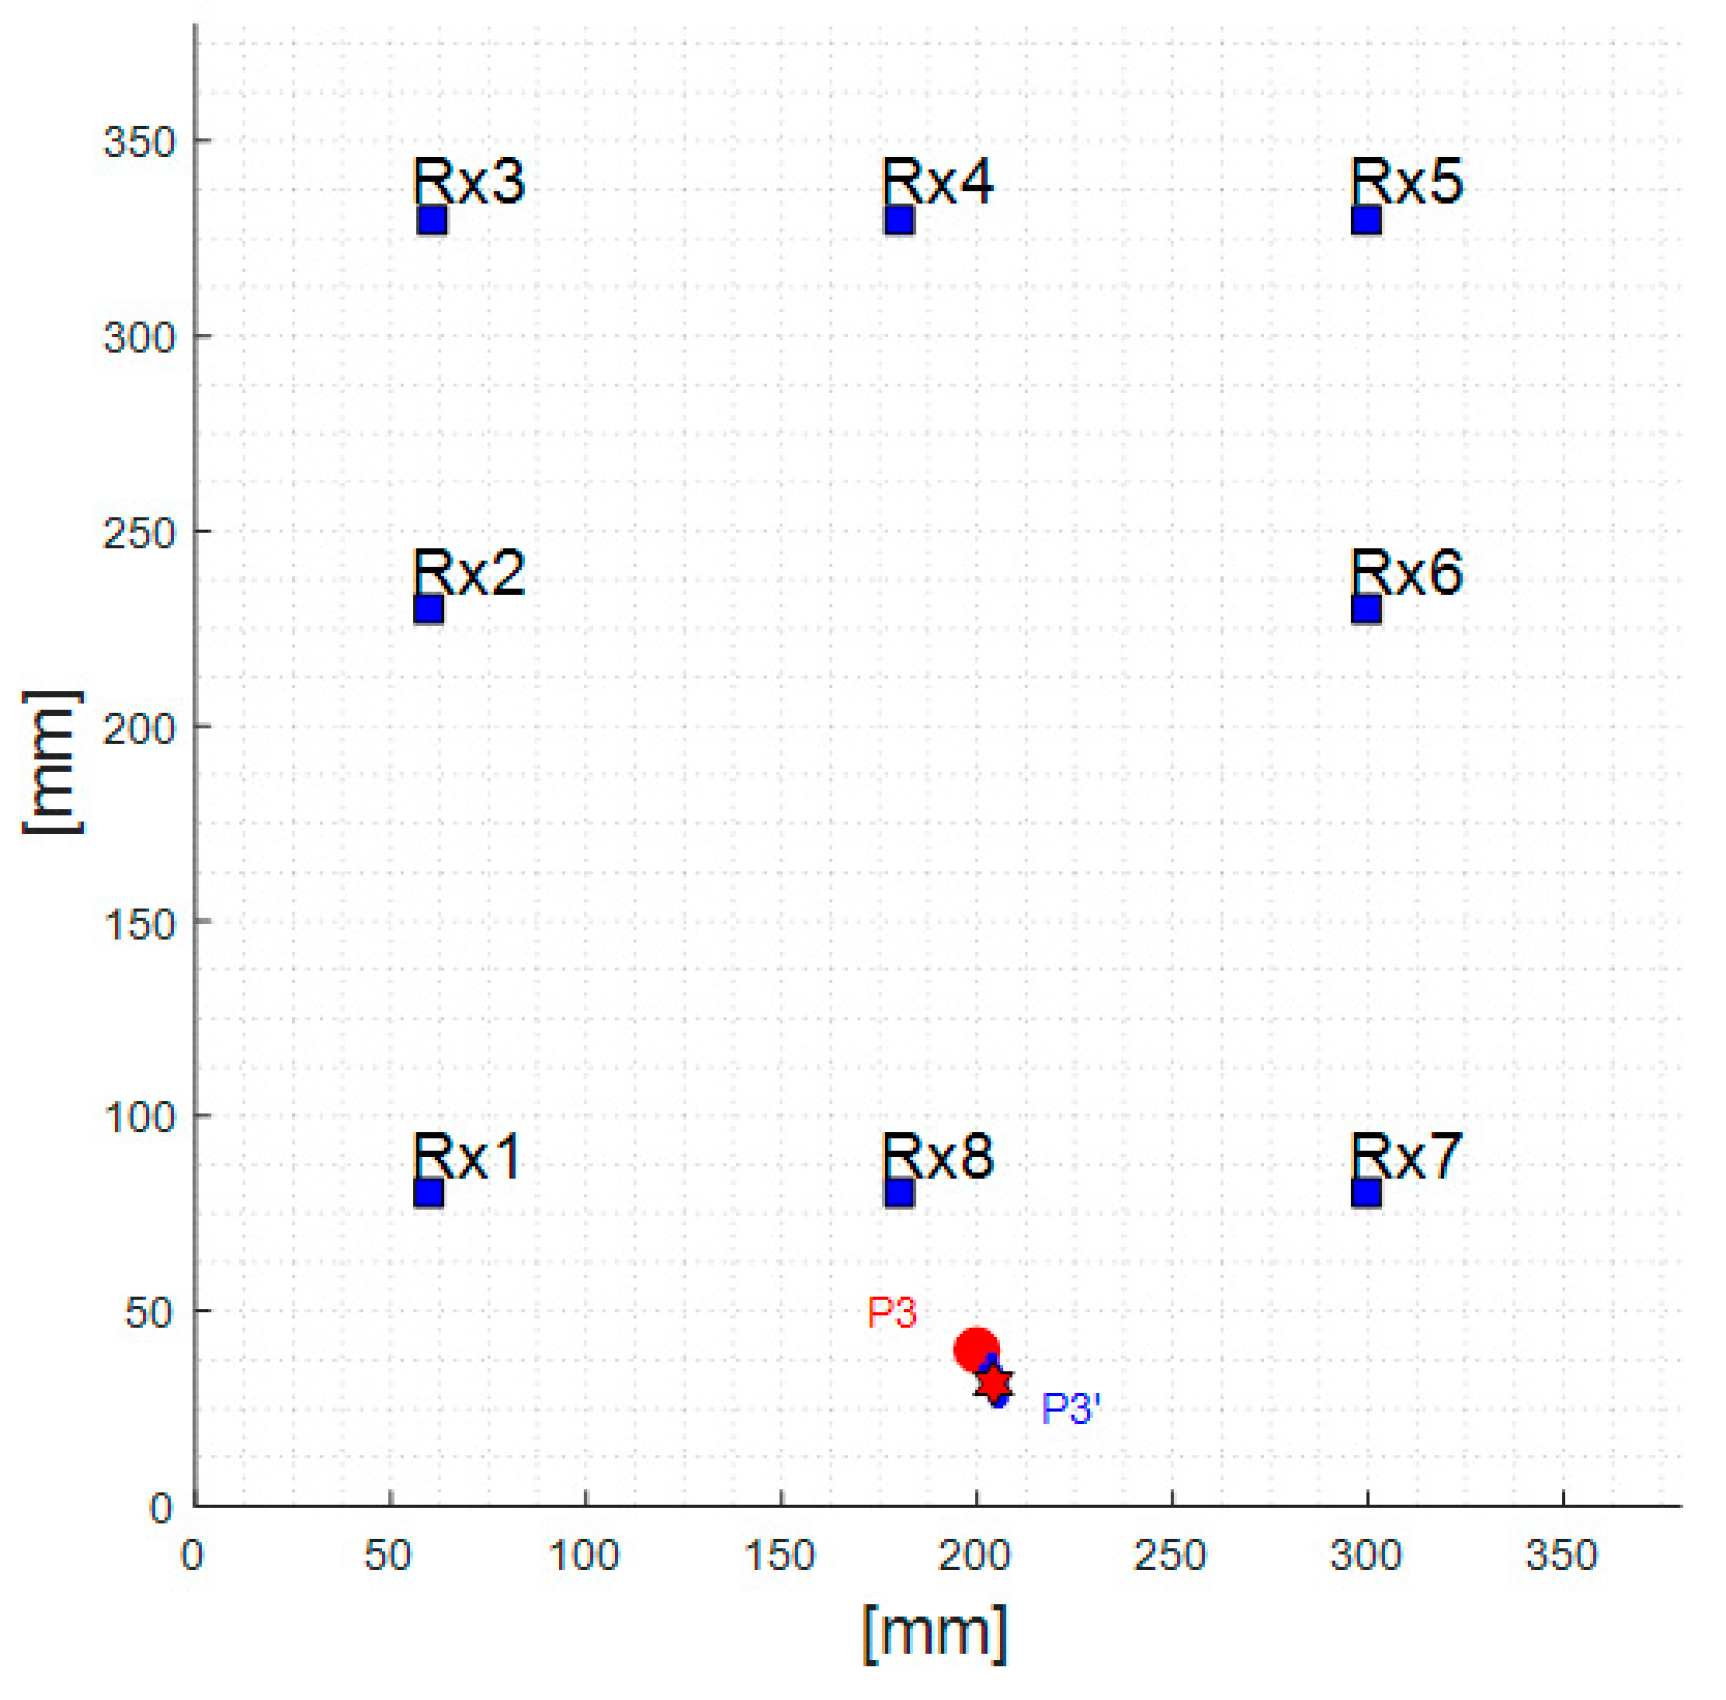
- sensor layout installed on the plate-like structure, coordinate reference system, and impact point markers (#1, #2, #3, #4, #5, etc.),
- (2)
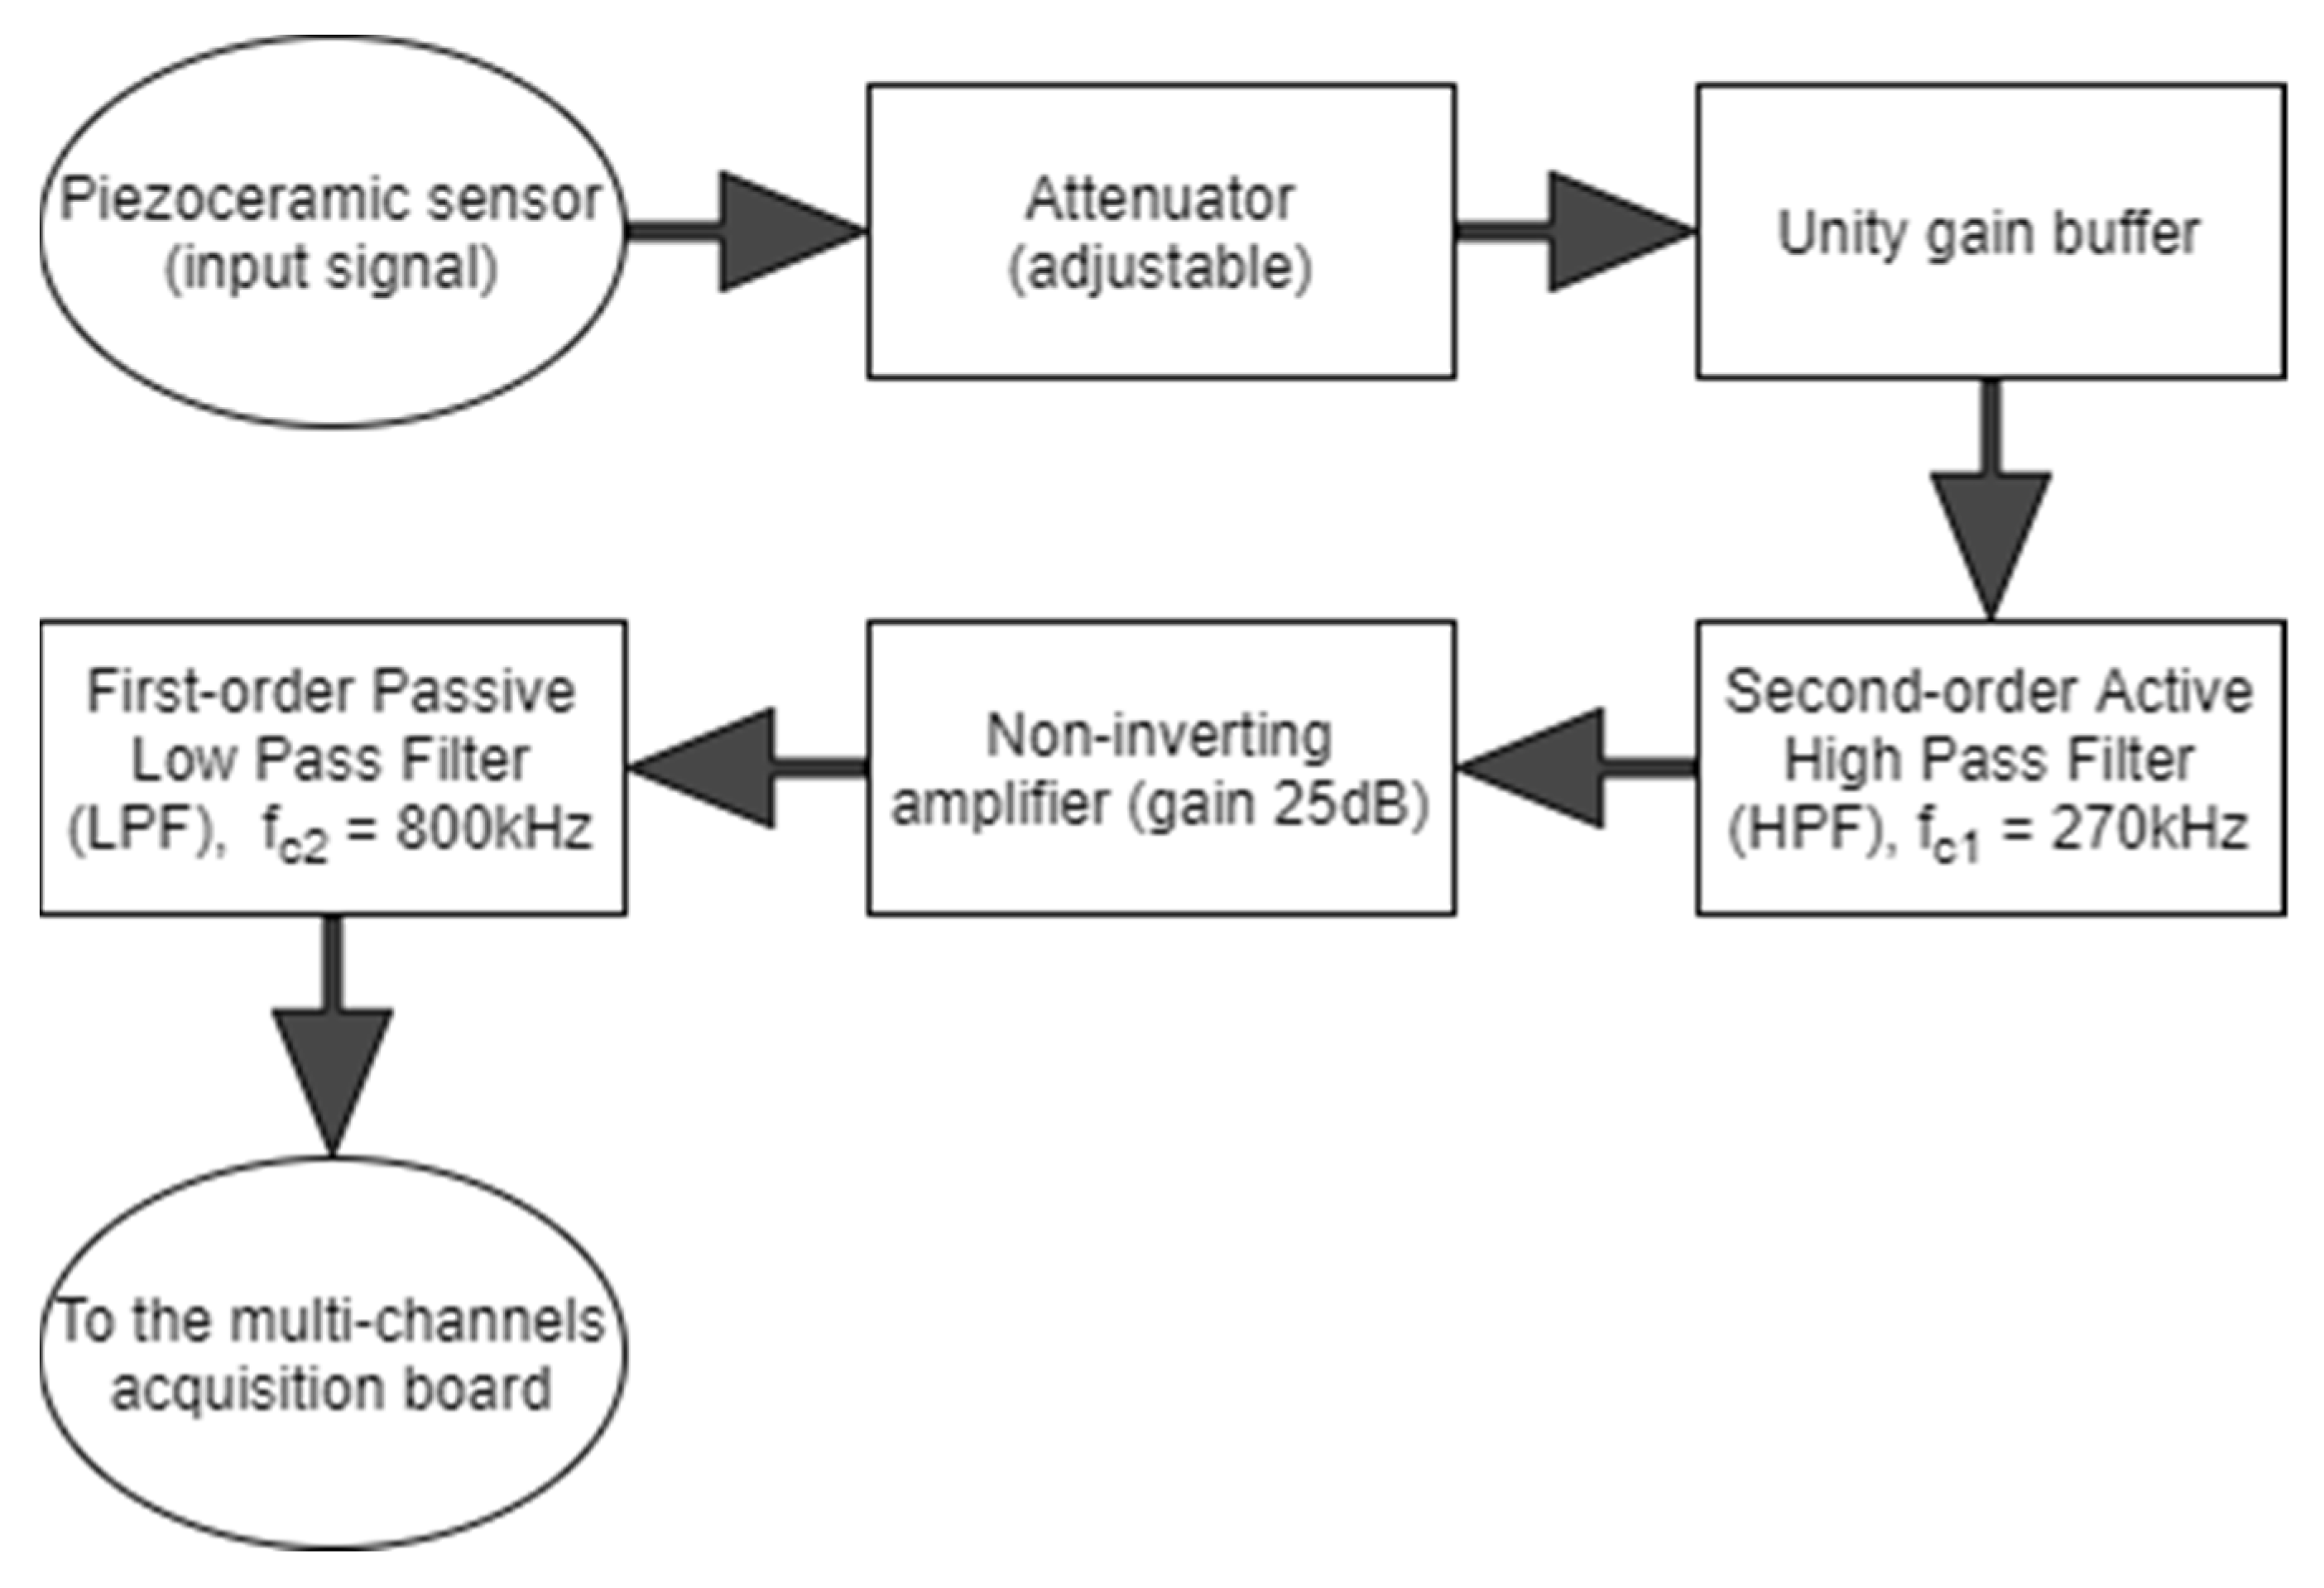
- signal-conditioning electronics,
- (3)
- multichannel VGA with ADC evaluation module (Texas Instruments AFE5851EVM, Dallas, TX, USA), and
- (4)
- Spartan-6 FPGA evaluation card (Xilinx SP605).

4. Experimental Results
5. Discussion and Final Remarks
Author Contributions
Funding
Institutional Review Board Statement
Informed Consent Statement
Acknowledgments
Conflicts of Interest
Abbreviations
| Acronym | |
| ADC | Analog-to-digital converter |
| AFE | Analog front-end |
| AI | Artificial intelligence |
| CFRP | Composite fiber reinforce polymer |
| CWT | Continuous wavelet transform |
| DToA | Differential time of arrival |
| IDT | Interdigital transducer |
| NDT | Non-destructive testing |
| PVDF | Polyvinylidene fluoride |
| PZT | Lead zirconate titanate |
| ROI | Region of interest |
| SHM | Structural health monitoring |
| SNR | Signal-to-noise ratio |
| STFT | Short-time Fourier transform |
References
- Giurgiutiu, V. Structural Health Monitoring: With Piezoelectric Wafer Active Sensors, 2nd ed.; Elsevier: Amsterdam, The Netherlands, 2014; 1024p, ISBN 9780124186910. [Google Scholar]
- Rose, J.L. Ultrasonic Guided Waves in Solid Media; Cambridge University Press: Cambridge, UK, 2014. [Google Scholar]
- Ostachowicz, W.; Kudela, P.; Krawczuk, M.; Zak, A. Guided Waves in Structures for SHM: The Time-Domain Spectral Element Method; John Wiley & Sons: New York, NY, USA, February 2012; 350p, ISBN 978-0-470-97983-9. [Google Scholar]
- Purekar, A.S.; Pines, D.J. Damage detection in thin composite laminates using piezoelectric phased sensor arrays and guided lamb wave interrogation. J. Intell. Mater. Syst. Struct. 2010, 21, 995–1010. [Google Scholar] [CrossRef]
- Qiu, L.; Deng, X.; Yuan, S.; Huang, Y.; Ren, Y. Impact monitoring for aircraft smart composite skins based on a lightweight sensor network and characteristic digital sequences. Sensors 2018, 18, 2218. [Google Scholar] [CrossRef] [PubMed]
- Tobias, A. Acoustic-emission source location in two dimensions by an array of three sensors. Non-Destr. Test. 1976, 9, 9–12. [Google Scholar] [CrossRef]
- Ciampa, F.; Meo, M. A new algorithm for acoustic emission localization and flexural group velocity determination in anisotropic structures. Compos. Part A Appl. Sci. Manuf. 2010, 41, 1777–1786. [Google Scholar] [CrossRef]
- Mohd, S.; Holford, K.M.; Pullin, R. Continuous wavelet transform analysis and modal location analysis acoustic emission source location for nuclear piping crack growth monitoring. In Proceedings of the AIP Conference Proceedings, Punjab, India, 17–21 December 2014; pp. 61–68. [Google Scholar]
- Yin, S.; Cui, Z.; Kundu, T. Acoustic source localization in anisotropic plates with “Z” shaped sensor clusters. Ultrasonics 2018, 84, 34–37. [Google Scholar] [CrossRef] [PubMed]
- Worden, K.; Staszewski, W.J. Impact location and quantification on a composite panel using neural networks and a genetic algorithm. Strain 2000, 36, 61–68. [Google Scholar] [CrossRef]
- Carrino, S.; Nicassio, F.; Scarselli, G. An innovative method based on nonlinear Lamb waves for locating disbonds in Single-Lap joints. In Proceedings of the 2019 IEEE 5th International Workshop on Metrology for AeroSpace (MetroAeroSpace), Torino, Italy, 19–21 June 2019; pp. 187–191. [Google Scholar]
- Carrino, S.; Nicassio, F.; Scarselli, G. Non-linear Lamb Waves for Locating Defects in Single-Lap Joints. Front. Built Environ. J. 2020, 6. [Google Scholar] [CrossRef]
- Kundu, T. Acoustic source localization. Ultrasonics 2014, 54, 25–38. [Google Scholar] [CrossRef] [PubMed]
- Sen, N.; Kundu, T. A new wave front shape-based approach for acoustic source localization in an anisotropic plate without knowing its material properties. Ultrasonics 2018, 87, 20–32. [Google Scholar] [CrossRef] [PubMed]
- Bulletti, A.; Giannelli, P.; Calzolai, M.; Capineri, L. An Integrated Acousto/Ultrasonic Structural Health Monitoring System for Composite Pressure Vessels. IEEE Trans. Ultrason. Ferroelectr. Freq. Control 2016, 63, 864–873. [Google Scholar] [CrossRef] [PubMed]
- Merlo, E.M.; Bulletti, A.; Giannelli, P.; Calzolai, M.; Capineri, L. An Integrated Acousto/Ultrasonic Structural Health Monitoring System for Composite Pressure Vessels, A Novel Differential Time-of-Arrival Estimation Technique for Impact Localization on Carbon Fiber Laminate Sheets. Sensors 2017, 17, 2270. [Google Scholar] [CrossRef] [PubMed]
- Merlo, E.M.; Bulletti, A.; Giannelli, P.; Calzolai, M.; Capineri, L. Analysis of Errors in the Estimation of Impact Positions in Plate-Like Structure through the Triangulation Formula by Piezoelectric Sensors Monitoring. Sensors 2018, 18, 3426. [Google Scholar] [CrossRef] [PubMed]
- Lehmann, M.; Büter, A.; Frankenstein, B.; Schubert, F.; Brunner, B. Monitoring System for Delamination Detection-Qualification of Structural Health Monitoring (SHM) Systems. In Proceedings of the Conference on Damage in Composite Materials (CDCM), Stuttgart, Germany, 18–19 September 2006. [Google Scholar]
- Ono, K. Review on Structural Health Evaluation with Acoustic Emission. Appl. Sci. 2018, 8, 958. [Google Scholar] [CrossRef]
- Xinlin, Q.; Wenzhuo, L.; Yishou, W.; Hu, S. Piezoelectric Transducer-Based Structural Health Monitoring for Aircraft Applications. Sensors 2019, 19, 545. [Google Scholar] [CrossRef]
- Capineri, L.; Bulletti, A.; Calzolai, M.; Giannelli, P.; Francesconi, D. Arrays of conformable ultrasonic Lamb wave transducers for structural health monitoring with real-time electronics. Procedia Eng. 2014, 87, 1266–1269. [Google Scholar] [CrossRef]
- Ebrahimkhanlou, A.; Dubuc, B.; Salamone, S. A generalizable deep learning framework for localizing and characterizing acoustic emission sources in riveted metallic panels. Mech. Syst. Signal Process. 2019, 130, 248–272. [Google Scholar] [CrossRef]
- Ross, R. Structural health monitoring and impact detection using neural networks for damage characterization. In Proceedings of the 47th AIAA/ASME/ASCE/AHS/ASC Structures, Structural Dynamics, and Materials Conference 14th AIAA/ASME/AHS Adaptive Structures Conference 7th, Newport, RI, USA, 1–4 May 2006; p. 2117. [Google Scholar]
- Bulletti, A.; Merlo, E.M.; Capineri, L. Analysis of the accuracy in impact localization using piezoelectric sensors for Structural Health Monitoring with multichannel real-time electronics. In Proceedings of the 2020 IEEE 7th International Workshop on Metrology for AeroSpace (MetroAeroSpace), Pisa, Italy, 22–24 June 2020. [Google Scholar]


| Front-End #1 | Front-End #2 | |
|---|---|---|
| Zin = 50 Ω | 1 m V | 1 m V |
| Predicted Impact | Estimated Position | Positioning Error | Error = Positioning Error/500 mm % |
|---|---|---|---|
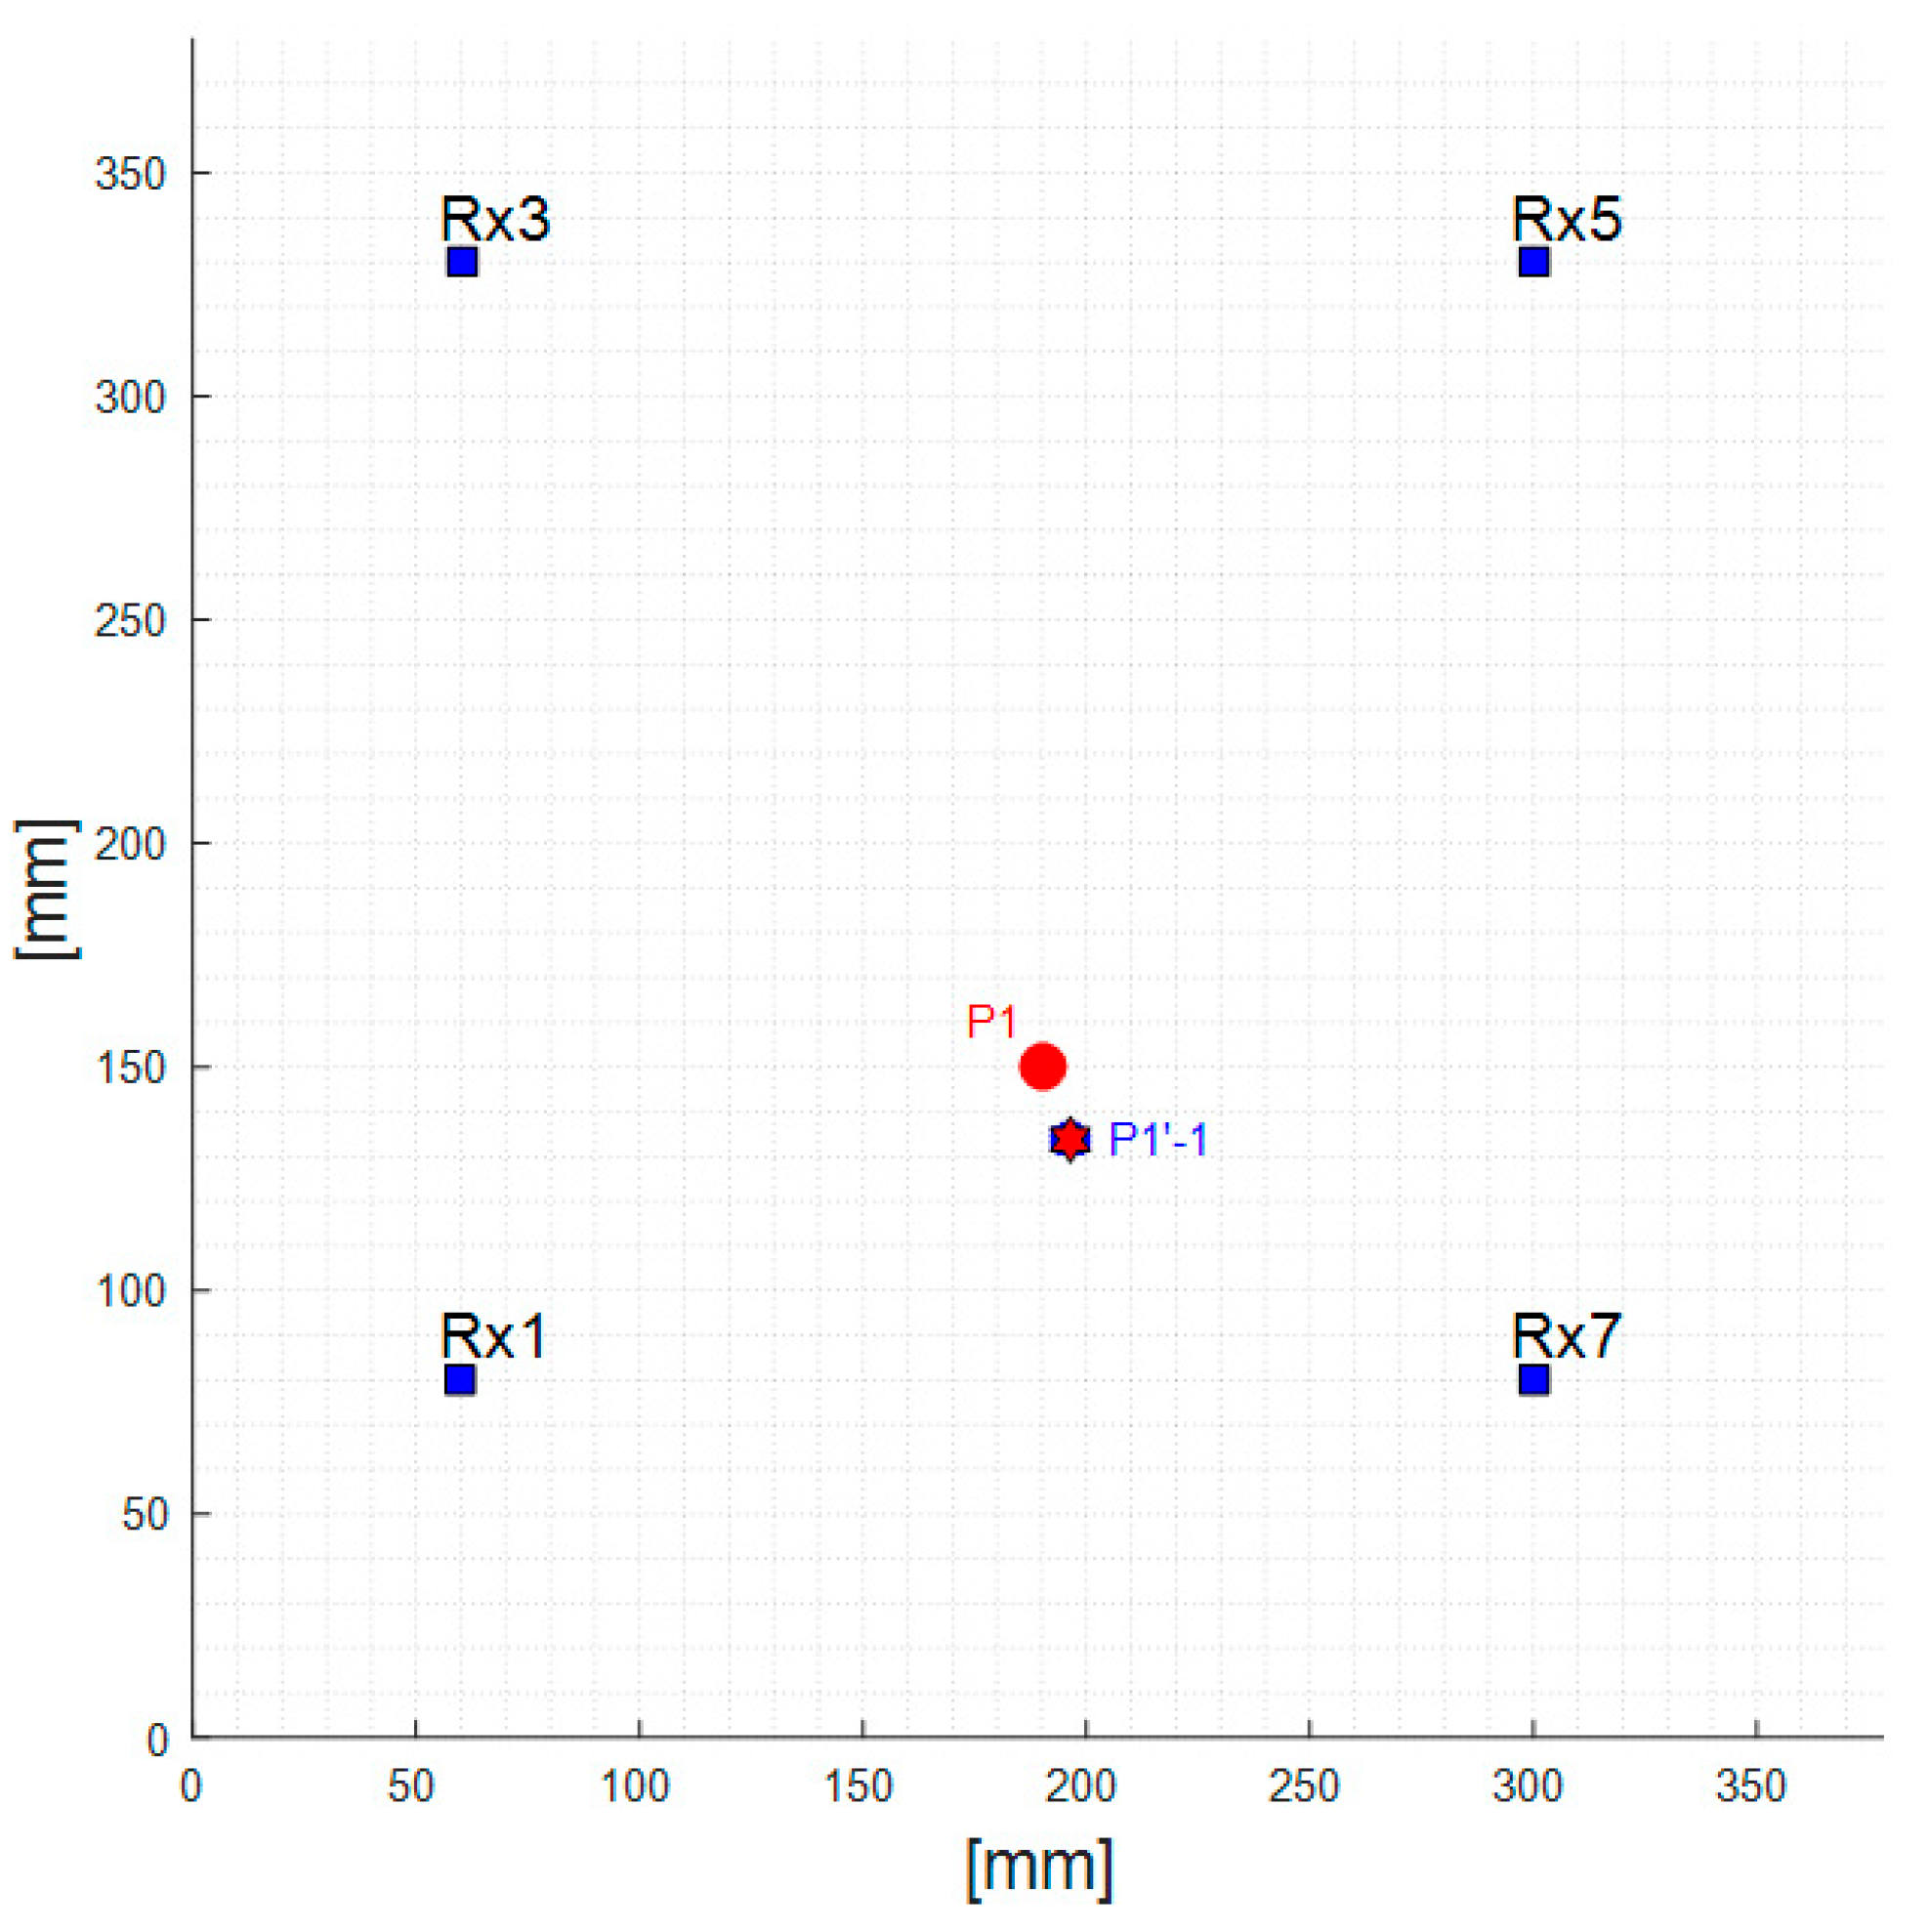
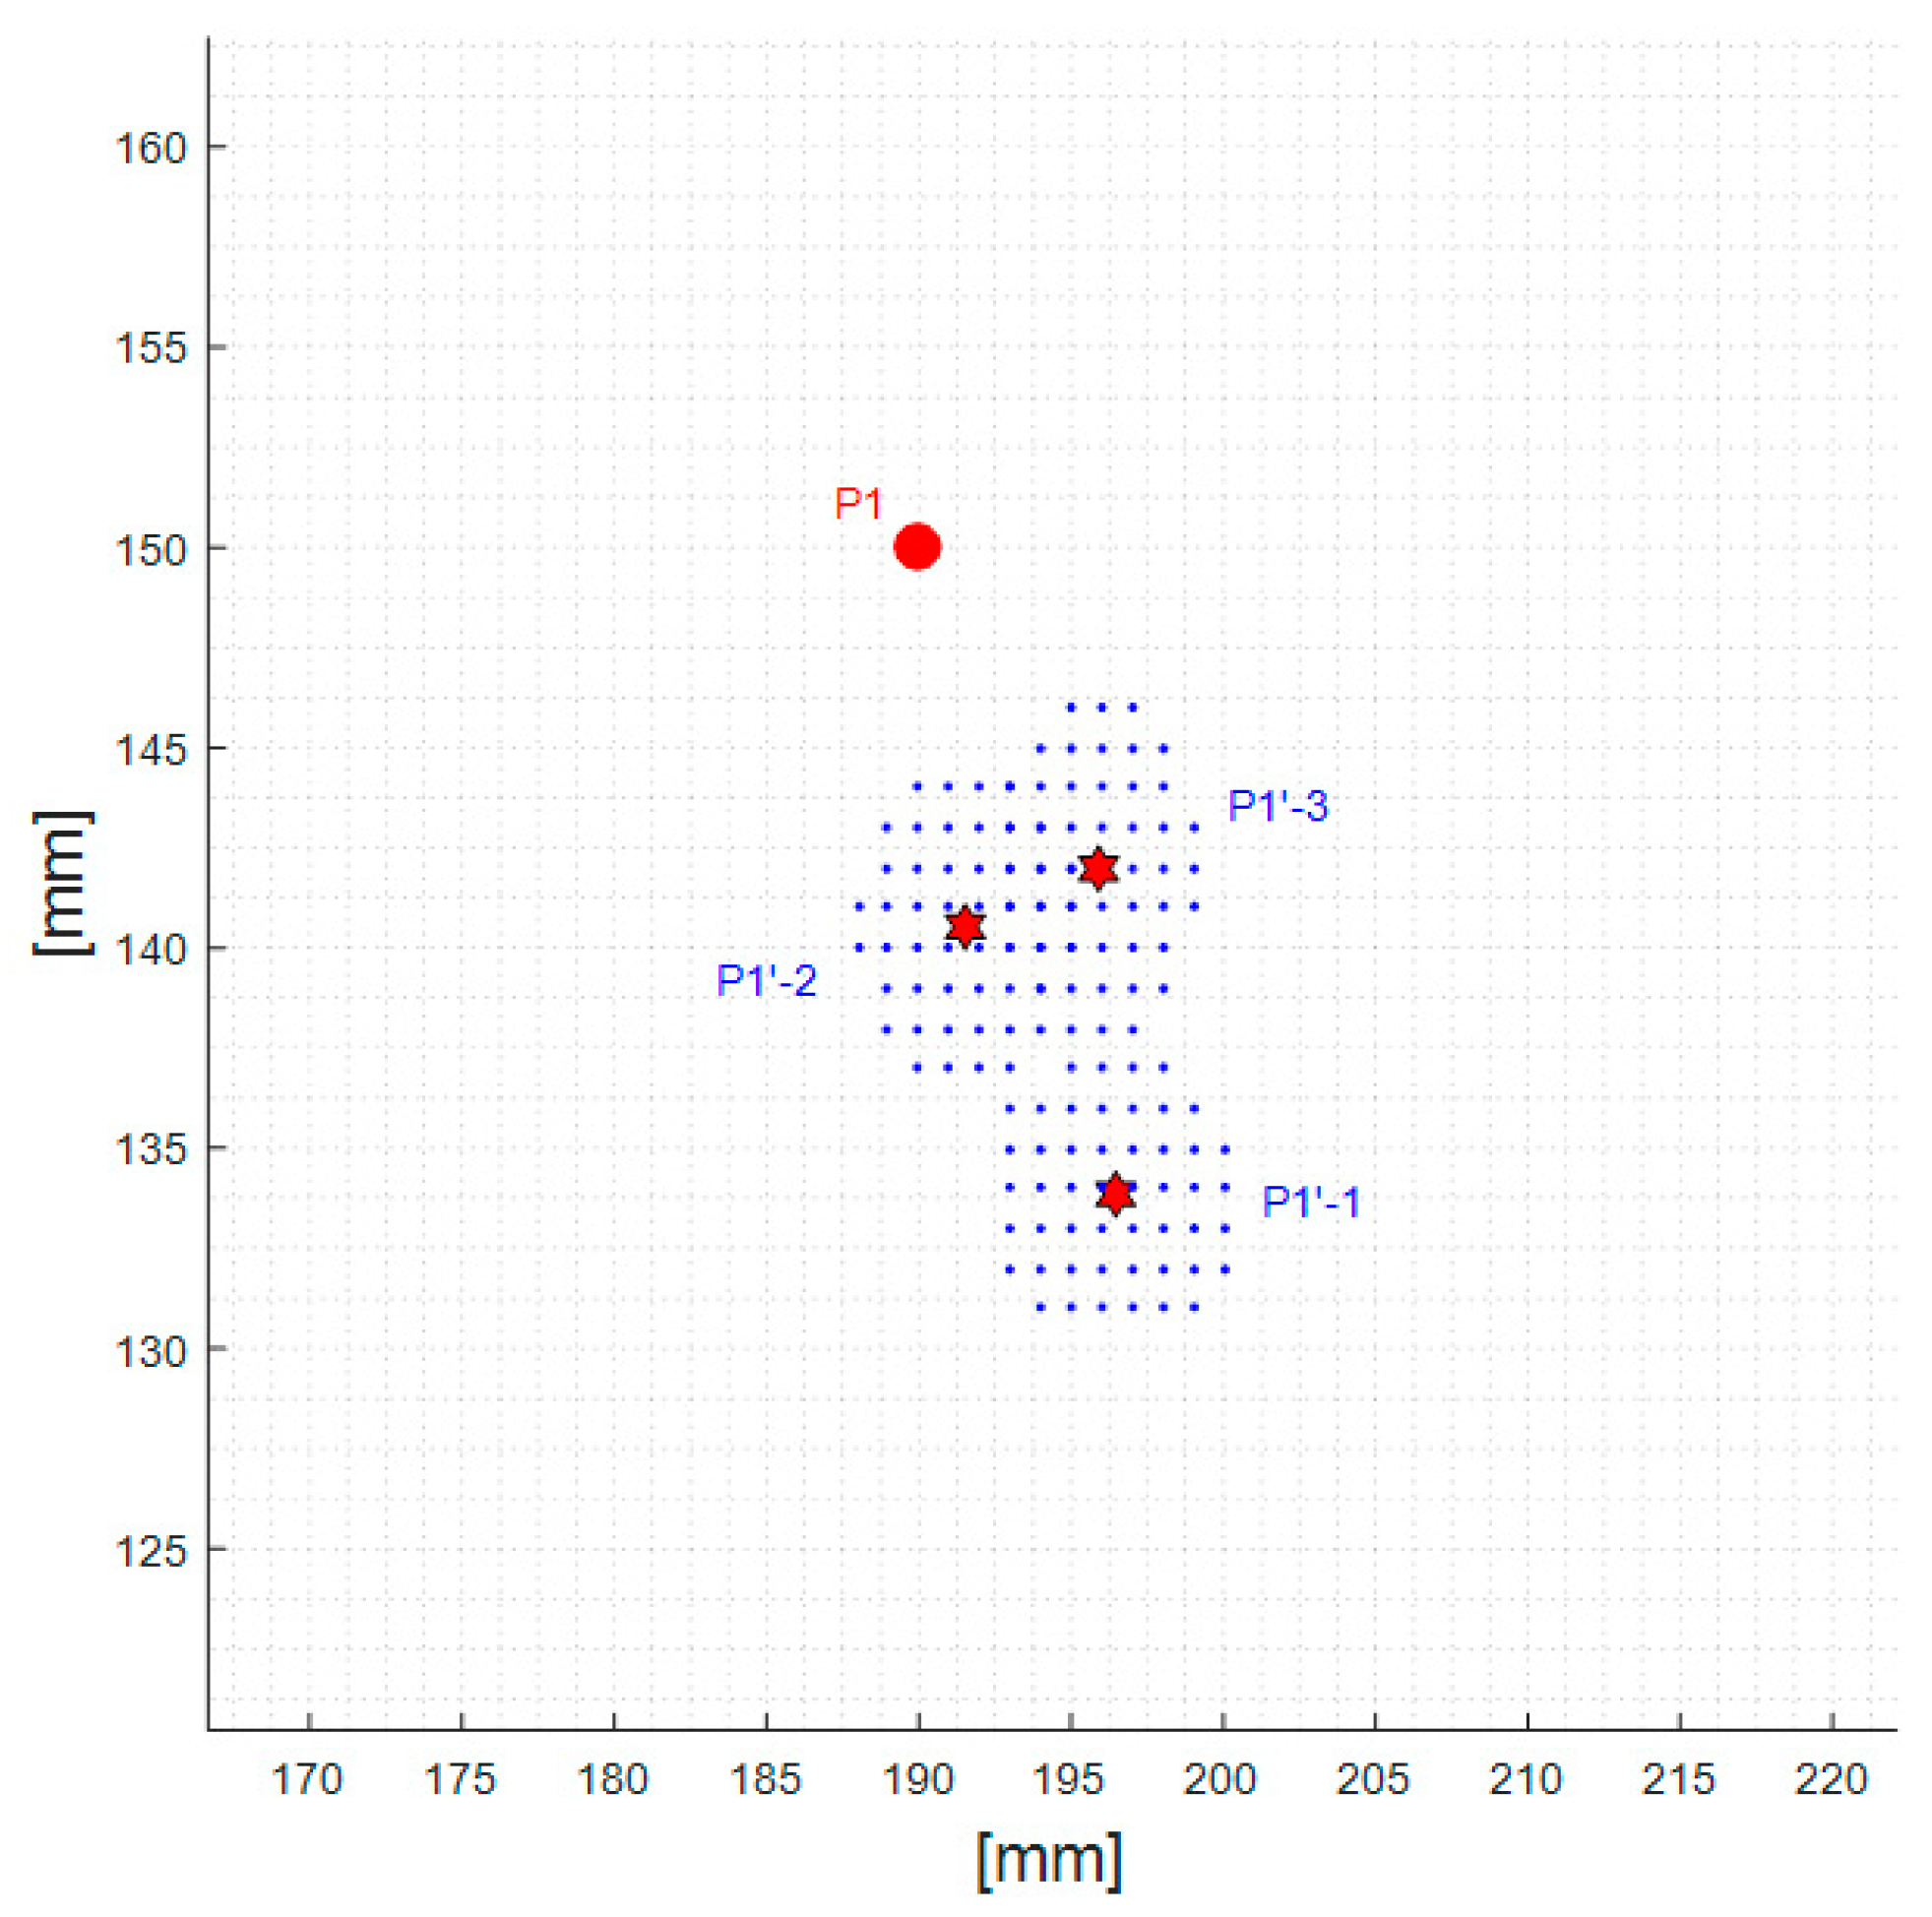
| P1′-1 | x = 196 mm y = 134 mm | 6 mm (x-axis) 16 mm (y-axis) | 1.2% 3.2% |
| P1′-2 | x = 192 mm y = 141 mm | 2 mm (x-axis) 9 mm (y-axis) | 0.4% 1.8% |
| P1′-3 | x = 196 mm y = 142 mm | 6 mm (x-axis) 8 mm (y-axis) | 1.2% 1.6% |
| Predicted Impact | Estimated Position | Positioning Error | Error = Positioning Error/500 mm % |
|---|---|---|---|
| P2′ | x = 202 mm y = 22 mm | 9 mm (x-axis) 10 mm (y-axis) | 1.8% 2.0% |
| Predicted Impact | Estimated Position | Positioning Error | Error % |
|---|---|---|---|
| P3′ | x = 205 mm y = 32 mm | 5 mm (x-axis) 8 mm (y-axis) | 1.0% 1.6% |
Publisher’s Note: MDPI stays neutral with regard to jurisdictional claims in published maps and institutional affiliations. |
© 2021 by the authors. Licensee MDPI, Basel, Switzerland. This article is an open access article distributed under the terms and conditions of the Creative Commons Attribution (CC BY) license (https://creativecommons.org/licenses/by/4.0/).
Share and Cite
Capineri, L.; Bulletti, A.; Marino Merlo, E. Multichannel Real-Time Electronics Platform for the Estimation of the Error in Impact Localization with Different Piezoelectric Sensor Densities. Appl. Sci. 2021, 11, 4027. https://doi.org/10.3390/app11094027
Capineri L, Bulletti A, Marino Merlo E. Multichannel Real-Time Electronics Platform for the Estimation of the Error in Impact Localization with Different Piezoelectric Sensor Densities. Applied Sciences. 2021; 11(9):4027. https://doi.org/10.3390/app11094027
Chicago/Turabian StyleCapineri, Lorenzo, Andrea Bulletti, and Eugenio Marino Merlo. 2021. "Multichannel Real-Time Electronics Platform for the Estimation of the Error in Impact Localization with Different Piezoelectric Sensor Densities" Applied Sciences 11, no. 9: 4027. https://doi.org/10.3390/app11094027
APA StyleCapineri, L., Bulletti, A., & Marino Merlo, E. (2021). Multichannel Real-Time Electronics Platform for the Estimation of the Error in Impact Localization with Different Piezoelectric Sensor Densities. Applied Sciences, 11(9), 4027. https://doi.org/10.3390/app11094027