1. Introduction
Large scale energy storage is essential to increase the share of renewable energy in energy production. Power-to-X, and among them Power-to-gas technologies, could solve some of the problems related to the fluctuations in energy production from renewables, which is the main obstacle in their future implementation [
1,
2]. In Power-to-gas technologies, excess renewable energy is converted into hydrogen gas through PEM electrolysis or methane through methanation. This technology is already well developed and in connection with CCU technologies and can contribute to the reduction of CO
2 emissions [
3,
4,
5]. Hydrogen can be injected into natural gas grids and existing infrastructure can be used for such purposes [
6,
7]. Nevertheless, hydrogen storage is much more challenging than storing natural gas. High mobility and lightness, as well as reactivity in the presence of microorganisms cause nontrivial hydrodynamic effects and cause safety concerns [
6,
8]. Large scale hydrogen storage was already proven in salt caverns. A vast amount of research and modelling of salt cavern behavior was made, including the salt rock permeability, sealing properties, and general geomechanics of the cavern. Salt rock remains impermeable for gas in the zones, where the rock properties are not affected by the extraction process. Micro fracturing processes during the salt rock formation are also responsible for the presence of damage zones in salt rock, where the gas impermeability may be limited [
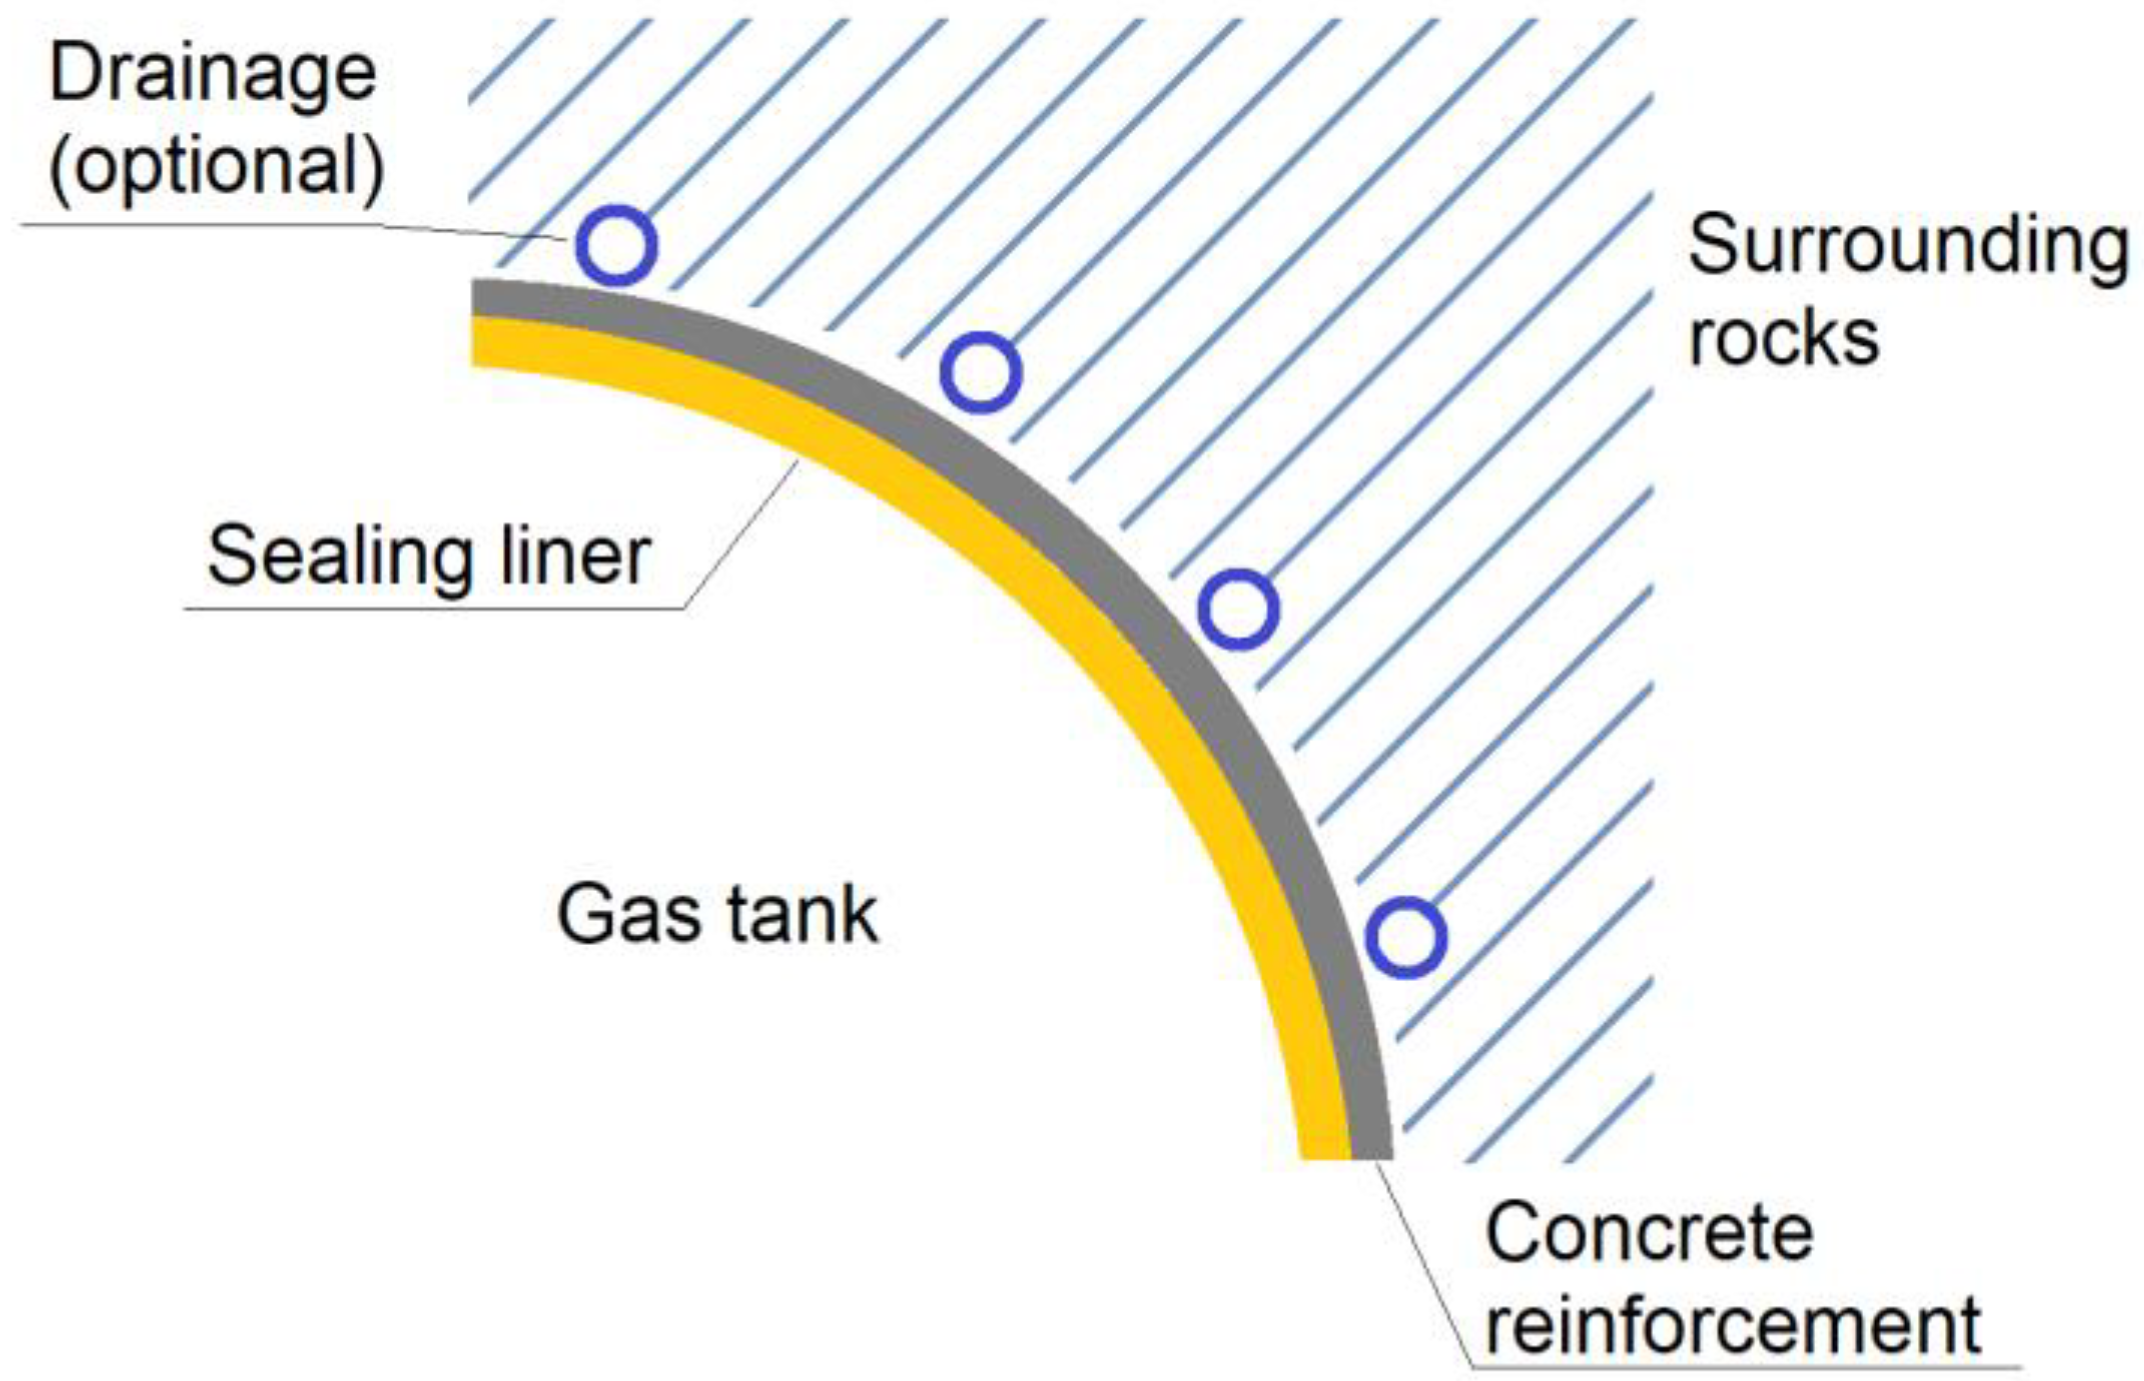
9]. An alternative to store hydrogen in salt caverns is Lined Rock Caverns (LRC) technology which was successfully proven in natural gas storage. This technology uses underground hard rocks to store natural gas. The reservoir is fully isolated from the outer environment. Hard rock is only a mechanical base, where the cavern is drilled. Base rock does not need to have any isolating properties (like salt rock). Then, the shotcrete reinforcement, followed by the necessary installations, like drainage, are made. Final layer is the sealing lining. In order to ensure isolation and erosion, proven properties of sealing material are essential. A scheme of the LRC linings is shown in the
Figure 1. In this technology, the most common lining material is steel [
10,
11]. It is justified to seek substitutional sealing materials beside stainless-steel, which will make the LRC storage more available and economical. One of the potential solutions is to use polymer-based concrete or epoxy resins, which are characterized by good sealing efficiencies. Research of gas permeability was done, including different methods, different polymer materials, and different gases. These studies include, inter alia, permeability of epoxy composites, using helium and CO
2 [
12,
13], permeability of N
2, O
2, CO
2, and H
2O through number of polymer materials (inter alia LDPE, HDPE, PVC, polypropylene) [
14], and hydrogen permeability of high density polyethylene (HDPE) [
15]. However, research related with hydrogen permeability through epoxy resins are very limited [
16,
17].
The purpose of this work is to compare hydrogen permeability of different materials, which could be used as the sealing liner for hydrogen storage in LRC with focus on epoxy resins modified with various additives. Additionally, permeability of typical rocks that can be found around LRC, and rock salt, were also measured in order to compare results with available data. In this work, a setup combining Steady-State Flow Method and Carrier Gas Method was used for experiments. Samples were also examined under SEM to compare their structural properties.
2. Experimental Methodology and Materials
Setup used to investigate the hydrogen permeability was built in the Laboratory of Unconventional Gas and CO
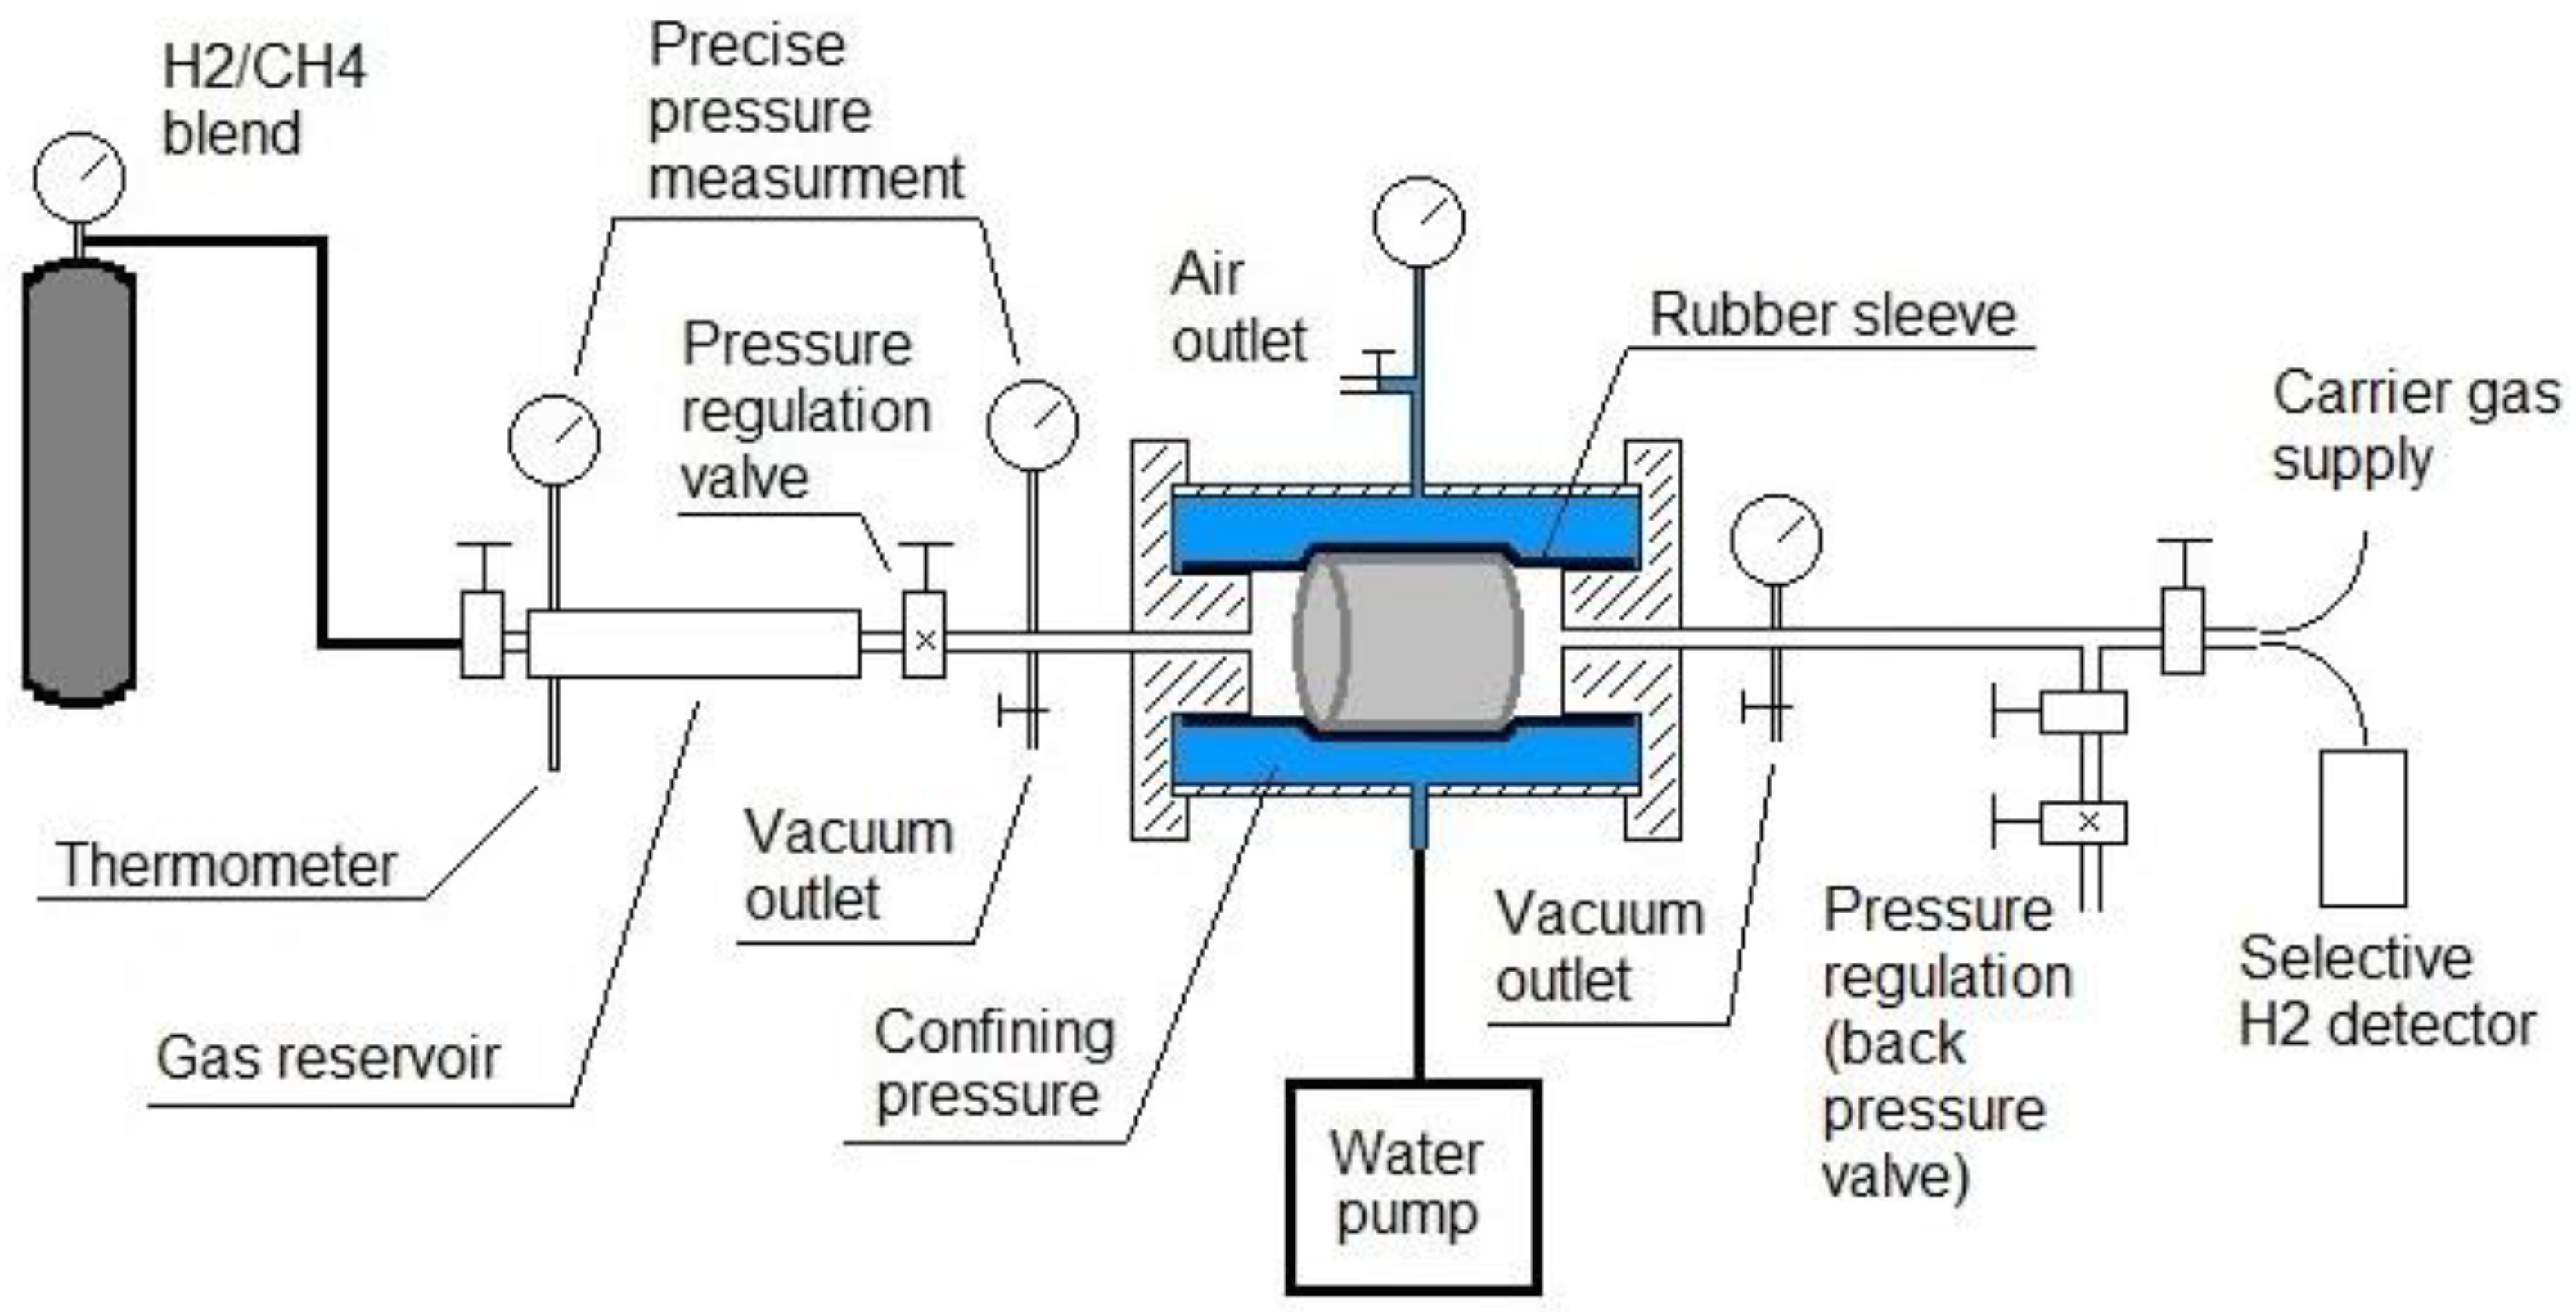
2 Storage at the Silesian University of Technology. Setup is combining the Steady-State Flow Method and Carrier Gas Method. Setup can be switched between mentioned methods, depending on the permeability coefficient of investigated samples. A scheme of the setup is shown in the
Figure 2. It consists of the gas cylinder, pressure regulation valves, sample holder, precise gas pressure transducers, and gas concentration detector.
The upstream side is a reference gas. A blend of 10% of hydrogen in methane was used as a reference gas on the upstream side. Gas is applied on the sample, held in the PVC sleeve with confining pressure of water. Tests were conducted at 1.0 MPa feed gas pressure. During the test, the downstream side was filled with carrier gas (helium) at the pressure of 100 kPa. A single gas detector for hydrogen, with sensitivity of 2–2000 ppm, was plugged on the end of the setup for gas concentration measurements made periodically. After the measurement is done, the same socket is used to plug the carrier gas (helium), the downstream side is filled with after vacuuming. There is also a back pressure valve, which can be used to adjust the pressure on the downstream side, when there is a flow of gas through the sample. Back pressure valve is giving the possibility to set a steady pressure gradient through the sample, by adjusting the pressure on the upstream and downstream side.
Depending on the behavior of the sample, a proper method can be used. When a pressure increase on the downstream side is observed, there is a gas flow through the sample. It occurs, when the permeability of the sample is high enough to allow the gas to flow through the sample. Steady-State Flow Method is based on the pressure gradient in the sample, caused by the gas flow. Pressure gradient in the sample and gas pressure (together with temperature) in the reservoir are measured with precise pressure transducers (accuracy 0.5% FS). Filtration coefficient “k” can be calculated, using the Equations (1) and (2).
where:
q = gas flow, m3/s
pi, pf = initial pressure (pi) and final pressure (pf) in reservoir, Pa
Vres = reservoir volume, m3
Zi, Zf = gas compressibility factor at the initial (Zi) and final (Zf) pressure
R = gas constant (8.314463 m3·Pa·mol−1·K−1)
T = gas temperature in reservoir, K
k = permeability coefficient, m2
q = gas flow, m3/s
pi, po = average inlet (pi) and outlet (po) gas pressure (pressure gradient), Pa
L = sample length, m
μ = gas viscosity, Pa·s
A = sample cross area, m2
When the gas permeability of the sample is low enough to prevent the gas flow through the sample, gas diffusion can be measured. In this case, Carrier Gas Method is used, which is based on the difference in gas concentration gradient through the sample. It is possible to measure it precisely with a single-gas hydrogen detector. Knowing the parameters of a reference gas on the upstream side, calculations of the permeability coefficient P are made, using a set of Equations (3)–(6). Using helium as a carrier gas, an ideal gas law can be assumed.
where:
V = molar volume in test conditions, m3·mol−1
R = gas constant: 8.314463 J·mol−1·K−1
T = gas temperature, K
p = gas pressure, Pa
An amount of hydrogen diffused through the sample in a certain time can be calculated, using the Equation (4). In this case the volume of the downstream side of the setup needs to be determined. This was done by approximation of the inner volume of the pipes, based on the manufacturer’s data and measurements of the setup. The volume of the downstream in the setup was 12.0 cm
3
where:
NH2 = amount of hydrogen, diffused through the sample
c = measured hydrogen concentration on downstream side, ppm
NA = Avogadro’s constant: 6.02214076·1023, mol−1
V = molar volume, m3·mol−1
vdownstream = volume of downstream side of setup, m3
By knowing the molar volume of one mole of gas in Standard Temperature and Pressure conditions (STP: 0 °C, 100 kPa), the volume of gas in STP can be calculated, using Equation (5).
where:
VH2 = volume of hydrogen diffused through the sample, cm3STP
NA = Avogadro’s constant: 6.02214076·1023, mol−1
22.414 = mole volume of ideal gas in STP, cm3
Using the calculation above, gas permeability coefficient can be calculated with Equation (6).
where:
PH2 = hydrogen permeability coeficcient, barrer
VH2 = volume of hydrogen diffused through the sample, cm3STP
l = sample length, cm
A = sample cross section area, cm2
t = time, s
p = gas pressure (feed gas), cmHg (1 bar = 75 cmHg)
Permeability coefficient of hydrogen is given in Barrer unit [
18], presented in Equation (7). Barrer unit is commonly used for presenting the permeability of membranes. However, it does not refer to the SI system, because of the pressure given in cmHg. Transforming the pressure into the SI unit (for example bar or Pa) is possible, however the results will not be comparable with the common literature data.
Hydrogen diffusion is calculated as a diffusion coefficient D, given in m
2/s, using the Fick’s law [
19] and following set of Equations (8)–(12), as well as values received from the Equations (3) and (4). For a gas diffusion through the polymer materials, the transport mechanism described by Fick’s Law is accepted [
20].
where:
J = flux, amount of hydrogen diffusing through the area in time, mol·m−2·s−1
D = diffusion coefficient, m2·s−1
ϕ = hydrogen concentration, mol·m−3
x = length of hydrogen path, m
where:
D = diffusion coefficient, m2·s−1
J = flux, amount of hydrogen diffused through the area in time, mol·m−2·s−1
ϕupstream = concentration of hydrogen (upstream), mol·m−3
ϕdownstream = concentration of hydrogen (downstream), mol·m−3
x2 − x1 = diffusion distance (sample length), m
For a non-porous polymer material, the tortuosity is equal to 1, thus the assumption can be made, that the hydrogen path is equal to sample length [
21].
where:
J = flux, amount of hydrogen diffused through the area in time, mol·m−2·s−1
NH2 = amount of hydrogen elements, diffused through the sample, from Equation (4)
NA = Avogadro’s constant: 6.02214076 × 10²³, mol−1
A = sample cross area, m2
ϕupstream = concentration of hydrogen (upstream), mol·m−3
cup = concentration of hydrogen in refenrence gas, %
V = molar volume of gas mol·m
−3, from Equation (3)
where:
ϕdownstream = concentration of hydrogen (downstream), mol·m−3
NH2 = amount of hydrogen elements, diffused through the sample, from Equation (4)
vdownstream = volume of downstream side of setup, m3
NA = Avogadro’s constant: 6.02214076 × 10²³, mol−1
Measurements of concentrations at the downstream side were done every 2–4 days and given in the diffusion ratio in time (ppm of H2/24 h). Structure of the samples was investigated, using HRSEM SUPRA 35 (Carl Zeiss AG, Oberkochen, Germany) Scanning Electron Microscope, since the chemical composition of the samples was not the scope of this study; the Energy Dispersive Spectrometry was not used for this research.
For the purpose of the study, several materials that could be used as a liner in underground excavation were selected. Samples under investigation can be divided into three general groups: epoxy resins with different additives; concrete; polymer-concrete and rocks (mudstone and rock salt). Materials were selected based on their common availability, low cost, and ease of preparation. Resin samples were prepared by mixing resin and cured for at least 7 days. During the pot time, samples were held in the oven in a temperature of 30 °C to accelerate the venting of the samples. Relative low temperature was set to simulate the thermal conditions in the excavations. Higher temperatures would be more efficient in the samples venting but would not be related with the actual underground temperature conditions, where the resins might be applied. Concrete and polymer-concrete samples were prepared by companies, according to their recipes and general standards for curing the concretes. Concrete samples were cored using a diamond core drill of 2.54 mm (1 inch) diameter. In
Table 1 detailed description of samples is given.
3. Results
Results of gas permeability of investigated samples are shown in
Table 2. For the ease of comparison with other data, results are given in different units: permeability coefficient for hydrogen (P
H2)(cm
3STP·cm·cm
−2·s
−1·cmHg
−1 (Barrer)); diffusion coefficient (m
2·s
−1); and filtration coefficient (m
2 and mD (milidarcy)). Blend of hydrogen (10%) in methane was used for the permeability tests. Results refer to this particular type of gas. For impermeable samples (10
−11 cm
3STP·cm·cm
−2·s
−1·cmHg
−1 or lower), only hydrogen was permeating the sample, so these results refer to the pure hydrogen.
As expected, tests showed a wide range of measured permeability values. The highest gas permeability coefficient has multi-grain materials, like concrete, polymer-concrete, and geopolymer. Filtration coefficient “k” of investigated concrete samples is 10−17 m2 or higher. Lower gas permeability was observed for mudstone and salt rock before creep process. Both rocks have the filtration coefficient of 2.13 × 10⁻¹⁹ m2 to 2.99 × 10⁻¹⁹ m2, respectively. However, these rocks are still permeable for gases. In general, the lowest gas permeability has plain-structured materials, like epoxy resins and salt rock, after the creep process. Range of the filtration coefficient of these materials is of 10−24 m2. Salt rock samples became impermeable after about 12 days of exposure to 2.0 MPa of confining pressure of water. Permeability dropped from 2.99 × 10⁻¹⁹ m2 to 5.80 × 10⁻²⁴ m2. Hydrogen permeability of epoxy resin samples varied, depending on the additives in the resin. Admixture of halloysite or graphite powder caused the increase of hydrogen permeability. An exception is the addition of fly ash. Admixture of 30% of volume gave a similar, but slightly lower permeability, comparing to the pure epoxy resin sample. Significant share of fly ash in sample composition did not cause the deterioration of sealing properties.
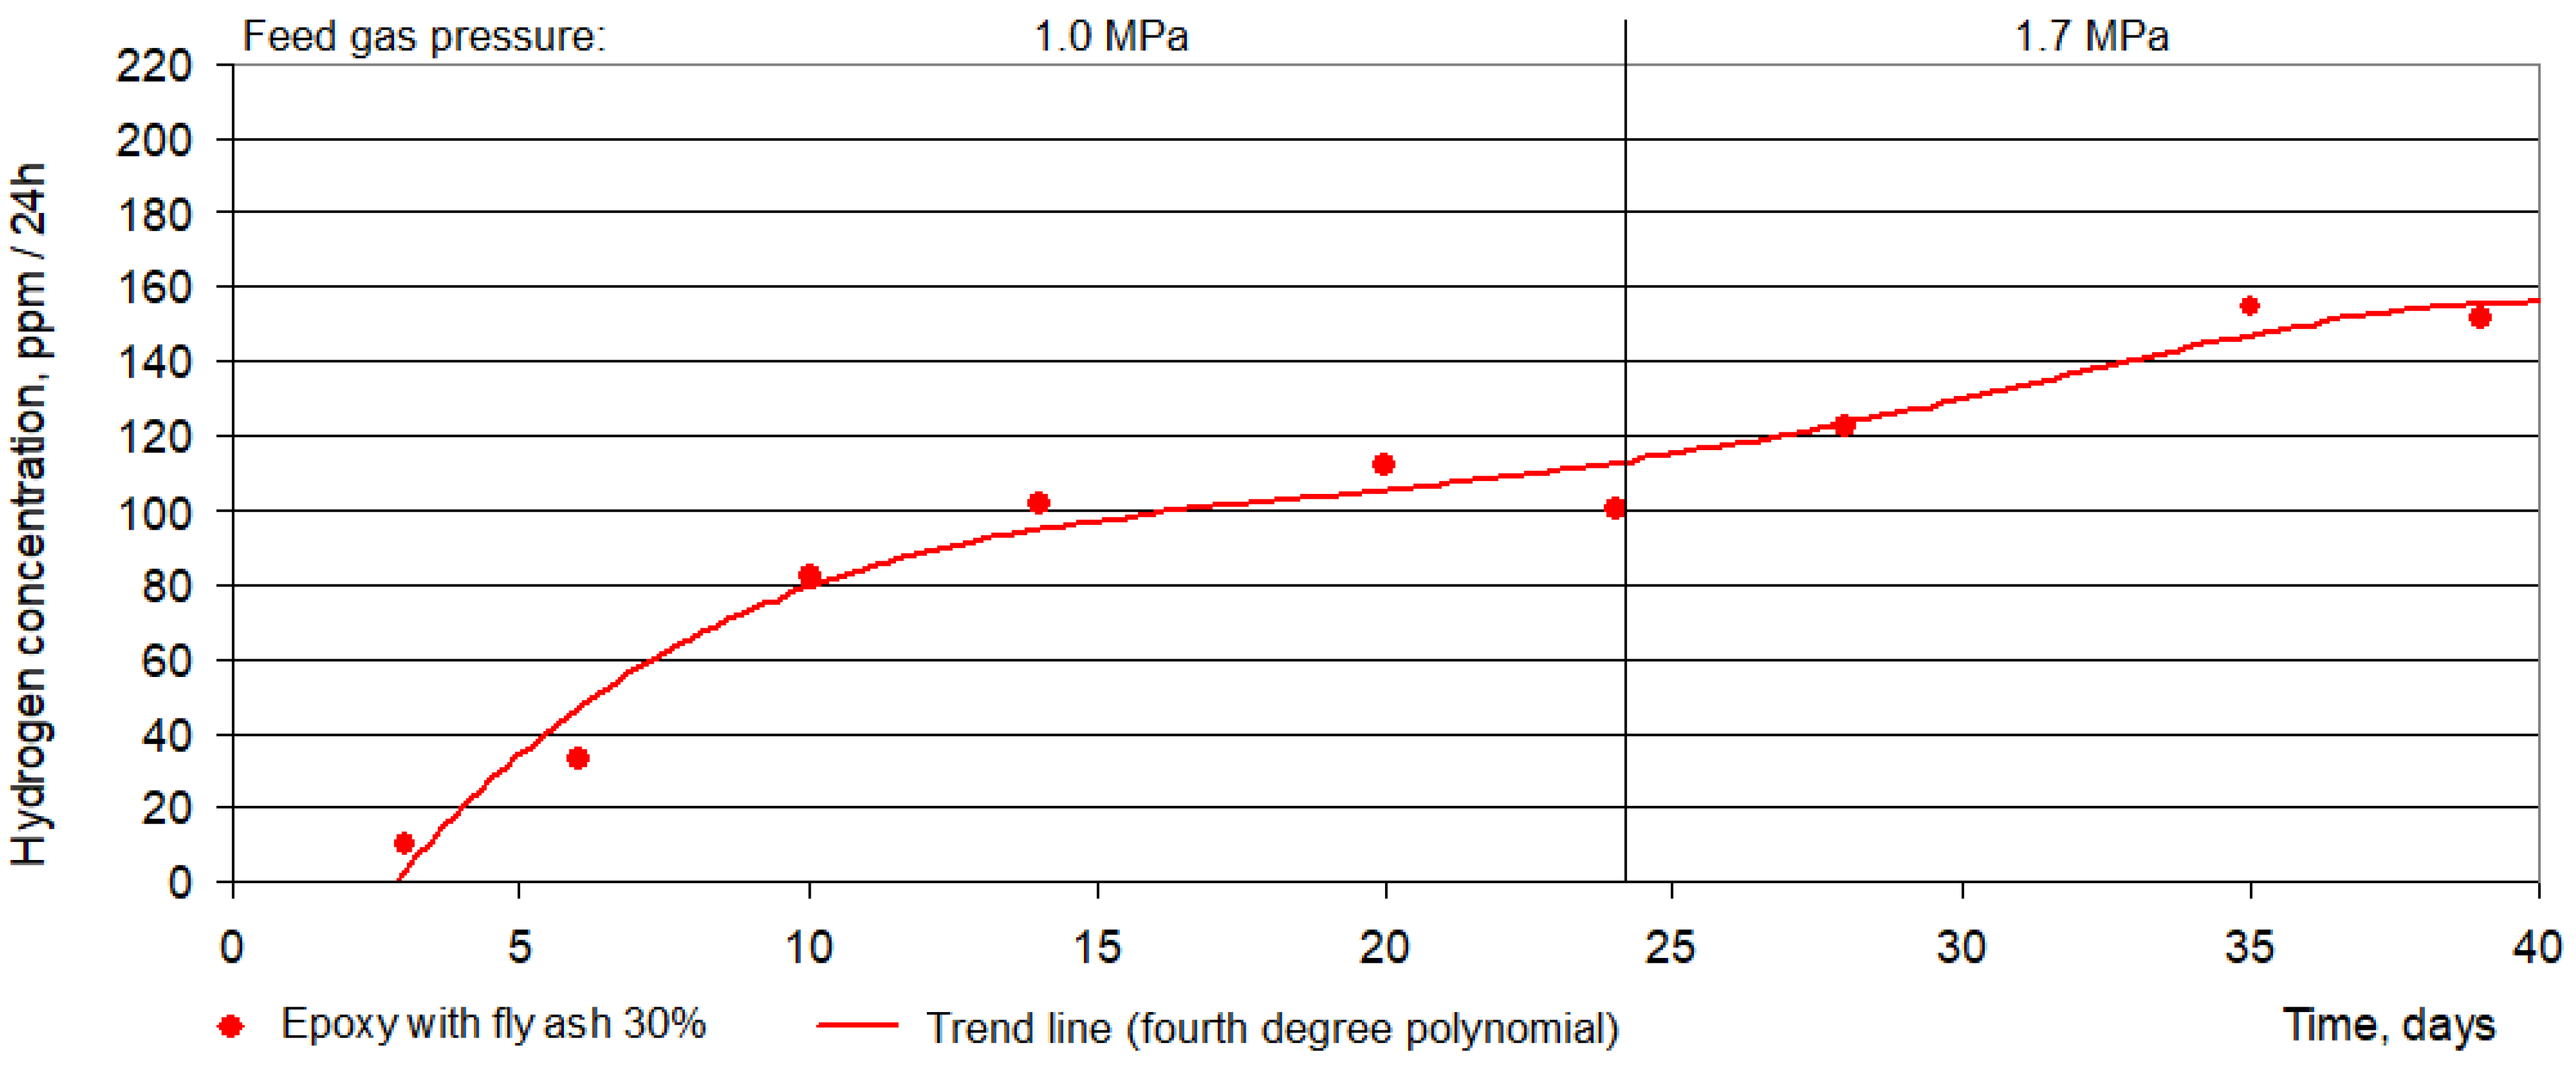
Results were calculated for the steady-state diffusion. Usually, it took up to 3 weeks to achieve the steady-state diffusion. Increases in measured concentration of hydrogen per day of an example sample is presented in
Figure 3. Because of the significant time required to complete the test for each sample, the hydrogen diffusion test was performed for a single gas pressure, which was 1.0 MPa. To verify the proper workings of the setup and sensitivity of the method, one test was extended and the feed gas pressure, after achieving steady-state diffusion, was increased. Pressure was increased after 24 days, from the value of 1.0 MPa to 1.7 MPa. After the pressure increase, several days were required to achieve the steady-state diffusion for a higher pressure. After that time, the measured concentration became stable again on a higher level. According to the Equations (3) and (4), increases of the pressure and permeability coefficient are linear. Pressure was raised by 70%, which gave the increase of measured concentrations by more than 60% as well (after achieving steady-state diffusion). This confirmed that the measuring methodology was correct. Slightly lower increase in concentration, in comparison with the pressure increase, may be explained by higher confining pressure (double the gas pressure, which was approx. 3.6 MPa). It can cause a compaction of the sample, which caused a slight decrease of the permeability. This phenomenon was described for concrete samples in [
19], as well as for the polymer materials, where hydrostatic compression effect occurs [
15]. However, the scale of permeability decreased, as well as mechanism responsible for it, is different.
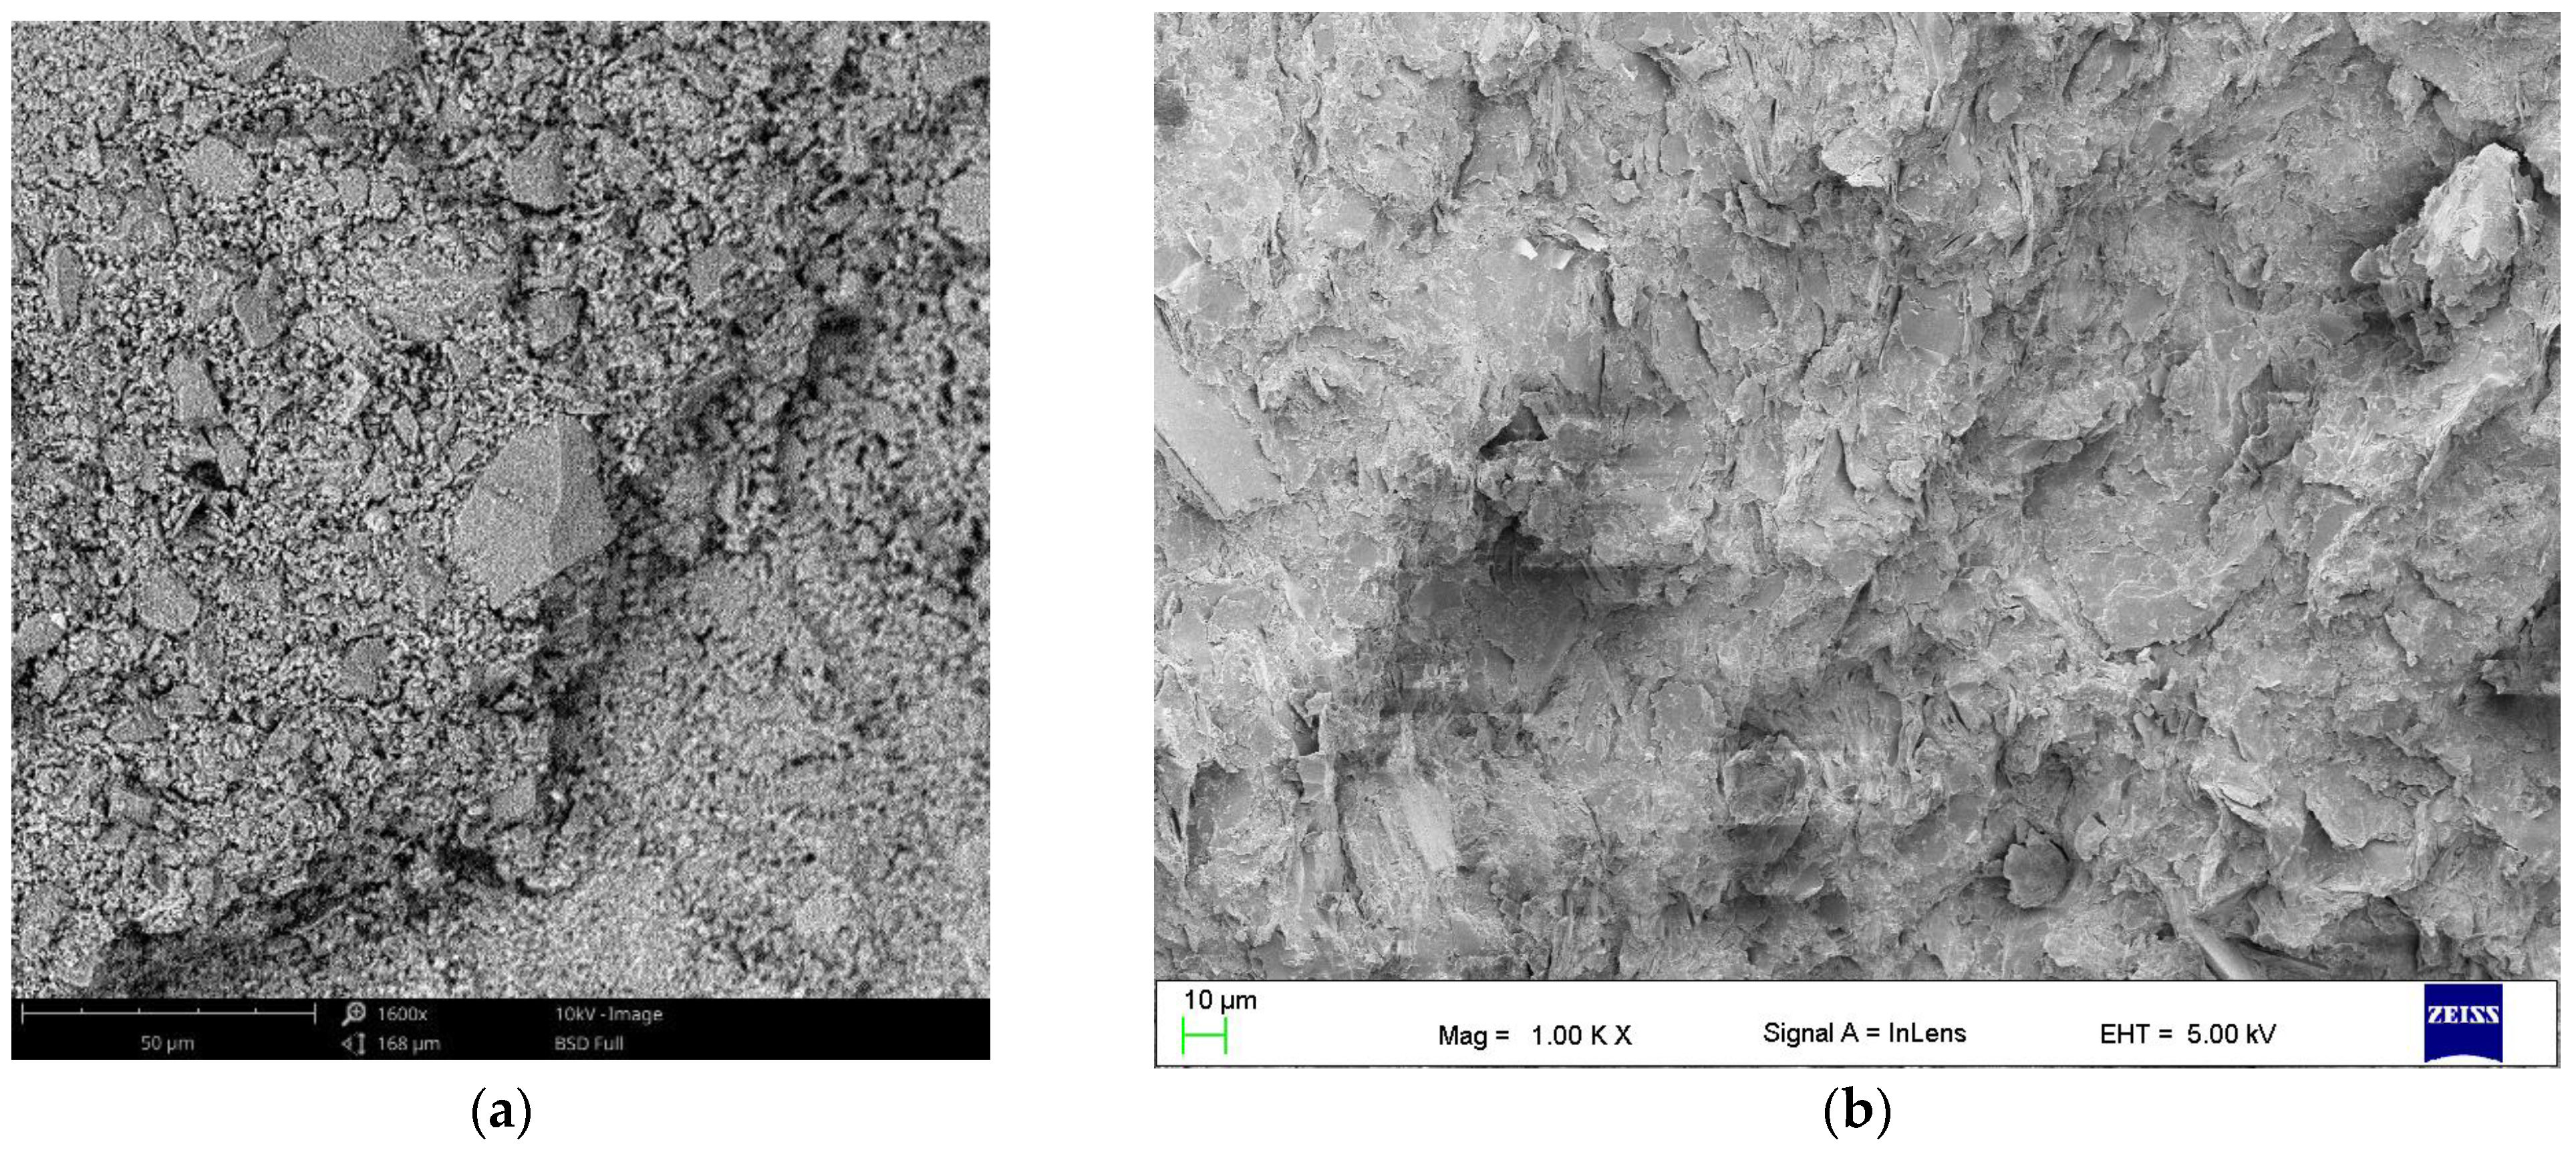
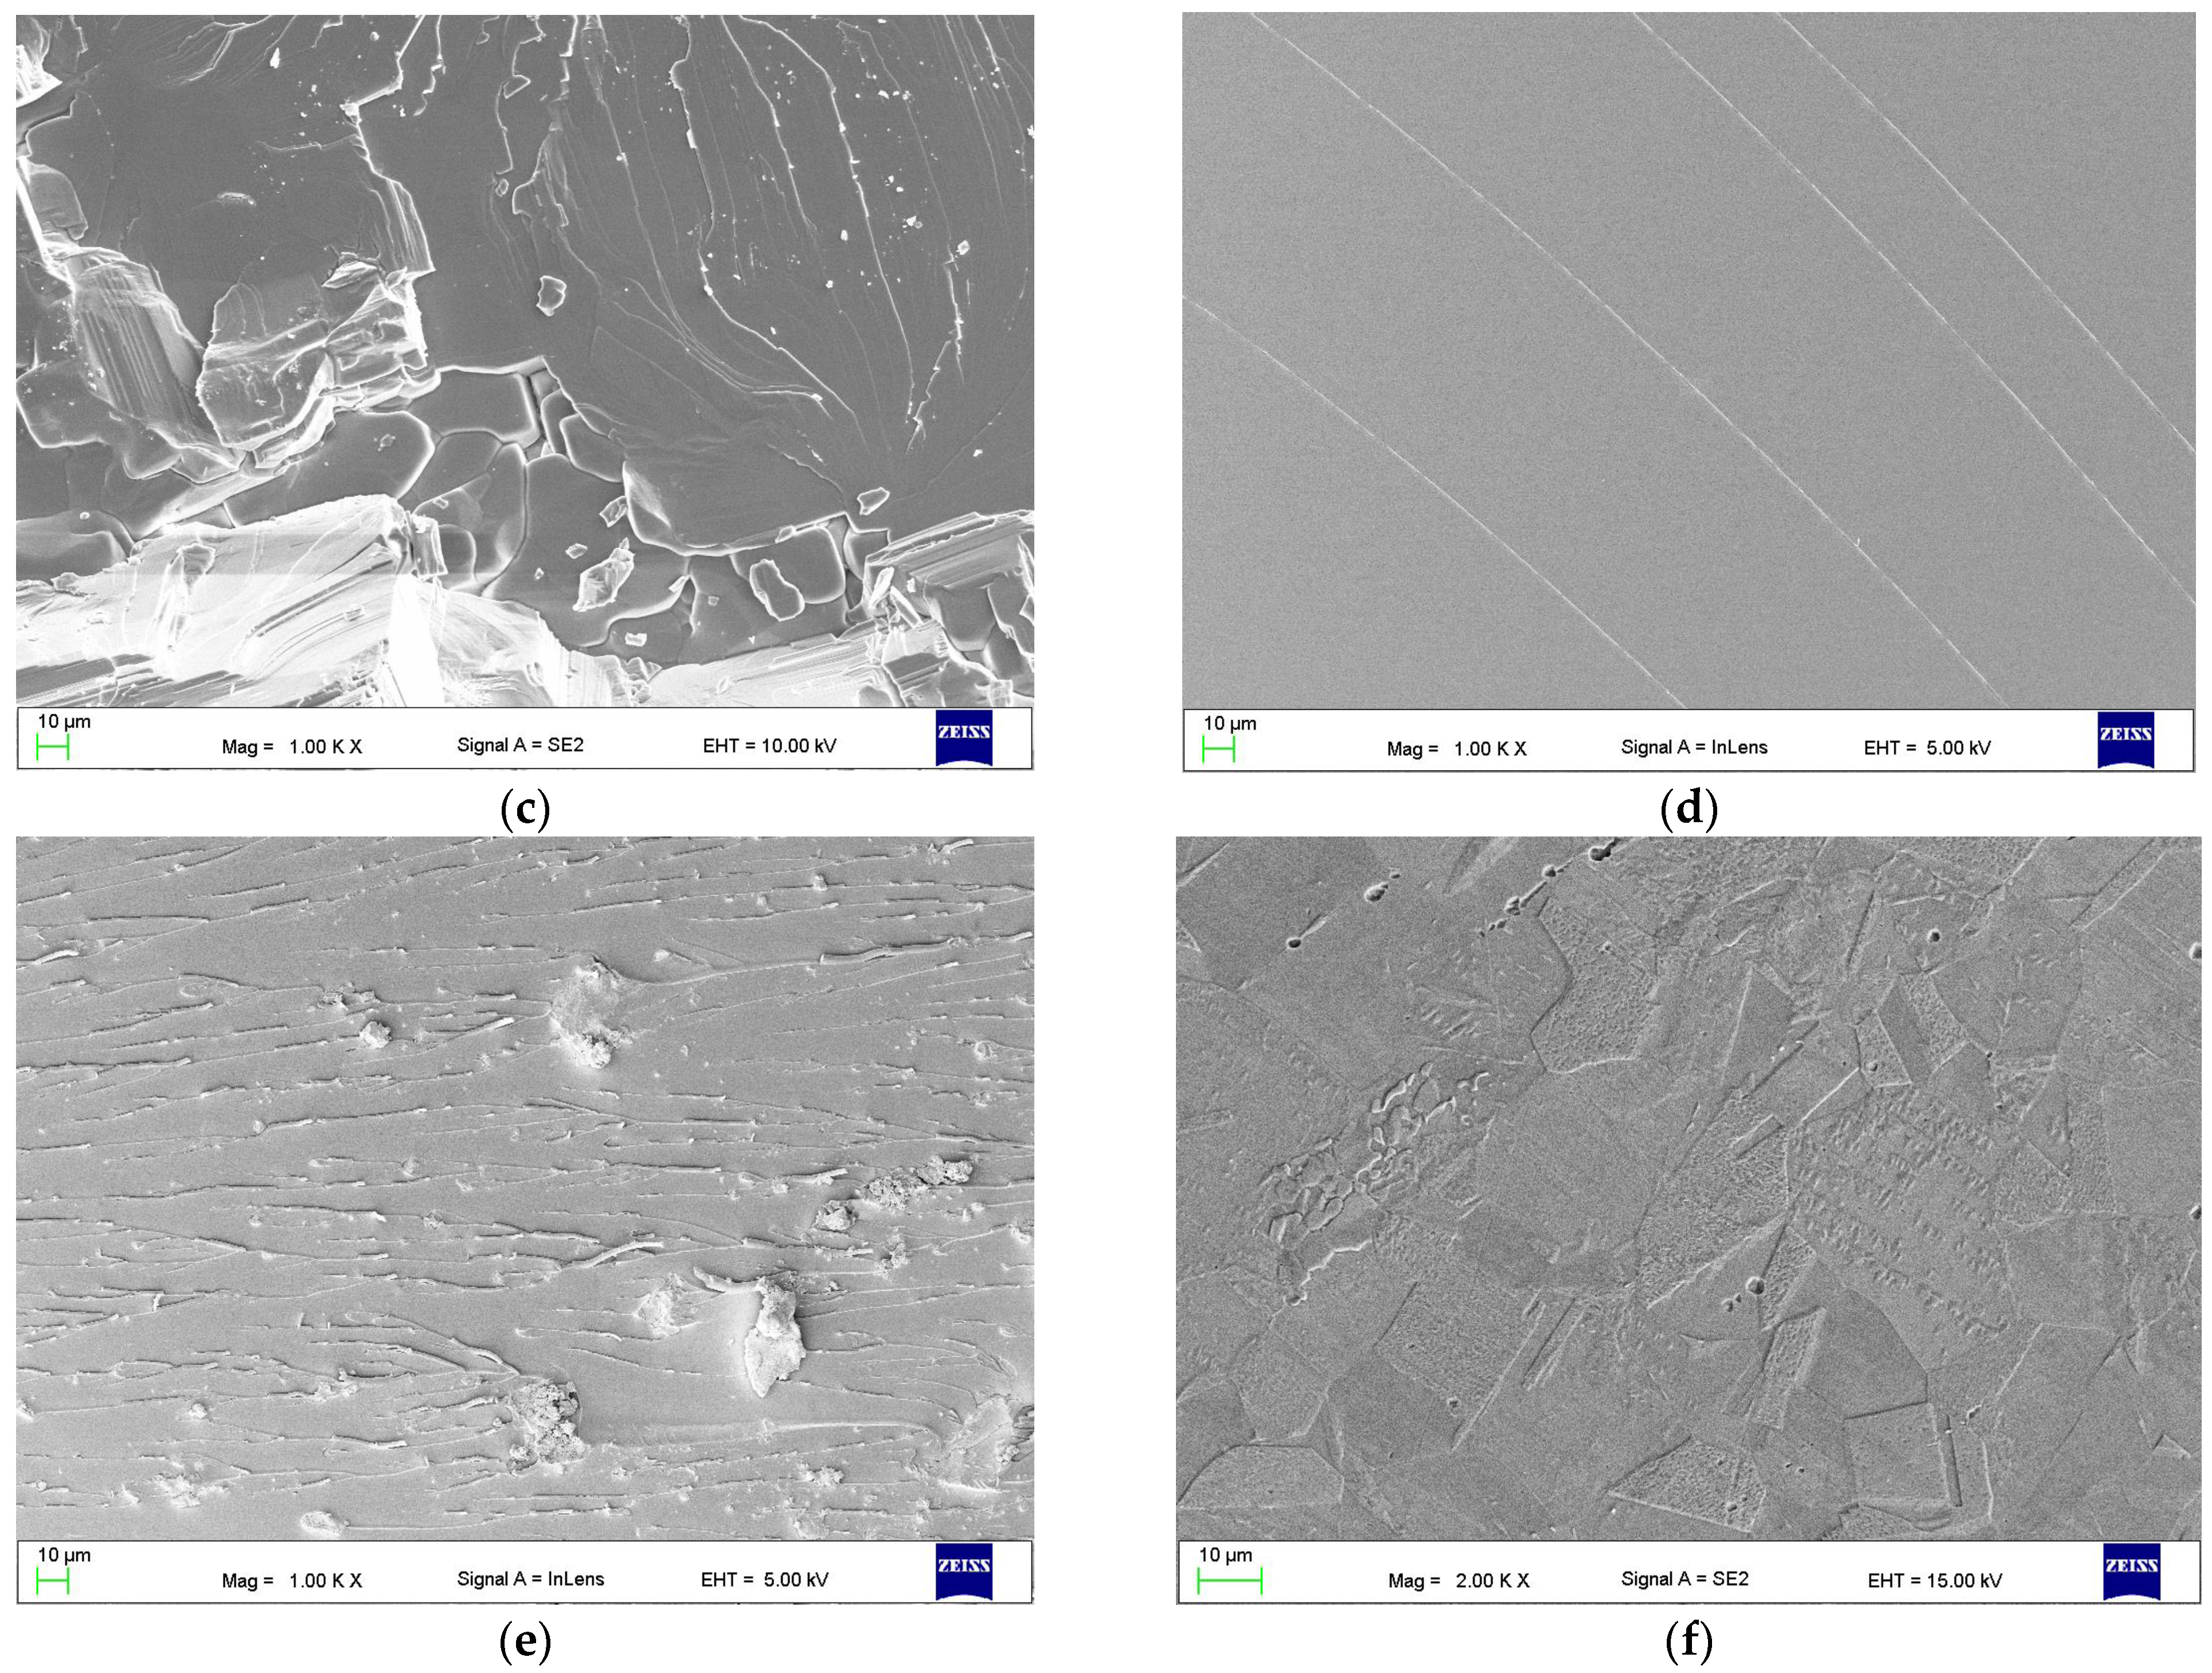
To compare the gas permeability results of different materials with the microstructure of the samples, SEM imaging of selected samples was done. Structures of the samples are shown in
Figure 4. An evident difference is seen in microporous and plain materials. Dark areas representing pores are clearly visible in concrete and mudstone samples under similar magnification (
Figure 4a,b). In the plain samples, voids appear mostly on the contact surface with grains of additives (
Figure 4e).
4. Discussion
Differences of the gas permeability of investigated materials is caused by the differences in structure of tested materials, which lead to the different mechanisms of gas migration. Multi-grain materials, such as concrete or mudstone, have many pores and voids within the structure. Fine grains can decrease the gas permeability because the intergranular porosity is lower while the compaction of the material is higher; this phenomenon was also observed in other research [
22]. However, gas flow through the sample is still noticeable and is the main mechanism of gas migration in that kind of material. However, it is not essential data for the purpose of this paper. Because of the low gas sealing properties of the investigated concretes, this type of material is not suitable for sealing purposes of underground excavations. However, it can still be a reinforcement and base liner.
Plain materials, like salt rock, epoxy, or steel, do not have pores and voids in their structure. Gas is not flowing through the sample (there is no pressure gradient along the sample). Hydrogen particles can diffuse through the material by dislocations in crystal structure. It is a linear defect that induces the tensile stress. Gas elements can diffuse much easier through those kinds of zones [
23]. Lattice diffusion is also possible, but in much higher temperatures, transcending Tamman temperature (in this temperature atoms in solid material acquire enough energy to make bulk reactivity and mobility significant, usually approximately half of the melting temperature) [
24]. In this case, research temperature was much below the Tamman temperature.
Interesting results were obtained with the fly ash epoxy sample. Graphite and halloysite are slightly increasing hydrogen permeability of the samples, while fly ash do not affect the sealing properties. Fly ash used for this research was not grinded but only sieved. Since fly ash from power plants is easily available, it could be a cost-effective filler by reducing the amount of epoxy resin in the sealing liner.
Obtained results of epoxy resin hydrogen permeability is slightly lower than presented in literature. Other research, presented collectively in [
16], showed the hydrogen permeability of epoxy resin of approximately 1.0 Barrer, while performed research of investigated samples gave the permeability coefficient of approximately 0.2 Barrer. Results of hydrogen diffusion coefficient presented in [
17], which was 6.9 × 10
−11 m
2/s, was also higher than the obtained 1.5 × 10
−12 from this research. Lower results may be caused by numerous factors, influencing on the gas permeability in polymeric materials like polymer chemistry (epoxide number), free volumes (crystallinity, orientation of molecules), porosity or voids (air inclusions), and fillers presence [
16].
Permeability coefficient of 316SS steel was calculated using the Equations (3)–(6), based on the literature data [
25]. Permeability of 316 L steel were taken from [
26,
27]. Because of the sensitivity and construction of the setup, investigation of the steel samples was not possible. Permeability of steel is orders of magnitude lower than materials the setup is meant for. To investigate the steel or alloys, much thinner samples need to be used. The Setup is not designed for that kind of samples, but only for a core-shape samples. Calculated hydrogen permeability P
H2 of 316SS steel was 4.6 × 10
−17 cm
3STP·cm·cm
−2·s
−1·cmHg
−1 (4.6 × 10
−7 Barrer), and given [
26,
27], hydrogen diffusion coefficient D of 316L steel was in range from 10
−13 to 10
−15 m
2/s.


