Article

Cultivating Microalgae in Desert Conditions: Evaluation of the Effect of Light-Temperature Summer Conditions on the Growth and Metabolism of Nannochloropsis QU130

1
CNRS, GEPEA, UMR 6144, Université de Nantes, Oniris, F-44600 Saint-Nazaire, France
2
Algal Technologies Program, Centre for Sustainable Development, College of Arts and Sciences, Qatar University, Doha 2713, Qatar
3
PROMES-CNRS, UPR 8521, Tecnosud, Rambla de la Thermodynamique, 66100 Perpignan, France
*
Author to whom correspondence should be addressed.
Appl. Sci. 2021, 11(9), 3799; https://doi.org/10.3390/app11093799
Submission received: 26 February 2021 / Revised: 16 April 2021 / Accepted: 21 April 2021 / Published: 22 April 2021
(This article belongs to the Special Issue Advances in Microalgal Biomass Productions)

Abstract

:
Temperature and light are two of the most crucial factors for microalgae production. Variations in these factors alter their growth kinetics, macromolecular composition and physiological properties, including cell membrane permeability and fluidity. The variations define the adaptation mechanisms adopted by the microalgae to withstand changes in these environmental factors. In the Qatar desert the temperature varies widely, typically between 10° and 45 °C There are also wide variations in light intensity, with values of over 1500 μmol.m−2s−1 in summer. A study of the effects of these thermal and light fluctuations is therefore essential for large-scale outdoor production systems, especially during the summer when temperature and light fluctuations are at their highest. The aim of this work is to study the impact of temperature and light intensity variations as encountered in summer period on the Nannochloropsis QU130 strain, which was selected for its suitability for outdoor cultivation in the harsh conditions of the Qatar desert. It was carried out using lab-scale photobioreactors enabling simulation of both constant and dynamic temperature and light regimes. Biomass productivity, cell morphology and biochemical compositions were examined first in constant conditions, then in typical outdoor cultivation conditions to elucidate the adjustments in cell function in respect of fluctuations. The dynamic light and temperature were shown to have interactive effects. The application of temperature cycles under constant light led to a 13.6% increase in biomass productivity, while a 45% decrease was observed under light and temperature regimes due to the combined stress. In all cases, the results proved that N. sp. QU130 has a high level of adaptation to the wide fluctuations in light and temperature stress. This was shown through its ability to easily change its physiology (cell size) and metabolic process in response to different cultivation conditions.

Highlights:

Nannochloropsis QU130 showed a high level of acclimation to high light and temperature
Light and temperature effects on growth and metabolism were found to be related
Biomass productivity improved under temperature cycles with constant light
Light and temperature regimes induced a combined stress with 45% productivity loss
Nannochloropsis QU130 demonstrated benefits for outdoor culture in harsh desert conditions

1. Introduction

Microalgae are ubiquitous photosynthetic microorganisms that consume CO2, light, and inorganic nutrients to produce biomass, which is rich in compounds such as lipids, carbohydrates, proteins, and pigments [1]. The biochemical composition of the microalgae varies according to the nature of the microalgae, the cell density, the growth phase, and the culture conditions, such as temperature, pH, salinity, CO2 concentration, medium composition, and light intensity [2].
Light and temperature are important factors for algae growth [3]. It has been observed that there are species-dependent requirements for optimal growth and metabolite accumulation, e.g., Chlorella pyrenoidosa requires an optimal daytime temperature of 31 °C and an illumination of 420 μmol.m−2s−1, with a photoperiod of 16:8 h light:dark for maximum biomass and lipid production [4]. However, there is much evidence that the specific growth rate increases dramatically with rising light intensity, up to a certain limit, followed by an immediate decrease after this saturation limit is achieved [5].
The study of algae cultivated under different light regimes reveals that continuous light is best for optimal growth rate and biomass production. Tamburic et al., 2012 proved that growing Chlamydomonas reinhardtii cc124 in a 12 h:12 h photoperiod regime reduced both the algal growth rate and the cell density by approximately 30% compared to continuous light conditions [6]; Ruangsomboon et al., 2012 observed that Botryococcus braunii KMITL cultivated under a 24:0 light:dark cycle produced four times as much biomass than that generated under a 12:12 h light:dark regime [7].
Light intensity and regime can affect the biochemical composition; an increase in TAG accumulation from 1.5% to 12.4% w/w was observed in the biomass produced by Neochloris oleoabundans cultivated under excess light absorption, and with a limited nitrogen supply [8], and the carotenoid content was monitored under high irradiance. This revealed an increase in all carotenoids for Allocasuarina torulos, while a specific increase in mainly zeaxanthin and myxoxanthophyll was observed with Nostoc sp., and myxoxanthophyll and β-carotene with Anabaenopsis elenkinii [9]. However, increasing the light intensity led to irreversible damage to the algae cells, such as with Chlamydobotrys stellate and Chlamydomonas reinhardtii which showed irreversible damage when the photon flux density was increased from 50 to 1500 μmol.m−2s−1, and from 150 to 5000 μmol.m−2s−1, respectively [10].
Temperature is also a crucial factor which affects both growth and biochemical composition of microalgae. Growth rate, biomass, and evolution in biochemical composition were studied in depth at various constant temperatures for several microalgae isolates. Zhu et al. observed that total lipid accumulation increased at a higher rate in Isochrysis galbana at 30 °C, and the proportion of non-polar lipids decreased slightly [11]. However, it was observed that extreme temperature might have a negative effect on algae physiology. Agrawal demonstrated that increasing the temperature to 42 °C for 15 min reduced the formation of Chlorella vulgaris autospore mother cells [12], while doubling the time increased it from 8.6 ± 0.6 h to 48.5 ± 2.6 h when the cultivation temperature was reduced from 27 °C to 5 °C [13]. The same authors joined Sorokin et al., in hypothesizing that low temperatures may reduce the rate of photosynthesis [14].
Although the effects of constant temperature on metabolism are widely recognized, diurnal temperature fluctuation is also shown to have a significant impact on algae growth and biochemical composition. Agrawal reported that Oedogonia and Cladophora glomerata survived better in a diurnal temperature range of 10–28 °C [12], while the optimal growth temperature for Vaucheria geminata was below the range 14–26 °C.
Nannochloropsis sp QUCCCM130 (hereafter N.sp. QU130) emerged from a screening procedure as a very promising strain for outdoor production in the Qatar desert [15]. It revealed significant biomass productivity (i.e., areal productivity equivalent to around 110 t.ha−1.year−1) and a biochemical composition with beneficial food and animal feed applications (i.e., 60% proteins, 23% carbohydrates, 9% lipids and 3% chlorophylls). When cultivated in constant light and temperature conditions, the optimal growth temperature was T = 30 °C and T = 35 °C for PFD = 500 and 150 µmol.m−2s−1 respectively.
In addition to the usual criteria of growth performance and strain resistance to biological contamination for cultivation in open systems, a strain should present high resistance to extreme high temperature and light conditions for successful cultivation in the Qatar desert. Interestingly, in a previous study in constant conditions, the strain withstood elevated temperatures of T = 40 °C at a high illumination of PFD = 500 µmol.m−2 s−1 (data not shown here). However, the high and quick adaptation to light and temperature variations also needs to be verified for sustainable long-term cultivation under harsh desert conditions.
The aim of the current research work consists of investigating the growth and the evolution of biochemical composition of N. sp. QU130 under separate and combined temperature and light fluctuation cycles. For this purpose, the local microalgae isolate was cultivated in a well-controlled photobioreactor under three different regimes, and biomass, total sugar, protein, and total lipids production were assessed for each regime model.

2. Materials and Methods

2.1. Photobioreactor

Each experiment was carried out in a 1 L airlift-type flat-panel PBR 3 cm thick (specific illumination area alight of 0.33 m−1) in continuous mode at D = 0.02 h−1 (Figure 1). The details have been described previously by Pruvost et al., 2009 [16]. Illumination was supplied on one side of the PBR by a white LED light panel with fully adjustable PFD. The temperature was fully controlled, adjustable, and automated. pH was continuously measured using a pH sensor (Mettler Toledo SG 3253) and maintained at 8 by automatic CO2 sterile injection when the culture pH exceeded 8. Mixing in the PBR was provided by sterile air injection at a flow rate of 80 mL/min. Prior to carrying out any experiments, the PBR was sterilized for 30 min using a 5 mM peroxyacetic acid solution and rinsed twice with sterile deionized water.

2.2. Strain Cultivation

2.2.1. Overview of the Approach

N. sp. QU130 was isolated from the Qatar desert environment and maintained in the Qatar University Culture Collection of Cyanobacteria and Microalgae (QUCCC) [17,18]. It was first cultivated in the PBR under constant light and temperature conditions. These conditions represent an average 24 h period in July in Qatar, with an illumination of 500 μmol.m−2s−1 and temperature of T = 36 °C (Regime A, Figure 2). The photobioreactor was operated in continuous mode, allowing the cells to acclimate to the culture conditions. Once the stationary phase was reached (constant biomass and pigment concentrations), one of the following regimes was applied until the culture stabilized in a 24 h regime. Constant conditions were then established (Regime A) to re-acclimate the cells, and a new regime was applied. Following this approach, the three following regimes were applied:
Regime B: Temperature fluctuation, corresponding temperature cycle over 24 h between 32 °C and 41°C with light constant at 500 μmol.m−2s−1 (Figure 2)
Regime C: Light fluctuation, corresponding day/night cycle over 24 h between 0 and 1500 μmol.m−2 s−1 with temperature constant at 36 °C (Figure 2).
Regime D: Combined light and temperature fluctuations, corresponding light and temperature cycles over 24 h (Figure 2).
All the experiments were carried out in continuous mode at D = 0.02 h−1 and constant pH = 8. The strains were grown in artificial seawater, salinity 25 kg.m−3 [19]. Modified Conway (3N3P) growth media was used for all the cultures. The composition of the culture medium was adjusted to avoid mineral growth limitation and ensure photo-limitation growth [20]. Biomass concentration X and pigment concentrations (Chlorophyll a and carotenoids) were monitored daily by sampling the cultures during algae growth until a steady state was reached. Note that under 24 h light and/or temperature regimes, since these regimes were repeated with the same conditions, a periodic regime with a similar culture status was obtained (i.e., concentration, biochemical composition and physiology) at any given time during the 24 h cycle.
All measurements were conducted and recorded in triplicate on consecutive days (3 trials were carried out, see Figure 3) in order to validate the repeatability and reproducibility of the cycles and the results obtained in continuous mode.

2.2.2. Algae Cultivation under Temperature Cycles (Regime B)

The temperature cycle was applied to the steady-state culture obtained under constant light and temperature conditions. The culture growth was first monitored by taking daily samples at the same point in the cycle (9 am), corresponding to a temperature of 35 °C. Once a constant biomass was obtained, indicating that the periodic regime was achieved, the diurnal growth and physiology changes in the strain were monitored over 24 h. Subsequently, 4 samples were taken at 4 different points in the cycle over 24 h and on 3 different days (Figure 3). Biomass concentration, pigment concentration, total sugar and protein content were measured at dawn (T = 32 °C), at midday, when the temperature peaked at 41 °C, at dusk (T = 38 °C), and at the end of the night (T = 32 °C). Each measurement consisted of 4 samples.

2.2.3. Algae Cultivation under Light Cycles (Regime C)

The light cycle was applied to the steady-state culture obtained under constant light and temperature conditions. The culture growth was first monitored by taking daily samples at the same point in the cycle (9 am), corresponding to PFD = 1000 μmol.m−2s−1. Once a constant biomass was obtained, the diurnal growth and physiology changes in the strain were monitored over 24 h, taking samples on 3 different days (Figure 3). Dry-weight biomass concentration, pigment concentration, total sugar and protein content were measured at dawn, at midday, when PFD reached its maximum value of 1500 μmol.m−2s−1, at dusk, and at the end of the night. Each measurement consisted of 4 samples.

2.2.4. Algae Cultivation under Combined Day/Night and Temperature Cycles (Regime D)

Both temperature and day/night cycles were applied to the steady-state culture obtained under constant light and temperature conditions, and culture growth first monitored by taking daily samples at the same point in the cycle (9 am), corresponding to PFD = 1000 μmol.m−2s−1 and T = 35 °C. Once a constant biomass was obtained, the diurnal growth and physiological changes in the strain were monitored over 24 h, taking samples on 3 different days. Dry-weight biomass concentration, pigment concentration, total sugar and protein content were measured at dawn (T = 32 °C and PFD = 0 μmol.m−2s−1), at midday when both T and PFD peaked, at 41 °C and 1500 μmol.m−2 s−1 respectively, at dusk (T = 38 °C and PFD = 0 μmolhν.m−2s−1), and at the end of the night (T = 32 °C and PFD = 0 μmol.m−2s−1). Each measurement consisted of 4 samples.

2.3. Biomass Analysis

2.3.1. Biomass Concentration and Cell Size

Algal dry weight concentration CX (kg.m−3) was determined by filtering a given volume (Vsamp) through a pre-dried and pre-weighed glass-fiber filter (Whatman GF/F). The filters were then washed with 1.19 M NH4HCO2 and MiliQ water to remove residual salts from the culture medium. The filters were dried again at 105 °C for 24 h, cooled in a desiccator for 10 mins and then weighed again to achieve a constant weight.
Volumetric biomass productivity P X (kg.m−3.d−1) was calculated from the biomass concentration and dilution rate D (Px = CX.D), and areal biomass productivity S X (g m−2 d−1) was deduced from the volumetric productivity and the specific illumination area of the PBR (SX = Px/alight).
Cell counting was done by analyzing (in triplicate) a 10 µL aliquot of the culture. A Malassez chamber and an optical microscope fitted with a camera (Axio MRC Cam at Axio Scope A1 microscope, Carl Zeiss, Oberkochen, Germany) were used to take pictures of each sample. The cell diameters were measured manually using image processing software (Axio VisionRoutine).

2.3.2. Pigments Extraction and Quantification

The algae biomass obtained from biomass concentration measurement was freeze-dried and ground into powder, of which 25 mg was suspended in 1 mL of methanol 90% (Vmethanol) and kept at 60 °C in a water bath until the biomass was colorless. After extraction, the mixture was allowed to cool until it reached room temperature, and the tube was centrifuged at 1500 g for 5 min. The supernatant was used to carry out optical density measurements to determine pigment content.
The chlorophyll-a and total carotenoid concentrations were calculated by reading the absorption of the extract in a spectrophotometer (Jenway, 6305, UK) at different wavelengths (650, 665, and 480 nm) and using the following equation adapted from [21]:
Chlorophyll   a   ( mg   L 1 ) = V methanol V samp   ( 16.5   OD 665 nm 8.3   OD 650 nm )
Total   carotenoids   ( mg   L 1 ) = V methanol V samp   ( 4   OD 480 nm )
As presented in Pruvost et al. [16], a “stress factor” can be obtained from the ratio of absorbances at 480 and 665 nm (named OD480/OD665 hereafter), which are proportional to the carotenoid and chlorophyll content, respectively.

2.3.3. Total Lipids Extraction

Total lipids were extracted from the algae biomass using the Folch et al. [22] method with some modifications [18]. The total lipid content was gravimetrically determined. Subsequently, the lipid content (%) and lipid productivity (mg L−1 d−1) were determined as described by Arora et al., 2016 [23].

2.3.4. Proteins Extraction

Total proteins were extracted from 100 mg of dry algae biomass using a Sigma kit (Plant Total Protein Extraction PE0230, USA). The extracted proteins were quantified using the Bradford assay [24].

2.3.5. Carbohydrates Extraction and Quantification

Total sugars (carbohydrate, including starch) were measured following the method described by Dubois et al. [25]. 100 mg of dried biomass was first subjected to a glacial acetic acid treatment followed by incubation at 80 °C. The sample was then washed with acetone and centrifuged. The pellet was subjected to acid hydrolysis using 4 M HCl at 90 °C for 2 h. An equal volume of water was added to the acid mixture, then 20 mL of the sample was removed and mixed with 900 μL of phenol sulfuric acid reagent. The mixture was boiled for 20 min and the absorbance was read at 490 nm.

2.4. Statistical Analysis

Statistical analyses of all the data presented were carried out in Microsoft Excel (Microsoft, Washington, USA). Student’s t-tests (α = 0.05) were used to evaluate significant differences between the experimental groups. The mean values were considered significantly different where p-value (α) <0.05.

3. Results

3.1. Assessment of the Light and Temperature Fluctuations on the Algae Growth

Well-controlled light and temperature cycles, alone and then in combination, were used to investigate their respective effects on N. sp. QU130. Different behaviors were observed, as shown in Figure 4 and Figure 5.
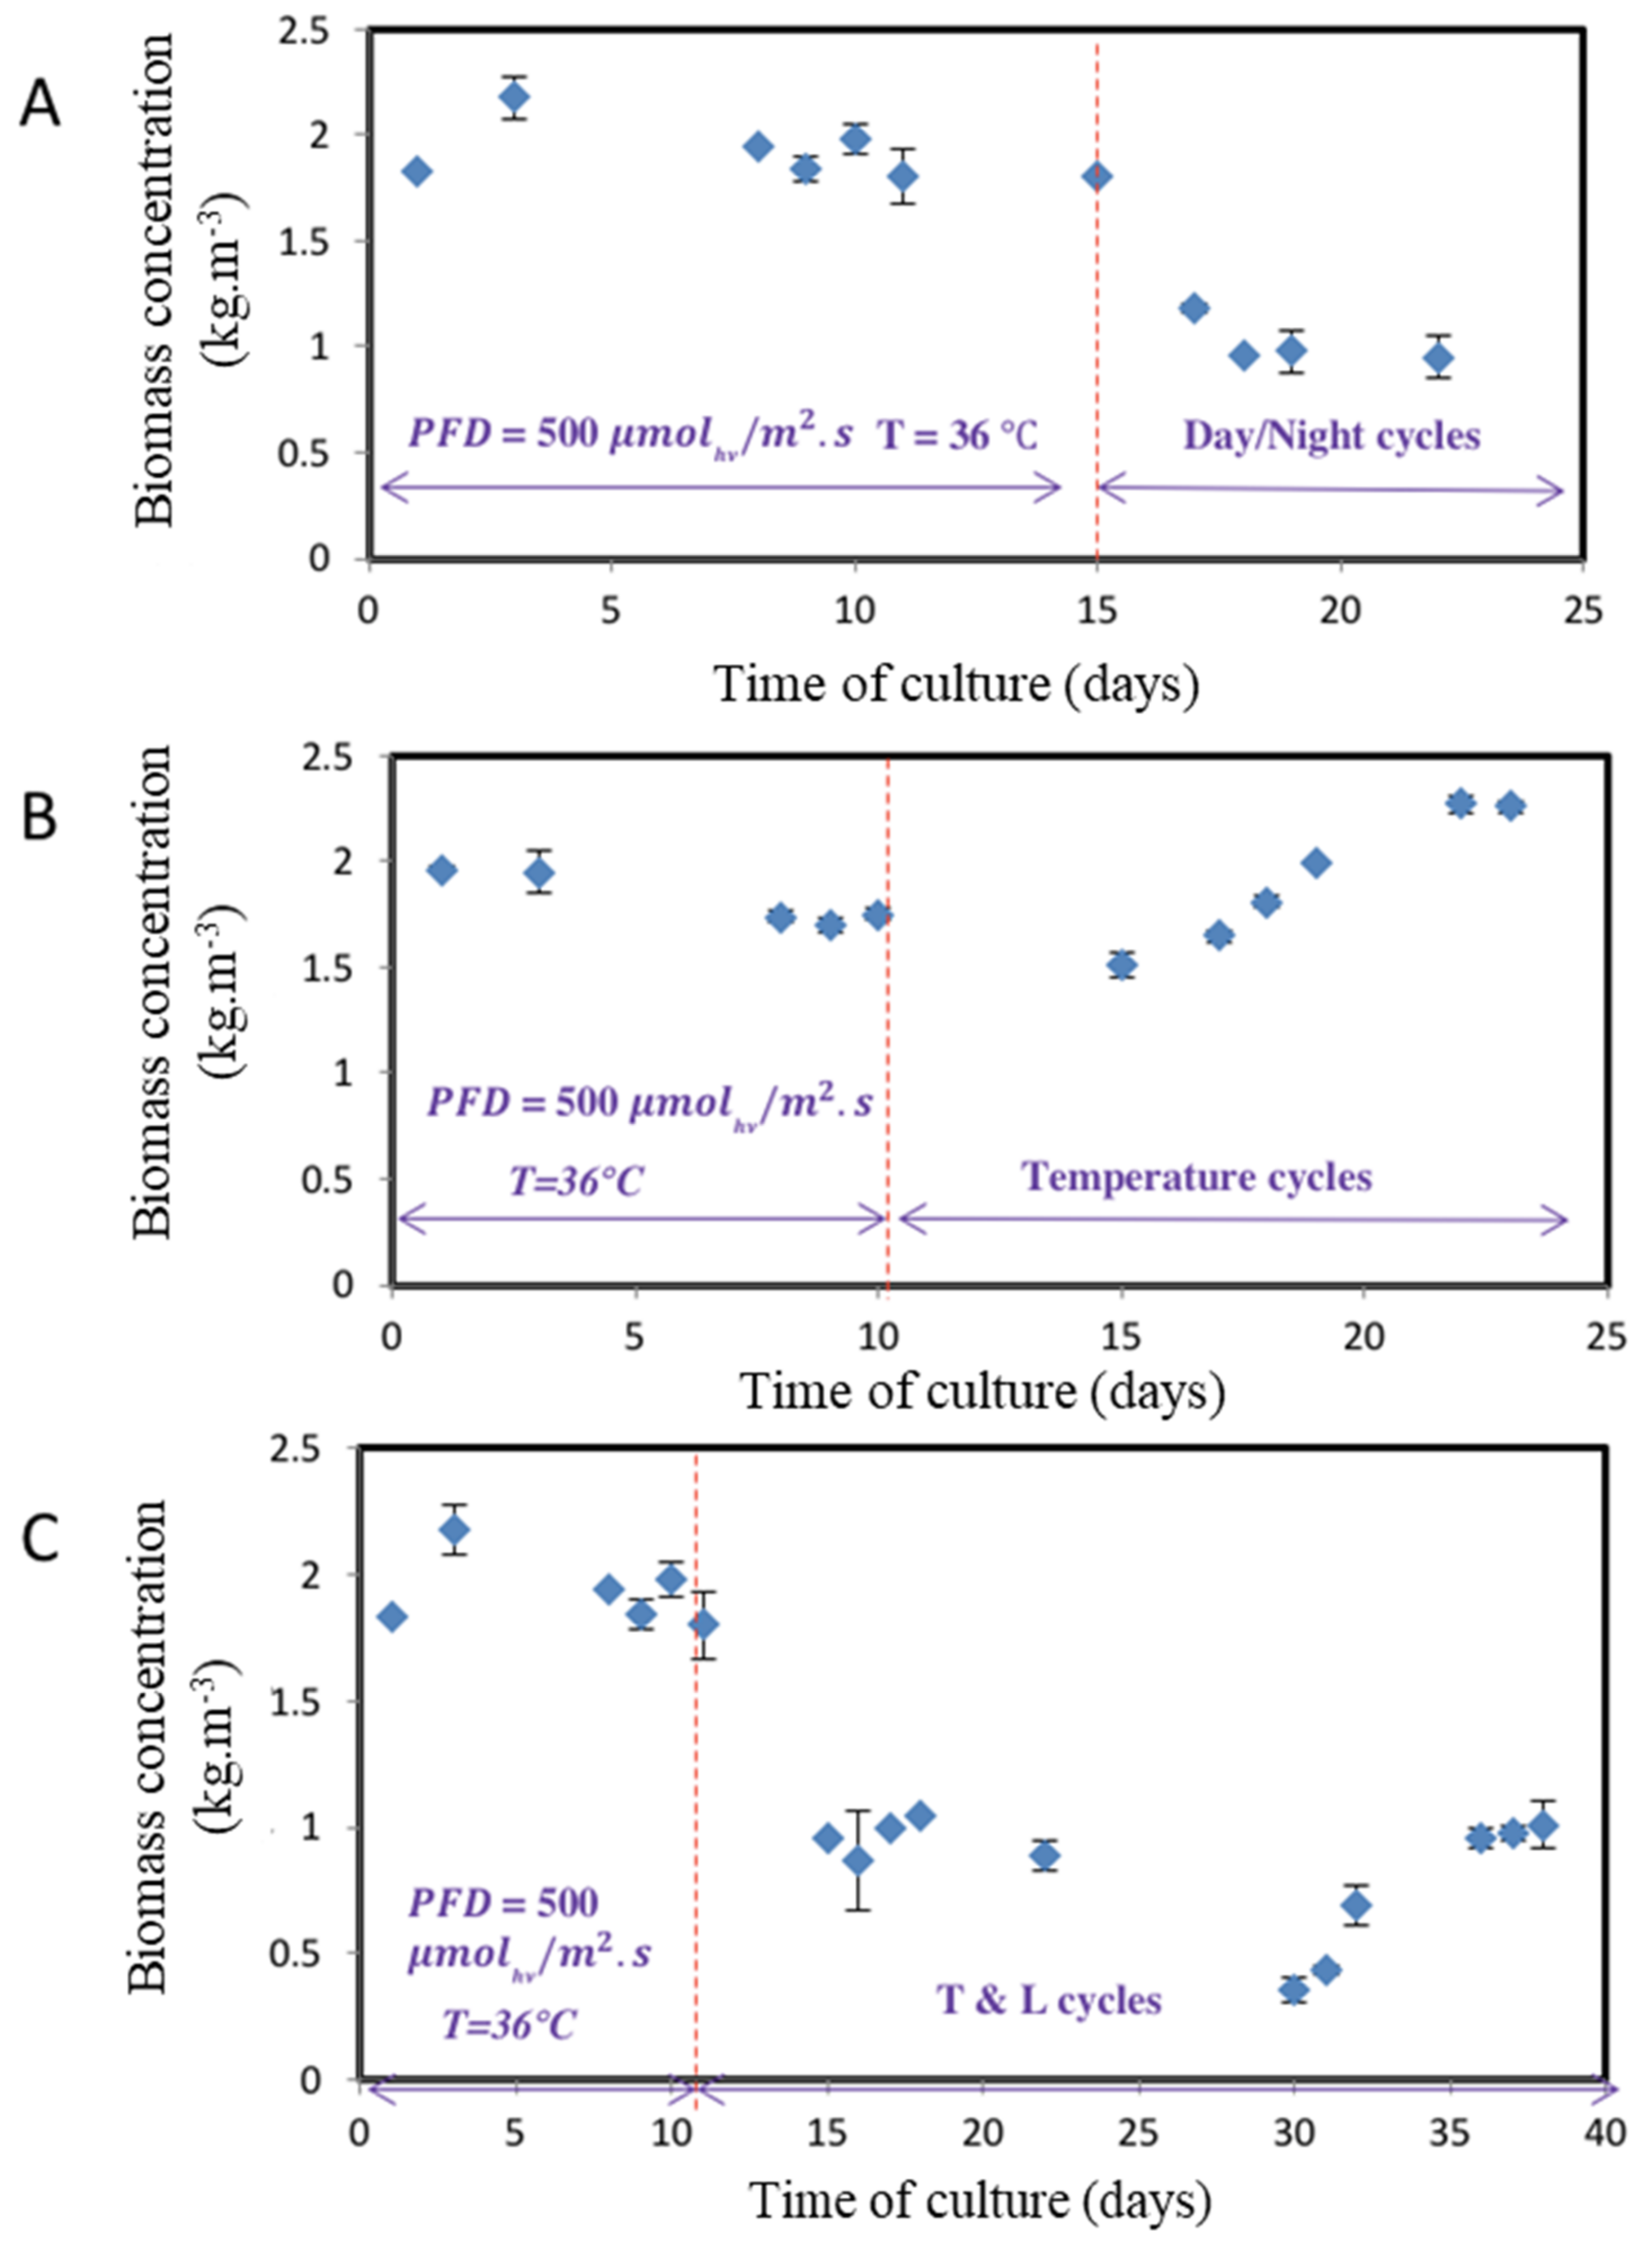
When the day/night cycle stress (Regime C) was applied to a steady-state culture obtained at constant continuous light and temperature, an immediate and sharp 50% decrease in algae biomass was observed, varying between 1.9 kg.m−3 and 0.96 kg.m−3 (Figure 4A). This decrease was higher than that reported by [7] and [6], who observed a reduction of almost 30% in algae biomass after moving from a continuous light regime to a day/night cycle regime. N. sp. QU130 acclimated to the day/night cycle after five days, and an almost constant biomass concentration was achieved over time.
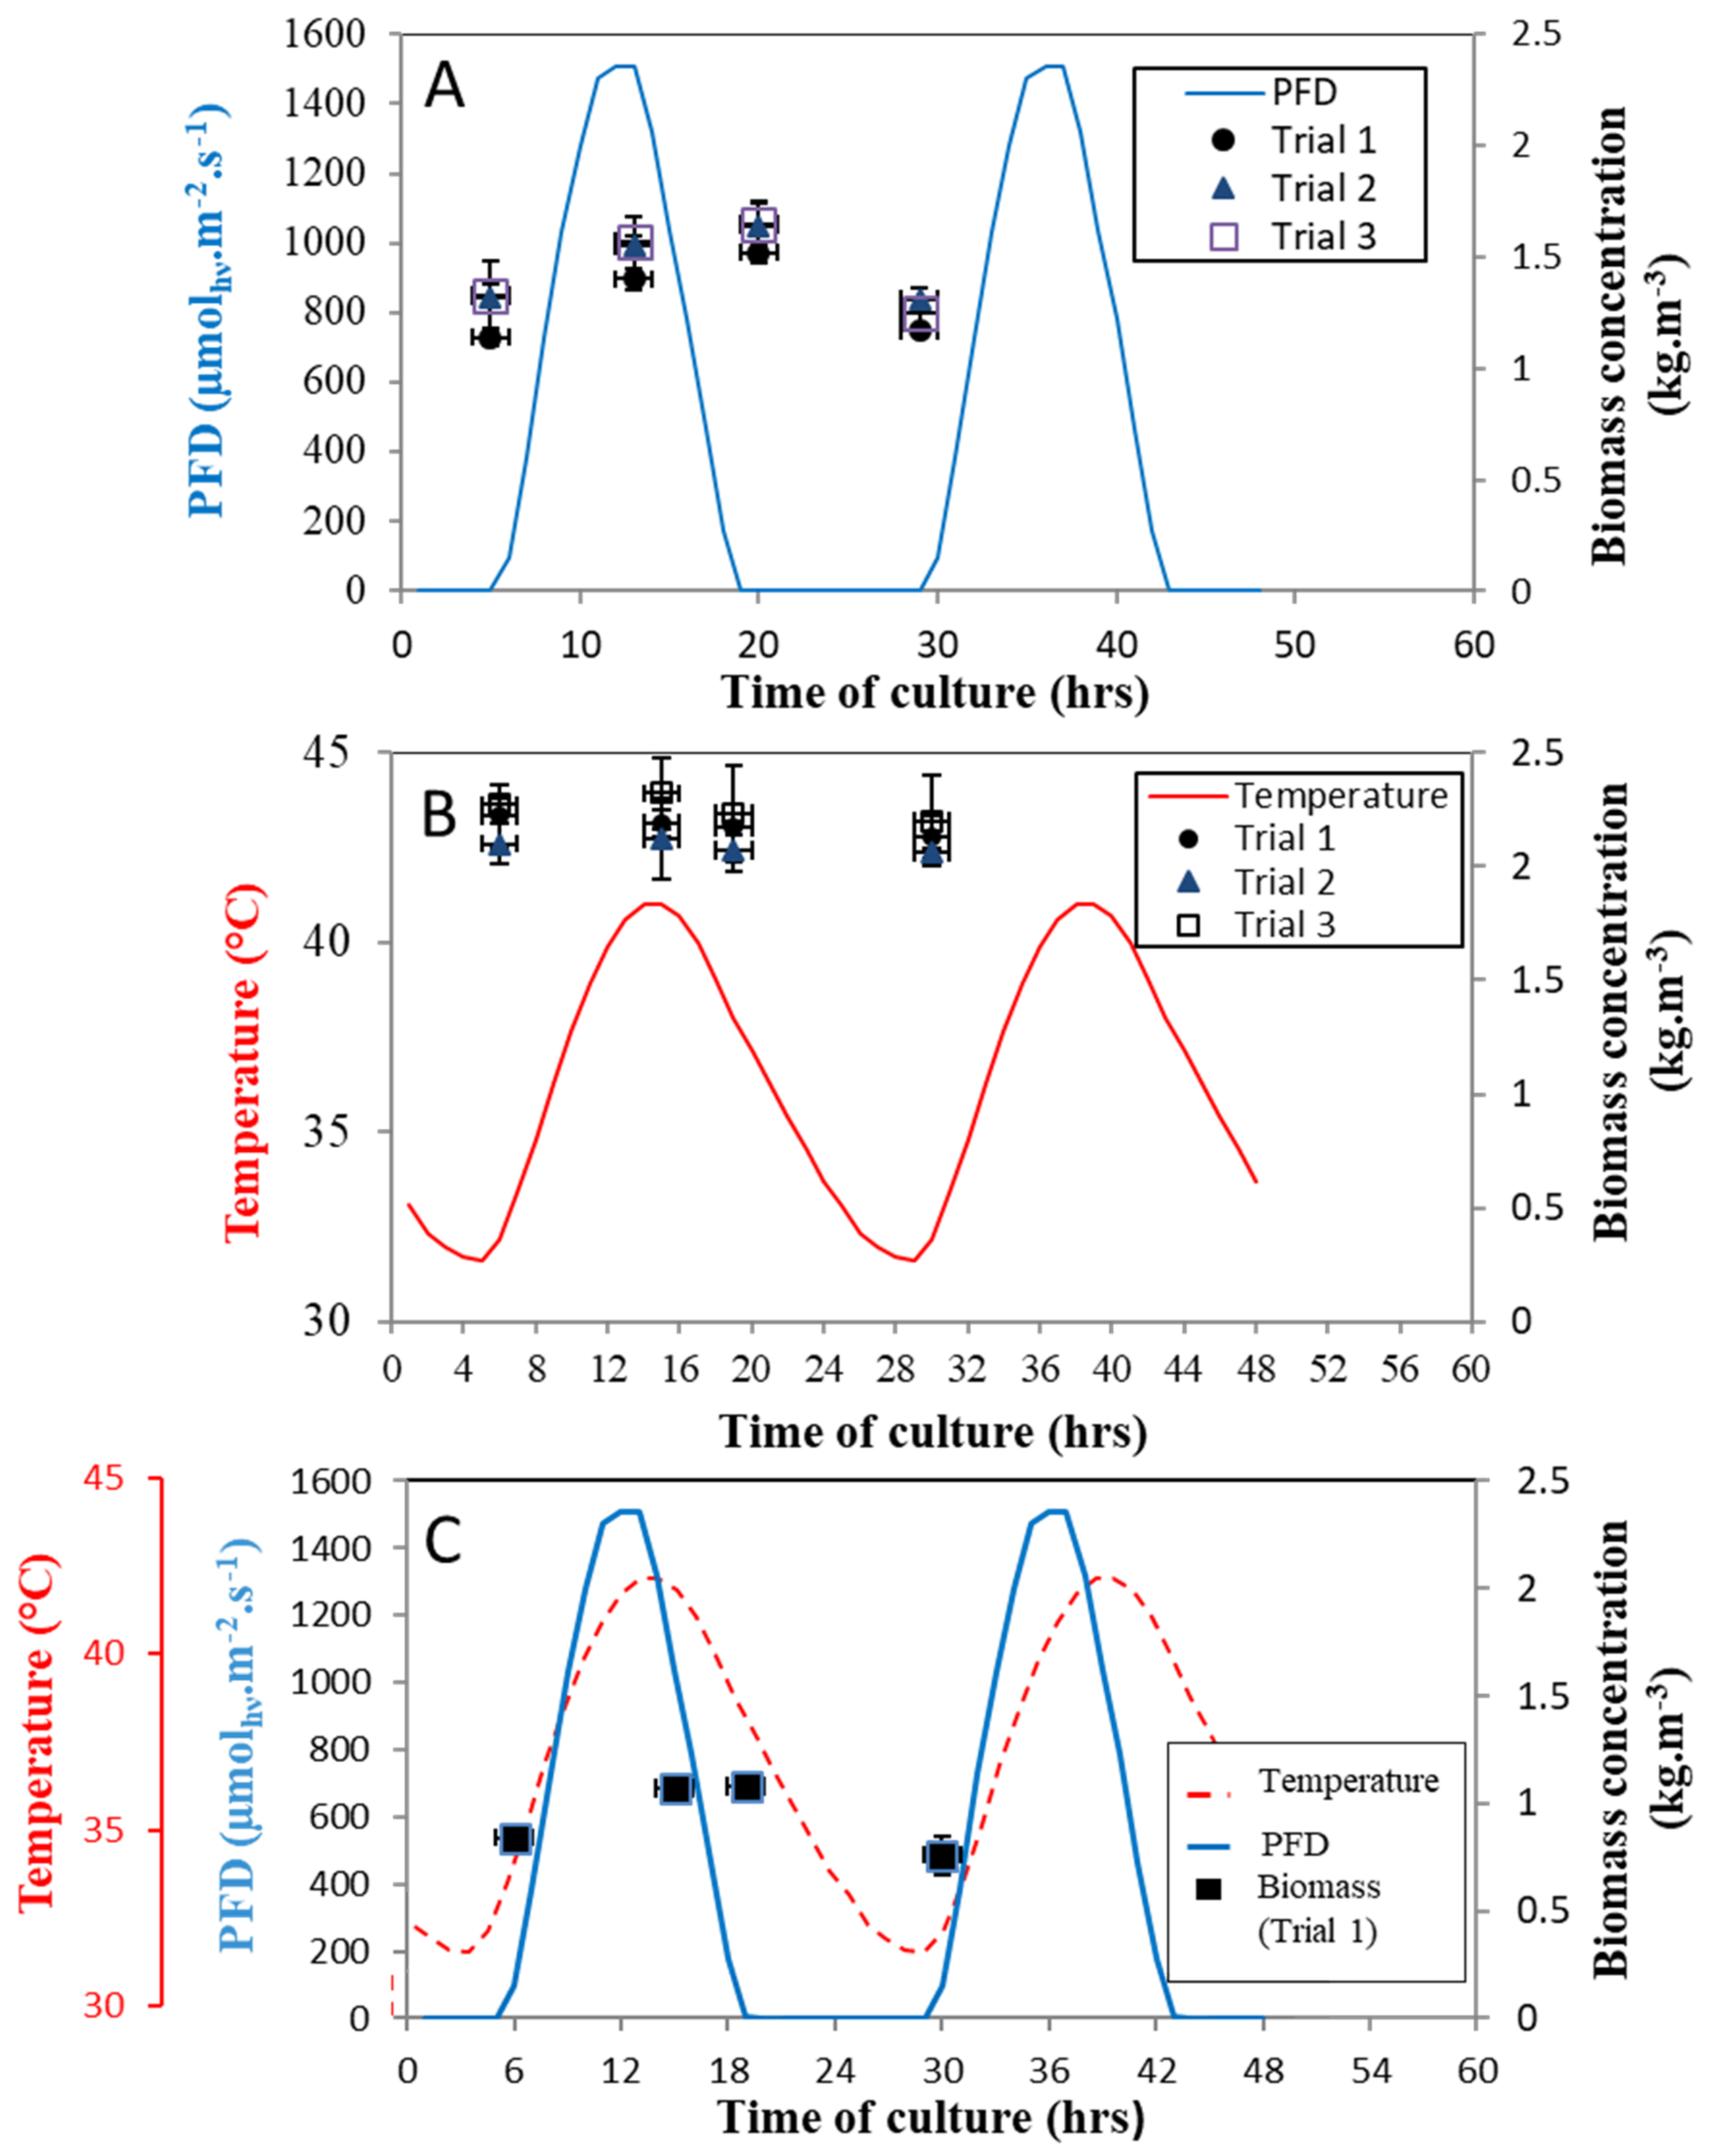
Measurements over the 24 h cycle were then conducted (Figure 5A). There was a 15% increase in biomass concentration with light intensity increasing from 1.3 at dawn to 1.5 kg.m−3 at the maximum daytime irradiance. It reached a maximum of 1.65 kg.m−3 at the end of the day after 14 h of illumination, with a total 25% increase in biomass concentration (Figure 5A). These results concur with Wu and Merchuk and Ho et al., who demonstrated a significant increase in algae biomass concentration in response to an increase in light [5,26]. However, a 15% reduction in biomass concentration was observed during the night period, from 1.5 kg.m−3 to 1.3 kg.m−3. A similar observation was reported by Taleb et al. in their work on Parachlorella kessleri cultivated in simulated day/night cycles representing solar conditions in Nantes, France [27]. The average biomass concentration generated by all the samples was 1.4 kg.m−3 and the volumetric biomass productivity under day/night cycle (Regime C) was 0.67 kg.m−3 day−1 (corresponding to an areal biomass productivity of 20.1 g.m−2.day−1).
The culture exhibited very different behavior when temperature cycle stress was applied to the steady-state culture under constant PFD and T (Regime B). A slight 15% decrease in N. sp. QU130 productivity was first observed, followed by a quick recovery of the algae strain growth, indicating a rapid acclimation to temperature after five days (Figure 4B). The short exposure (8 h) of the culture to a high temperature boosted the growth performance of the strain by enhancing its physiological and biochemical properties; an increase of almost 50% in biomass concentration was recorded after acclimation to temperature cycles at 2.4 kg.m−3, compared to a biomass concentration of 1.75 kg.m−3 under constant PFD and T conditions. The situation was different for Singh and Singh, who reported that an increase to more than the optimal temperature for growth was generally associated with cell damage or cell death [28]. This has been explained by heat stress, which abolishes the enzymatic activities or modifies the structure and activity of proteins and membrane fluidity, leading to disturbance of the metabolic processes and ultimately reducing algae growth [29,30,31].
Our results emphasize that N. sp. QU130 growth was not significantly affected by the sinusoidal temperature when it varied between 31 °C and 41 °C (Figure 5B). The average biomass concentration generated by the different samples collected at different temperatures was 2.3 kg.m−3, and the volumetric growth productivity rate was 1.10 kg.m−3.day−1 (i.e., areal biomass productivity 33 g.m−2.day−1). For comparison, an investigation of Nannochloropsis gaditana in the same photobioreactor also showed an increase in growth productivity with temperature, but reached only 0.30 ± 0.03 kg.m−3.day−1 (i.e., areal biomass productivity 9 g.m−2.day−1) under less-stressful temperatures in the range 22–30 °C [27]. N. sp. QU130, therefore, showed more efficient acclimation and growth performance under temperature fluctuation stress. This may be due to the thermo-tolerant nature of the N. sp. QU130 strain, which was isolated from the Qatar desert, where the average annual temperature is 41 °C. This finding was confirmed by Huertas Emma et al. who proved that microalgal predisposition to acclimate depends on their original environmental conditions [32].
For our final experiment (Regime D), temperature fluctuations and light cycles were combined to simulate outdoor summer conditions in the Qatar desert. When these conditions were applied to the culture already adapted to constant PFD and temperature conditions, the biomass concentration of N. sp. QU130 dropped by around 45%. A long period of around 25 days was also required to achieve a stable periodic regime (Figure 4C). These results tend to emphasize the stressful conditions applied to the culture, resulting in a long period of acclimation.
Once the culture was acclimated to the conditions, an assessment study over 24 h revealed positive growth over the period between sunrise and sunset (Figure 5C). A slight increase in biomass concentration from 1.2 kg.m−3 at dawn to 1.35 kg.m−3 at midday was achieved by increasing light intensity and temperature to the maximum. Maximum growth was achieved at 1.5 kg.m−3 at the end of the day, with a total 25% increase in biomass concentration after 14 h of illumination, although it decreased to 1.1 kg.m−3, also around 25%, over the dark period. The average biomass concentration taken over 24 h was 1.3 kg.m−3 and the volumetric biomass productivity was 0.62 kg.m−3.day−1 (i.e., areal biomass productivity of 18.6 g.m−2.day−1).

3.2. Assessment of Light and Temperature Fluctuations on the Number and Morphology of Algal Cells

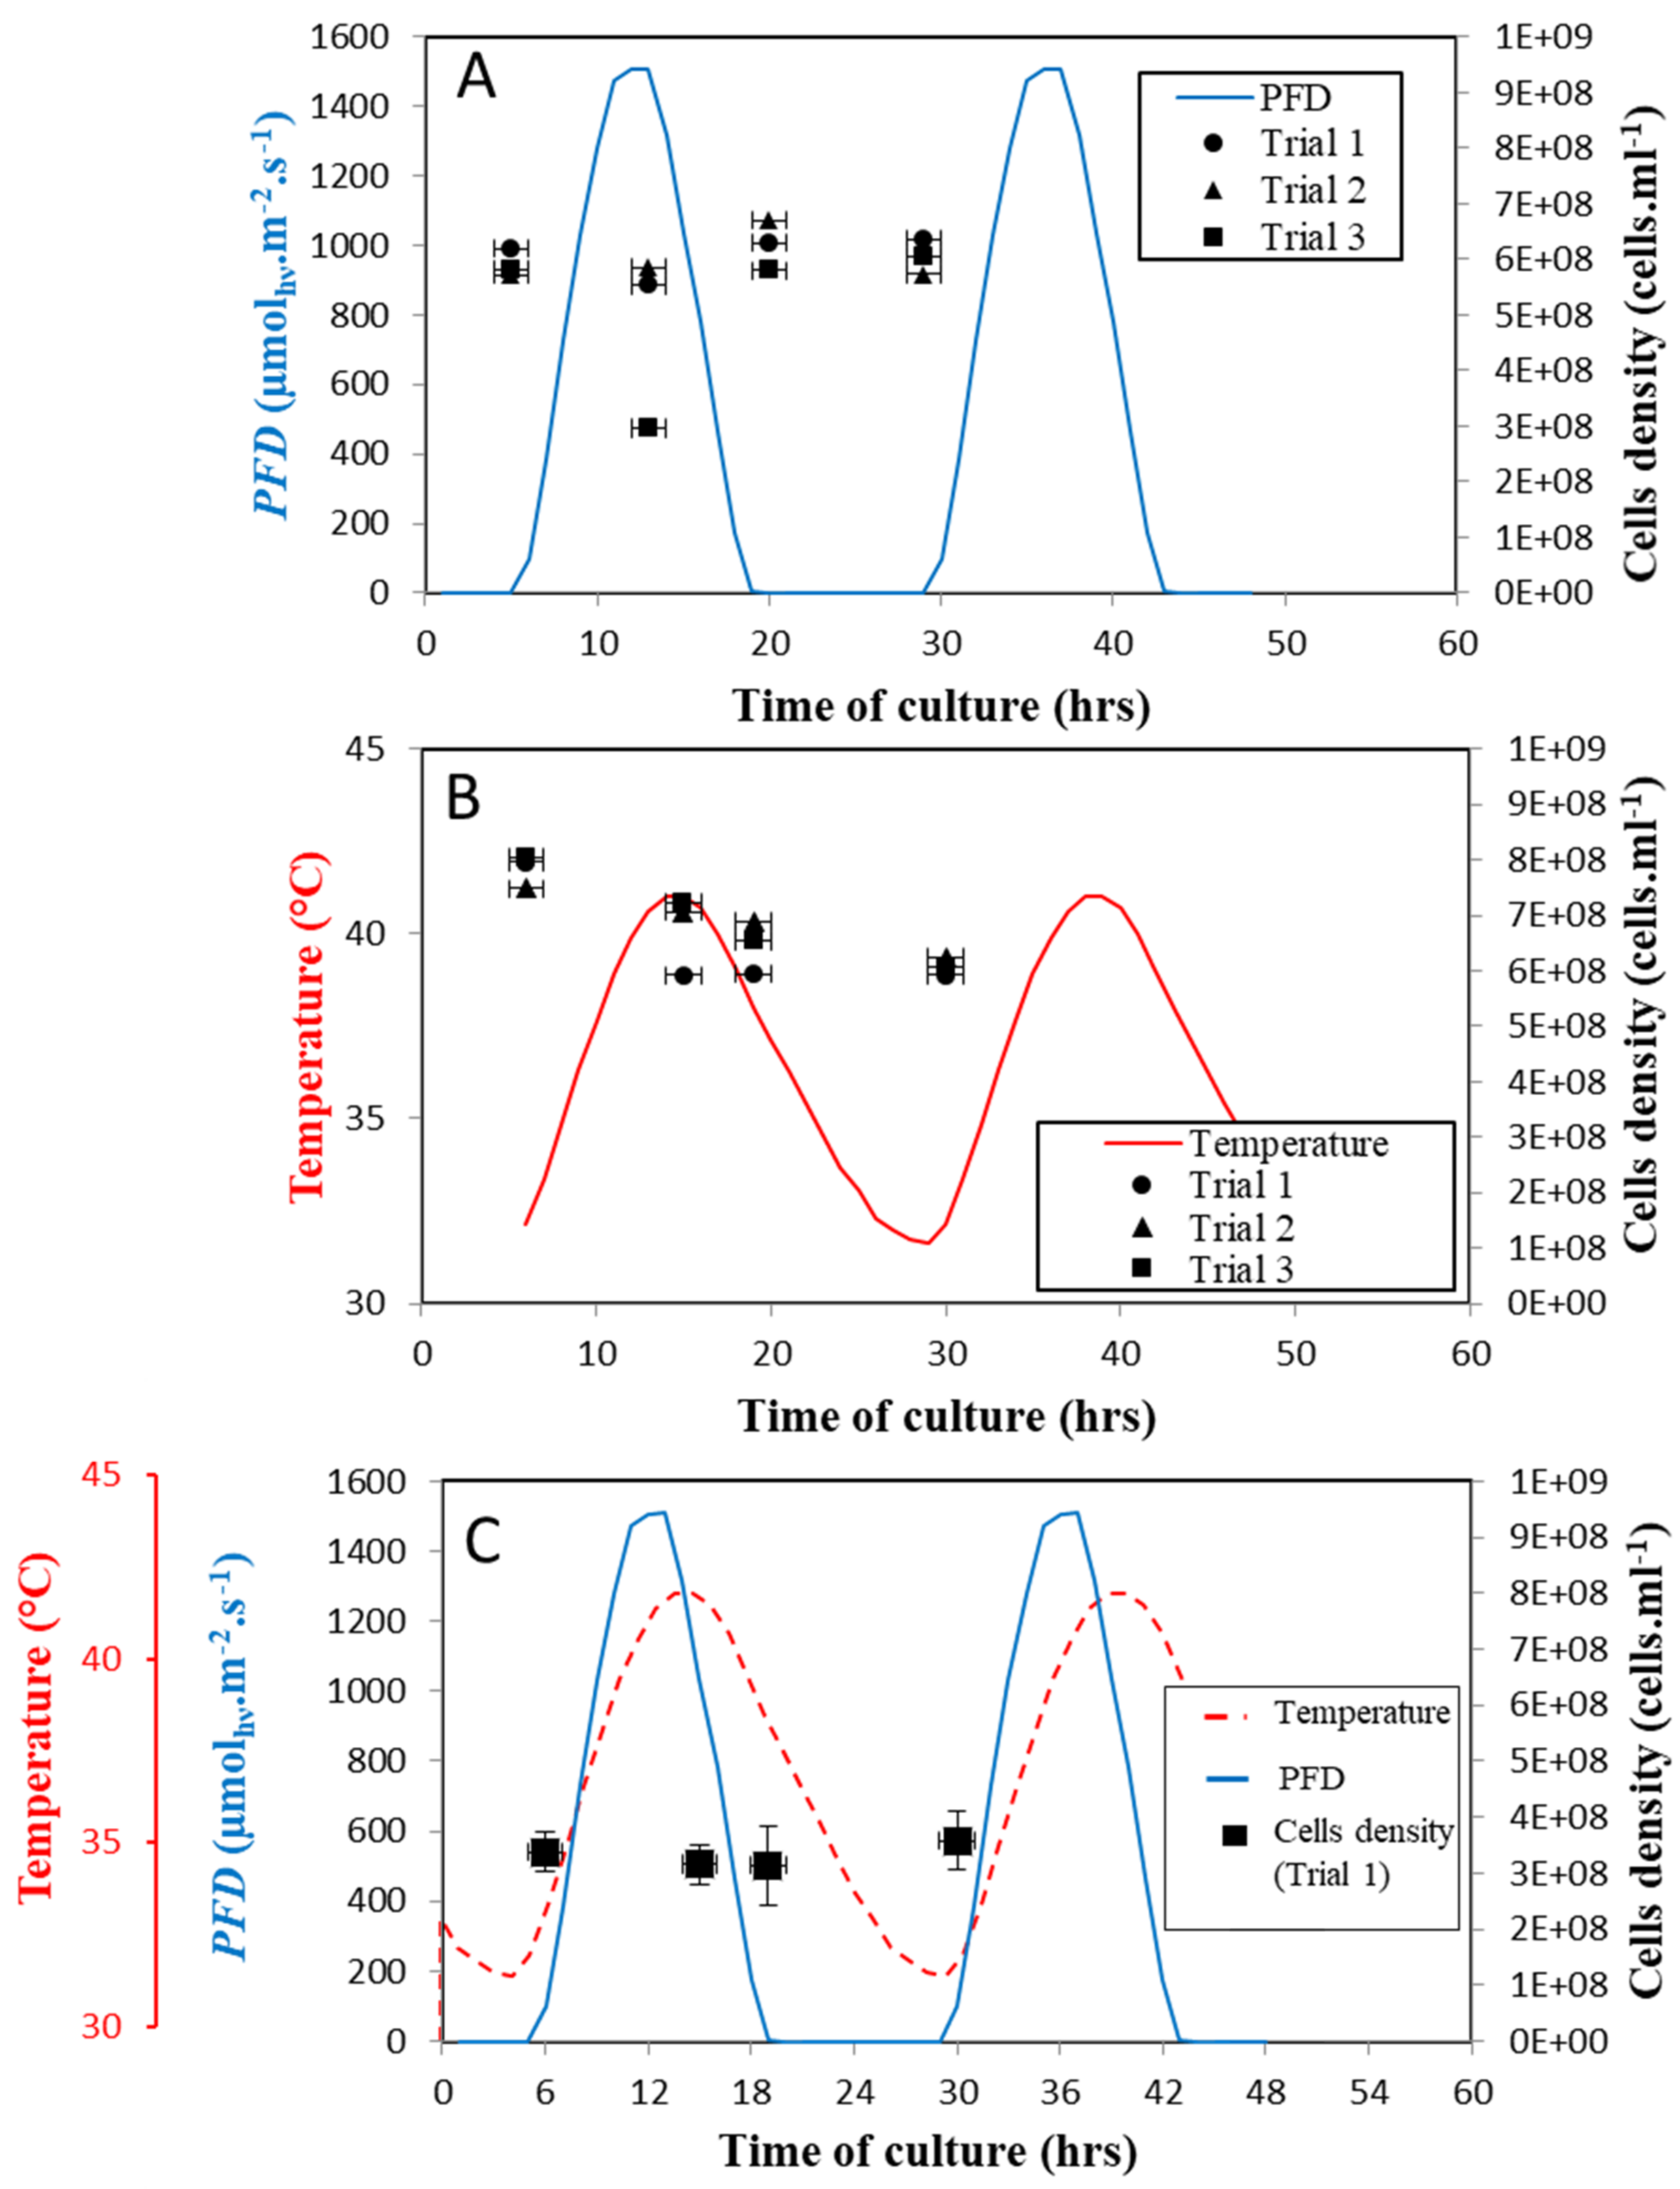
Cell size and number were also monitored during N. sp. QU130 growth under the three cultivation regimes. In general, a decrease in cell numbers was observed when light intensity or temperature was increased during the separate cycles (Figure 6A,B). However, the number of cells did not change significantly in response to combined light and temperature fluctuations (Figure 6C). However, an increase in cell size was also observed when shifting from continuous conditions to each of the cycles (Table 1). This might be explained by the cell size increasing under cycle stresses in response to the accumulation of energy-rich compounds, such as carbohydrates and lipids, or as a way of acclimating to temperature-increase stress [33]. In each case, the physiology of the cells was affected by time-fluctuation conditions.
In the experiment under light cycle (Experiment C), note that cell numbers decreased by 10% at midday due to the greater amount of light received, but they increased again, by almost the same percentage, with the decrease in PFD at the end of the day, and remained at the same level overnight (Figure 6A). By contrast, cell size started to decrease from 2.70 ± 0.18 µm at midday to about 2 ± 0.04 µm at the end of the night, with a total 25% reduction in cell volume (Table 1). This can be explained by the cell division process following the accumulation of necessary metabolic compositions during the (light) photosynthesis process [34]. A similar situation was observed for the temperature cycle with constant light (Experiment B); the number of cells mainly dropped when the temperature was highest, then stabilized when the temperature fell again. This tends to emphasize the stressful conditions of both light and temperature at midday, which both resulted in a drop in cell numbers. However, the cycle periods with low light (i.e., night) or low temperature (below 30–35 °C) produced different physiological effects. For light cycles, darkness resulted in a marked increase in cell numbers, as a result of night division. For the temperature cycle (Regime B), a low temperature resulted in a negligible variation in cell numbers. This concurs with several other works which reported a decrease in cell division when the temperature dropped [35]. Note, however, that the temperature was sufficiently high to allow metabolic activity. During the period of low temperature, a decrease in cell size from 3.13 ± 0.06 µm at 41 °C to 2.4 ± 0.03 µm at 32 °C was recorded.

3.3. Assessment of the Light and Temperature Fluctuation on the Photosynthetic Pigments Synthesis

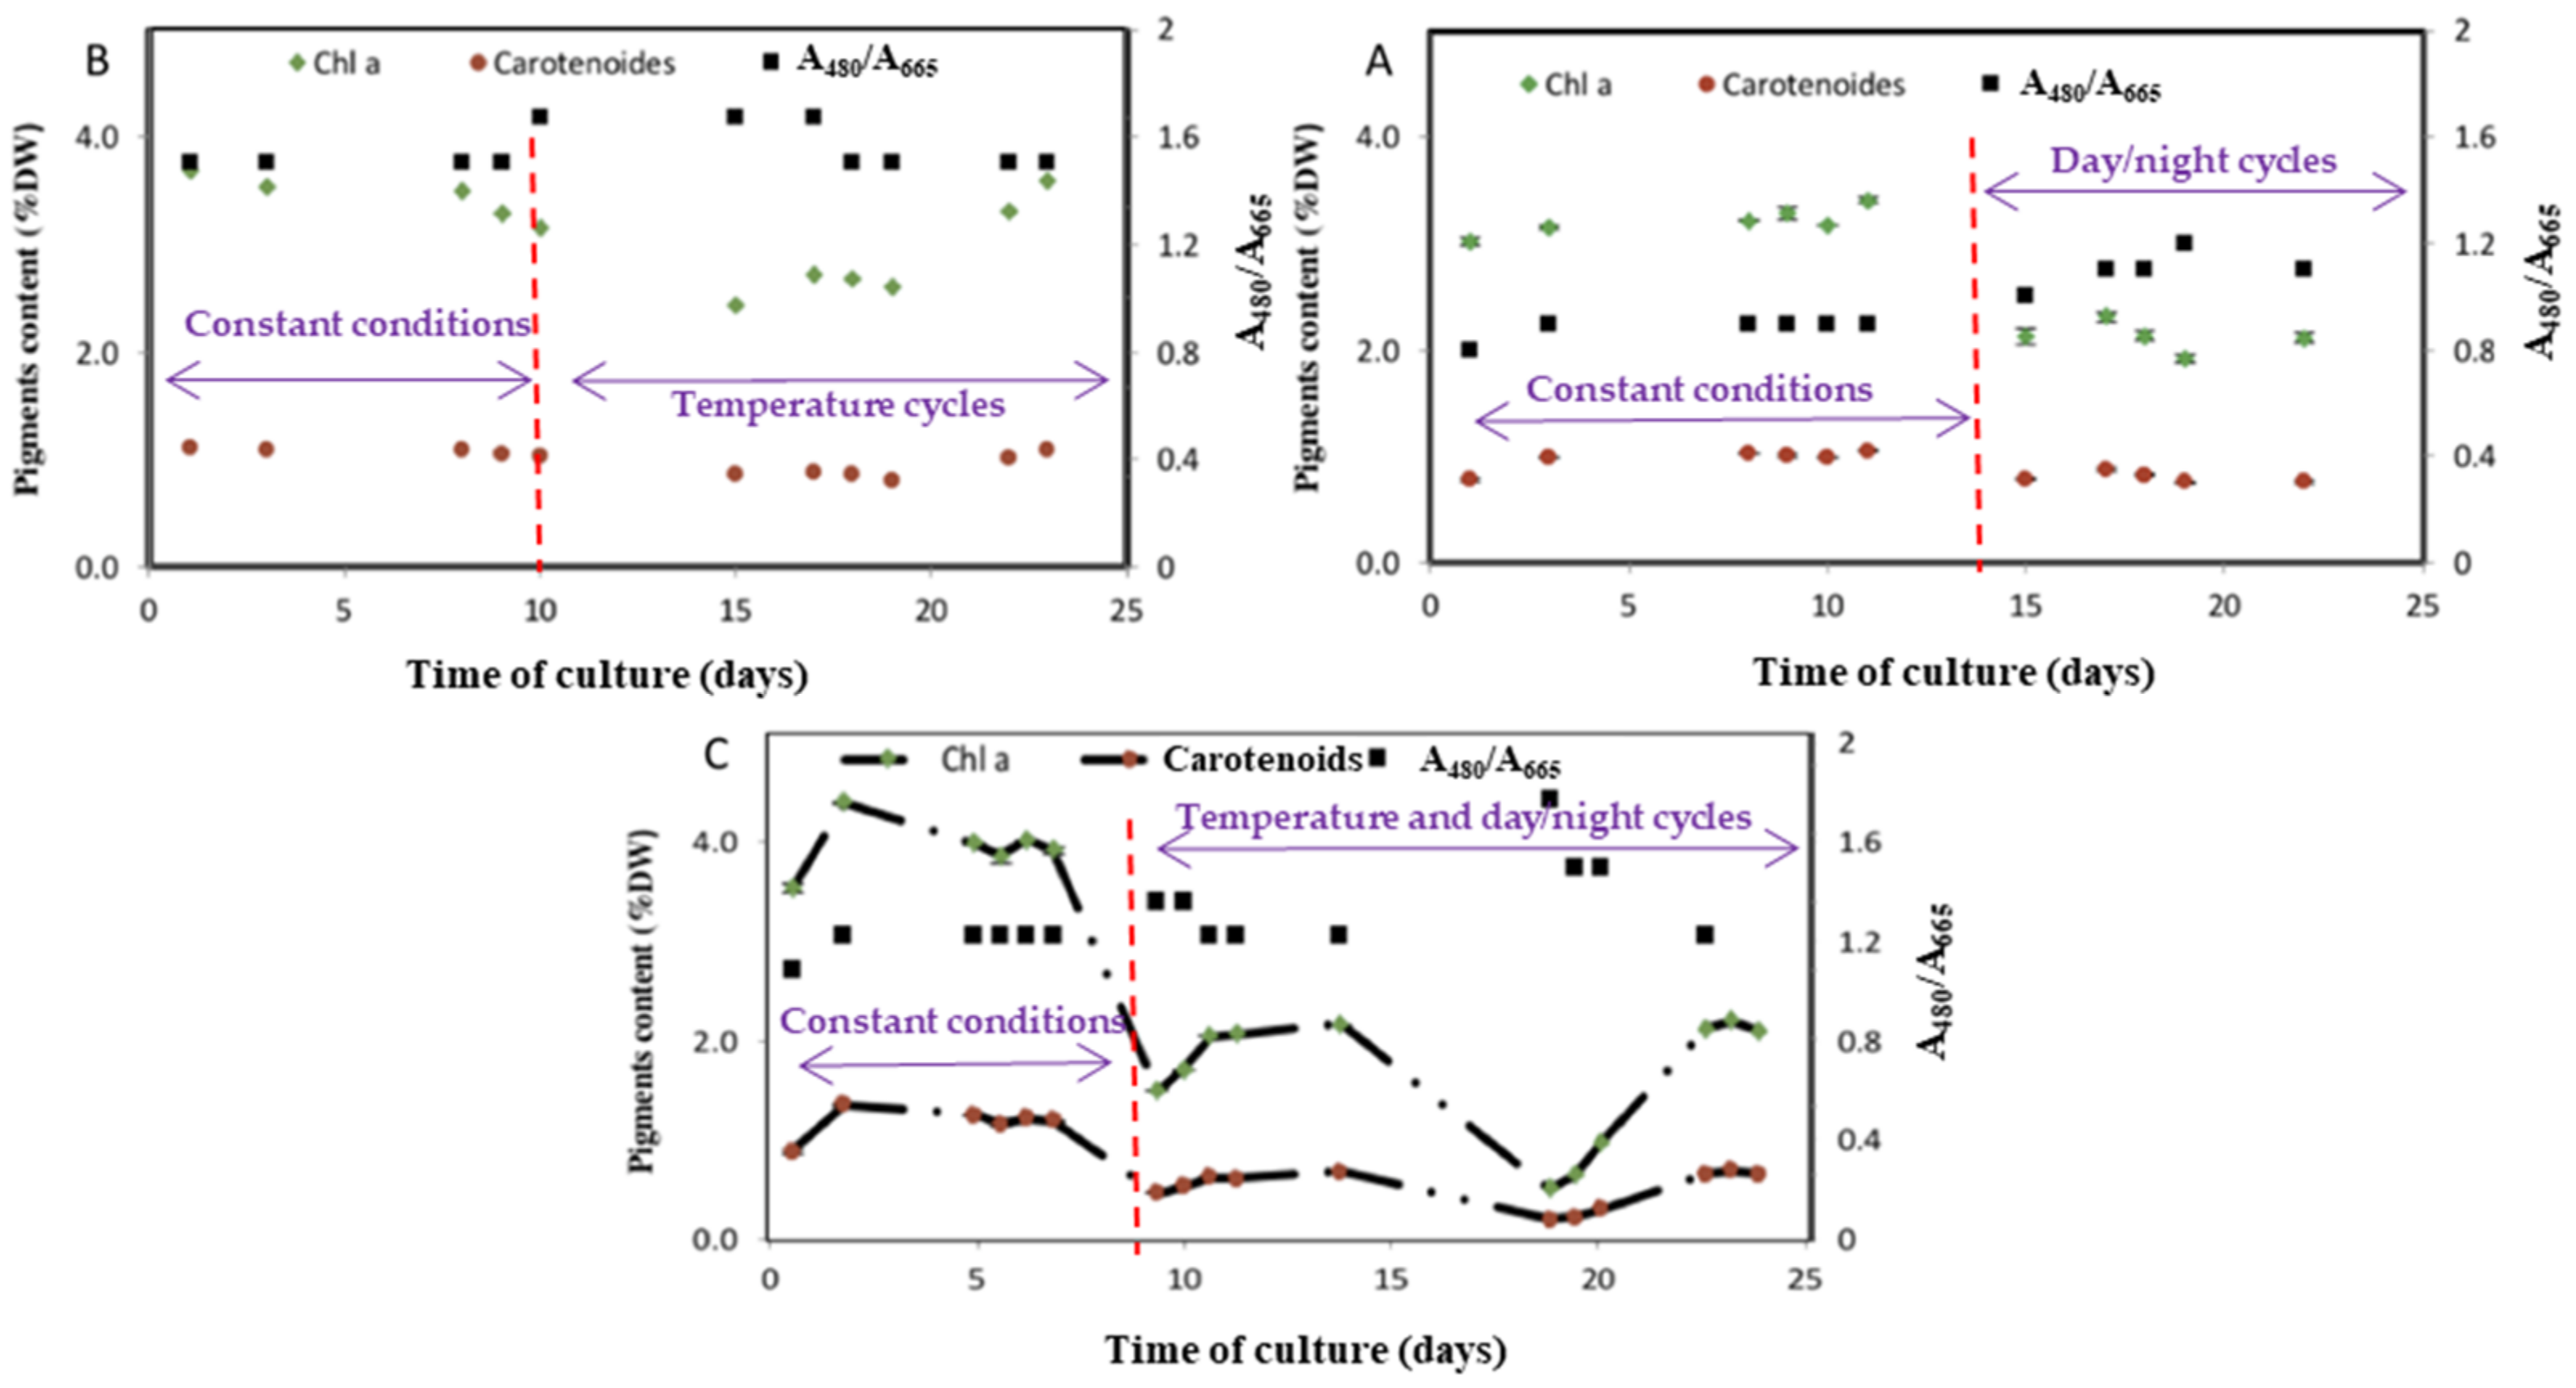
Chlorophyll-a and total carotenoid concentrations were monitored during the cultivation of N. sp. QU130 using the three cultivation models. In general, there was an immediate change in pigment concentration with an increase in the stress factor of light, and/or temperature cycles, compared to when the culture was exposed to constant light and temperature conditions (Figure 7). Under light fluctuation, there was a significant drop of about 42% and 20% in Chl a and carotenoid concentrations, respectively (Figure 7B). Even after adaptation to the cycles, the pigment concentrations remained at lower levels than those achieved under constant conditions. In the same context, reductions in pigment concentration were observed under the combined light and temperature cycle (Figure 7C), which also highlights the stressful conditions applied to the culture. Although the results of the temperature cycle also showed a decrease in pigment concentrations immediately after the application of stress, note that the concentrations increased again to higher levels after the culture adapted to the cycle (Figure 7A). The results showed a negligible increase in carotenoid content produced by N. sp. QU130 under temperature fluctuation. These pigments are required to counteract the effects of free radicals caused by high temperature, to protect the cells and reduce damage to the photosynthetic system apparatus [36].

3.4. Metabolism Alterations in Response to Day/Night Cycle and Temperature Fluctuations

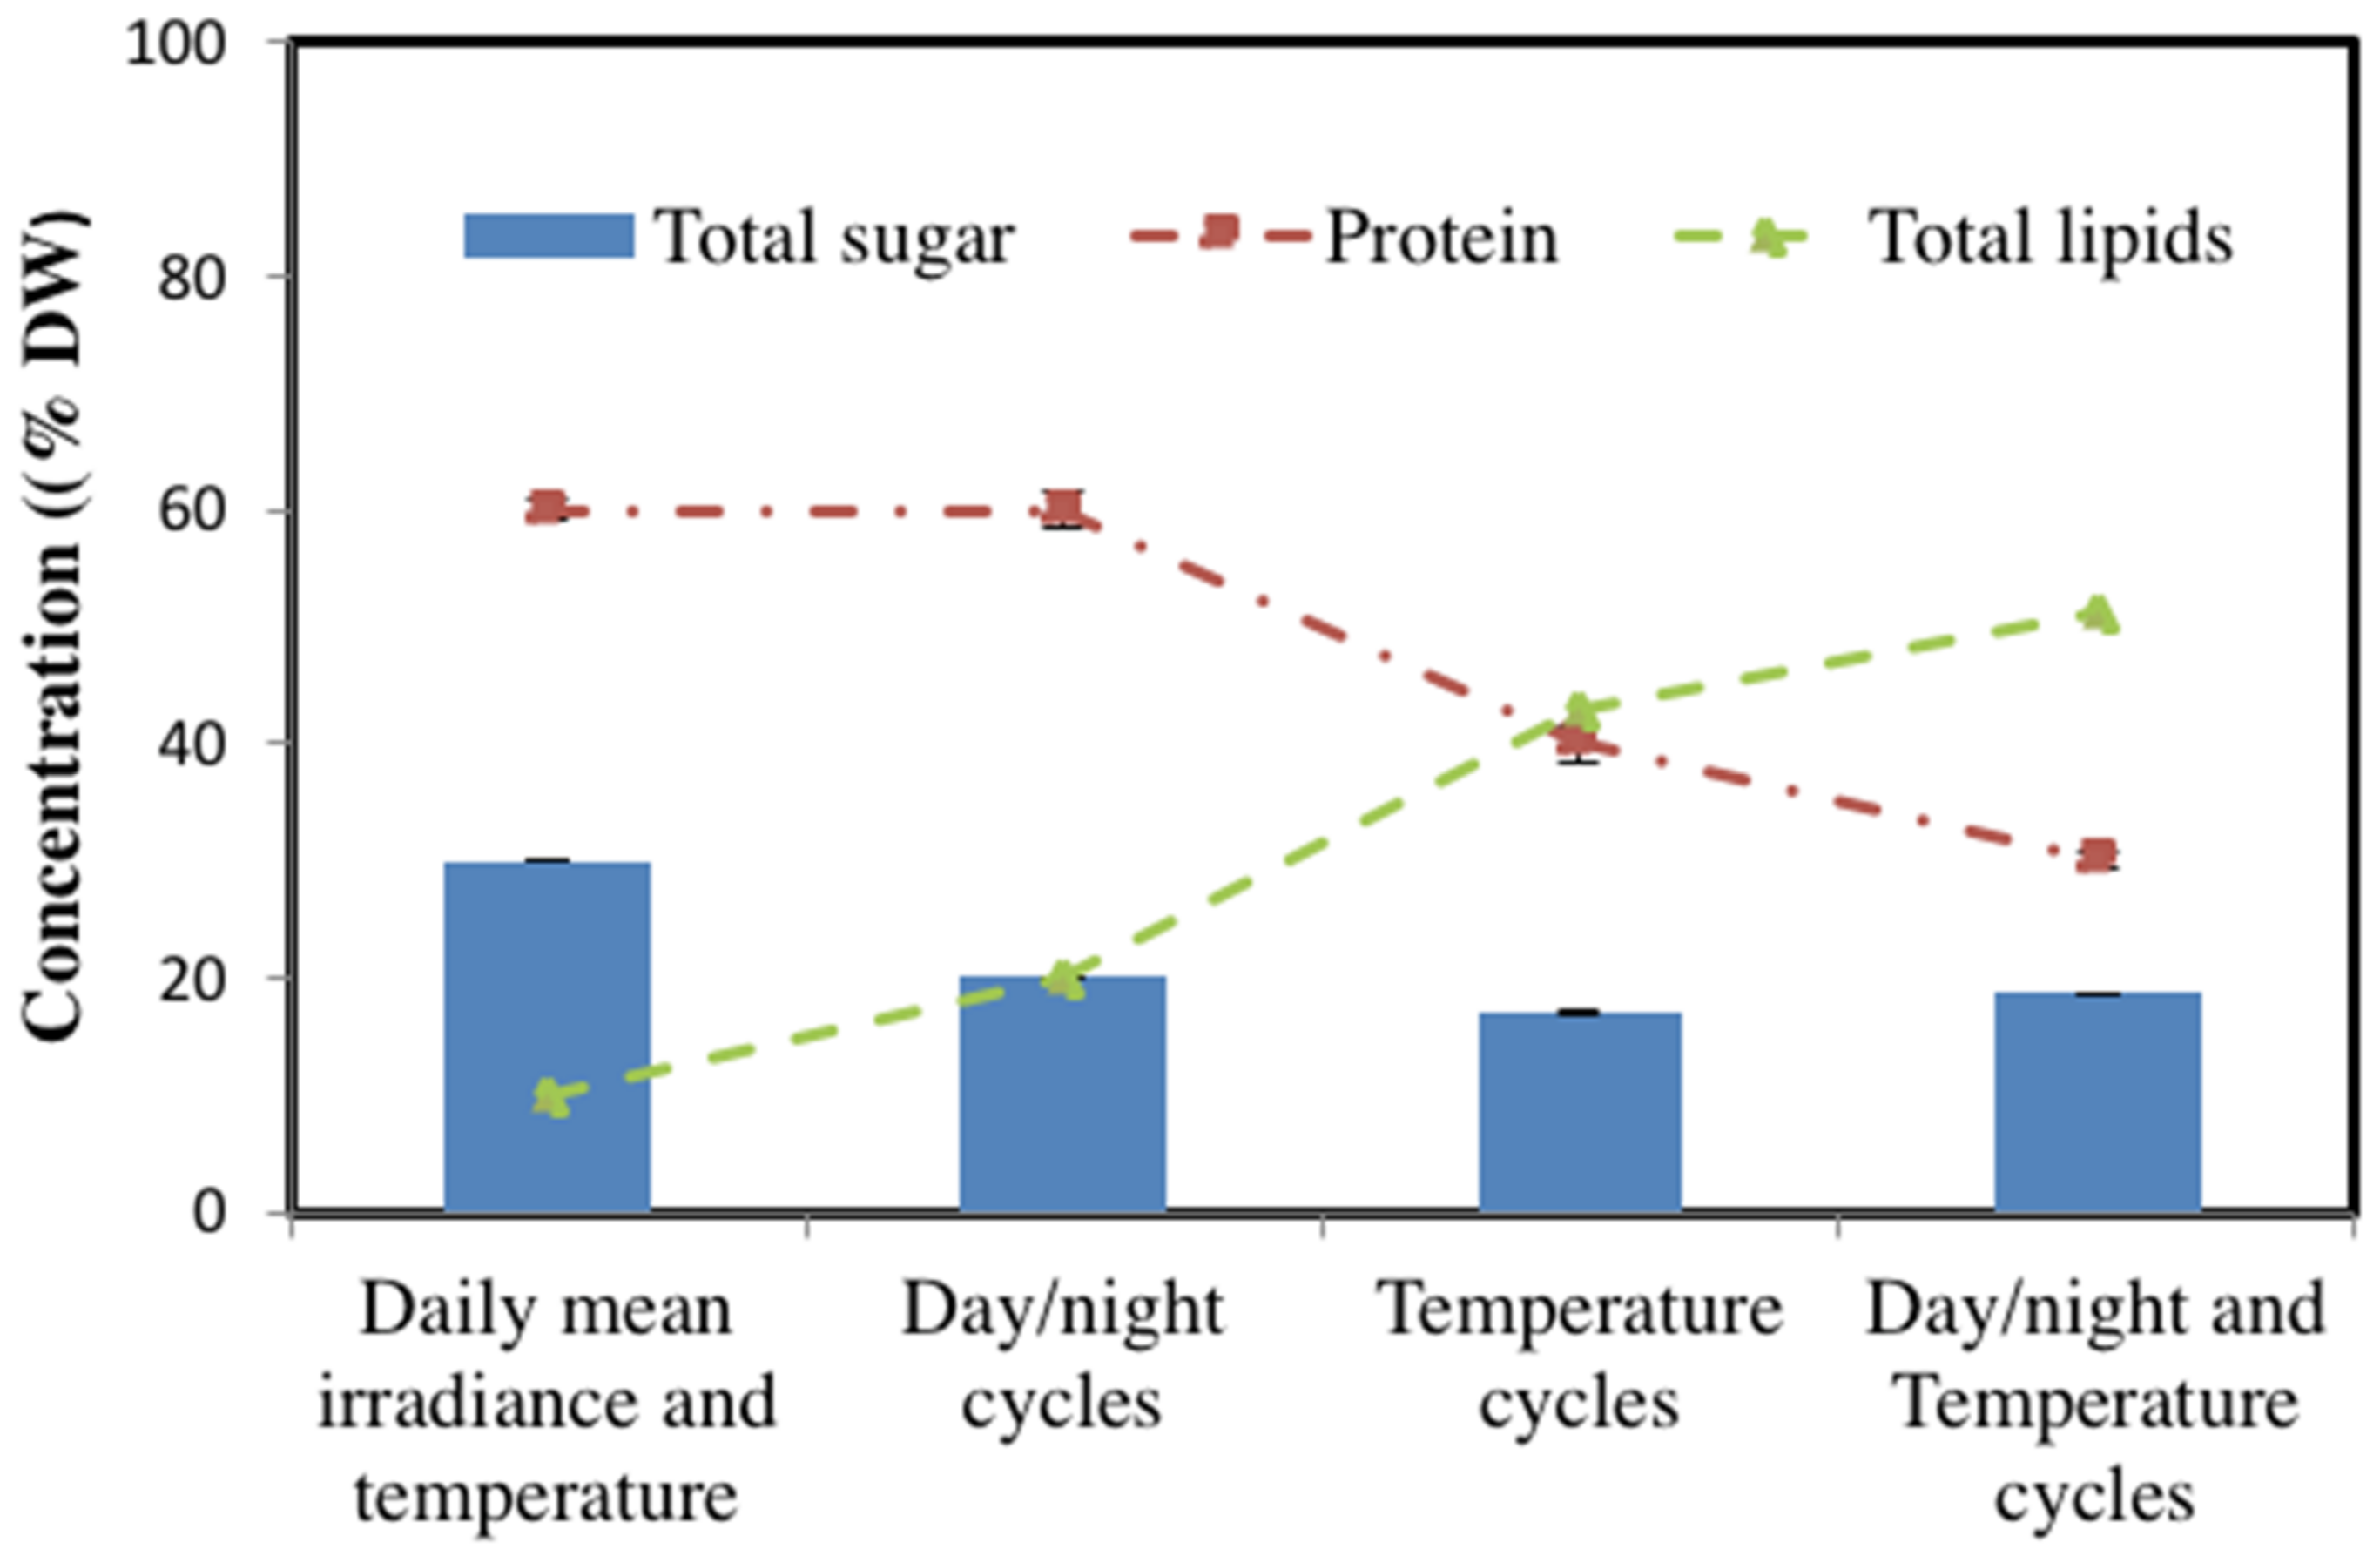
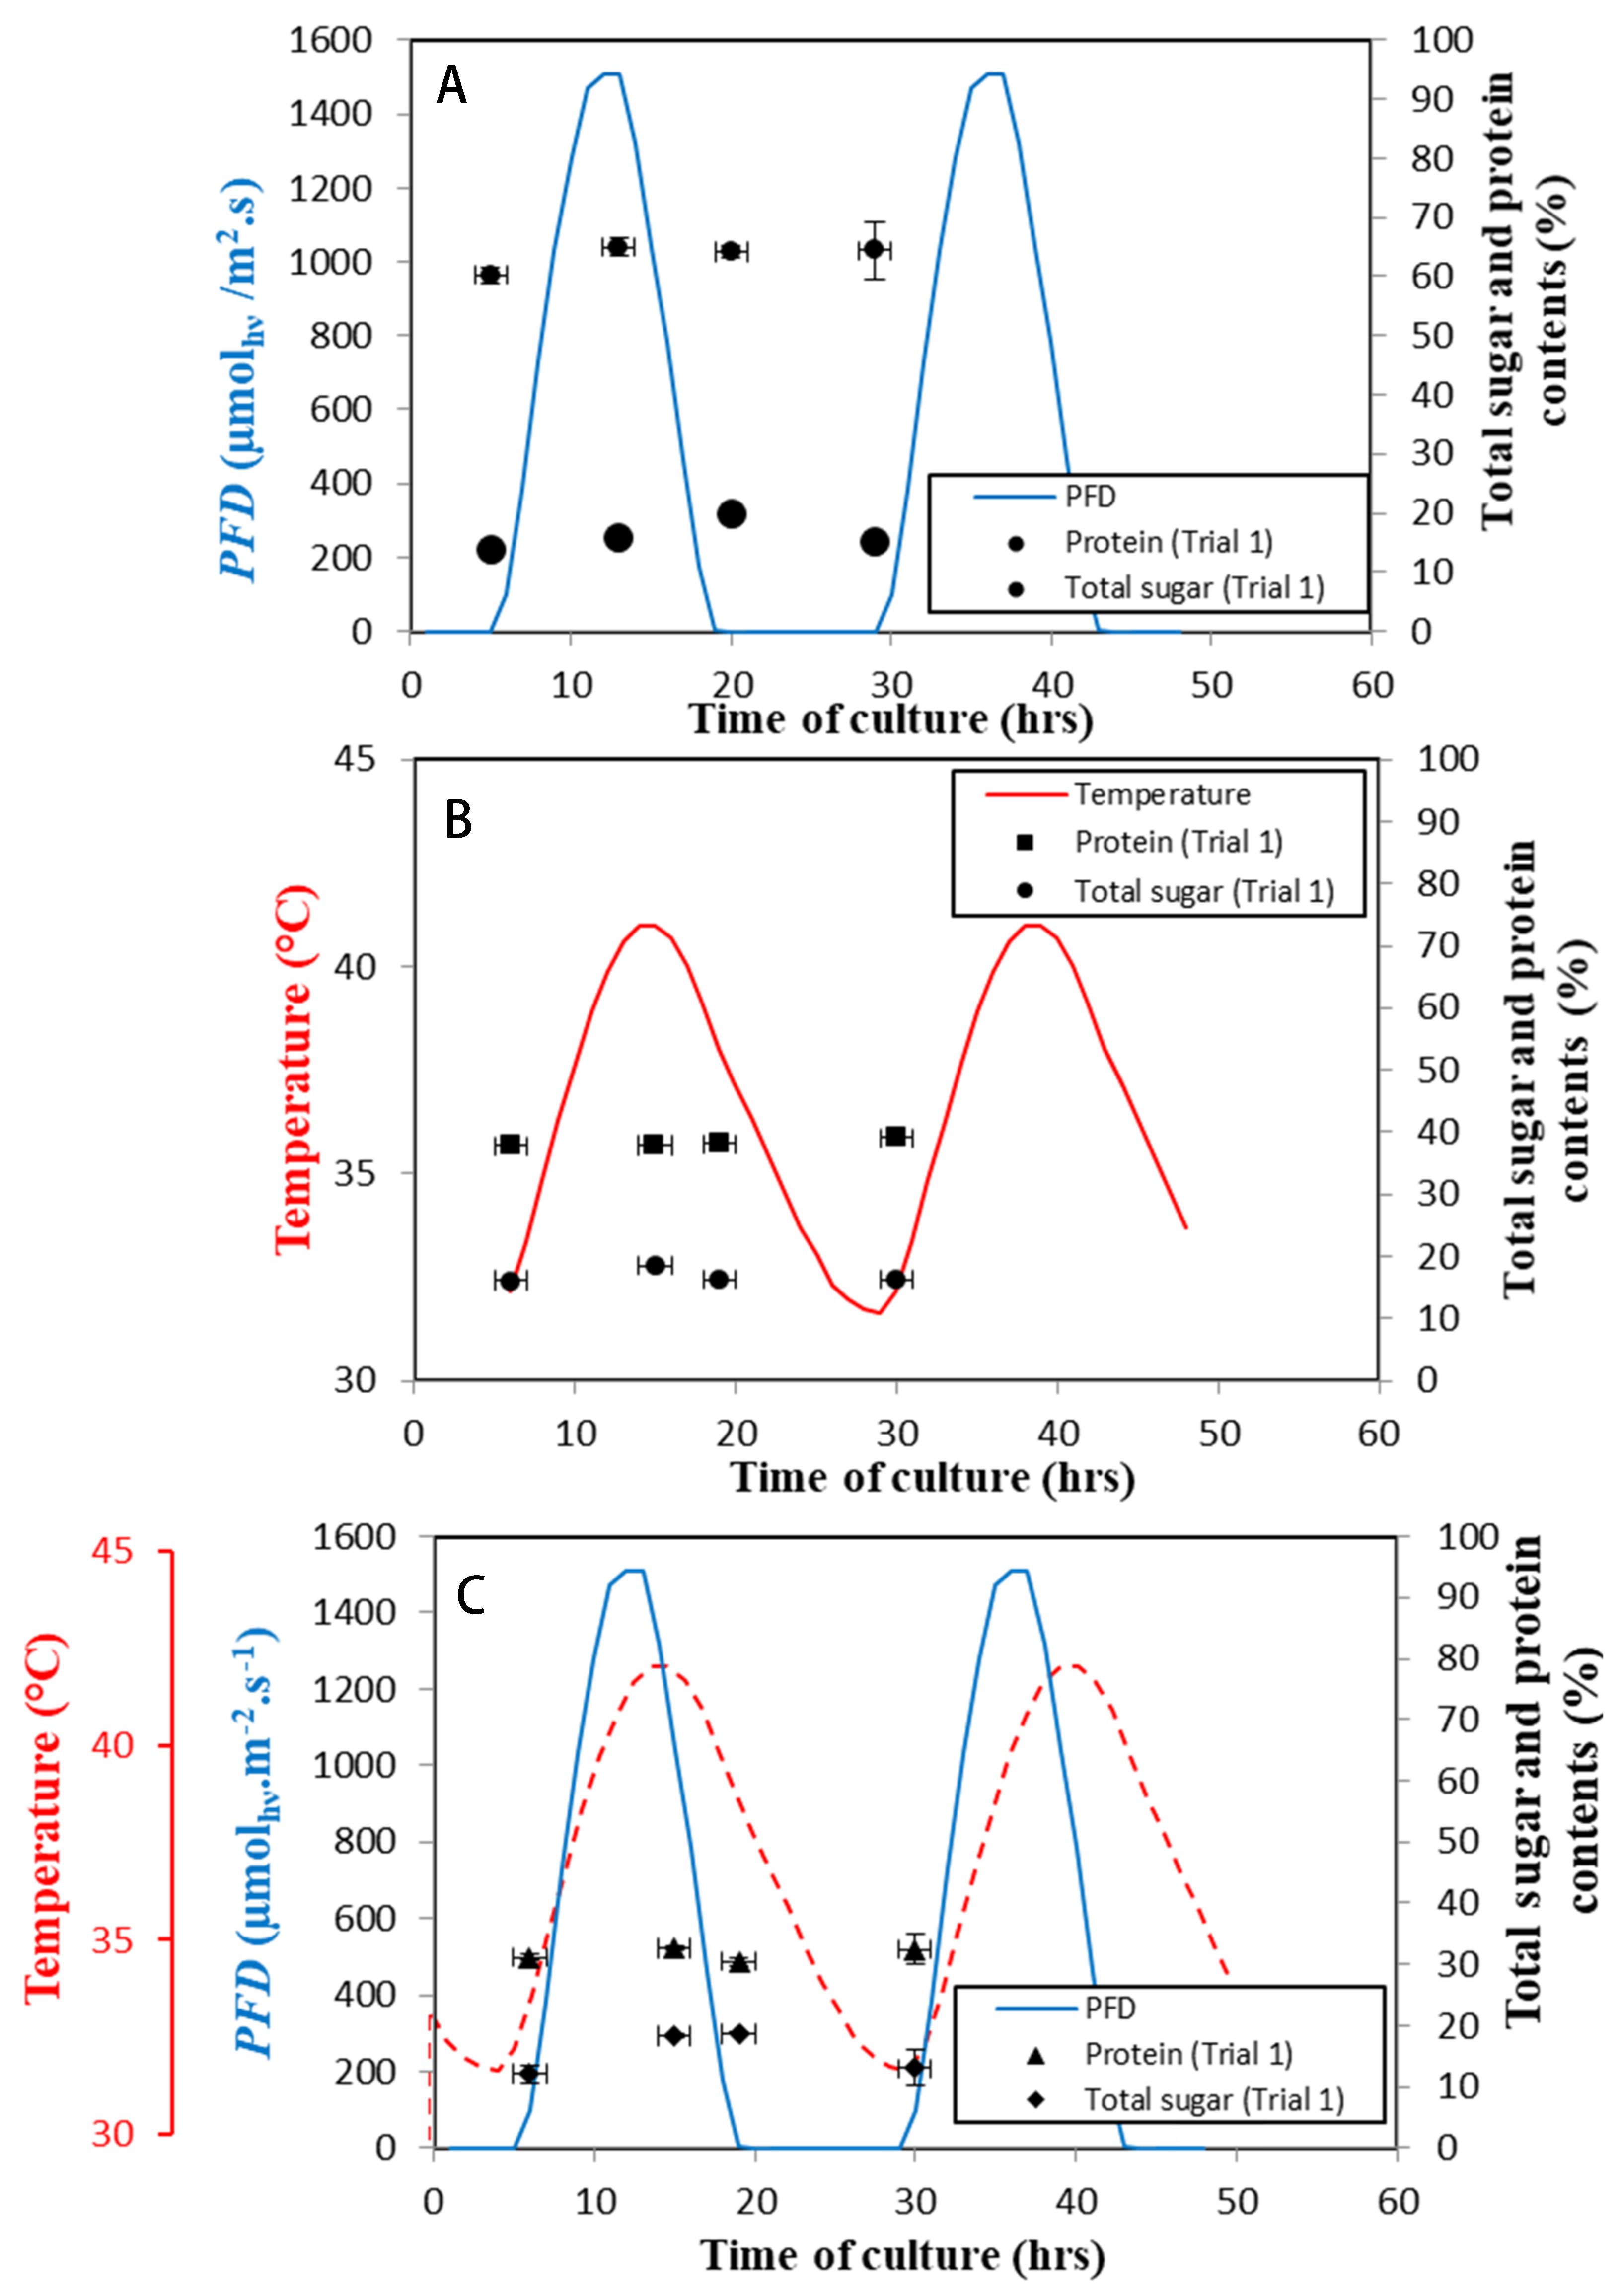
An assessment of the effects on the biochemical composition of the N. sp. QU130 (total sugar, protein and total lipids content) was carried out under the four different cultivation conditions (Figure 8) and at four different times during each cycle (Figure 9).
In constant light and temperature conditions, the culture accumulated 30%, 10%, and 60% DW of total sugar, lipid, and protein content respectively. Conversely, a decrease in sugar content to approximately 20% DW was observed in the results obtained under day/night, temperature, and combined cycles, and a significant increase in total lipids to 20%, 40%, and 50% DW respectively. The explanation for these phenomena might be the accumulation of lipids as a resistance mechanism under varying temperature and light conditions [37]. However, the protein content was stable during the day/night cycle at 60% DW, but decreases to 40% and 30% DW were recorded for protein concentrations under the temperature fluctuation and combined cycles. This again emphasizes the marked effect of stressful conditions on cells physiology. According to our results, this could be mainly attributed to the effect of temperature here, which resulted in an increase in lipids with a parallel decrease in proteins.
In addition, total sugar, protein, and total lipids contents were analyzed for each cultivation regime over 24 h (Figure 9, lipids were not measured because the volume needed for analysis was too great). The results from day/night cycles did not reveal any significant change in either total sugar or protein concentration with increasing light intensity (Figure 9A), although these findings are clearly contrary to the trend described and confirmed by several researchers—that increasing light intensity is always associated with a decrease in protein content and an increase in the lipid fraction and polysaccharides [38,39,40]. Additionally, an assessment of the biochemical composition evolution under the temperature cycle also revealed stability in the sugar and protein concentrations under temperature fluctuation stress (Figure 9B). On the other hand, a different observation was recorded under combined light and temperature cycles (Figure 9C). The results showed that total sugar concentration increased up to 60% at midday, when PFD and T were at high levels, but decreased again by the same percentage at night. This decrease in carbohydrate concentration occurs when microalgae cells convert carbohydrates into lipids when it is dark [41], and can also be explained by the fact that sugar is consumed for respiration in the absence of light [42].

4. Conclusions

Qatar is an arid country with almost the highest irradiation conditions in the world. Qatar country mainly presents two seasons: long and extreme summer from March to the end of October, and moderate winter. Being able to cultivate microalgae in summer conditions is therefore important to exploit microalgae as a feedstock of interest in such a location.
Conditions representing a culture in the summer period in the Qatar desert resulted in stressful conditions for the growth of N. sp. QU130, as indicated by a decrease in growth rate combined with a simultaneous increase in lipids content. However, the desert strain N. sp. QU130 revealed to acclimate to all the harsh light and temperature variation conditions tested in this study. Even when acclimated to constant light and temperature conditions, the strain survived all the sudden changes imposed.
The set-up for the experiment enabled dissociation of the respective effects of temperature and light regimes:
-
Light cycles with constant temperature demonstrated a sharp 50% decrease in biomass concentration when compared to steady-state culture at constant continuous light and temperature (1.9 kg.m−3 to 0.96 kg.m−3), following an acclimation time of around 5 days. This resulted in a biomass productivity of 0.67 kg.m−3.day−1 (i.e., 20.1 g.m−2.day−1), compared to constant light and optimal temperature, which resulted in a maximal volumetric biomass productivity of 1.1 kg.m−3d−1 (i.e., 32 g.m−2.d−1).
-
When temperature cycle stress was applied to the steady-state culture under constant light and temperature, a 15% decrease in biomass concentration was first observed (1.75 kg.m−3 to 1.5 kg.m−3), followed by a quick recovery of algae growth indicating rapid acclimation to temperature, leading to a biomass concentration 50% higher than under optimal constant conditions (2.3 kg.m−3). This surprising result can be explained by the N. sp. QU130 strain adapting to the harsh environmental conditions of the Qatar desert from where the strain was isolated [17,18]. In terms of benefits, it also highlights the potentially transitory effect of high temperature on growth. Exposure for a few hours revealed that it benefited the growth rate, with biomass productivity higher than under constant conditions. Consequently, the temperature cycle with constant light recorded the highest volumetric biomass productivity, with a rate of 1.10 kg.m−3 day−1 (i.e., 33 g.m−2.day−1).
-
Under conditions representing summer in the Qatar desert, with combined light and temperature cycles, the clear ability of N. sp. QU130 to acclimate to these extreme conditions has been demonstrated. However, the effects of such stressful conditions are also emphasized. The sudden shift from constant conditions to temperature/light cycles requires an acclimation period of around 25 days, with a significant decrease in productivity for the first 2 weeks preceding a slight increase, achieving a stable regime once the culture is acclimated. This resulted in the lowest rate of volumetric biomass productivity of 0.62 kg.m−3.day−1 (i.e., 18.6 g.m−2.day−1).
Biomass composition and cell morphology were found to be strongly influenced by light-temperature regimes investigated in our study. A strong reorganization of N. sp. QU130 was observed in relation to constant conditions, with a marked increase in cell volume and lipid content and a simultaneous reduction in protein. As demonstrated elsewhere, when cultivated in day-night cycles, the cells accumulated biochemical compounds such as protein and sugars generated by the photosynthetic process [43], with a simultaneous increase in cell size. In periods of darkness (night time), a reduction in biomass concentration and cell size was recorded, as a result of cell division (i.e., increase in cell numbers) and the respiration process (i.e., catabolism of biomass, especially sugar content) in the absence of light [42]. Interestingly, the changing temperature regime was shown to directly influence cell size, which was found to be larger than under continuous conditions.
In terms of practical outcomes, although this study confirms the ability of N. sp. QU130 to grow in the harsh summer conditions of the Qatar desert (i.e., the longer season in Qatar), year-round production would clearly imply optimal growth in the winter period [44]. Our findings would also suggest that it is important to control these two factors to maximize the biomass productivity of N. sp. QU130. With constant illumination by artificial light, the application of temperature regimes could lead to an increase in productivity (15% for N. sp. QU130). In actual outdoor cultures, it would be very difficult to control the light intensity (PFD), especially in summer, and impossible considering the open raceways currently used for algae production in Qatar [15]. On the other hand, as detailed by Pruvost et al., it is unrealistic in practice to maintain a constant temperature in outdoor cultivation systems in harsh desert conditions, due to the excessive amount of energy required for thermal regulation [15].
In this respect, work focusing on reducing the range of temperature variation would be more feasible, so it is essential to characterize the effect of temperature fluctuation on algae growth. The biological response is certainly strain-dependent (as shown here for the desert-adapted strain N. sp. QU130), and metabolic reorganization is certainly supported by specific cellular responses to temperature stress. These responses should be further investigated, with our study being merely an initial step in this regard. An in-depth transcriptomic and metabolomic investigation should provide, for example, valuable information for a better understanding of cell response to temperature or light intensity variations.
At the process engineering level, optimization should certainly focus on reducing the temperature fluctuations in the culture system. In harsh conditions, such as the Qatar desert, it would be beneficial to develop a cultivation system adapted to the conditions and the requirements of the strain. For instance, an open system such as a semi-buried raceway providing natural cooling by water evaporation has proved efficient at reducing temperature build-up in the summer. The introduction of a ground heat exchanger in the culture volume, designed to exploit the constant year-round in-ground temperature (28 °C in Qatar), resulted in further improvement of the technology [15]. By serving either as a heating or cooling source, depending on the time of year and strain temperature requirements, this rather simple solution was found to be efficient at reducing overheating in summer, while providing a heat source (the ground) in winter which can increase the culture temperature, if needed, by around 7–8 °C.
Finally, combining a selection of strains adapted to harsh desert conditions (i.e., local strains such as N. sp. QU130), an adequate engineering of culture systems, such as open systems with ground exchangers, and a detailed understanding of the metabolic response of the strain to the various conditions encountered over a year’s operation (i.e., including winter period), as carried out at laboratory scale, mimicking outdoor conditions, would help identify a solution for using desert areas for optimized large-scale microalgae production.

Author Contributions

Conception and design of the work, J.P.; experimental campaign, A.T.; investigation: R.T., I.S., V.G.; analysis and interpretation of the data, H.A.J., A.T. and J.P.; drafting of the article, H.A.J.; critical revision of the article for important intellectual content, J.P.; final approval of the article, H.A.J., A.T. and J.P.; obtaining of funding: H.A.J. All authors have read and agreed to the published version of the manuscript.

Funding

This research was funded by University of Qatar and University of Nantes.

Data Availability Statement

Data are available under request. Please contact the corresponding author.

Acknowledgments

This work was supported by University of Nantes and University of Qatar.

Conflicts of Interest

Authors declare no conflict of intrests.

References

  1. Markou, G.; Nerantzis, E. Microalgae for high-value compounds and biofuels production: A review with focus on cultivation under stress conditions. Biotechnol. Adv. 2013, 31, 1532–1542. [Google Scholar] [CrossRef]
  2. Hu, Q. Environmental Effects on Cell Composition. In Handbook of Microalgal Culture; Wiley Online Library: New York, NY, USA, 2013; pp. 114–122. [Google Scholar] [CrossRef]
  3. Aleya, L.; Dauta, A.; Reynolds, C.S. Endogenous regulation of the growth-rate responses of a spring-dwelling strain of the freshwater alga, Chlorella minutissima, to light and temperature. Eur. J. Protistol. 2011, 47, 239–244. [Google Scholar] [CrossRef]
  4. Han, F.; Wang, W.; Li, Y.; Shen, G.; Wan, M.; Wang, J. Changes of biomass, lipid content and fatty acids composition under a light–dark cyclic culture of Chlorella pyrenoidosa in response to different temperature. Bioresour. Technol. 2013, 132, 182–189. [Google Scholar] [CrossRef] [PubMed]
  5. Ho, S.-H.; Chen, C.-Y.; Chang, J.-S. Effect of light intensity and nitrogen starvation on CO2 fixation and lipid/carbohydrate production of an indigenous microalga Scenedesmus obliquus CNW-N. Bioresour. Technol. 2012, 113, 244–252. [Google Scholar] [CrossRef]
  6. Tamburic, B.; Guruprasad, S.; Radford, D.T.; Szabó, M.; Lilley, R.M.; Larkum, A.W.D.; Franklin, J.B.; Kramer, D.M.; Blackburn, S.I.; Raven, J.A.; et al. The Effect of Diel Temperature and Light Cycles on the Growth of Nannochloropsis oculata in a Photobioreactor Matrix. PLoS ONE 2014, 9, e86047. [Google Scholar] [CrossRef] [PubMed] [Green Version]
  7. Ruangsomboon, S. Effect of light, nutrient, cultivation time and salinity on lipid production of newly isolated strain of the green microalga, Botryococcus braunii KMITL. Bioresour. Technol. 2012, 109, 261–265. [Google Scholar] [CrossRef]
  8. Klok, A.J.; Martens, D.E.; Wijffels, R.H.; Lamers, P.P. Simultaneous growth and neutral lipid accumulation in microalgae. Bioresour. Technol. 2013, 134, 233–243. [Google Scholar] [CrossRef]
  9. Schagerl, M.; Müller, B. Acclimation of chlorophyll a and carotenoid levels to different irradiances in four freshwater cyanobacteria. J. Plant Physiol. 2006, 163, 709–716. [Google Scholar] [CrossRef] [PubMed]
  10. Demeter, S.; Janda, T.; Kovács, L.; Mende, D.; Wiessner, W. Effects of in vivo CO2-depletion on electron transport and photoinhibition in the green algae, Chlamydobotrys stellata and Chlamydomonas reinhardtii. Biochim. Biophys. Acta BBA Bioenerg. 1995, 1229, 166–174. [Google Scholar] [CrossRef] [Green Version]
  11. Zhu, C.J.; Lee, Y.K.; Chao, T.M. Effects of temperature and growth phase on lipid and biochemical composition of Isochrysis galbana TK. Environ. Biol. Fishes 1997, 9, 451–457. [Google Scholar] [CrossRef]
  12. Agrawal, S.C. Factors controlling induction of reproduction in algae—Review: The text. Folia Microbiol. 2012, 57, 387–407. [Google Scholar] [CrossRef]
  13. Maxwell, D.P.; Falk, S.; Trick, C.G.; Huner, N. Growth at Low Temperature Mimics High-Light Acclimation in Chlorella vulgaris. Plant Physiol. 1994, 105, 535–543. [Google Scholar] [CrossRef] [PubMed]
  14. Sorokin, C.; Krauss, R.W. Effects of Temperature & Illuminance on Chlorella Growth Uncoupled from Cell Division. Plant Physiol. 1962, 37, 37–42. [Google Scholar] [CrossRef] [Green Version]
  15. Pruvost, J.; Goetz, V.; Artu, A.; Das, P.; Al Jabri, H. Thermal modeling and optimization of microalgal biomass production in the harsh desert conditions of State of Qatar. Algal Res. 2019, 38, 101381. [Google Scholar] [CrossRef]
  16. Pruvost, J.; Van Vooren, G.; Cogne, G.; Legrand, J. Investigation of biomass and lipids production with Neochloris oleoabundans in photobioreactor. Bioresour. Technol. 2009, 100, 5988–5995. [Google Scholar] [CrossRef] [Green Version]
  17. Saadaoui, I.; Al Emadi, M.; Bounnit, T.; Schipper, K.; Al Jabri, H. Cryopreservation of microalgae from desert environments of Qatar. Environ. Biol. Fishes 2015, 28, 2233–2240. [Google Scholar] [CrossRef]
  18. Saadaoui, I.; Al Ghazal, G.; Bounnit, T.; Al Khulaifi, F.; Al Jabri, H.; Potts, M. Evidence of thermo and halotolerant Nannochloris isolate suitable for biodiesel production in Qatar Culture Collection of Cyanobacteria and Microalgae. Algal Res. 2016, 14, 39–47. [Google Scholar] [CrossRef]
  19. Berges, J.A.; Franklin, D.J.; Harrison, P.J. Evolution of an Artificial Seawater Medium: Improvements In Enriched Seawater, Artificial Water over the Last Two Decades. J. Phycol. 2001, 37, 1138–1145. [Google Scholar] [CrossRef]
  20. Taleb, A.; Kandilian, R.; Touchard, R.; Montalescot, V.; Rinaldi, T.; Taha, S.; Takache, H.; Marchal, L.; Legrand, J.; Pruvost, J. Screening of freshwater and seawater microalgae strains in fully controlled photobioreactors for biodiesel production. Bioresour. Technol. 2016, 218, 480–490. [Google Scholar] [CrossRef] [PubMed] [Green Version]
  21. Porra, R.; Thompson, W.; Kriedemann, P. Determination of accurate extinction coefficients and simultaneous equations for assaying chlorophylls a and b extracted with four different solvents: Verification of the concentration of chlorophyll standards by atomic absorption spectroscopy. Biochim. Biophys. Acta BBA Bioenerg. 1989, 975, 384–394. [Google Scholar] [CrossRef]
  22. Folch, J.; Lees, M.; Sloane-Stanley, G.H. A simple method for the isolation and purification of total lipides from animal tissues. J. Biol. Chem. 1957, 226, 497–509. [Google Scholar] [CrossRef]
  23. Arora, N.; Patel, A.; Pruthi, P.A.; Pruthi, V. Synergistic dynamics of nitrogen and phosphorous influences lipid productivity in Chlorella minutissima for biodiesel production. Bioresour. Technol. 2016, 213, 79–87. [Google Scholar] [CrossRef]
  24. Bradford, M.M. A rapid and sensitive method for the quantitation of microgram quantities of protein utilizing the principle of protein-Dye binding. Anal. Biochem. 1976, 72, 248–254. [Google Scholar] [CrossRef]
  25. Dubois, M.Y.; Gilles, K.A.; Hamilton, J.K.; Rebers, P.A.; Smith, F.G. A Colorimetric Method for the Determination of Sugars. Nature 1951, 168, 167. [Google Scholar] [CrossRef] [PubMed]
  26. Wu, X.; Merchuk, J.C. A model integrating fluid dynamics in photosynthesis and photoinhibition processes. Chem. Eng. Sci. 2001, 56, 3527–3538. [Google Scholar] [CrossRef]
  27. Taleb, A.; Legrand, J.; Takache, H.; Taha, S.; Pruvost, J. Investigation of lipid production by nitrogen-starved Parachlorella kessleri under continuous illumination and day/night cycles for biodiesel application. Environ. Biol. Fishes 2017, 30, 761–772. [Google Scholar] [CrossRef]
  28. Singh, S.; Singh, P. Effect of temperature and light on the growth of algae species: A review. Renew. Sustain. Energy Rev. 2015, 50, 431–444. [Google Scholar] [CrossRef]
  29. Salvucci, M.E.; Crafts-Brandner, S.J. Inhibition of photosynthesis by heat stress: The activation state of Rubisco as a limiting factor in photosynthesis. Physiol. Plant. 2004, 120, 179–186. [Google Scholar] [CrossRef] [PubMed]
  30. Mathur, S.; Agrawal, D.; Jajoo, A. Photosynthesis: Response to high temperature stress. J. Photochem. Photobiol. B Biol. 2014, 137, 116–126. [Google Scholar] [CrossRef]
  31. Zhang, L.; Liu, J. Effects of heat stress on photosynthetic electron transport in a marine cyanobacterium Arthrospira sp. Environ. Biol. Fishes 2016, 28, 757–763. [Google Scholar] [CrossRef]
  32. Huertas, I.E.; Rouco, M.; López-Rodas, V.; Costas, E. Warming will affect phytoplankton differently: Evidence through a mechanistic approach. Proc. R. Soc. B Biol. Sci. 2011, 278, 3534–3543. [Google Scholar] [CrossRef] [Green Version]
  33. Rhee, G.-Y.; Gotham, I.J. The effect of environmental factors on phytoplankton growth: Temperature and the interactions of temperature with nutrient limitation. Limnol. Oceanogr. 1981, 26, 635–648. [Google Scholar] [CrossRef]
  34. Loera-Quezada, M.M.; Angeles, G.; Olguín, E.J. Effect of irradiance on the cell density, size and lipid accumulation of Neochloris oleoabundans. Rev. Latinoam. Biotecnol. Ambient. Algal 2011, 2, 8. [Google Scholar]
  35. Bišová, K.; Zachleder, V. Cell-cycle regulation in green algae dividing by multiple fission. J. Exp. Bot. 2014, 65, 2585–2602. [Google Scholar] [CrossRef]
  36. Masamoto, K.; Furukawa, K.-I. Accumulation of zeaxanthin in cells of the cyanobacterium, Synechococcus sp. Strain PCC 7942 grown under high irradiance. J. Plant Physiol. 1997, 151, 257–261. [Google Scholar] [CrossRef]
  37. Govender, T.; Ramanna, L.; Rawat, I.; Bux, F. BODIPY staining, an alternative to the Nile Red fluorescence method for the evaluation of intracellular lipids in microalgae. Bioresour. Technol. 2012, 114, 507–511. [Google Scholar] [CrossRef]
  38. Morris, I.; Glover, H.E.; Yentsch, C.S. Products of photosynthesis by marine phytoplankton: The effect of environmental factors on the relative rates of protein synthesis. Mar. Biol. 1974, 27, 1–9. [Google Scholar] [CrossRef]
  39. Cuhel, R.L.; Ortner, P.B.; Lean, D.R.S. Night synthesis of protein by algae. Limnol. Oceanogr. 1984, 29, 731–744. [Google Scholar] [CrossRef]
  40. Iqbal, M.; Zafar, S.I. Effects of photon flux density, CO2, aeration rate, and inoculum density on growth and extracellular polysaccharide production byPorphyridium cruentum. Folia Microbiol. 1993, 38, 509–514. [Google Scholar] [CrossRef]
  41. Smith, R.; Cavaletto, J.; Eadie, B.; Gardner, W. Growth and lipid composition of high Arctic ice algae during the spring bloom at Resolute, Northwest Territories, Canada. Mar. Ecol. Prog. Ser. 1993, 97, 19–29. [Google Scholar] [CrossRef]
  42. Raven, J.A.; Beardall, J. Carbohydrate metabolism and respiration in algae. In Photosynthesis in Algae; Springer: Berlin/Heidelberg, Germany, 2003; pp. 205–224. [Google Scholar]
  43. Granum, E.; Myklestad, S.M. A simple combined method for determination of β-1,3-glucan and cell wall polysaccharides in diatoms. Hydrobiology 2002, 477, 155–161. [Google Scholar] [CrossRef]
  44. Pruvost, J.; Cornet, J.; Le Borgne, F.; Goetz, V.; Legrand, J. Theoretical investigation of microalgae culture in the light changing conditions of solar photobioreactor production and comparison with cyanobacteria. Algal Res. 2015, 10, 87–99. [Google Scholar] [CrossRef] [Green Version]
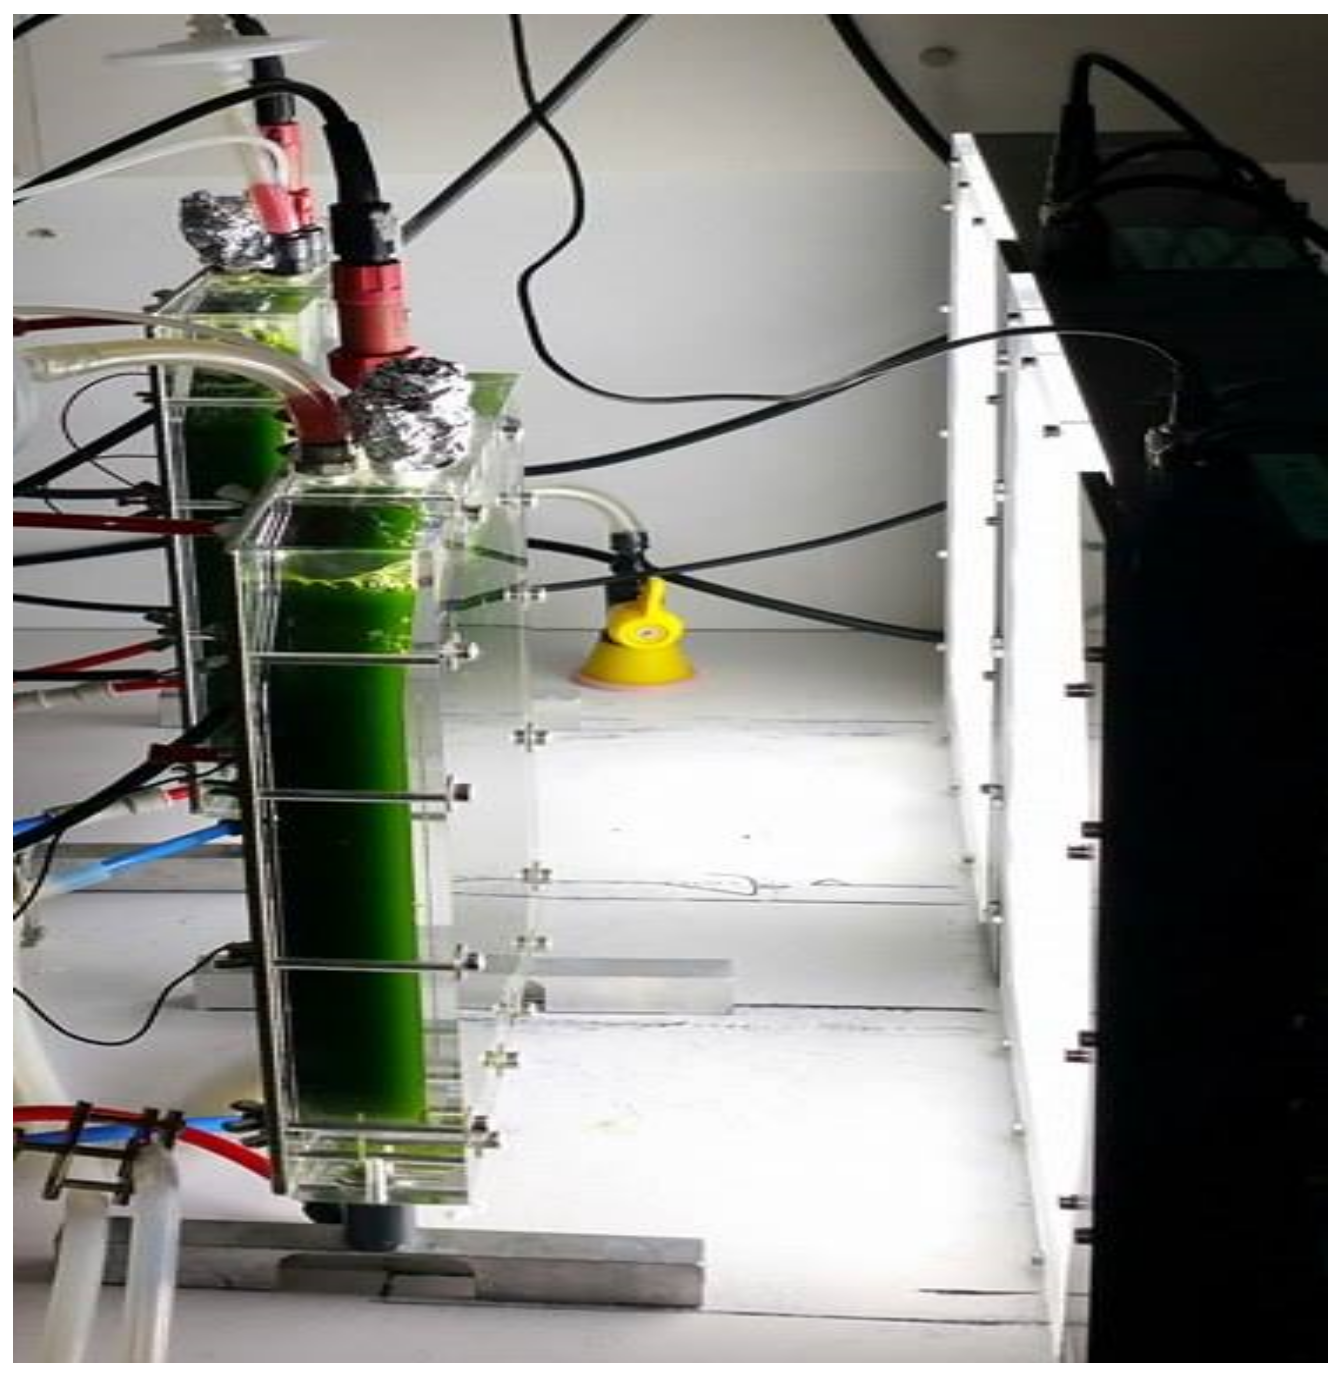
Figure 1. 1 L flat panel airlift type PBR with full control of culture conditions (i.e., constant or fluctuation regimes of light and/or temperature).
Applsci 11 03799 g001
Figure 2. Experimental design of the cultivation of the N. sp. QU130 under light and temperature fluctuation regimes. (Regime (A): constant light and temperature; Regime (B): Temperature cycles with constant light; Regime (C): Light cycle with constant temperature; Regime (D): Combined light and temperature cycles).
Applsci 11 03799 g002
Figure 3. Experimental design of the cultivation of the N. sp QU130 under light and temperature fluctuation regimes investigated over 24 h through taking four samples upon 3 different days.
Applsci 11 03799 g003
Figure 4. Time acclimation of N. sp. QU130 under three different cultivation cycles stresses, (A): Cultivation under day/night cycles (Experiment C); (B): Cultivation under temperature fluctuation (Experiment B) and (C): Cultivation under combined light and temperature cycles (Experiment D).
Applsci 11 03799 g004
Figure 5. Evolution of biomass concentration of N. sp. QU130 under three different cultivation regimes: (A): Cultivation under day/night cycles (Experiment C); (B): Cultivation under temperature fluctuation (Experiment B) and (C): Cultivation under combined light and temperature cultivation (Experiment D). Measurements taken in triplicates on 3 different days in the steady-state culture (only Trial 1 is shown in Figure 5c—similar results for other trials).
Applsci 11 03799 g005
Figure 6. Evolution of cells number under different cultivation regimes: (A): Light fluctuation (Regime C); (B): Temperature fluctuation (Regime B); (C): Light and temperature fluctuations (Regime D). Only Trial 1 is shown in Figure 6c—similar results for other trials.
Applsci 11 03799 g006
Figure 7. Evolution of the photosynthetic pigment contents of N. sp. QU130 under two different cultivation regimes tested: (A): Cultivation under temperature fluctuation cycles; (B): Cultivation under day/night cycles; (C): Cultivation under combined light and temperature cycles. The ratio of absorbance at 480 and 665 nm (noted A480/A665) represents the “stress factor”, which is proportional to the carotenoid and chlorophyll content (see text for further details).
Applsci 11 03799 g007
Figure 8. Total sugar, protein and total lipids contents of N. sp QU130 after the implementation of fluctuation stress of three different cultivation regimes: Cultivation under constant light and temperature, day/night cycles, temperature fluctuation and combined light and temperature cycles.
Applsci 11 03799 g008
Figure 9. Total sugar and protein contents of N. sp QU130 evolutions over 24 h under three different cultivation regimes: (A): Cultivation under day/night cycles; (B): Cultivation under temperature fluctuation and (C): Cultivation under combined light and temperature cultivation. Results are given for trial 1 (similar results for other trials).
Applsci 11 03799 g009
Table 1. Variation of N. sp. QU130 cell diameter (in µm) over the day and under different cultivation regimes: Regime B: Temperature fluctuation; Regime C: Light fluctuation; Regime D: Light and temperature fluctuation.
DawnMiddayDuskEnd of the Day
Regime B2.5 ± 0.063.13 ± 0.062.7 ± 0.12.4 ± 0.1
Regime C2.31 ± 0.032.7 ± 0.182.68 ± 0.092 ± 0.04
Regime D2.57 ± 0.062.8 ± 0.062.99 ± 0.06
Publisher’s Note: MDPI stays neutral with regard to jurisdictional claims in published maps and institutional affiliations.