Article

Production of Microalgal Biomass in Photobioreactors as Feedstock for Bioenergy and Other Uses: A Techno-Economic Study of Harvesting Stage

by
Esveidi Montserrat Valdovinos-García
1,
Moisés Abraham Petriz-Prieto
1,
María de los Ángeles Olán-Acosta
2,
Juan Barajas-Fernández
2,
Adriana Guzmán-López
3 and
Micael Gerardo Bravo-Sánchez
4,*
1
División Académica Multidisciplinaria de Jalpa de Méndez (DAMJM), Universidad Juárez Autónoma de Tabasco (UJAT), Carretera Estatal Libre Villahermosa-Comalcalco Km. 27+000 s/n Ranchería Ribera Alta, Jalpa de Méndez C.P. 86205, Tabasco, Mexico
2
División Académica de Ingeniería y Arquitectura (DAIA), Universidad Juárez Autónoma de Tabasco (UJAT), Carretera Cunduacán-Jalpa de Méndez Km. 1 Col. La Esmeralda, Cunduacán C.P. 86690, Tabasco, Mexico
3
Departamento de Ingeniería Química, Tecnológico Nacional de México en Celaya, Apartado Postal 57, Celaya C.P. 38010, Guanajuato, Mexico
4
Departamento de Ingeniería Bioquímica, Tecnológico Nacional de México en Celaya, Apartado Postal 57, Celaya C.P. 38010, Guanajuato, Mexico
*
Author to whom correspondence should be addressed.
Appl. Sci. 2021, 11(10), 4386; https://doi.org/10.3390/app11104386
Submission received: 20 March 2021 / Revised: 4 May 2021 / Accepted: 7 May 2021 / Published: 12 May 2021
(This article belongs to the Special Issue Advances in Microalgal Biomass Productions)

Abstract

:
The cultivation of microalgae has become a viable option to mitigate increase in CO2 in the atmosphere generated by industrial activities since they can capture CO2 as a carbon source for growth. Besides, they produce significant amounts of oils, carbohydrates, proteins, and other compounds of economic interest. There are several investigations related to the process, however, there is still no optimal scenario, since may depend on the final use of the biomass. The objective of this work was to develop a techno-economic evaluation of various technologies in harvesting and drying stages. The techno-economic estimation of these technologies provides a variety of production scenarios. Photobioreactors were used considering 1 ha as a cultivation area and a biomass production of 22.66 g/m2/day and a CO2 capture of 148.4 tons/ha/year was estimated. The production scenarios considered in this study have high energy demand and high operating costs (12.09–12.51 kWh/kg and US $210.05–214.59/kg). These results are mainly a consequence of the use of tubular photobioreactors as a biomass culture system. However, the use of photobioreactors in the production of microalgal biomass allows it to be obtained in optimal conditions for its use in the food or pharmaceutical industry.

1. Introduction

Microalgae biomass production has received great interest in recent decades, partially due to its great capacity to capture CO2 compared to terrestrial crops [1]. In addition, microalgae biomass can provide a wide variety of organic compounds of commercial interest (i.e., polysaccharides, biopeptides, biopolymers, antioxidants and pigments), and also, being rich in carbohydrates and oils, it provides the ability to produce bioenergetics (biomethane, biohydrogen, biodiesel, and bioethanol) [2,3]. Furthermore, the microalgal biomass can be used as food and animal feed because of its high protein content [4]. The microalgae can be grown using various water resources, including freshwater, seawater, and even industrial or domestic wastewater [5]. Biomass derived from microalgae has significant advantages over biomass derived from other sources [6,7]. One of the advantages of microalgae cultivation is that it does not require arable or forested land for its production [8,9]. They also have high growth rates, can double their biomass in periods as short as 3.5 h, and can be produced in continuous processes in contrast to other sources of biomass production [6,10].
Despite the wide application of microalgae, there are many challenges in the de-velopment of technology for the use of biomass, among them the following stand out: (1) the selection of the microalgae species must have as essential requirements the maximum production of lipids, the type of lipids with potential for the production of bioenergetics and the co-products of interest that could be extracted; (2) achieve higher photosynthetic efficiencies through continuous development of production systems; (3) minimize evaporation and CO2 losses due to limited diffusion in open crops; (4) negative energy balance after taking into account the requirements of water pumping, CO2 transfer, harvest, and oil extraction; (5) a lack of data for large-scale plant because few commercial plants are in operation; (6) incorporation of unsuitable combustion gases due to the presence of toxic compounds in high concentrations such as NOx and SOx [11]. Even with the challenges posed by the production of microalgal biomass, the expected increase in the world population will cause a growing demand for natural resources, which favors the production of bioenergetics from sources that do not generate an overpressure of these resources [7,11]. Some research groups have focused on the investigation of microalgae species genetically modified to improve biomass production and lipid content. In addition to this, these investigations seek the generation of co-products of high economic value that improves the economic profitability of the process [12,13].
Microalgae have a great capacity to capture CO2, which can come from the atmosphere or directly from combustion gas emissions. They can capture CO2 up to 1.7–1.8 times their weight (dry basis) due to their high photosynthetic capacity [14,15,16]. There is a growing interest in analyzing the biomass production of microalgae using CO2 from the flue gases of thermoelectric plants as a carbon source [14,17,18,19,20]. It has been reported that even integrating CO2 emissions, biomass production is still not economically viable, therefore it is believed that including wastewater bioremediation (as a source of nutrients) and co-production of biofuels and microalgae bioproducts (a biorefinery concept) will achieve a promising approach improving the economics of the overall process [12,21,22].
Intracellular compounds and metabolites of microalgae have gained immense importance due to their high monetary value. For example, microalgae pigments like chlorophyll a, chlorophyll b, lutein, astaxanthin, β-carotene, phycobilins, C-phycocyanin have found wide application in food, feed additives, cosmetics, nutraceuticals, and pharmaceuticals agents. Other compounds of interest are amino acids (leucine, asparagine, glutamine, cysteine, arginine, aspartate, alanine, glycine, lysine, and valine), carbohydrates (β1–3-glucan, amylose, starch, cellulose, and alginates), and vitamins and minerals (vitamin B1, B2, B6, B12, C, E, biotin, folic acid, magnesium, calcium, phosphate, iodine) that are widely used in food additives, health supplements and medicine [23].
The production of biomass from microalgae requires several stages: cultivation, harvesting, and drying. The cultivation stage generates most of the process costs due to its high energy demand caused by the need to maintain a stable medium (temperature, pH, low O2 concentration) and provide the necessary nutrients for growth including light [24]. Culture systems can be classified as open and closed. Open systems can be circular or raceway pond. Open pond systems are mainly used on an industrial scale, due to their lower cost of operation and easy construction [25]. However, water losses due to evaporation cause limited control over light conditions, temperature and CO2 diffusion, directly affecting biomass production resulting in low yield [11,26]. Biomass can be easily contaminated by external agents, limiting its application and preventing its use to obtain high-value products for the pharmaceutical and cosmetic industry [10,12].
On the other hand, closed microalgae culture systems such as photobioreactors (PBRs) have several advantages over open culture systems. Some of the advantages of PBRs are a better control of the cultivation conditions, to obtain a biomass with homogeneous characteristics, and to minimize contamination by other microorganisms that can affect the quality of the biomass [11,16,27].
PBRs allow greater control in growing conditions than in open systems, and, consequently, a higher biomass production per growing area is achieved, as well as greater CO2 and nutrient absorption efficiency [28,29]. Unlike production in open ponds, PBRs allow the cultivation of a single species of microalgae for prolonged periods with less risk of contamination increasing the potential of use for biomass [16,27]. In terms of operating costs, PBRs are more expensive than open culture systems. This is mainly due to the energy consumption necessary to maintain the operating conditions of the PBRs such as pumping the culture medium, supplying the adequate concentration of CO2 (carbon source) to carry out the photosynthetic process and removing the excess O2 produced. As an alternative to reduce this consumption, the use of renewable energies could be implemented. Another advantage of PBRs technology over open cultivation systems is the requirement of a smaller cultivation area to obtain a higher biomass production and a better control of the operating conditions to produce biomass with homogeneous characteristics [27]. The biomass obtained in the PBRs has homogeneous characteristics, and can serve as feed to biorefinery processes, reducing fluctuations in the process while preserving the quality of the final products. Besides, PBRs can guarantee the characteristics of the by-products generated by microalgae which can improve economic profitability.
The selection of the cultivation system depends on the quality of final products [30]. For example, if a high-quality product with few contaminants is required, closed cultures should be selected, while if an open system is chosen, a microalgae strain capable of inhibiting the growth of other contaminating species in the culture system must be selected to guarantee a high biomass production. Natural climatic conditions and the cost of land availability also play an important role in determining the cropping system [10].
After cultivation, microalgal biomass must be collected. Several methods can be applied at this stage. However, the application of some of them depends on the characteristics of microalgae such as size, cell density, the final product to be obtained, and whether the culture medium is to be reused [8]. Currently, existing harvesting methods include mechanical, chemical, biological, and electrical techniques [8]. Harvesting by flocculation or flotation is more economical and suitable for biomass production where high quality is not required for its use. Meanwhile if a higher quality is required in the biomass, the use of centrifugation is recommended, since no chemicals are added for its collection. On the other hand, this technology has a high energy consumption which increases operating costs [29]. It has been reported that carrying out the harvest in two stages increases the efficiency in the collection of biomass [31]. Additionally, the costs associated with the production process and energy consumption are reduced. The first stage consists of enriching the culture medium through flocculation, flotation, gravity sedimentation, electro-flocculation, or ultrasound, and as a second stage, centrifugation or filtration is carried out and with this, the concentration is increased [31,32]. The costs associated with harvesting the biomass are considerable. It has been reported that the cost of this stage is around 20–30% of the total cost in the production of biodiesel from microalgae [33]. However, these costs depend on the technologies used. At the same time, the selection of technologies depends in most cases on the final destination that the microalgal biomass will have if it will be used for the production of biofuels, obtaining pigments, natural sweeteners, phytochemicals, among others.
The harvest stage concentrates the microalgae biomass up to 15–25%, having a large amount of moisture, which would cause an accelerated decomposition of the biomass if it had to be stored for later processing [8]. To avoid its decomposition and so that it can be stored, the biomass must be dried. Drying achieves to concentrate biomass up to 85% to 95% in dry solids [34,35]. Several drying techniques exist such as solar drying, spray, convection, and freeze-drying; however, the use of these techniques also depends on the final use of the biomass and some of them still have limitations to be used on a large scale.
A large amount of research has been carried out related to proposal and evaluation of processes to produce microalgae biomass. Some are proposals on a laboratory scale and do not carry out a techno-economic evaluation. Others do have objective of technically and economically evaluating a particular processing scenario, but only include specific technologies [17,36,37,38]. This has generated different process routes, under different conditions, which complicates their comparison. Few investigations consider comparison of several technologies for their evaluation in same study and that generate different process scenarios.
Musa et al. [39] carried out a techno-economic evaluation of two cases of biomass production, where they consider two systems for dewatering. The first case was a conventional clarifier-centrifuge dewatering system, while the second case investigated a single stage dewatering approach, using the wet-end of a paper machine (Fourdrinier former). They determine that the minimum selling cost of the moisture biomass obtained is AU $354.28/ton for the conventional production case and for the second case their minimum selling cost is AU $59.68/ton. Both cases considered the feeding of biomass grown in the open raceway pond, however, they did not consider the cultivation stage in their economic evaluation, but only the technologies for harvesting the biomass.
Deconinck et al. [40] conducted a patent review of technologies applicable to the harvesting of microalgae biomass, based on technological, economic and environmental criteria. The research focused mainly on the technological feasibility of various separation processes. In this research, 13 primary collection methods and eight secondary collection methods were reviewed, focusing on technological, economic and environmental criteria. They mention that the different economic and environmental criteria that were used to compare the collection technologies are generally not specified or described in the patents analyzed. Economic and environmental benefits are only occasionally mentioned in patent applications, but are generally not discussed in detail. Therefore, it is difficult to compare the technological potential of a patented system based on the criteria defined in the scientific literature. Finally, according to the literature review, they conclude that auto-flocculation and co-flocculation, as well as sedimentation, generally obtained the best score in the economic and environmental criteria, while the belt filters obtained the highest score in the technological criteria, however, they do not mention what the costs of harvesting biomass are.
Fasaei et al. [41] performed a quantitative techno-economic analysis of different large-scale harvesting and dewatering systems with a focus on processing cost, energy consumption, and resource recovery. The economic evaluation shows that operating costs and energy consumption are in the range of €0.5–2/kg of algae and 0.2–5 kWh/kg of algae, respectively, for dilute solutions from open culture systems. Harvesting and dewatering of flocculated dilute systems results in the least energy requirement. However, due to the chemicals required and the loss of flocculants, these systems end up at the same cost level as mechanical harvesting systems. For closed culture systems, operating costs decrease to €0.1–0.6/kg algae and energy consumption to 0.1–0.7 kWh/kg algae. They also determine that if the amount of biomass fed to the harvest stage is increased, it is possible to reduce production costs considerably.
Weschler et al. [42] analyzed several process scenarios for production of microalgae biomass derived by combining two cultivation technologies and 11 harvesting technologies with and without the use of drying. The results of their study present the total energy demand for the production of algal biomass for the different cases considered. Energy requirements were shown to be highly dependent on final mass concentration, with thermal drying being the largest energy consumer. Their results show that the energy consumption for the biomass production routes that consider the cultivation in PBR and obtain dry biomass range from 4500 kWh/1000 kg of biomass produced up to 8200 kWh/1000 kg of biomass, approximately. They conclude that the scenarios that used open ponds for cultivation, followed by sedimentation and filtration through membranes, were the most efficient from the energy point of view.
Some authors evaluate specific scenarios for the production of microalgae biomass. Jorquera et al. [43] report biomass production costs of US $9540/ton of biomass if it is grown in tubular PBR and US $419/ton of biomass if it is grown in Flat plate. Norsker et al. [24] report wet biomass production costs of €4.15/kg if the cultivation in PBR is considered and €5.96/kg if the biomass cultivation is carried out in Flat plate. The different production and economic criteria used in similar studies make it difficult to compare the various production scenarios. In addition, many investigations do not mention if the production scenarios analyzed can be adapted to more than one microalgae strain or what will be the use of the biomass produced.
The comparison and evaluation of various technologies involved in different stages of the process provides a great variety of scenarios, showing techno-economic potential of microalgae production. Each scenario could have different purposes, since in most cases the technology used depends on final utilization of biomass. A study with these characteristics would allow us to analyze and compare various technological options for obtaining microalgae biomass that can have various purposes of use, depending on technological scenario. The objective of this work has been proposed to evaluate different biomass production scenarios, including a combination of various technologies for harvesting and drying microalgal biomass from a culture in a tubular photobioreactor (to obtain a biomass of higher quality), which considers the capture of CO2 from a thermoelectric plant. Regarding the technologies considered in the harvest and drying stage, those technologies with industrial application were considered, discarding those that, although they are novel, have not been tested at the pilot plant level or that have not yet been scaled up. Techno-economic assessment is often used as a basic tool to analyze the feasibility of processing alternatives and, in this way, generate production pathways that focus on research and development efforts to achieve commercial viability [28,44]. In our work, the commercial bioprocess simulator SuperPro Designer v10® was used as a computing tool to perform mass and energy balances, and a technical evaluation considering energy consumption and production cost of various process scenarios formed. The use of process simulators within the field of chemical engineering is of great importance, because it minimizes the human effort to solve complex calculations that are normally associated with an engineering process. They also allow the comparison of process alternatives on a consistent basis, so that a large number of process ideas can be synthesized and analyzed interactively in a short period of time; they also facilitate the study of the interactions that exist between the processes in the input and output streams [45]. For this reason, the simulation of several processes in series facilitates decision-making, since the data provided by the software allow a logical analysis of the process.

2. Materials and Methods

The study was divided into two phases; the first one consisted of an exhaustive search in the literature and collection of information on the parameters and operating conditions of the technologies, used in the different stages of the process for obtaining microalgal biomass. Those literature sources that reported experimental data (or pilot scale) of the use of technologies for the production of biomass of the Chlorella sp. were considered. The technologies were chosen based on their potential use on a pilot scale and those that, even though they are novel, are still in the laboratory-scale research or development phase, were discarded. In the second phase, the simulation of the technologies was carried out in the SuperPro Designer v10® software, considering the technical data collected from the literature, in order to get precise estimates regarding the mass and energy balances, as well as the economy of process. The assumptions required for the techno-economic analysis in the stages involved in the process are described below.

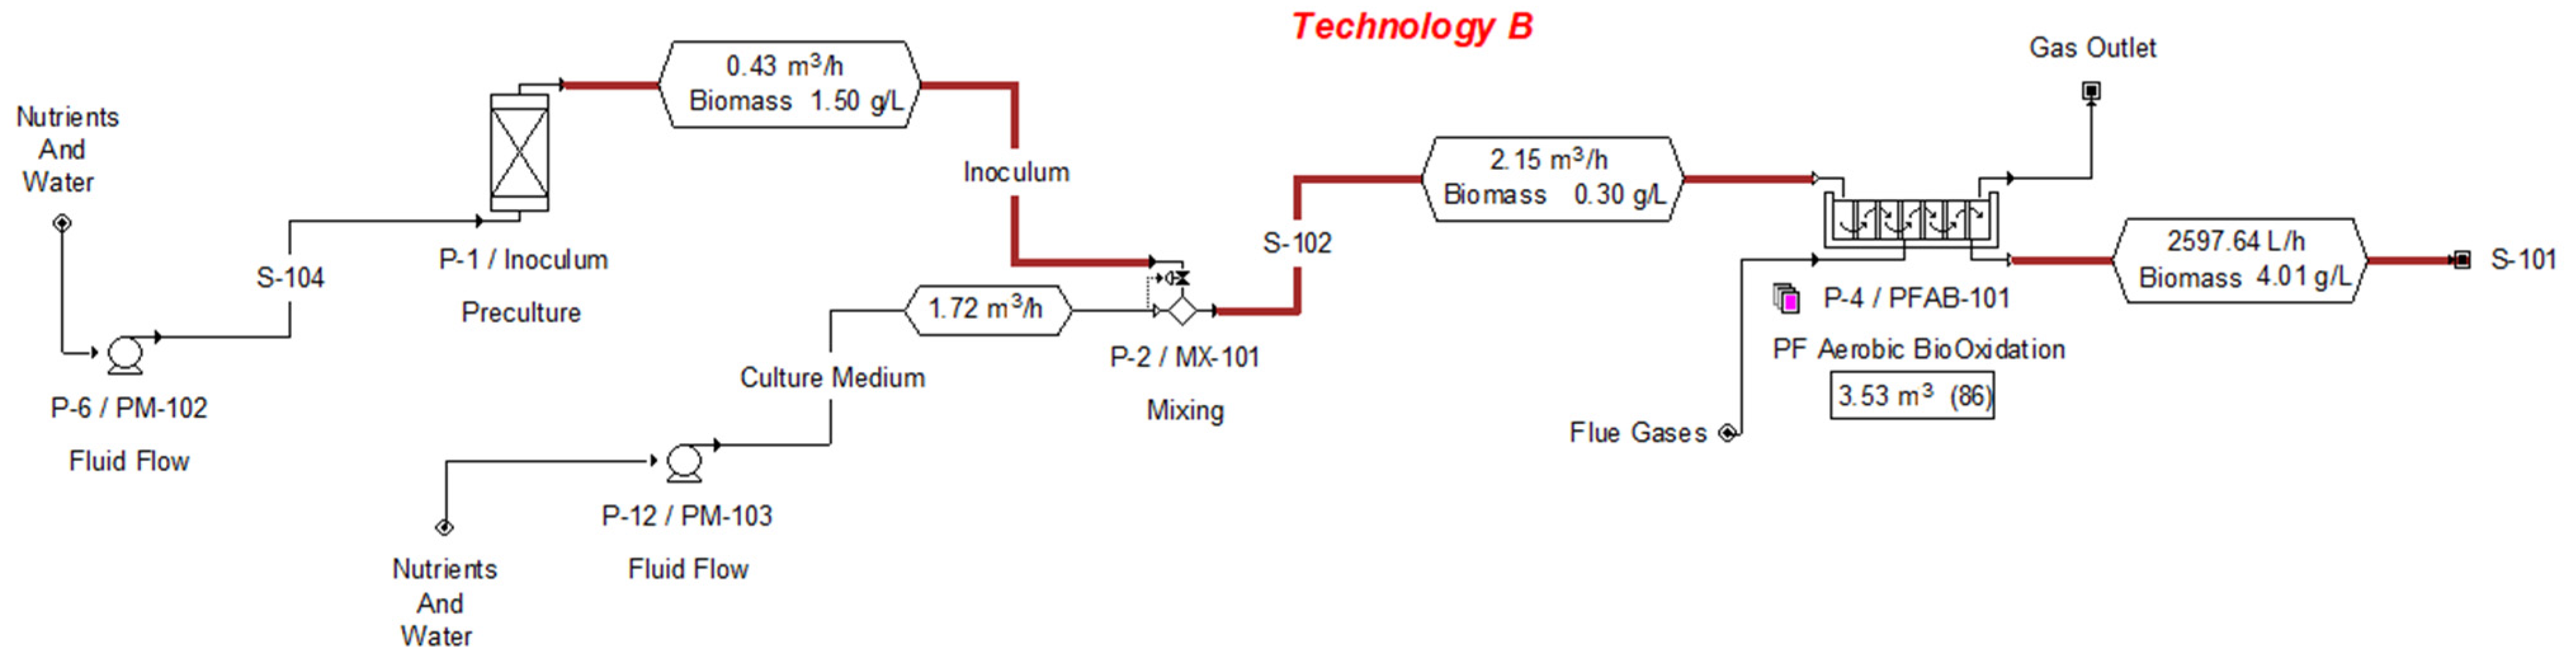
2.1. Data Collection for the Design of the Cultivation Stage

Photoautotrophic culture was selected for this study, where carbon source for biomass cultivation is CO2, which is considered to come from flue gases from a thermoelectric plant, with a typical composition of 10–12% v/v CO2 [46]. A thermoelectric plant is a power plant that generates electricity from fossil fuels as primary energy and generally does not have a CO2 capture and storage system. Conventional thermoelectric plants can use a wide variety of fuels, including coal, natural gas and petroleum derivatives such as diesel and fuel oil, which is characterized by its high level of polluting emissions. There is a great variety of microalgae species capable of being cultivated with CO2 as a carbon source. However, not all species have the same capacity to capture it or tolerate it in such high concentrations. In this study, the Chlorella sp. was selected, due to its great capacity to tolerate high concentrations of CO2 during its cultivation, the great variety of products that can be obtained and the large amount of information reported for this species [30]. A capture of up to 60% w/w of the CO2 feed is considered and 1.83 kg de CO2 can be fixed by kg of dry biomass, as reported by Duarte et al. [46] and Chisti et al. [16]. Although a great capacity of the Chlorella species to capture NOx and SOx has been reported, in this study it is not considered for mass balances.
As a design basis, 1 ha was considered as the cultivation area. The culture is carried out in tubular photobioreactors with a productivity of 22.66 g/m2/day. In the case of photobioreactors operated in continuous mode, production rates are around 15 to 45 g/m2/day [47]. Therefore, the assumed value could be considered an average value, since it must be considered that environmental conditions vary during the year. For the cultivation of microorganisms, the feeding of an inoculum is required. In this case, the inoculum is produced in a tubular photo-bioreactor with a concentration of 1.5 g/L of biomass, this is mixed with the nutrients and fresh water to later be fed to the tubular photobioreactor. The culture in the photobioreactor has a retention time of 5 days, achieving a concentration of 4 g/L of microalgal biomass. The operating conditions for the cultivation were taken from the experimental data reported by Kuo et al. [48]. An energy consumption of 1.5 kWh/m3 was considered for the tubular photobioreactor culture system, according to what was reported by Acién et al. [47].

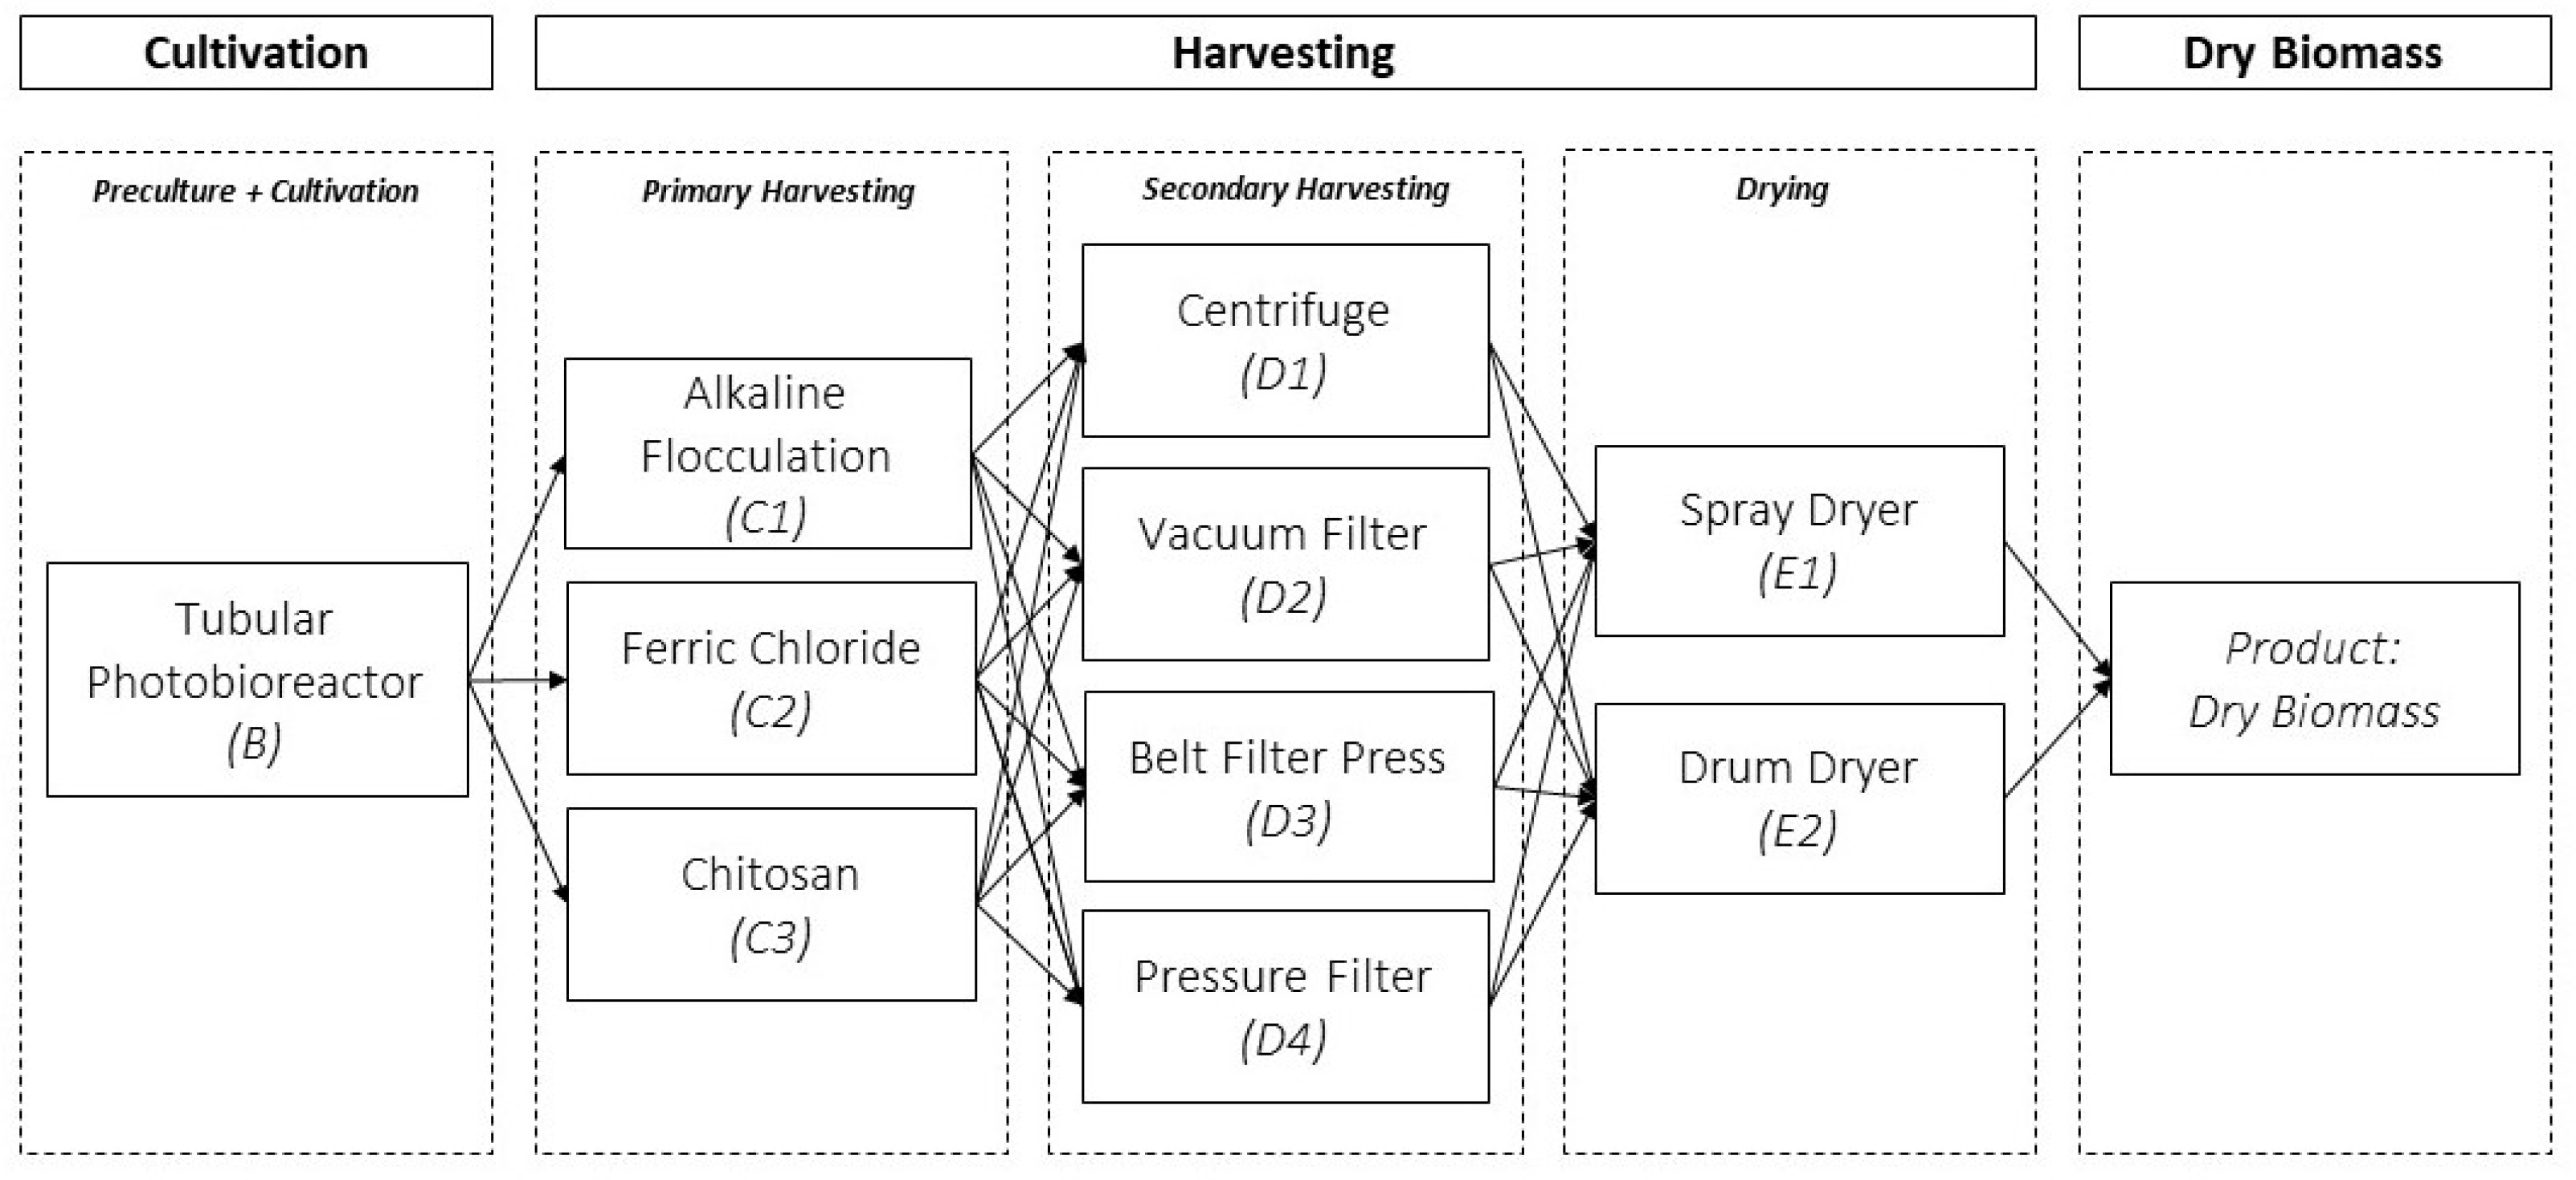
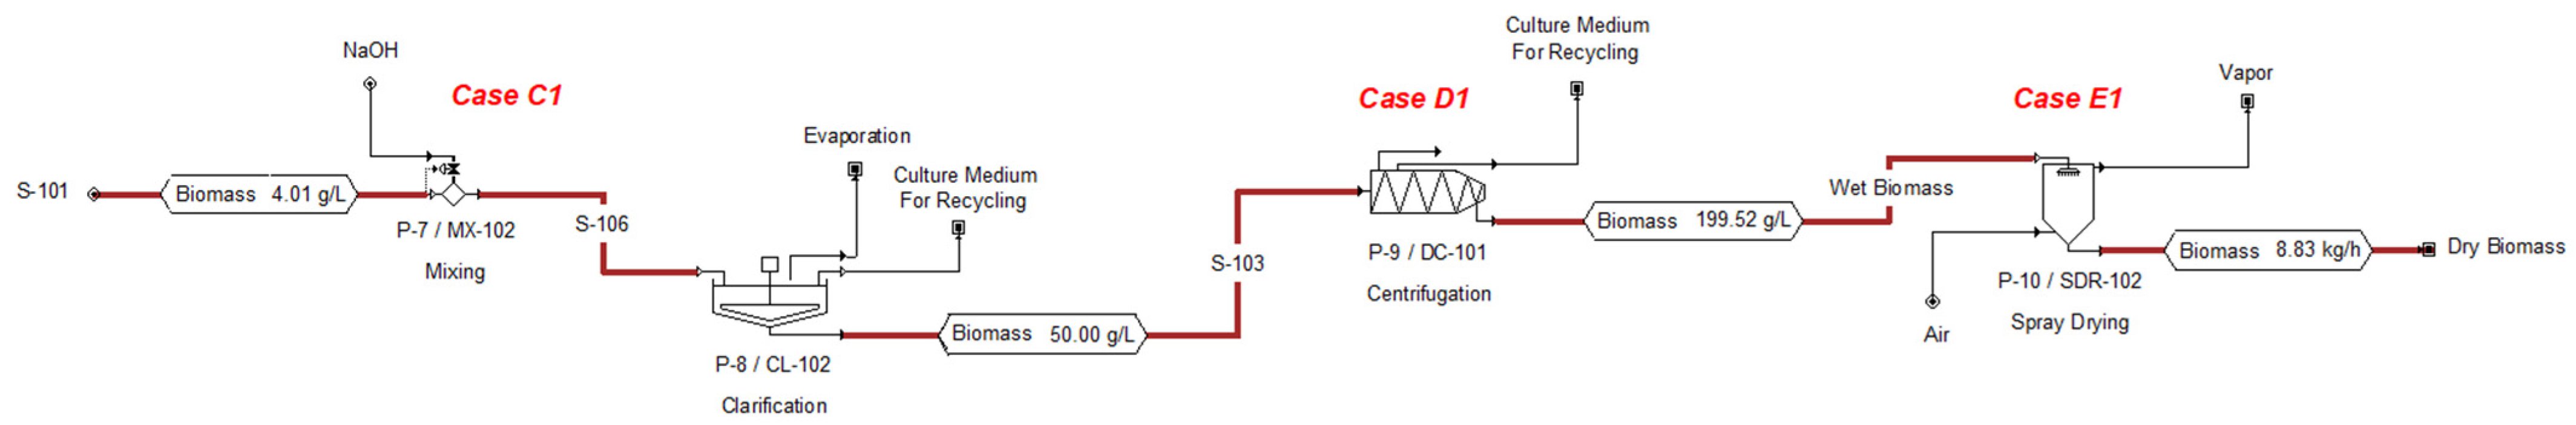
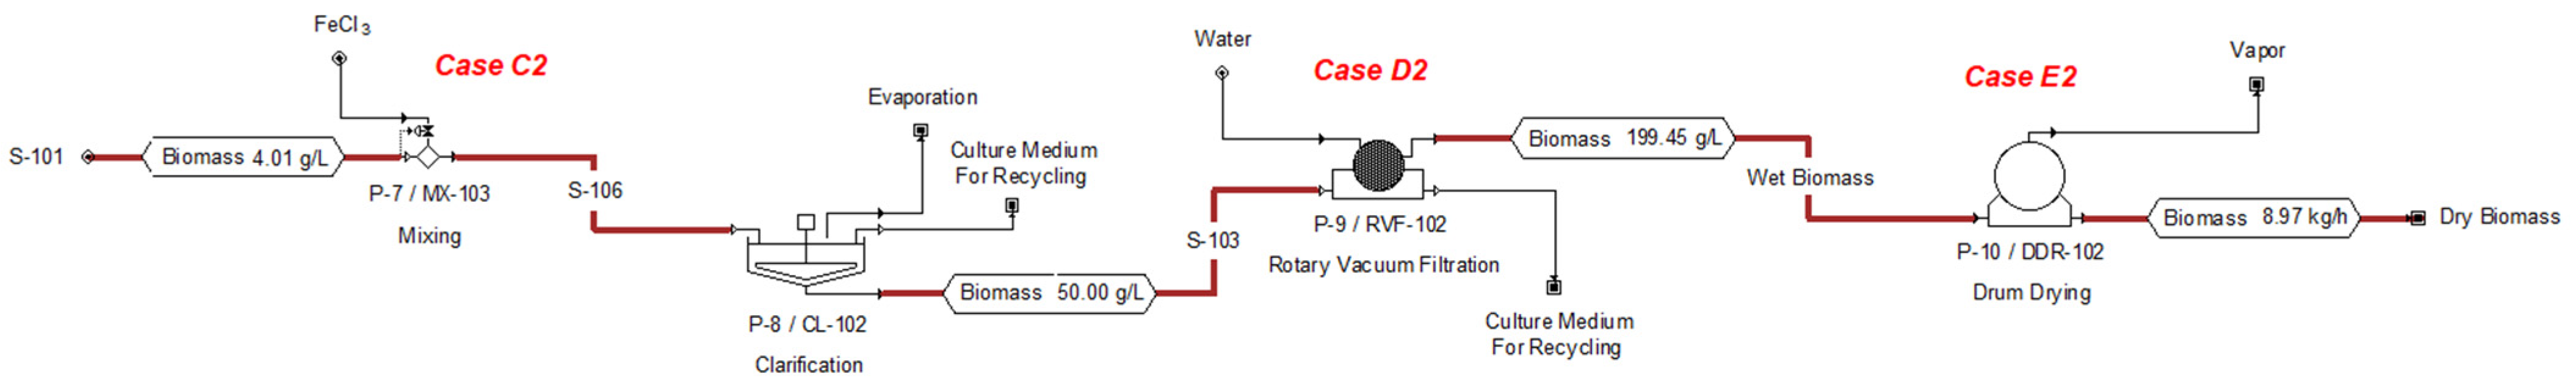
2.2. Data Collection for the Design of the Harvest Stage

As a strategy to reduce costs and energy, microalgae harvesting is usually done through two stages, first the diluted biomass is concentrated from 0.5 to 10–50 g/L approximately, and later, dehydration must be carried out to increase the biomass concentration up to approximately 200 g/L of biomass in dry weight. In the primary harvest, various techniques such as flocculation, bio-flocculation, flotation, gravity sedimentation, electroflocculation, among others, can be implemented. In the secondary harvest, centrifugation and filtration techniques are mainly used [31,32,40,49,50,51]. Since the biomass has already been concentrated in the primary harvest, energy consumption is lower for this secondary harvest since the amount of water to be removed is less. In this work, the harvest is carried out in two stages. In the primary harvest, the only flocculation is considered, since according to the literature it is considered a promising technology for large-scale harvesting [52]. However, in this primary harvest method, the objective of subsequent processes for the selection of the appropriate coagulant must be considered since this can interfere with the final use of the biomass [53]. In this case, three flocculants were analyzed for the primary harvest, NaOH, FeCl3, and Chitosan generating three case studies for this stage, C1, C2, and C3, respectively. Each flocculant has a different flocculation mechanism and allows different uses of biomass. This stage is carried out in a clarifier, which is fed with the outflow of the cultivation stage that is mixed with the flocculant. The flocculant used usually depends on the species of algae selected since each species has specific physicochemical characteristics that must be considered [54]. For the design of this stage, it is assumed that the production of microalgae is constant, that the same concentration is always achieved in the culture, 4 g/L, and that the concentration reached after flocculation is 50 g/L for all cases analyzed. Case C1 uses NaOH as flocculant with a concentration of 125 mg/L, achieving a removal efficiency of 94.28%, case C2 with a concentration of 30.52 mg/L of FeCl3 achieves a removal efficiency of 95.71%, and case C3 with Chitosan in a concentration of 36.36 mg/L, achieves a removal efficiency of 95.71%. These values were taken from what was reported in the study by Lama et al. [52], in which they analyzed flocculation of the Chlorella species with these flocculants. A cost of 350 US $/tons was considered for NaOH, 650 US $/tons for FeCl3 and 1680 US $/tons for Chitosan.
Centrifugation and filtration techniques were considered for the secondary harvest to achieve a higher concentration of biomass from the primary harvest. These two technologies were selected for their ability to be applied on an industrial scale (capacity and speed of processing [11]). At this stage, centrifugation and three types of filtration technologies were considered, generating four study cases D1, D2, D3, and D4. Different filtration technologies are applicable to the microalgal biomass dehydration process; in this study the use of membrane filtration technologies was discarded due to the high cost of operation and consumables required, and that their large-scale application is limited [53]. Vacuum Filter (D2), Belt Filter (D3), and Pressure Filter (D4) were considered as filtering technologies and Decanter Centrifuge (D1) for secondary harvest. The literature has reported removal efficiencies of 99.99% for centrifugation and 90% for filtering the Chlorella species [37,55]. Considering this information reported in the literature, removal efficiency was set in all technologies for the second harvest of 90% and that concentrations of 200 g/L of biomass are reached in the effluent of this stage (approximately 20% biomass in dry weight) in order to be able to compare them with each other. In the literature, several energy consumption values can be found for the technologies considered in this study (Table 1).
Due to the great variety of data for energy consumption reported in the literature, the highest reported value (according to the review) was selected for each technology considered in this study.

2.3. Data Collection for the Design of the Drying Stage

Drying must reach a concentration of approximately 85% to 95% in dry biomass solids to avoid decomposition. This can be achieved by drying in the sun, in a drum dryer, spray drying, freeze-drying, or any other technique that allows the removal of moisture in the biomass [11,29]. In this stage, two drying techniques were considered, spray drying and the drum dryer, since they are the two techniques with a large-scale application for drying a great variety of microalgae, Case E1 and E2, respectively [34,35]. In this stage, it was possible to concentrate the biomass up to 992.74 g/L and with a final humidity of approximately 5% (w/w), for both cases. The outlet temperature was set at 40 °C since it has been reported in the literature that if the temperature is higher it could cause changes in the composition of the biomass [41]. The energy consumption was set at 1.16 kWh/kg evaporated water for the Spray Dryer and 0.89 kWh/kg evaporated water for the Drum Dryer [41].
After collecting the information associated with the operation in each stage of the process (cultivation of Chlorella in a photobioreactor, flocculation for the primary harvest, centrifugation and filtering for the secondary harvest, and the drying of the biomass with two technologies), we proceeded to perform the simulation of the technologies individually. The technologies were then combined to form the different production scenarios. Figure 1 summarizes the technologies included in each stage of the process for the formation of the scenarios and Table 2 shows the cases considered in each scenario analyzed.

2.4. Simulatión and Techno-Economic Analysis

After data collection from the literature, the selected technologies included in the microalgal biomass production routes were evaluated. For this, the technologies were simulated in SuperPro Designer v10®. Technologies were first simulated separately, for individual evaluation and analysis. Subsequently, the simulated technologies of each stage were combined to form the flowsheets of the 24 scenarios to be analyzed (according to Figure 1 and Table 2). The SuperPro Designer simulator handles mass and energy balances, equipment and cost sizing, economic evaluation, and many other relevant functions in process design. This Software is widely used worldwide for the simulation and design of processes, mainly in the chemical and pharmaceutical industry.
The flowsheets of the process scenarios are composed of sections for the preparation of preculture and culture in a closed system (tubular photobioreactor), both sections are shown in Figure 2. It is worth mentioning that these sections are identical in all the scenarios analyzed. Figure 3, Figure 4 and Figure 5 show the flowsheet of the harvesting (primary and secondary) and drying sections for scenarios 1, 12 and 24. Said sections are an immediate continuation of the flowsheet of Figure 2. As can be seen in the flow diagrams, the process begins with the production of the inoculum (P-1), in which the culture medium is fed through a pump (P-6). At the outlet of the P-1 unit, there is a biomass concentration of 1.5 g/L, this stream is mixed with a fresh stream of culture medium from the P-12 pump. This causes a reduction in the biomass concentration down to 0.3 g/L in stream S-102. Stream S-102 feeds the photobioreactor (P-4) at the same time as a stream of flue gases, which will provide the carbon source for the culture. Since not all the flue gas fed is consumed in the cultivation, it is necessary to remove the excess. Similarly, the oxygen generated by photosynthesis must also be removed from the PBR. Both compounds are removed by the Gas Outlet stream (Figure 2). Subsequently, the PBR outlet stream (S-101), with a biomass concentration of 4 g/L, is mixed in the P-7 unit with the flocculant, according to the case (Figure 3, Figure 4 and Figure 5). Stream S-106 feeds the clarifier (P-8), in which there are three outlet streams. Stream S-103 carries the concentrated biomass (50 g/L) and feeds the secondary harvest (unit P-9). For case D1, an additional fresh water supply is not necessary in the P-9 unit (Figure 3). On the other hand, if the filtration technologies are considered, case D2, D3 and D4 (Figure 4 and Figure 5), it is necessary to wash the biomass and eliminate the compounds that accompany it. At the output of case D technologies, the Wet Biomass stream has a biomass concentration of 200 g/L, this stream feeds the drying technology unit (P-10) according to the case. In the P-10 unit there are two outlet streams, one with the vapors formed by the drying of the biomass and the other containing the dry biomass. Similarly, for each production scenario, a flowsheet was developed in the simulator.
For each technique or technology included in the process scenarios, a mass and energy balance were carried out, in addition to the evaluation of the necessary size of each equipment. The energy consumption by scenario was also evaluated.
The cost of production, as well as the energy consumption, were made using the software SuperPro Designer v10®. It was considered 330 days of continuous operation mode. The cost of production includes the sum of costs related to raw materials, labor, services and additional operating costs related to the use of the facility. The costs considered for the services were US $0.1/kWh for energy, US $12/tons for steam (heat) and US $0.05/tons for cooling water. For the costs associated with raw materials, those reported per ton in 2018 were considered. The raw materials are formed by the nutrients necessary for the culture (as reported by Kuo et al. [48]) and the three flocculants considered in the secondary harvest. Regarding labor, only operators were considered to keep the technologies of each stage of the process in operation, with a cost of US $0.37/h. Additional costs depending on the use of the facility are calculated as the sum of the costs associated with the maintenance of the equipment, the depreciation of the fixed capital cost and some other expenses such as insurance, local (property) taxes and others. All of these are determined as a percentage of the direct fixed capital cost (DFC), which in turn includes the sum of costs that are estimated as percentages of the total equipment purchase cost. For this study, the base cost proposed by the simulator was considered. The simulator has a database of design parameters, which are used in the equipment model to obtain the purchase cost of the equipment, and the software SuperPro Designer v10® uses the Chemical Engineering Cost Index to account for inflation and thus adjust the cost to different years (Intelligen, Inc., Scotch Plains, NJ, USA).
Computer simulation has been used successfully in many industrial processes to model and predict production costs. They provide the ability to estimate the effect of rising raw material and utility costs, variations in material composition, and the incorporation of new technologies [57]. It always starts with a base case scenario and the design of the model to effectively simulate the conditions that are desired; this allows the user to estimate results of the process alternatives with confidence.

3. Results and Discussion

3.1. Technical and Economic Evaluation by Process Stage

The technologies considered for each process stage were simulated with the respective models in the SuperPro Designer v10® simulator (Intelligen, Inc., Scotch Plains, NJ, USA) and with the conditions considered according to the reported literature. In the first stage, the technologies were evaluated individually, considering the same feeding conditions. Subsequently, the individual impact of the technologies considered in each stage of the process was analyzed and compared. In the second stage, the models of all the process stages were integrated to form the various production scenarios and estimate the energy consumption and the cost associated with the operation of the process. Additionally, fresh water consumption was determined to compare the production scenarios, with respect to this criterion.

3.1.1. Technical and Economic Evaluation for the Cultivation Stage

The process to produce biomass from microalgae begins with the cultivation stage in tubular photobioreactors. Under the parameters considered in this study, a production of 82.45 tons/ha/year of biomass is achieved. This value depends directly on the productivity considered, in this case an average value (22.66 g/m2/d) was used since it would be incorrect to assume high productivity (environmental conditions are not always favorable for the process); although there are reports that indicate that productivities of up to 45 g/m2/d can be achieved in PBRs [47]. Each photobioreactor has a diameter of 0.09 m and a length of 555 m. The diameter was established with the same value of the original design of the report on which we based [48], so that the transfer of light to the culture is not affected. For its arrangement on the surface considered for cultivation, not only the footprint of the area occupied by each system is considered, but also the projected shadows, since this area is not used to install other photobioreactors. To determine the area occupied by 1 PBR, D x L is calculated and multiplied by 2, to consider the area of the PBR footprint and the shadows that could be generated if the PBRs were installed outdoors and illuminated by sunlight. Considering that 1 ha was established as an area destined for cultivation, 86 PBRs would be necessary to cover this area.
A photoautotrophic microalgae culture was considered, which needs CO2 as a carbon source, being very useful for its use as a capture from flue gases. The flue gases from a thermoelectric plant, with a concentration of 11% v/v of CO2, was considered as a feed, and a capture of up to 148.4 tons/ha/year of CO2 is calculated. A consumption of 16,872 m3/year of freshwater for cultivation is calculated, much less than when using an open system for cultivation. In previous work, consumption of 58,061 m3/year of freshwater was calculated for the culture in raceway pond for the same surface [56], which indicates that savings of up to 71% can be achieved when using photobioreactor systems. Another option to reduce the consumption of freshwater is the use of wastewater, it is also a source of nutrients and this could contribute to economic savings for this stage.
The cultivation stage is highly energy consuming and even more so if photobioreactors are used. In this study, consumption of 875,053 kWh/year and a unit production cost of US $180.43/kg of biomass produced in this stage is estimated, being the highest values of all the stages of the process. The cost of producing microalgal biomass in photobioreactors has a high cost. However, it offers many advantages over an open system culture. Closed systems offer greater control of climatic conditions and better use of light, and reduce CO2 losses, and all this is reflected in the high production of biomass [58]; this causes them to be the preferred systems if high-quality biomass is required.

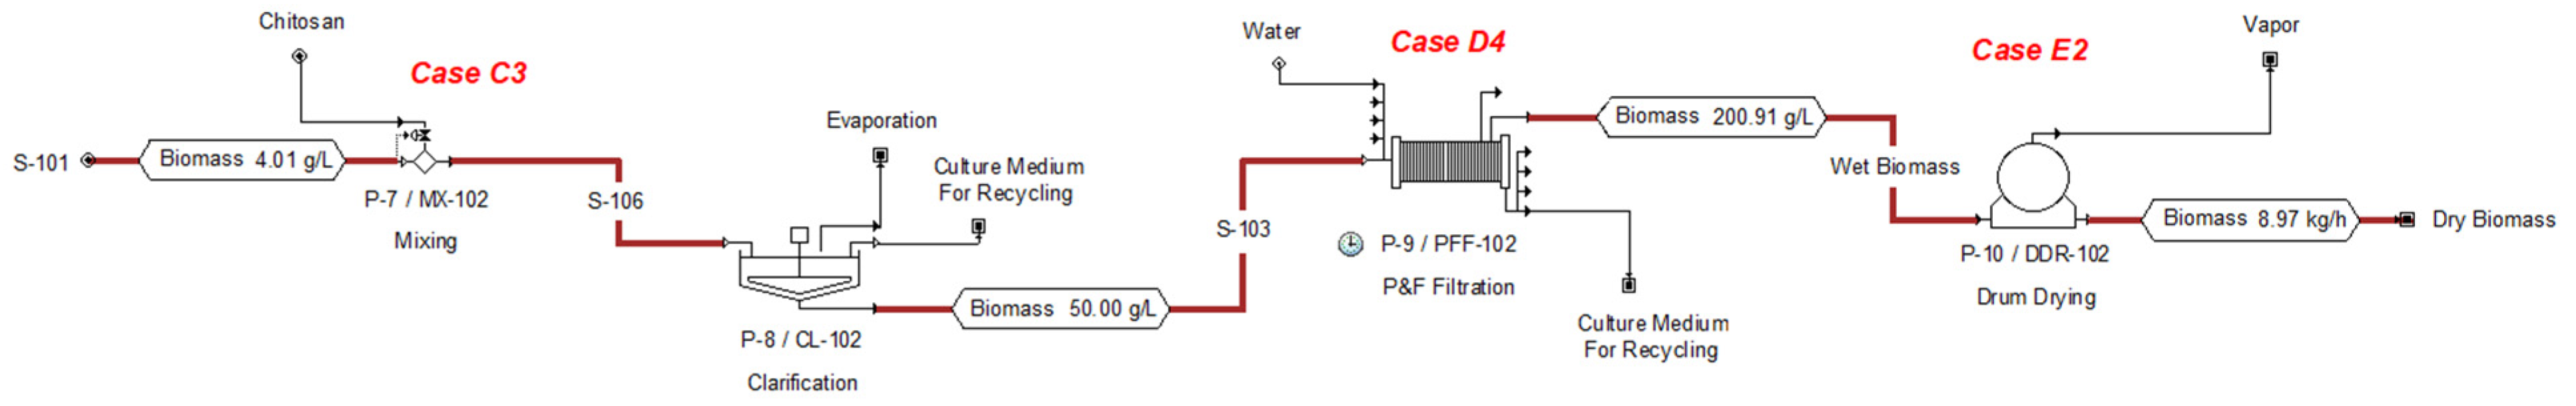
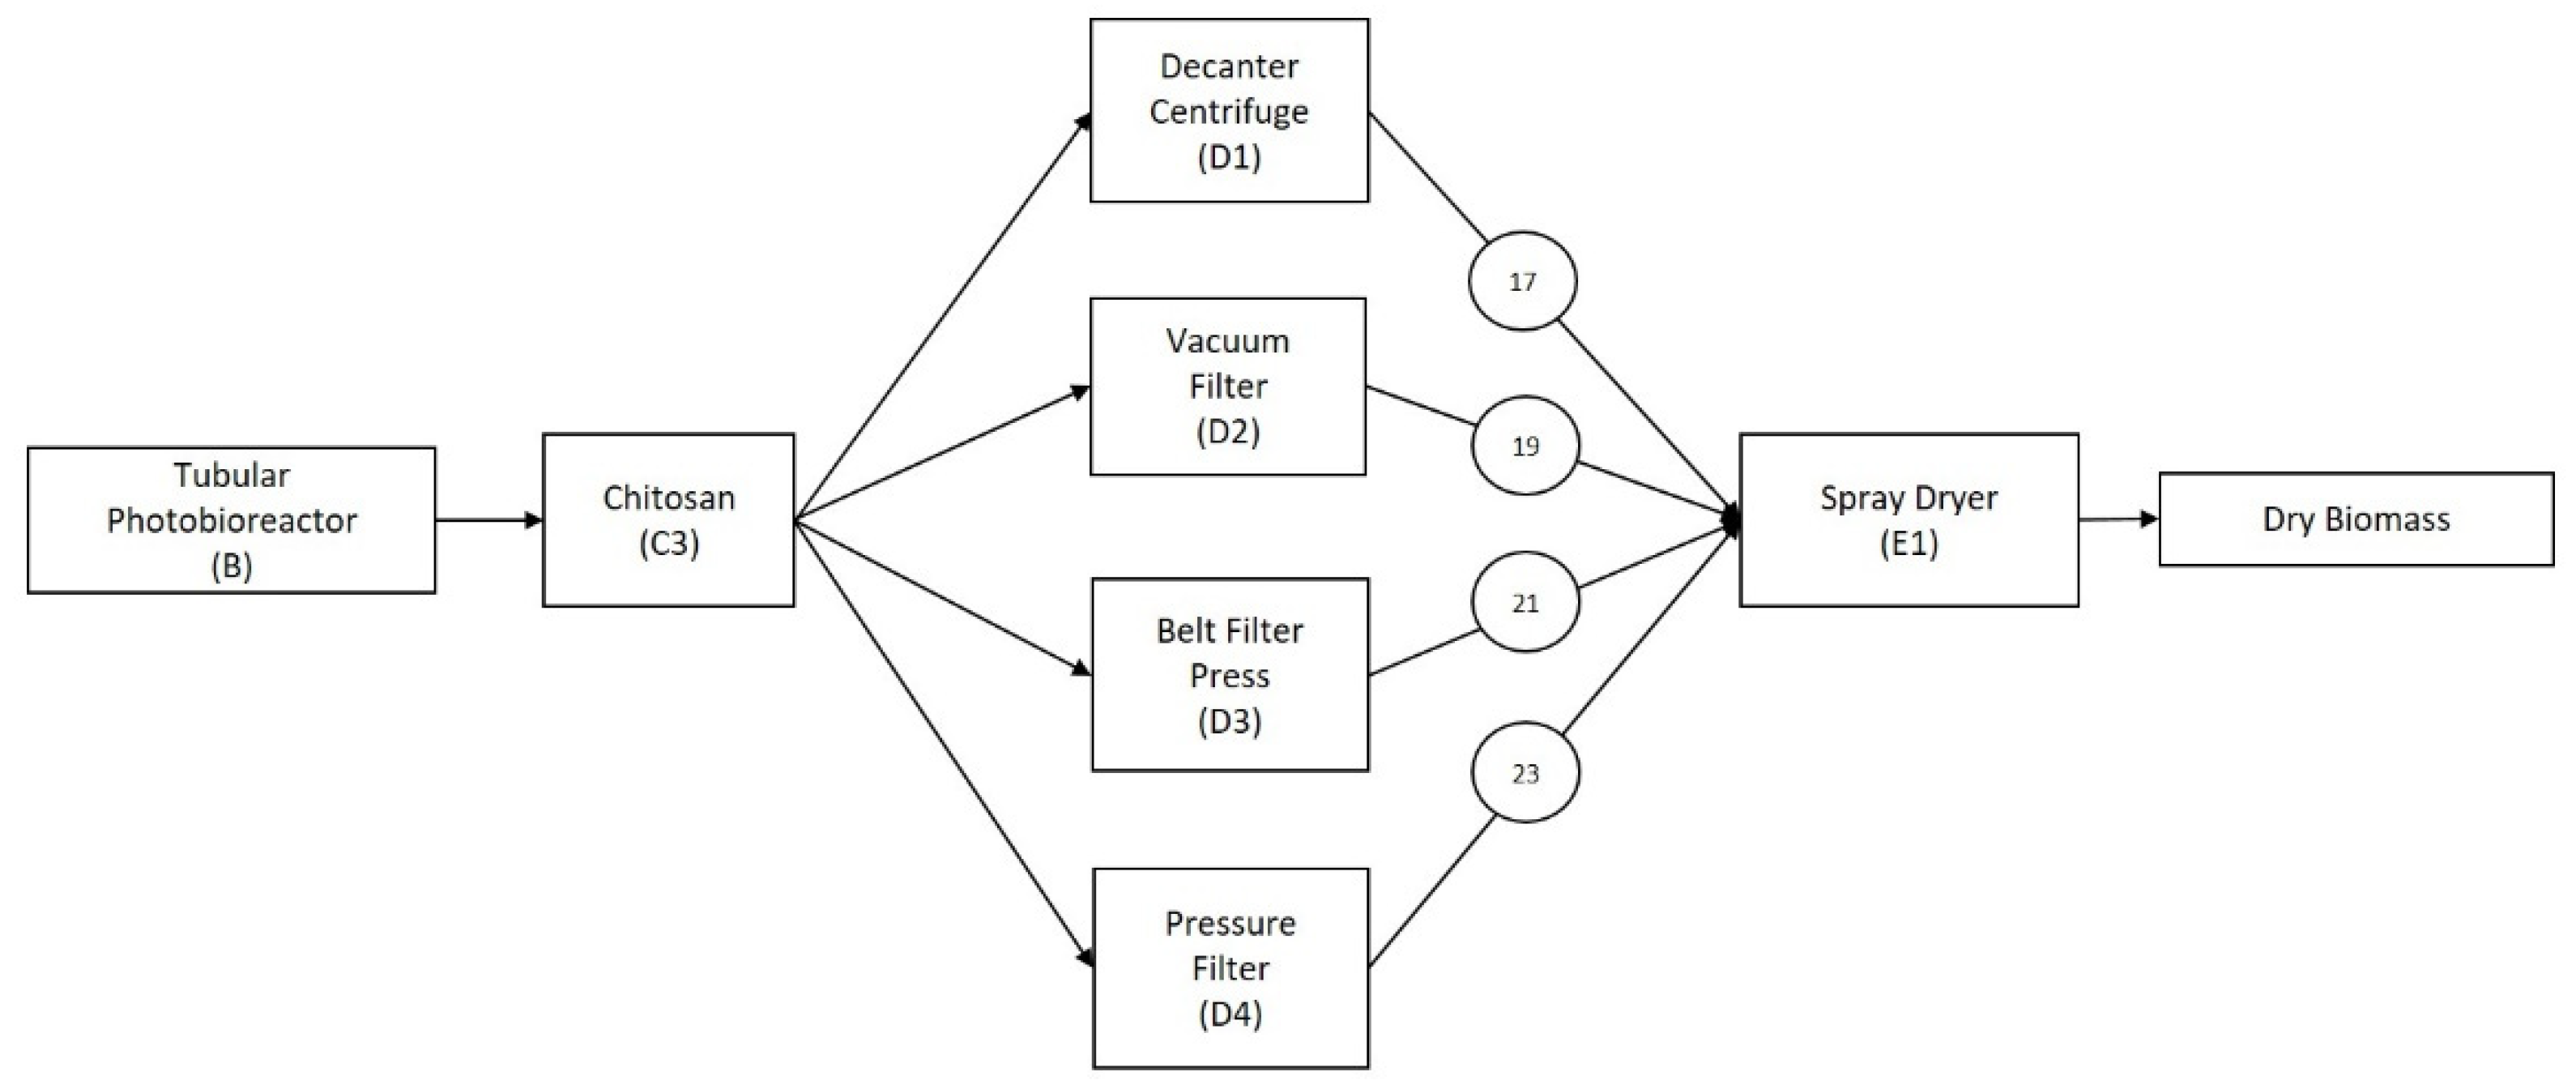
3.1.2. Technical and Economic Evaluation for the Primary and Secondary Harvest Stage

After cultivation, it is necessary to collect the biomass. Harvesting was divided into two stages, primary harvest and secondary harvest, since the literature shows that in this way, energy consumption is lower compared to the use of a single-stage, resulting in an economical and effective harvesting process [59]. On the other hand, it is desirable to consider a harvest method that allows recycling the culture medium and thus reduces nutrient costs for the cultivation [53]. For the design of the primary harvest, flocculation was considered, which is induced by the addition of chemical substances that interact with the negatively charged cell surface of the microalgae [52]. In the case of C1, NaOH was considered to induce an increase in pH and cause auto-flocculation, in the case of C2 it was considered an iron salt (FeCl3) since it is an efficient and highly used flocculant. For the C3 case, Chitosan was considered since it is a natural biopolymer and it has been reported that it does not contaminate the biomass and also shows successful flocculating activity. For this stage, the results obtained by Lama et al. [52] were taken as a reference, in which they evaluate the removal efficiencies of these flocculants in cultures of the Chlorella sp. Regarding the primary harvest, it was determined that 2.59 tons/year of NaOH are necessary to flocculate the biomass (case C1), 0.63 tons/year of FeCl3 for case C2, and 0.754 tons/year of Chitosan for case C3 (Table 3 summarizes the results of the primary harvest). In this stage, the objective is to concentrate the biomass to approximately 50 g/L and with the different removal efficiencies, an approximate recovery of 77.73 tons/year of biomass for C1 and 78.91 tons/year for C2 and C3 is achieved. The efficiency of the flocculant usually depends on the selected microalgae species, since each species has specific physicochemical characteristics that must be considered [54].
The most expensive flocculant is Chitosan, approximately 3 times the cost of FeCl3 and 32% more than NaOH. However, the consumption of Chitosan is low compared to NaOH, which favors reducing the cost of production in the case C3. It has been reported that an alternative for alkaline flocculation is to replace NaOH with slaked lime (Ca(OH)2) which costs 50% less and is not toxic to biomass [60], since these chemicals help to provide a high basic pH (10–11 approximately) where the formation of flocs is favored [58]. The estimate of energy consumption shows similar values for the three cases analyzed since they operate under very similar conditions. There is no significant difference between the cases analyzed for this stage regarding energy consumption and production cost. However, this stage is decisive for the potential use of biomass due to the flocculant used, since it can be contaminated by the chemicals used for flocculation [31]. For example, the use of ferric salts can contaminate the biomass by the metals used. It has been shown to cause a brown-yellow coloration in microalgae, causing pigments to not be extracted, and it also makes it difficult to apply it as biomass for biofuels or animal feed [53]. The use of Chitosan with great effectiveness in flocculation and low contamination of the biomass obtained has been reported in the literature. A great advantage of using Chitosan as a flocculant is being able to recycle almost 90% of the culture medium after sedimentation [59]. However, its high cost prevents its implementation on a large scale, since it raises the operating costs of biomass production [61].
In the secondary harvest, the biomass production will depend on the feeding since the flocculation does not have the same removal efficiencies for all the evaluated cases. To evaluate the technologies of the second harvest, the output of case C1 was considered as feeding. At this stage, the removal efficiency of 90% was set for all technologies, for this reason, we observed the same biomass production for all cases, 69.957 tons/year (Table 4). However, centrifugation could have a biomass recovery greater than 90%, which would contribute to higher biomass production for the case that considers this technology. Furthermore, the speed of harvest and the efficiency of this technique makes it one of the ideal units for collection [31,41,50]. According to the results, centrifugation technologies (case D1) and vacuum filters (case D2) are the technologies with the highest energy consumption for secondary harvest, 16,773 kWh/year and 9027 kWh/year, respectively. Centrifugation requires a high amount of energy for its operation and a high maintenance cost [11,58]. In the application of filtration, it is necessary to maintain a pressure drop through the system to force the flow through a membrane or filter, and this could cause high energy consumption (depending on the type of filtration technology) [53], such as is the case of vacuum filtration. While the belt filter press technologies (case D3) and pressure filters (case D4) are the ones with the lowest energy consumption, 941 kWh/year and 1399 kWh/year, respectively. The operating costs are estimated at US $76,000/year for centrifugation in case D1, US $15,000/year for vacuum filter in case D2, US $71,000/year for the belt filter press in case D3, and US $15,000/year for the pressure filter in case D4. Operating costs consider the costs associated with the demand for raw materials, labor, services and energy, maintenance of equipment and other expenses that may occur in the process; this evaluation does not consider costs for taxes, since in most cases, these will depend on the place where the process is physically installed. The belt filter press is a low energy consumption technology, but its operating cost is high due to the high cost of this equipment. This implies an increase in the costs associated with maintenance and a longer operating time required to operate the case D3.
The selection of technologies to consider in the biomass harvest will depend to a large extent on the species of microalgae that is used, since the separation efficiency can differ considerably from one species to another [58]. Therefore, it is of interest to investigate, develop and evaluate technologies for the collection of the biomass.

3.1.3. Technical and Economic Evaluation for the Drying Stage

After the secondary harvest, it is necessary to dry the biomass. In this stage, it was considered that 100% of the biomass fed is collected at the end of drying in both cases analyzed. However, this might not be true in reality, since there could be losses due to natural effects of technology in the process, causing lower biomass production. On the other hand, let us remember that the biomass production after the drying stage will depend on the feed. This is because the flocculation stage causes different removal percentages depending on the case considered. Something similar happens in the secondary harvest. To evaluate the drying technologies, the biomass from the technology in case D1 is considered as feed.
According to the results (Table 5), energy consumption and operating cost is higher for spray drying (29% and 94%, respectively). The literature reports that this is due to the high energy demand to generate the hot air used in the drying process [34]. The integration of the residual heat generated by the thermoelectric provided by the CO2 in the drying stage can reduce energy consumption. Some authors mention that renewable energies can also be integrated into the drying stage to reduce energy demand [17,58]. Some existing methods of obtaining bioenergetics or bioproducts from microalgal biomass are carried out considering wet biomass, which would avoid the drying stage in the process. Authors report that drum dryers can exceed the denaturation temperature of proteins. This is not suitable if you want to dry biomass to produce high-quality proteins [41]. However, if the purpose of biomass is to produce biofuels, this technology can be considered, due to its lower energy consumption compared to the spray dryer and that, even if the protein denaturation temperature is exceeded, this does not affect the extraction or composition of the lipids. The selection of drying technology depends on both the scale of production and the purpose for which the dry biomass is intended [62].

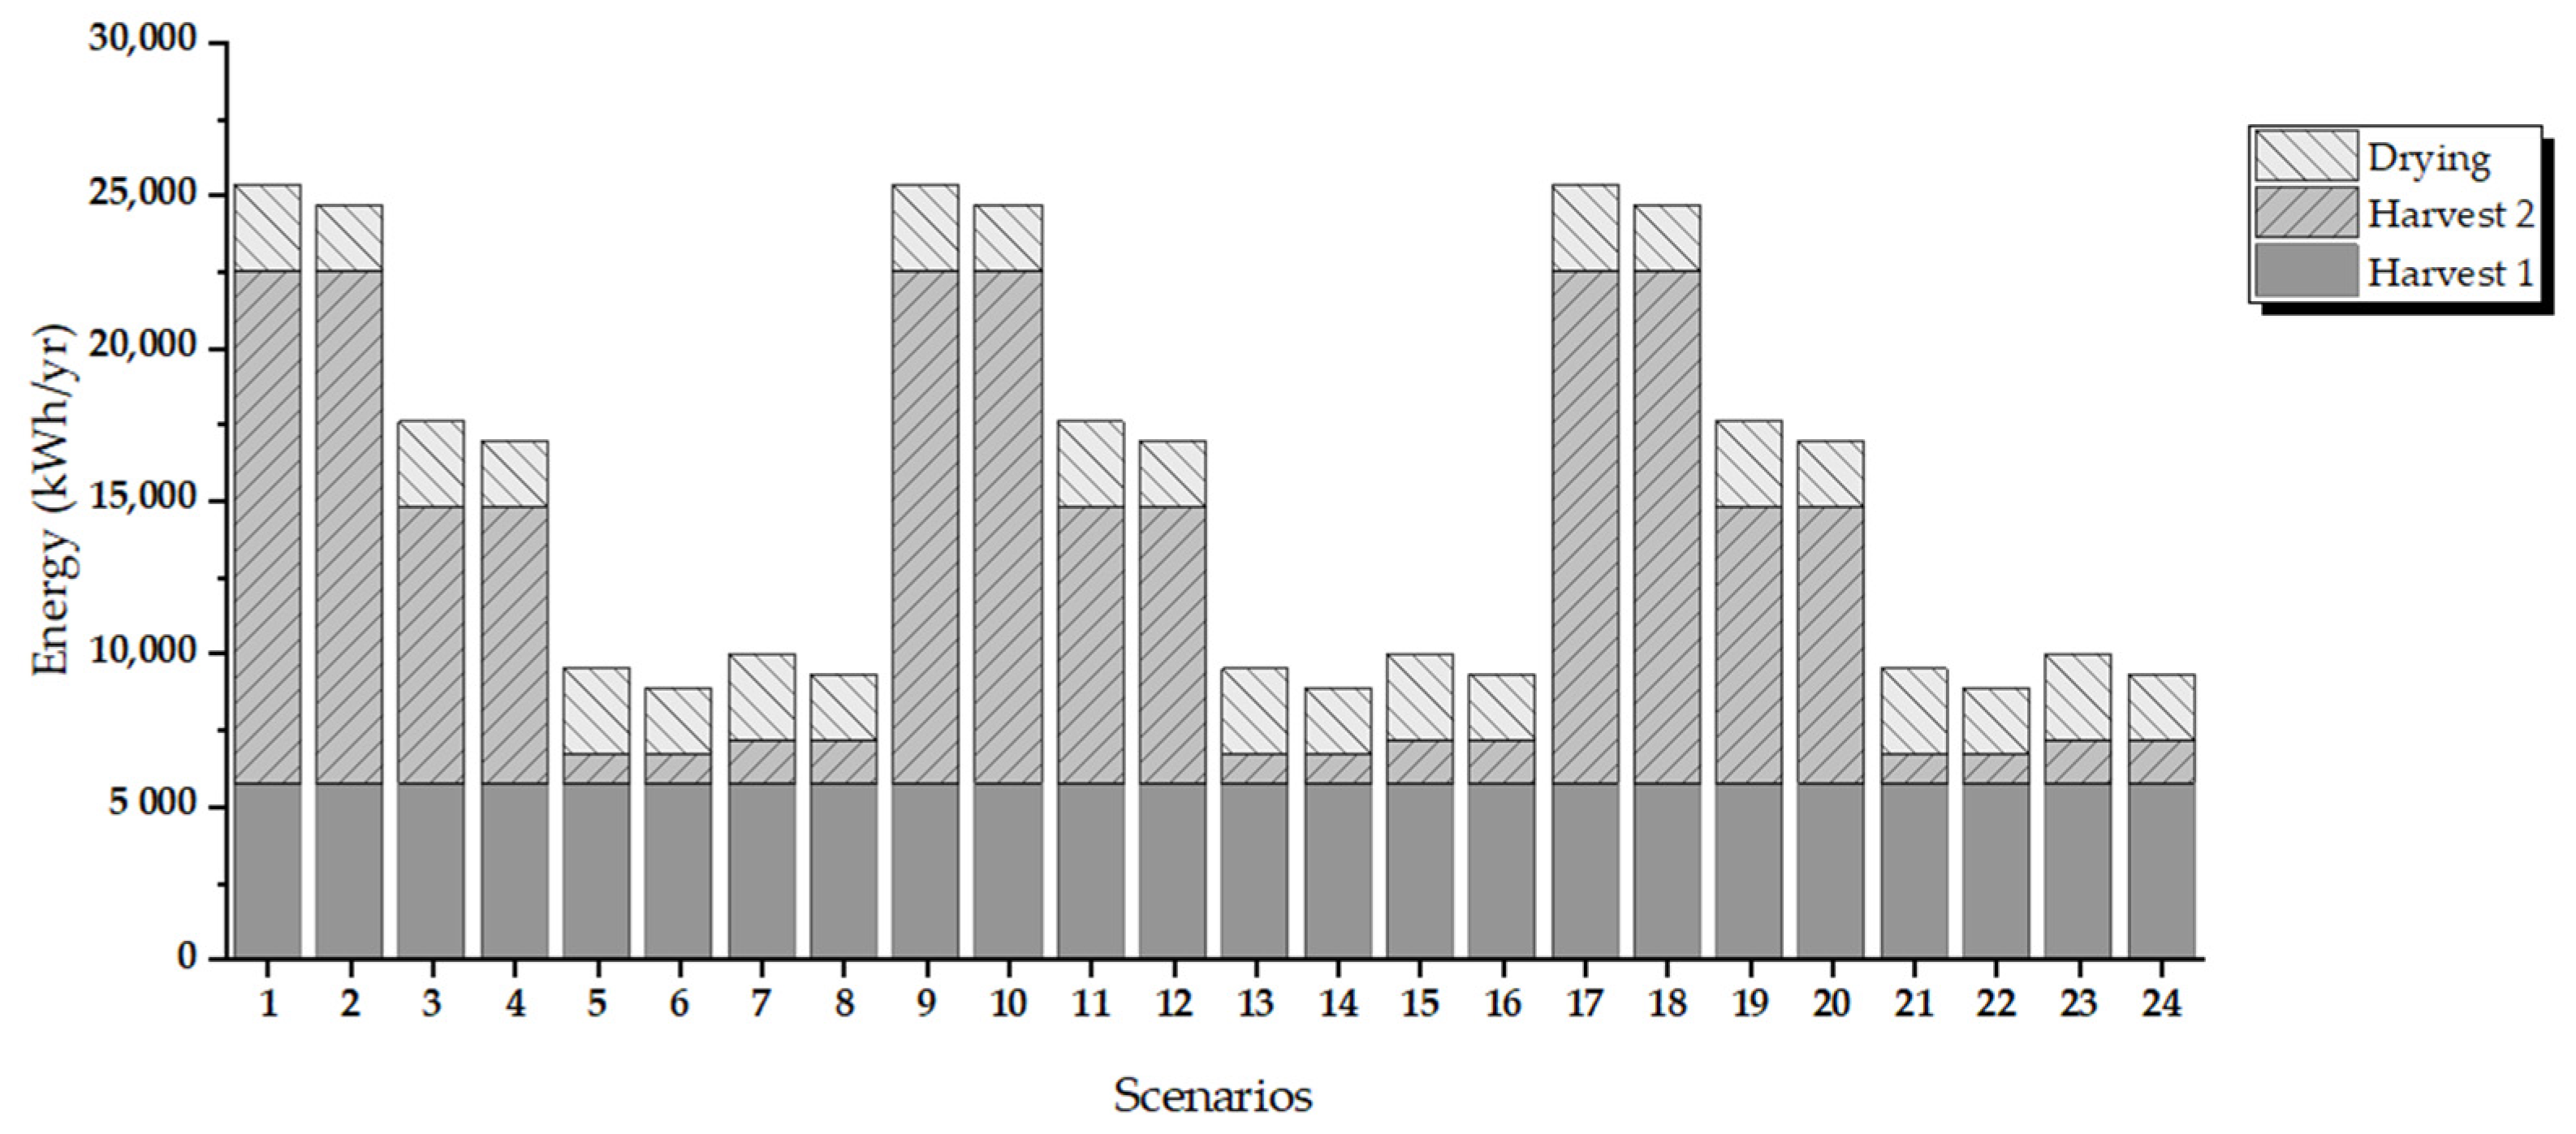
3.2. Energy Evaluation by Process Scenarios

The combination of the various technologies involved in the dry biomass production process generated 24 scenarios (Figure 1 and Table 2). One of the main parameters to consider in process design is energy consumption. This is mainly associated with the need for continuous feeding of water, nutrients, the circulation and mixing of the growing medium, and the energy requirement for harvesting and drying the biomass. Many authors report that energy consumption is high or low for the different technologies involved in the process, but they do not indicate the amount or under what criteria they are compared. In this study, for all scenarios the biomass feed produced in tubular photobioreactor from the cultivation stage is contemplated, this being a constant value, 875,053 kWh/year. The cultivation stage to produce biomass in photobioreactors consumes between 96% and 98% of the total energy consumption, depending on the scenario analyzed. The energy consumption for the primary harvest shows minimal variations, compared to the later stages of the process. The secondary harvest and the drying are the stages that cause the variation in energy consumption in the scenarios. Figure 6 shows the individual contribution of energy consumption by technology in each process stage, not including the preculture and cultivation stage. Based on what is observed in Figure 6, scenario 6 is the one with the lowest energy consumption, with a total consumption of 858,567 kWh/year, it considers NaOH as flocculant, belt filter press and drum dryer for drying. Scenario 17 with a total consumption of 875,192 kWh/year is the one with the highest energy consumption and considers Chitosan as flocculant, centrifugation, and spray drying. Evaluation of each of these technologies individually showed that centrifugation and the spray dryer are the technologies with the highest energy consumption in this stage. We can see in Figure 6 that scenarios that consider these two technologies (scenarios 1, 9 and 17) are those with the highest energy consumption. The scenarios with a behavior similar to these only change the technology from spray dryer to drum dryer (scenarios 2, 10 and 18). Scenarios 3, 4, 11, 12, 19 and 20 have a slightly lower energy consumption than the scenarios that consider centrifugation. Scenarios 3, 4, 11, 12, 19 and 20 consider vacuum filter for secondary harvest. In the remaining scenarios, a similar energy consumption is observed. However, those scenarios that consider belt filter press (5, 6, 13, 14, 21 and 22) have a slightly lower energy consumption than those that consider pressure filter (7, 8, 15, 16, 23 and 24).

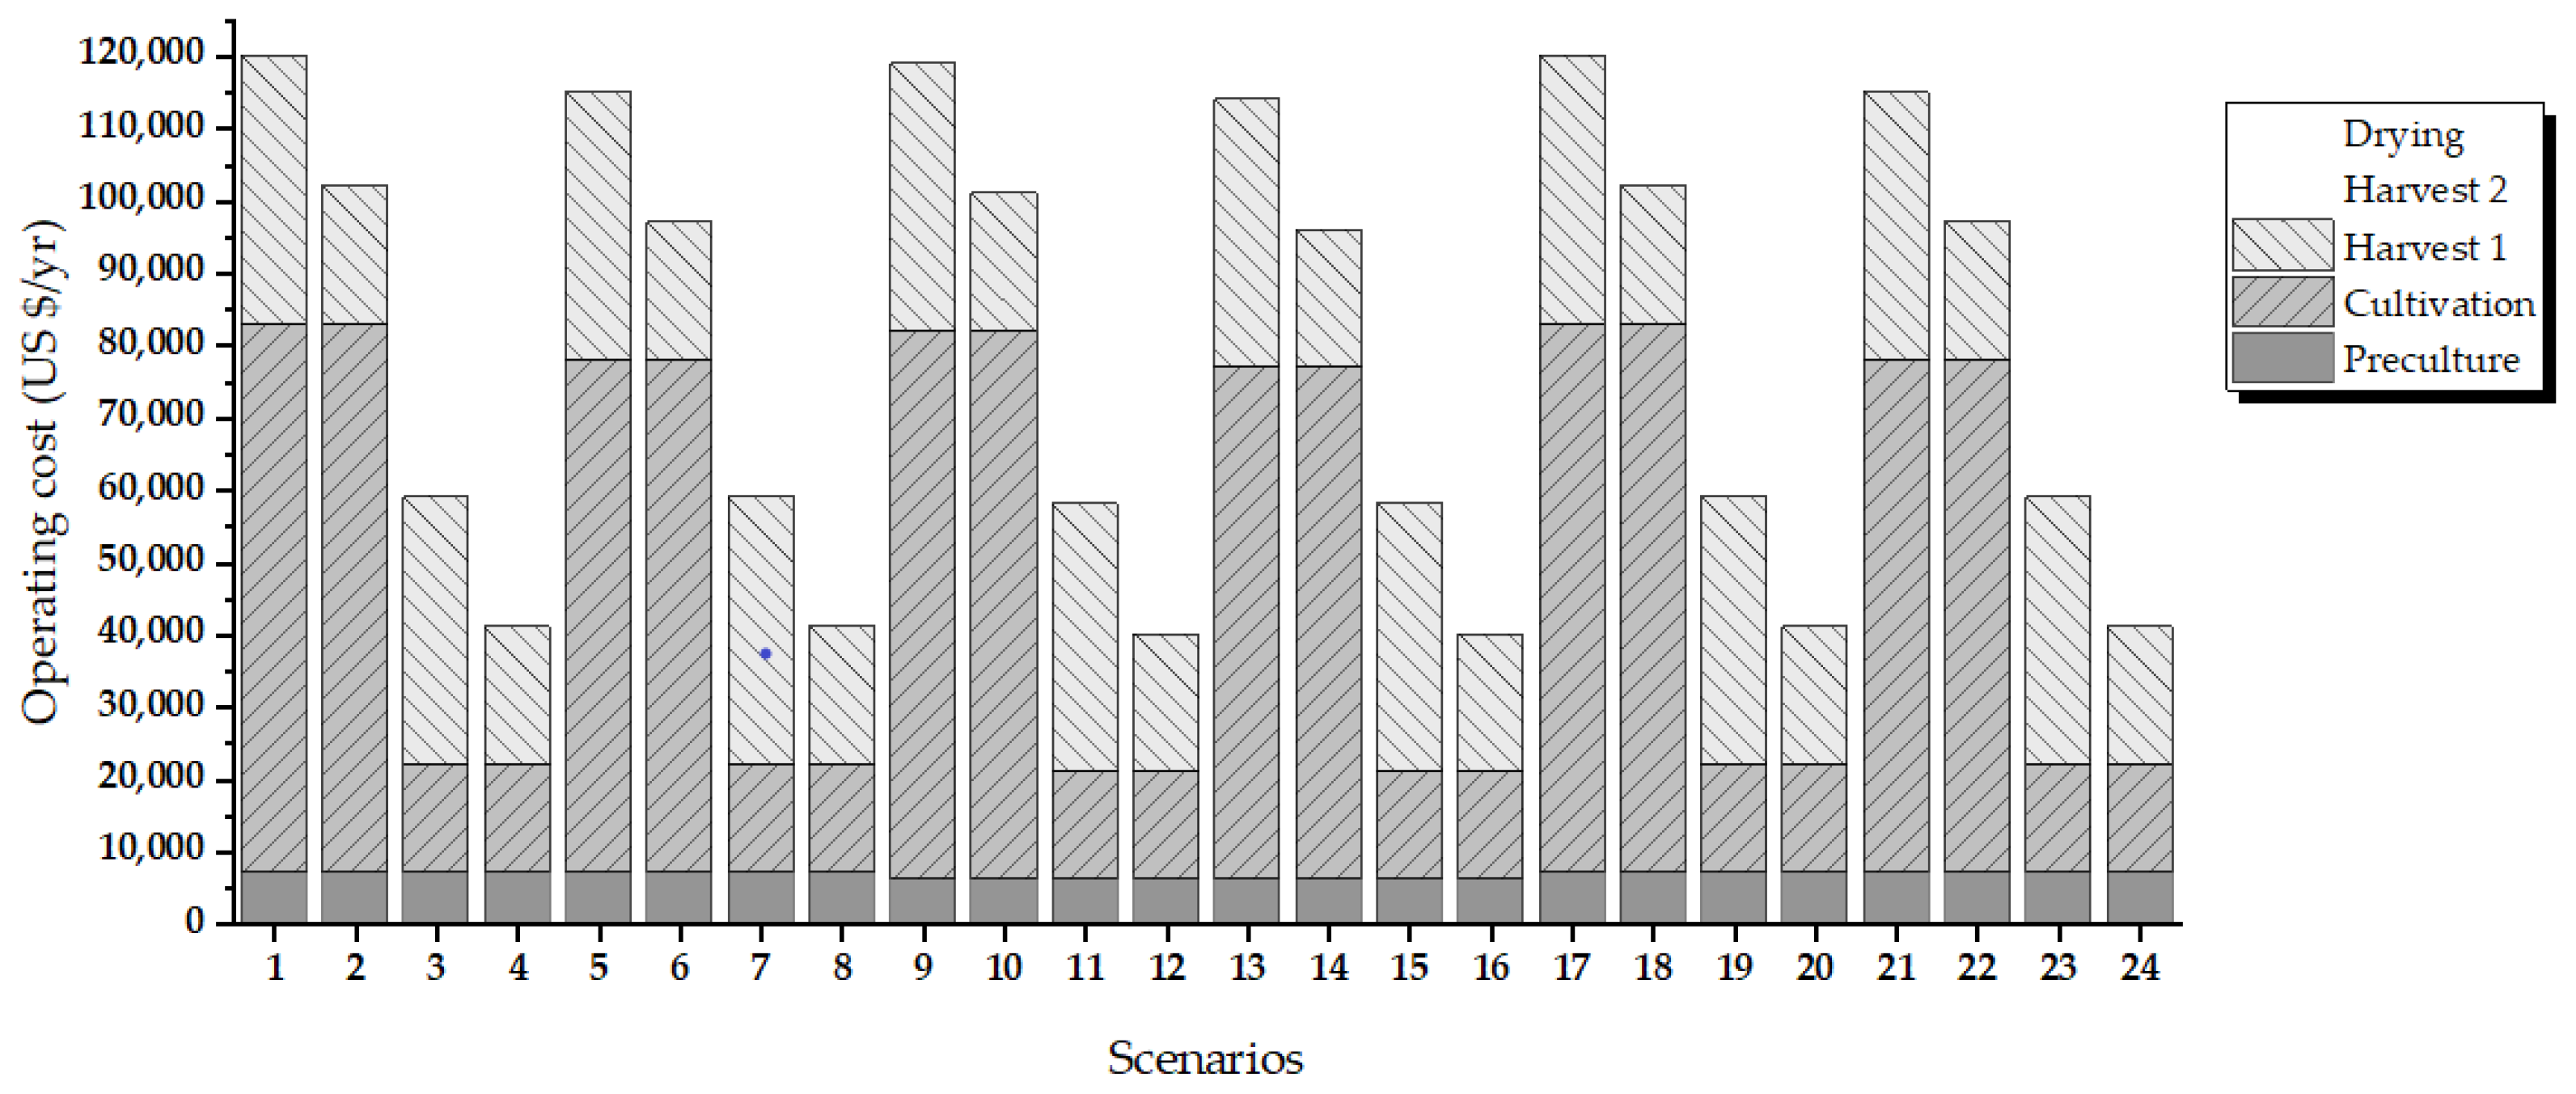
3.3. Evaluation of Production Costs by Process Scenarios

According to what was observed in the results of the previous section, the cultivation stage is expected to be the one with the highest production cost, compared to the rest of the process stages. The cultivation stage (including preculture) absorbs 99% of the operating costs (US $14,876,000/year), this is mainly due to the cost associated with the maintenance of the PBR, which is directly associated with the purchase cost of the equipment, the high energy consumption and the cost of the raw material of the process that is necessary in this stage (99% of the raw material costs are required in this stage). Figure 7 shows the distribution of the production cost in the harvesting and drying stages. Analogously to the results of energy consumption, the primary harvest stage has little variation in production costs for the different scenarios. However, it can be observed in Figure 7 that the scenarios that consider the flocculant FeCl3 (case C2) are of lower cost (scenarios 9 to 16). Figure 7 shows a group of scenarios that presents a greater difference in the cost of production, these are 1, 2, 5, 6, 9, 10, 13, 14, 17, 18, 21 and 22. This group of scenarios includes centrifugation and belt filter press technologies. These technologies have the highest production cost compared to the other two secondary harvest technologies. The high cost of operation for these two technologies is associated with the high cost of maintenance of the equipment, since they are the ones with the highest equipment purchase cost. It is also observed that spray drying increases operating costs in those scenarios that consider it. On the other hand, in the group of scenarios with the lowest production cost are those that consider vacuum filter and pressure filter for secondary harvest.
The results allow us to detect the impact of the integration of various technologies in production scenarios. This is relevant in the process design; if we want to implement a biomass production system in which it is necessary for the biomass to meet certain specifications, the first thing that must be taken into account is if the technology does not affect the quality for the purpose wanted. For example: (1) it was already mentioned that the type of flocculant can contaminate the biomass and limit its use for certain applications, (2) if you want to obtain high quality products, for example for the food or pharmaceutical area, centrifugation should be considered over another technology for secondary harvest, (3) or if the purpose is to obtain proteins, when using a drum dryer there is a risk that it reaches a temperature higher than necessary and this causes the denaturation of the proteins. However, taking all this into account has a direct impact on the scenario to be considered, and in turn, on energy consumption and production costs.

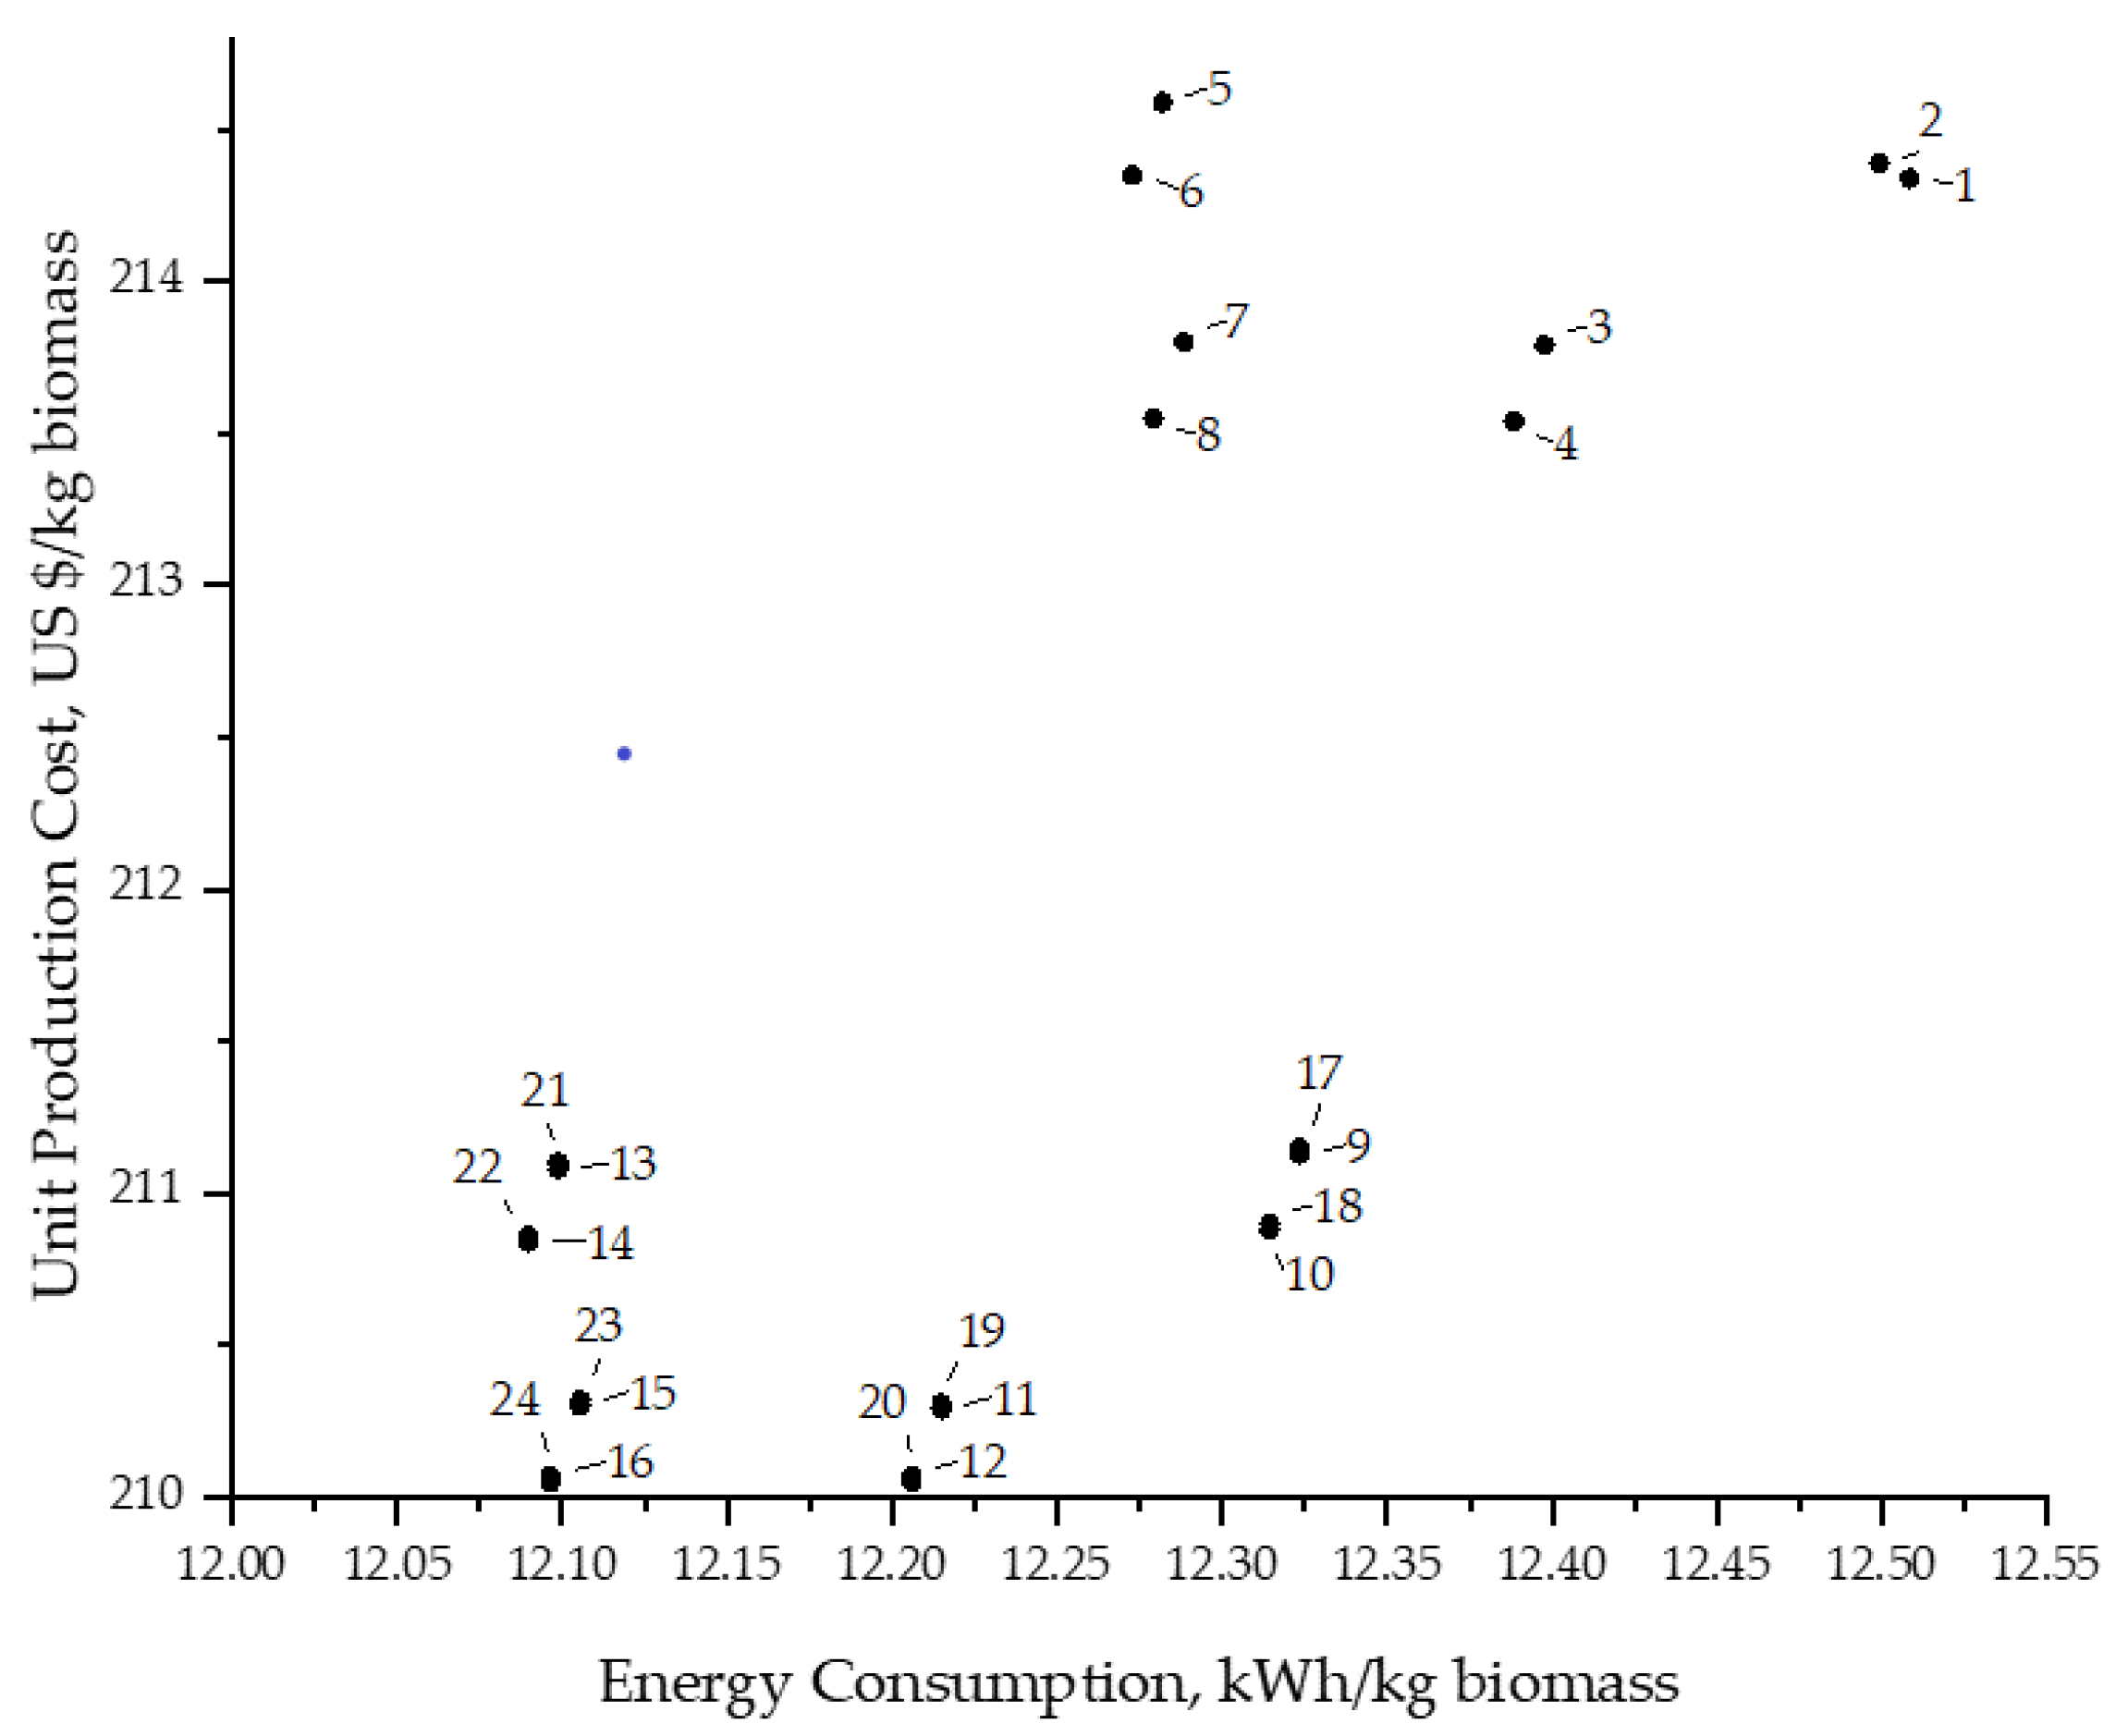
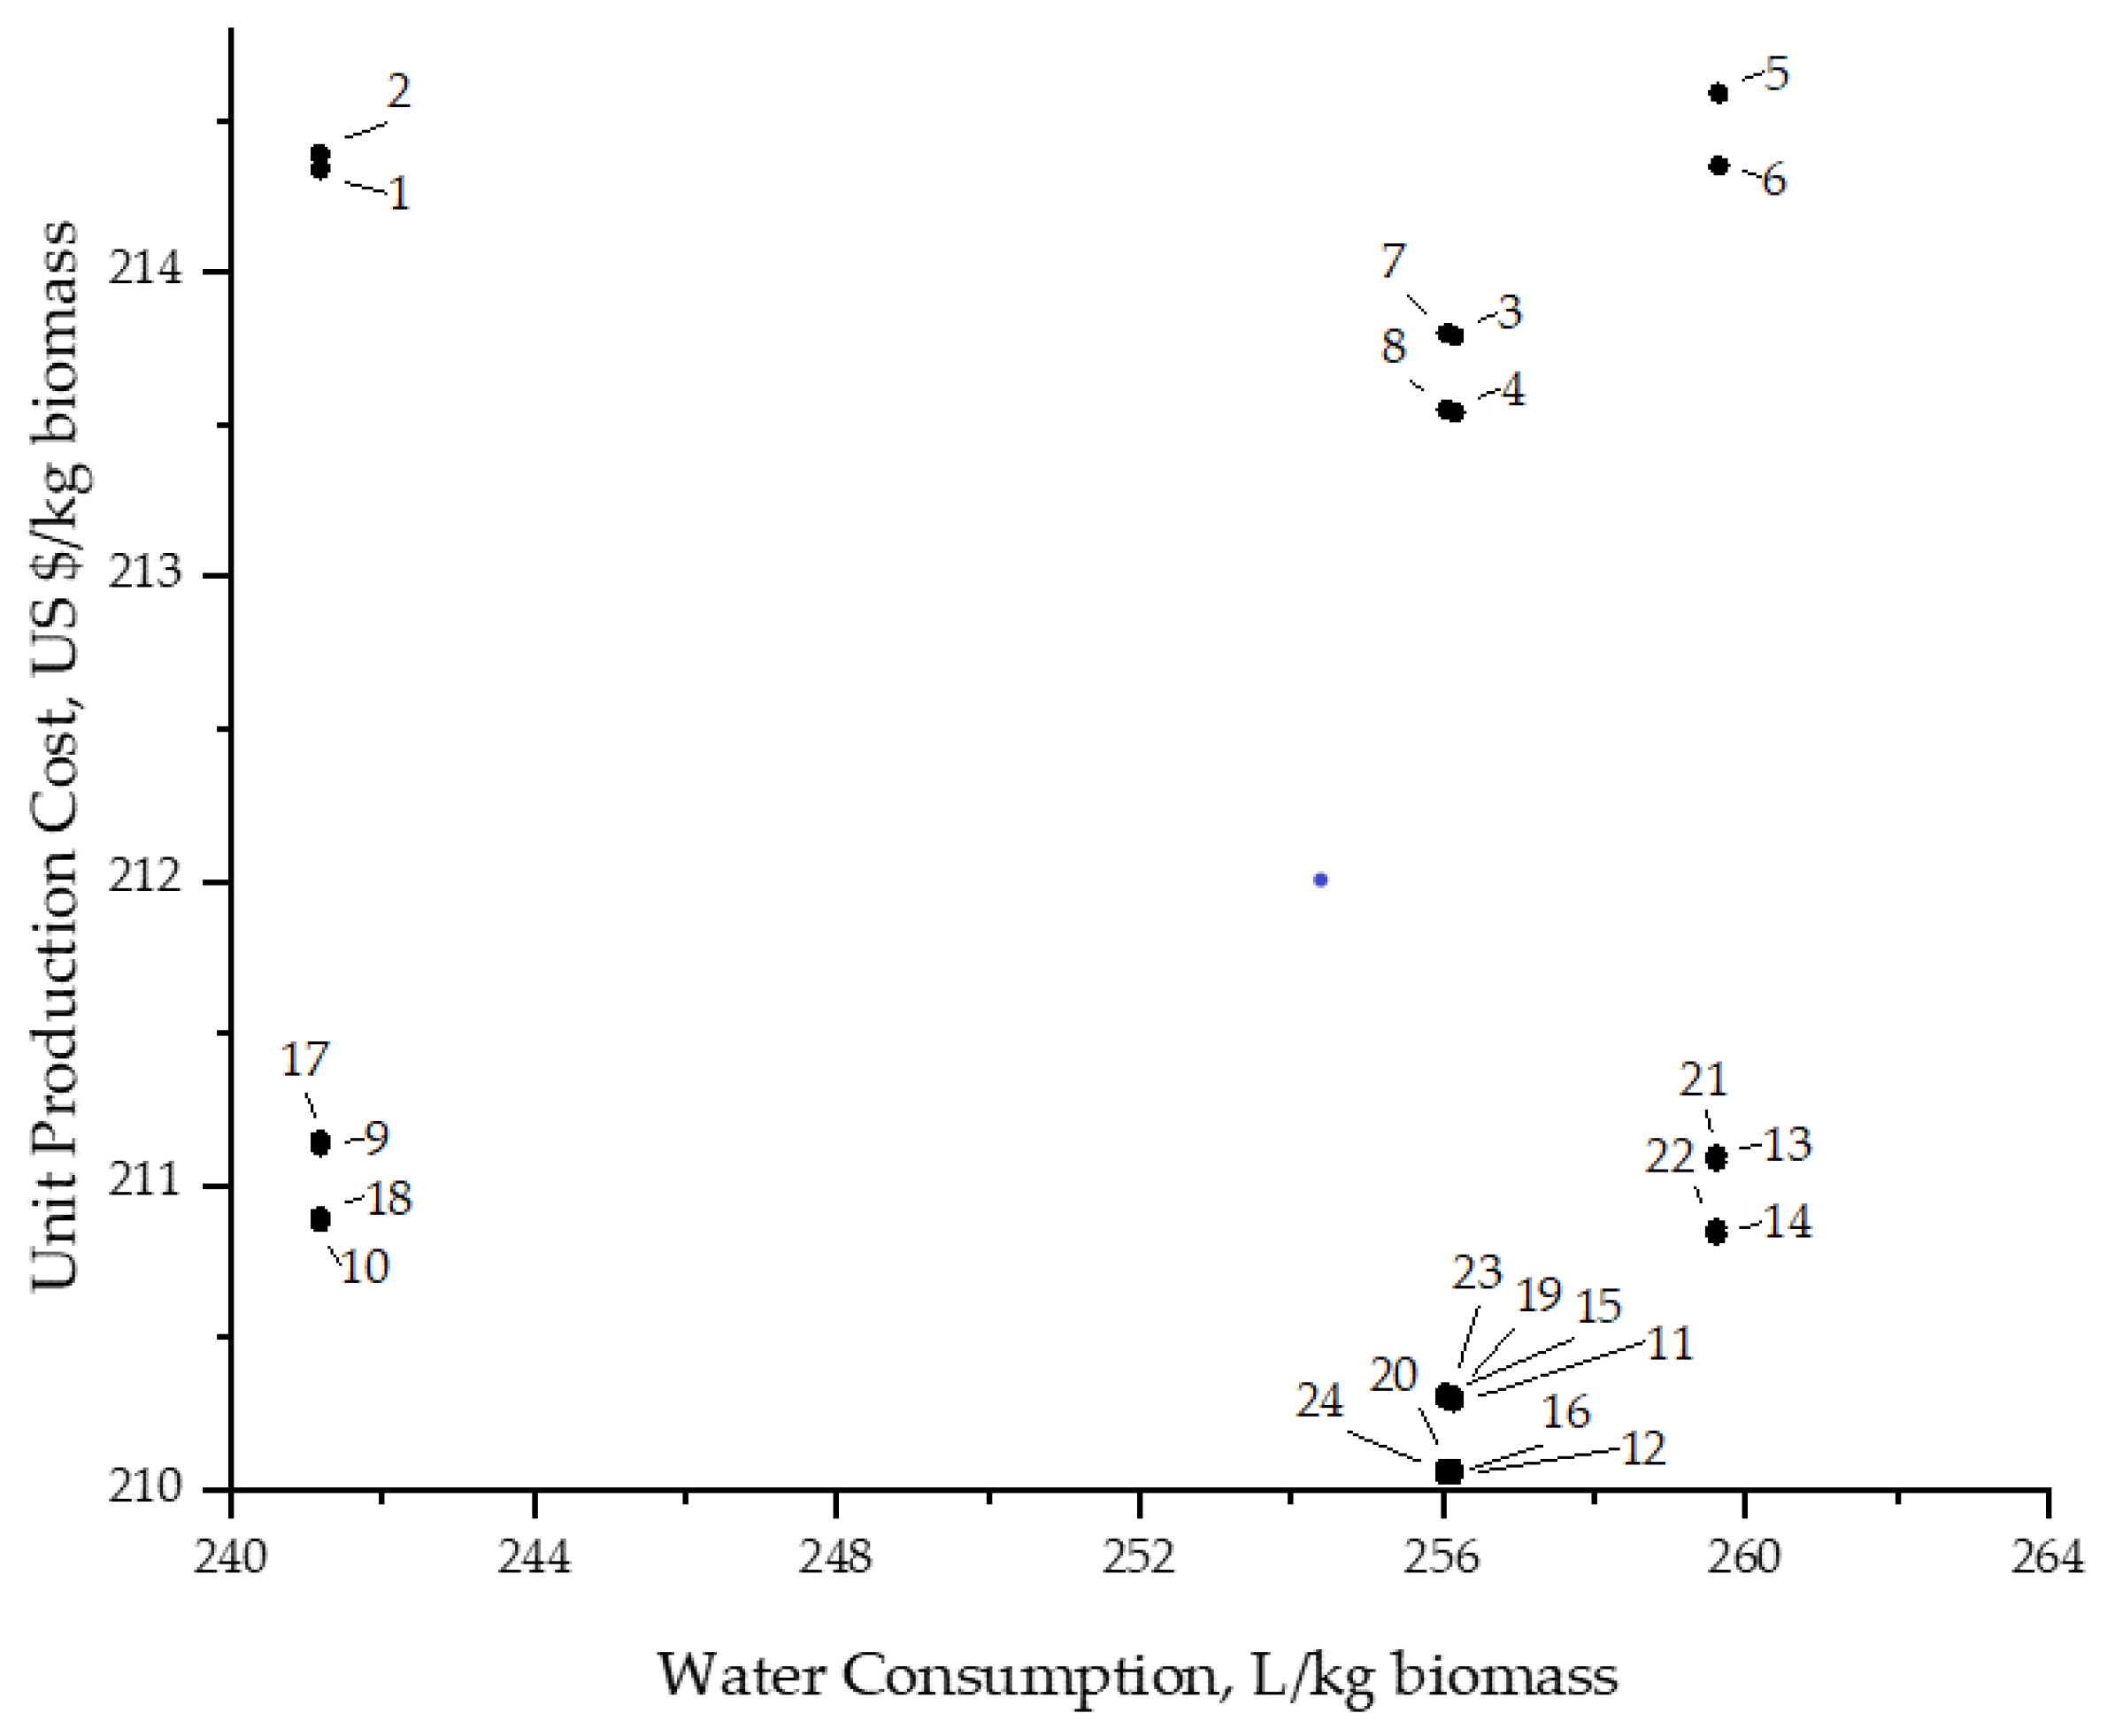
3.4. Comparison of Scenarios, Energy and Water Consumption vs. Production Cost per kg of Biomass Produced

To compare the scenarios under the same basis, the energy consumption, fresh water consumption and the cost of production were determined per scenario to produce 1 kg of dry biomass (Figure 8 and Figure 9). Regarding energy consumption and production cost shown in Figure 8, two groups of scenarios are observed, the first (located in the upper right corner) with high energy consumption and production cost (scenarios 1 to 8), and the second (located in the lower left corner) with low energy consumption and low production costs (scenarios 9 to 24). In the first group, they have the characteristic of using NaOH as flocculant. This group of scenarios has the lowest biomass production compared to the rest of the scenarios, this is due to the flocculation efficiency in the primary harvest. In this group, it is observed that scenarios 1 and 2 are those with the highest energy consumption and production cost, they consider the secondary harvest with centrifugation (technology with the highest production cost) and only differ in the drying technology. In the second group are the scenarios that use FeCl3 and Chitosan. Similar scenarios, that is, they use the same technology for secondary harvest and drying, and that they only differ in the type of flocculant, show the same energy consumption and only differ in the cost of production. The scenarios that consider Chitosan have a slightly higher cost of production than the scenarios that use FeCl3. In this second group it is clearly observed that scenarios 16 and 24 are the ones with the lowest energy consumption (both 12.10 kWh/kg) and production cost. The production cost for scenarios 16 and 24 are US $210.05/kg and US $210.07/kg, respectively, practically the same. In general, it is observed that the scenarios that consider pressure filter in the secondary harvest (case D4), for example, scenarios 7, 8, 15, 16, 23 and 24, are those with the lowest energy consumption and production cost. On the contrary, those scenarios that consider centrifugation in the secondary harvest (case D1) are those with the highest energy consumption and production cost (scenarios 1, 2, 9, 10, 17 and 18).
Estimates of both energy consumption and production cost are high due to the kind of cultivation system considered depending on which other production systems they are compared to. These results allow knowing estimates regarding the energy consumption and production cost of the process (if the purpose is the production of biomass through photobioreactors) considering the operating conditions established for this study. In a similar study reported by Weschler et al. [42], it was determined that the energy consumption to produce 1000 kg of dry biomass, grown in PBR, is from 4500 kWh to 8200 kWh approximately (depending on the technologies considered for each process stage). Regarding the costs of biomass production, there is a wide variety of reports in the literature. Hoffman et al. [63] report that biomass production in open systems (open raceway ponds) can have a value of $510/ton of wet biomass produced, and, although the cost of biomass production can still be increased when considering the biomass drying, this would probably still be much lower than that determined in our study. Regarding production costs from closed systems, specifically in PBR, Jorquera et al. [43] estimate biomass production at US $9.54/kg and Norsker et al. [24] report a cost of €4.15/kg. Davis et al. [64] report the cost of lipid production at $18.10/gal. As we can see, there is a great variety in the estimates of the cost of biomass production, however, most are only evaluations of a specific scenario, which complicates the comparison with other production scenarios.
Another relevant datum in the design of biomass production scenarios from the cultivation in PBR is to determine the consumption of fresh water. Several authors mention that fresh water consumption may be lower when biomass is grown in closed systems, compared to open systems. In this study, a consumption of 16,872 m3/year of fresh water was determined, only for the biomass cultivation stage, including the preculture. In a previous study [56], a consumption of 58,061 m3/year of fresh water was calculated for cultivation in the raceway pond (open system), considering 1 ha as the cultivation surface, the same as in this study. This indicates that up to 71% of the water needed for the culture can be saved if it is considered in PBR. To analyze the impact of fresh water consumption in the different scenarios, consumption was compared to the cost of production per kg of biomass produced (Figure 9).
In Figure 9, four groups of scenarios are observed, (1) the scenarios with the highest fresh water consumption and highest production cost (located in the upper right corner, scenarios 3, 4, 5, 6, 7 and 8); (2) the scenarios with lower consumption of fresh water, but higher production cost (located in the upper left corner, scenarios 1 and 2); (3) the scenarios with the lowest production cost, but with high consumption of fresh water (located in the lower right corner, scenarios 11, 12, 13, 14, 15, 16, 19, 20, 21, 22, 23 and 24); and (4) the scenarios with lower consumption of fresh water and lower production cost (located in the lower left corner, scenarios 9, 10, 17 and 18). All scenarios require fresh water for the cultivation stage in PBR and in the secondary harvest, if they use the filtration technologies. The filtering technology consumes fresh water to wash the biomass and try to remove the largest amount of mineral residues that are accompanying the biomass.
Group 1 scenarios have the characteristic of using NaOH as a flocculant, and as mentioned before, these scenarios are the ones that present the lowest biomass production compared to the rest of the scenarios, although their fresh water consumptions are similar. Group 2 scenarios use centrifugation for secondary harvest, saving fresh water consumption at this stage. The scenarios of group 3, where the majority are found, consider the filtration technologies for the secondary harvest, this causes the consumption of fresh water to increase. From this group, it is observed that scenarios 12, 16, 20 and 24 are the ones with the lowest water consumption and the lowest production cost. These scenarios use vacuum filter (scenarios 12 and 20) and pressure filter (scenarios 16 and 24) for secondary harvest. In group 4, there are the scenarios that consider centrifugation for the secondary harvest and, although they are not the ones with the lowest production cost, they are the scenarios with the lowest consumption of fresh water.
These results allow to know estimates on energy consumption, fresh water con-sumption and the cost of production under different technological scenarios, when the purpose is to obtain biomass through photobioreactors.

3.5. Classification of the Scenarios Depending on the Use of Biomass

The selection of the type of flocculant determines the final use of the biomass since some can become highly toxic and limit its use [31]. Recirculation of the culture medium after harvest is desirable and this can also be limited by the type of flocculant [61]. In this study, production scenarios were evaluated that consider three types of flocculants for the primary harvest, which act with different mechanisms to achieve agglomeration and sedimentation of the biomass. In addition to the techno-economic evaluation of microalgal biomass production scenarios, an analysis was carried out of the probable use of the biomass in the different analyzed scenarios, according to what was consulted in the literature. This must be taken into account if you want to implement a microalgal biomass production system. The three flocculants analyzed were NaOH, FeCl3 and Chitosan.
The use of NaOH increases the pH in the culture causing the production of microalgal flocs. This substance is economical and reduces the biomass bacterial load. Additionally, cell-free medium after flocculation can be recycled, all or partial, back to the culture facilities after reducing the pH [31,61]. However, it should always be analyzed whether recycling the culture medium does not reduce the growth potential of the microalgae. In this study we do not consider recycling the culture medium after harvest, since real data are necessary to show the viability and evidence of being able to do it. On the other hand, according to the estimates of this study, when NaOH is used as a flocculant, 2.59 tons/year are consumed, a much higher quantity compared to FeCl3 and Chitosan (0.63 tons/year and 0.754 tons/year, respectively). This causes the costs associated with the raw material similar to other cases even though NaOH is inexpensive. The scenarios that consider this flocculant (scenarios 1 to 8) belong to the group with the highest energy consumption and production cost per kg of biomass produced (Figure 8). This is because flocculation with NaOH has lower removal efficiency than the other two cases (C2 and C3). Another disadvantage of the scenarios that consider this flocculant is the high energy consumption and production cost, compared to the rest of the scenarios.
The use of iron salts reduces electrostatic repulsion between negatively charged cell surfaces, allowing the formation of cell aggregates [53]. Barros et al. [53] report that it has been shown that the use of ferric salts leads to a yellowish brown coloration of the microalgae, which limits the biomass to use it for the extraction of pigments. Furthermore, the metals used could contaminate this biomass, which makes it difficult to apply it as a raw material for biofuels or as animal feed [53]. In addition, the use of these types of flocculants can cause the sediment of unwanted metals. On the other hand, the cost of FeCl3 for one year of operation is the lowest of the three cases analyzed in the primary harvest (flocculation), US $544/year, which causes the scenarios with this flocculant to be economically competitive with those scenarios using Chitosan (more expensive flocculant, case C3, Figure 8). The removal efficiency is higher for the cases that consider FeCl3 than for those that consider NaOH, and this achieves a higher biomass production for the scenarios that use C2 as a secondary harvest. However, the contamination that the biomass can suffer when using FeCl3 limits its use, and prevents the recovery of the culture medium after harvest, which causes the options to improve the economy of these production scenarios to be reduced, (scenarios 9 to 16). On the other hand, if biomass is to be used for the production of compounds of commercial interest (metal-free), it would be necessary to integrate biomass purification stages, which would increase production costs.
The consumption of Chitosan as a flocculant has been reported as effective and does not contaminate the biomass. However, its high cost limits its implementation if its purpose is not to produce higher quality biomass [53,61]. Divakaran et al. [65] report that the use of Chitosan as flocculant allows the use of the culture medium after harvest and that it can maintain growth by planting with fresh algae cultures. Furthermore, the harvested cells are intact and alive after flocculation and are capable of reproducing and growing. This is an additional advantage in applications where chemicals and drugs must be recovered from biomass free of undesirable and potentially toxic contaminants. Besides, Chitosan is produced from chitin, a structural element in the exoskeletons of crabs and shrimp, which allows it to be produced in a more sustainable way than other synthetic organic polymers [66]. The results of this study show that the scenarios that consider Chitosan as flocculant (scenarios 17 to 24) are within the group of scenarios with lower energy consumption and production cost per kg of biomass produced (Figure 8). According to the aforementioned bibliographic review, the biomass produced in these scenarios has greater advantages over the biomass produced in the scenarios that consider NaOH and FeCl3. Additionally, it was mentioned earlier that scenarios using a drum dryer could be considered less appropriate to obtain high-quality biomass to produce proteins, because the protein denaturation temperature is reached in this equipment [41]. Once the bibliography has been analyzed, considering the quality of biomass and production costs, the scenarios with the potential to produce high-quality biomass are 17, 19, 21 and 23 (Figure 10).
Considering the four scenarios with the highest potential to produce higher quality biomass, and considering energy consumption and unit production cost, scenario 23 has the lowest energy consumption and lowest production cost (12.10 kWh/kg and US $210.32/kg) (Figure 8). Scenario 23 considers flocculation with Chitosan, pressure filter and spray dryer. In Figure 8, it is observed that scenario 24 has slightly lower values than scenario 23, for energy consumption and production cost. However, it has to be considered that scenario 24 uses a drum dryer and this can reduce the quality of the biomass if there is not a good control of the drying temperature.
Energy consumption in all scenarios is high, mainly caused by high energy consumption in the cultivation system. One option to remedy this consumption could be to consider the use of renewable energy sources, either totally or partially, such as solar or wind energy, and with this, minimize CO2 emissions by generating the energy necessary for the process. Regarding the operating cost, this could be reduced by recycling the growing medium after harvest or by using wastewater as a source of nutrients in the growth stage. However, care must be taken with the source of wastewater considered, because this also limits the use of biomass. Goswami et al. [67] report that several studies suggest that the biomass of microalgae that uses wastewater for cultivation cannot be used for food and feed due to the toxic substances in the biomass.
One of the main uses considered for microalgae biomass is as a source of energy, mainly due to lipids. However, for biomass to be considered for this purpose, it is necessary that production costs are competitive with conventional energy production costs. Finally, we suggest that the production scenarios analyzed in this study, due to high energy consumption and high production costs, should be considered to produce high quality biomass oriented towards the food, cosmetic or pharmaceutical industry.

4. Conclusions

It was found that the dry biomass production routes considered in this study are of high energy demand (12.09–12.51 kWh/kg) and with high operating costs (US $210.05–214.59/kg), when compared to other similar studies. This is mainly due to the contribution of the use of tubular photobioreactors as a biomass culture system. However, although PBRs have industrial application for the production of protein, pigments, animal feed, fatty acids and antioxidants [43], and the significant reduction in the consumption of fresh water (compared to open systems for cultivation), there are few studies that analyze and evaluate the implementation of these systems for biomass production. The cultivation stage contributes 96% to 98% of the total energy consumption in the dry biomass production scenarios and 99% of the total production costs, the rest is included in the harvesting and drying stages of the biomass. These results suggest the need to research engineering alternatives to the biomass cultivation system, in order to reduce the operating cost, in addition to biological alternatives that aim to increase biomass productivity.
The scenarios that use NaOH are the scenarios with the highest energy consumption (12.28 kWh/kg to 12.51 kWh/kg) and production cost per kg of dry biomass produced (US $213.54/kg to US $214.59/kg). The scenarios that consider FeCl3 as flocculant have energy consumption similar to those that use Chitosan (12.09 kWh/kg to 12.32 kWh/kg). Regarding the cost of production, it only increases by a minimal amount in these latter scenarios. However, the use of Chitosan as flocculant guarantees the production of higher quality biomass compared to the scenarios with the other flocculants. This offers the option of being able to reuse the growing medium after the secondary harvest and thus reduce production costs. This is favorable for the production of high-quality biomass, which may well be used in the food, cosmetic or pharmaceutical industries. On the other hand, analyzing the individual impact of the technologies involved in secondary harvesting, centrifugation and vacuum filtering are the ones with the highest energy consumption; regarding the cost of production, centrifugation and belt filter press technologies are the ones with the highest cost, mainly due to the high cost of equipment and associated maintenance. In the drying stage, spray drying is the technology with the highest energy consumption and the highest production cost. This causes a direct impact on the scenarios with these technologies.
Additionally, this study estimates a capacity to capture up to 148 tons/ha/year of CO2 by cultivating microalgae in a tubular photobioreactor. This amount depends mainly on the cultivation conditions of the microalgae, that is, the biomass productivity achieved and the spatial configuration of the tubular photobioreactors. Under the same biomass productivity, if some other configuration is implemented to accommodate the tubular photobioreactors on the surface destined for cultivation, ensuring that the amount of light to the photobioreactors is not affected, biomass production and CO2 capture on this surface could be increased. Fresh water consumption is lower for biomass culture in a photobioreactor compared to open culture systems; even so, the consumption of fresh water could be further reduced, using wastewater or recirculating the culture medium after harvest (primary and secondary) towards the culture in the photobioreactor, and additionally the consumption of fresh nutrients would also be reduced. However, to consider this proposal, the type of wastewater and the type of flocculant must be taken into account, as this can cause contamination in the biomass or limit the growth of the biomass.
This study shows that biomass production from tubular photobioreactor culture is expensive, however, water savings could be the main criterion for choosing this type of system if you plan to install this process in a place where there is limited fresh water, or if a source of energy or high quality biomass is required to obtain products of commercial interest. On the other hand, in energy terms, the process may not be sustainable, however, there are ways to obtain renewable energy from other sources, which could be included as an energy source to reduce the impact associated with energy consumption in the process, for example, the use of wind energy, solar energy, among others. Finally, this study allows us to compare various technologies involved in the process to produce microalgae biomass and analyze the impact on energy consumption and production cost, giving us a clear vision of the contribution of each technology in the process. This allows us to develop comparative scenarios to evaluate different aspects of microalgal biomass production from a specific species.

Author Contributions

Conceptualization, E.M.V.-G., M.G.B.-S. and J.B.-F.; methodology, E.M.V.-G.; software, E.M.V.-G. and M.A.P.-P.; validation, M.d.l.Á.O.-A., A.G.-L. and M.G.B.-S.; formal analysis, E.M.V.-G., J.B.-F. and M.G.B.-S.; investigation, E.M.V.-G., M.A.P.-P., M.d.l.Á.O.-A., J.B.-F., A.G.-L. and M.G.B.-S.; writing—original draft preparation, E.M.V.-G.; writing—review and editing, M.A.P.-P., M.d.l.Á.O.-A., J.B.-F., A.G.-L. and M.G.B.-S.; supervision, E.M.V.-G. and M.G.B.-S.; project administration, E.M.V.-G. All authors have read and agreed to the published version of the manuscript.

Funding

This research received no external funding.

Institutional Review Board Statement

Not applicable.

Informed Consent Statement

Not applicable.

Data Availability Statement

Not applicable.

Acknowledgments

The authors are thankful their institutions (Universidad Juárez Autónoma de Tabasco and Tecnológico Nacional de México in Celaya) for the support provided for the development of the research.

Conflicts of Interest

The authors declare no conflict of interest.

References

  1. Huang, G.; Chen, F.; Wei, D.; Zhang, X.; Chen, G. Biodiesel production by microalgal biotechnology. Appl. Energy 2010, 87, 38–46. [Google Scholar] [CrossRef]
  2. Mata, T.M.; Martins, A.A.; Caetano, N.S. Microalgae for biodiesel production and other applications: A review. Renew. Sustain. Energy Rev. 2010, 14, 217–232. [Google Scholar] [CrossRef] [Green Version]
  3. Spolaore, P.; Joannis-Cassan, C.; Duran, E.; Isambert, A. Commercial applications of microalgae. J. Biosci. Bioeng. 2006, 101, 87–96. [Google Scholar] [CrossRef] [PubMed] [Green Version]
  4. Rajesh Banu, J.; Preethi; Kavitha, S.; Gunasekaran, M.; Kumar, G. Microalgae based biorefinery promoting circular bioeconomy-techno economic and life-cycle analysis. Bioresour. Technol. 2020, 302, 122822. [Google Scholar] [CrossRef] [PubMed]
  5. Matter, A.I.; Bui, K.V.; Jung, M.; Seo, Y.J.; Kim, Y.-E.; Lee, Y.-C.; Oh, Y.-K. Flocculation Harvesting Techniques for Microalgae: A Review. Appl. Sci. 2019, 9, 3069. [Google Scholar] [CrossRef] [Green Version]
  6. Raheem, A.; Prinsen, P.; Vuppaladadiyam, A.K.; Zhao, M.; Luque, R. A review on sustainable microalgae based biofuel and bioenergy production: Recent developments. J. Clean. Prod. 2018, 181, 42–59. [Google Scholar] [CrossRef]
  7. Jez, S.; Spinelli, D.; Fierro, A.; Dibenedetto, A.; Aresta, M.; Busi, E.; Basosi, R. Comparative life cycle assessment study on environmental impact of oil production from micro-algae and terrestrial oilseed crops. Bioresour. Technol. 2017, 239, 266–275. [Google Scholar] [CrossRef] [PubMed]
  8. Khoo, K.S.; Chew, K.W.; Yew, G.Y.; Leong, W.H.; Chai, Y.H.; Show, P.L.; Chen, W.-H. Recent advances in downstream processing of microalgae lipid recovery for biofuel production. Bioresour. Technol. 2020, 304, 122996. [Google Scholar] [CrossRef] [PubMed]
  9. Banerjee, S.; Ramaswamy, S. Dynamic process model and economic analysis of microalgae cultivation in open raceway ponds. Algal Res. 2017, 26, 330–340. [Google Scholar] [CrossRef]
  10. Rawat, I.; Ranjith Kumar, R.; Mutanda, T.; Bux, F. Biodiesel from microalgae: A critical evaluation from laboratory to large scale production. Appl. Energy 2013, 103, 444–467. [Google Scholar] [CrossRef]
  11. Brennan, L.; Owende, P. Biofuels from microalgae—A review of technologies for production, processing, and extractions of biofuels and co-products. Renew. Sustain. Energy Rev. 2010, 14, 557–577. [Google Scholar] [CrossRef]
  12. Schiano di Visconte, G.; Spicer, A.; Chuck, J.C.; Allen, J.M. The Microalgae Biorefinery: A Perspective on the Current Status and Future Opportunities Using Genetic Modification. Appl. Sci. 2019, 9, 4793. [Google Scholar] [CrossRef] [Green Version]
  13. Zhu, L. Biorefinery as a promising approach to promote microalgae industry: An innovative framework. Renew. Sustain. Energy Rev. 2015, 41, 1376–1384. [Google Scholar] [CrossRef]
  14. Baral, S.S.; Singh, K.; Sharma, P. The potential of sustainable algal biofuel production using CO2 from thermal power plant in India. Renew. Sustain. Energy Rev. 2015, 49, 1061–1074. [Google Scholar] [CrossRef]
  15. Khan, S.A.; Rashmi; Hussain, M.Z.; Prasad, S.; Banerjee, U.C. Prospects of biodiesel production from microalgae in India. Renew. Sustain. Energy Rev. 2009, 13, 2361–2372. [Google Scholar] [CrossRef]
  16. Chisti, Y. Biodiesel from microalgae. Biotechnol. Adv. 2007, 25, 294–306. [Google Scholar] [CrossRef] [PubMed]
  17. Rezvani, S.; Moheimani, N.R.; Bahri, P.A. Techno-economic assessment of CO2 bio-fixation using microalgae in connection with three different state-of-the-art power plants. Comput. Chem. Eng. 2016, 84, 290–301. [Google Scholar] [CrossRef] [Green Version]
  18. Choudhary, P.; Srivastava, R.K. Techno-economic case study: Bio-fixation of industrial emissions at an Indian oil and gas plant. J. Clean. Prod. 2020, 266, 121820. [Google Scholar] [CrossRef]
  19. Duarte, J.H.; Costa, J.A.V. Synechococcus nidulans from a thermoelectric coal power plant as a potential CO2 mitigation in culture medium containing flue gas wastes. Bioresour. Technol. 2017, 241, 21–24. [Google Scholar] [CrossRef]
  20. Kao, C.-Y.; Chen, T.-Y.; Chang, Y.-B.; Chiu, T.-W.; Lin, H.-Y.; Chen, C.-D.; Chang, J.-S.; Lin, C.-S. Utilization of carbon dioxide in industrial flue gases for the cultivation of microalga Chlorella sp. Bioresour. Technol. 2014, 166, 485–493. [Google Scholar] [CrossRef]
  21. Lu, W.; Asraful Alam, M.; Liu, S.; Xu, J.; Parra Saldivar, R. Critical processes and variables in microalgae biomass production coupled with bioremediation of nutrients and CO2 from livestock farms: A review. Sci. Total Environ. 2020, 716, 135247. [Google Scholar] [CrossRef] [PubMed]
  22. Thomassen, G.; Egiguren Vila, U.; Van Dael, M.; Lemmens, B.; Van Passel, S. A techno-economic assessment of an algal-based biorefinery. Clean Technol. Environ. Policy 2016, 18, 1849–1862. [Google Scholar] [CrossRef]
  23. Singh, J.; Dhar, D.W. Overview of Carbon Capture Technology: Microalgal Biorefinery Concept and State-of-the-Art. Front. Mar. Sci. 2019, 6, 29. [Google Scholar] [CrossRef] [Green Version]
  24. Norsker, N.H.; Barbosa, M.J.; Vermuë, M.H.; Wijffels, R.H. Microalgal production—A close look at the economics. Biotechnol. Adv. 2011, 29, 24–27. [Google Scholar] [CrossRef]
  25. Olivieri, G.; Salatino, P.; Marzocchella, A. Advances in photobioreactors for intensive microalgal production: Configurations, operating strategies and applications. J. Chem. Technol. Biotechnol. 2014, 89. [Google Scholar] [CrossRef]
  26. Suparmaniam, U.; Lam, M.K.; Uemura, Y.; Lim, J.W.; Lee, K.T.; Shuit, S.H. Insights into the microalgae cultivation technology and harvesting process for biofuel production: A review. Renew. Sustain. Energy Rev. 2019, 115, 109361. [Google Scholar] [CrossRef]
  27. Tan, X.B.; Lam, M.K.; Uemura, Y.; Lim, J.W.; Wong, C.Y.; Lee, K.T. Cultivation of microalgae for biodiesel production: A review on upstream and downstream processing. Chin. J. Chem. Eng. 2018, 26, 17–30. [Google Scholar] [CrossRef]
  28. Chew, K.W.; Yap, J.Y.; Show, P.L.; Suan, N.H.; Juan, J.C.; Ling, T.C.; Lee, D.-J.; Chang, J.-S. Microalgae biorefinery: High value products perspectives. Bioresour. Technol. 2017, 229, 53–62. [Google Scholar] [CrossRef]
  29. Hess Sandra, K.; Lepetit, B.; Kroth Peter, G.; Mecking, S. Production of chemicals from microalgae lipids—Status and perspectives. Eur. J. Lipid Sci. Technol. 2017, 120, 1700152. [Google Scholar] [CrossRef] [Green Version]
  30. Cheah, W.Y.; Show, P.L.; Chang, J.-S.; Ling, T.C.; Juan, J.C. Biosequestration of atmospheric CO2 and flue gas-containing CO2 by microalgae. Bioresour. Technol. 2015, 184, 190–201. [Google Scholar] [CrossRef]
  31. Gerardo, M.L.; Van Den Hende, S.; Vervaeren, H.; Coward, T.; Skill, S.C. Harvesting of microalgae within a biorefinery approach: A review of the developments and case studies from pilot-plants. Algal Res. 2015, 11, 248–262. [Google Scholar] [CrossRef]
  32. Kyzas, G.Z.; Matis, K.A. Electroflotation process: A review. J. Mol. Liq. 2016, 220, 657–664. [Google Scholar] [CrossRef]
  33. Rashid, N.; Ur Rehman, M.S.; Sadiq, M.; Mahmood, T.; Han, J.-I. Current status, issues and developments in microalgae derived biodiesel production. Renew. Sustain. Energy Rev. 2014, 40, 760–778. [Google Scholar] [CrossRef]
  34. Hosseinizand, H.; Lim, C.J.; Webb, E.; Sokhansanj, S. Economic analysis of drying microalgae Chlorella in a conveyor belt dryer with recycled heat from a power plant. Appl. Therm. Eng. 2017, 124, 525–532. [Google Scholar] [CrossRef]
  35. Show, K.-Y.; Lee, D.-J.; Chang, J.-S. Algal biomass dehydration. Bioresour. Technol. 2013, 135, 720–729. [Google Scholar] [CrossRef] [PubMed]
  36. Behera, B.; Aly, N.; Balasubramanian, P. Biophysical model and techno-economic assessment of carbon sequestration by microalgal ponds in Indian coal based power plants. J. Clean. Prod. 2019, 221, 587–597. [Google Scholar] [CrossRef]
  37. Juneja, A.; Murthy, G.S. Evaluating the potential of renewable diesel production from algae cultured on wastewater: Techno-economic analysis and life cycle assessment. AIMS Energy 2017, 5, 239–257. [Google Scholar] [CrossRef]
  38. Kumar, A.K.; Sharma, S.; Dixit, G.; Shah, E.; Patel, A. Techno-economic analysis of microalgae production with simultaneous dairy effluent treatment using a pilot-scale High Volume V-shape pond system. Renew. Energy 2020, 145, 1620–1632. [Google Scholar] [CrossRef]
  39. Musa, M.; Doshi, A.; Brown, R.; Rainey, T.J. Microalgae dewatering for biofuels: A comparative techno-economic assessment using single and two-stage technologies. J. Clean. Prod. 2019, 229, 325–336. [Google Scholar] [CrossRef]
  40. Deconinck, N.; Muylaert, K.; Ivens, W.; Vandamme, D. Innovative harvesting processes for microalgae biomass production: A perspective from patent literature. Algal Res. 2018, 31, 469–477. [Google Scholar] [CrossRef]
  41. Fasaei, F.; Bitter, J.H.; Slegers, P.M.; van Boxtel, A.J.B. Techno-economic evaluation of microalgae harvesting and dewatering systems. Algal Res. 2018, 31, 347–362. [Google Scholar] [CrossRef]
  42. Weschler, M.K.; Barr, W.J.; Harper, W.F.; Landis, A.E. Process energy comparison for the production and harvesting of algal biomass as a biofuel feedstock. Bioresour. Technol. 2014, 153, 108–115. [Google Scholar] [CrossRef] [PubMed]
  43. Jorquera, O.; Kiperstok, A.; Sales, E.A.; Embiruçu, M.; Ghirardi, M.L. Comparative energy life-cycle analyses of microalgal biomass production in open ponds and photobioreactors. Bioresour. Technol. 2010, 101, 1406–1413. [Google Scholar] [CrossRef] [PubMed]
  44. Quinn, J.C.; Davis, R. The potentials and challenges of algae based biofuels: A review of the techno-economic, life cycle, and resource assessment modeling. Bioresour. Technol. 2015, 184, 444–452. [Google Scholar] [CrossRef] [Green Version]
  45. Rouf, S.A.; Douglas, P.L.; Moo-Young, M.; Scharer, J.M. Computer simulation for large scale bioprocess design. Biochem. Eng. J. 2001, 8, 229–234. [Google Scholar] [CrossRef]
  46. Duarte, J.H.; Fanka, L.S.; Costa, J.A.V. Utilization of simulated flue gas containing CO2, SO2, NO and ash for Chlorella fusca cultivation. Bioresour. Technol. 2016, 214, 159–165. [Google Scholar] [CrossRef]
  47. Acién, F.G.; Fernández, J.M.; Magán, J.J.; Molina, E. Production cost of a real microalgae production plant and strategies to reduce it. Biotechnol. Adv. 2012, 30, 1344–1353. [Google Scholar] [CrossRef]
  48. Kuo, C.-M.; Chen, T.-Y.; Lin, T.-H.; Kao, C.-Y.; Lai, J.-T.; Chang, J.-S.; Lin, C.-S. Cultivation of Chlorella sp. GD using piggery wastewater for biomass and lipid production. Bioresour. Technol. 2015, 194, 326–333. [Google Scholar] [CrossRef]
  49. Ummalyma, S.B.; Gnansounou, E.; Sukumaran, R.K.; Sindhu, R.; Pandey, A.; Sahoo, D. Bioflocculation: An alternative strategy for harvesting of microalgae—An overview. Bioresour. Technol. 2017, 242, 227–235. [Google Scholar] [CrossRef]
  50. Pragya, N.; Pandey, K.K.; Sahoo, P.K. A review on harvesting, oil extraction and biofuels production technologies from microalgae. Renew. Sustain. Energy Rev. 2013, 24, 159–171. [Google Scholar] [CrossRef]
  51. Vandamme, D.; Foubert, I.; Muylaert, K. Flocculation as a low-cost method for harvesting microalgae for bulk biomass production. Trends Biotechnol. 2013, 31, 233–239. [Google Scholar] [CrossRef] [Green Version]
  52. Lama, S.; Muylaert, K.; Karki, T.B.; Foubert, I.; Henderson, R.K.; Vandamme, D. Flocculation properties of several microalgae and a cyanobacterium species during ferric chloride, chitosan and alkaline flocculation. Bioresour. Technol. 2016, 220, 464–470. [Google Scholar] [CrossRef] [Green Version]
  53. Barros, A.I.; Gonçalves, A.L.; Simões, M.; Pires, J.C.M. Harvesting techniques applied to microalgae: A review. Renew. Sustain. Energy Rev. 2015, 41, 1489–1500. [Google Scholar] [CrossRef] [Green Version]
  54. Silva, C.; Soliman, E.; Cameron, G.; Fabiano, L.A.; Seider, W.D.; Dunlop, E.H.; Coaldrake, A.K. Commercial-Scale Biodiesel Production from Algae. Ind. Eng. Chem. Res. 2014, 53, 5311–5324. [Google Scholar] [CrossRef]
  55. Christenson, L.; Sims, R. Production and harvesting of microalgae for wastewater treatment, biofuels, and bioproducts. Biotechnol. Adv. 2011, 29, 686–702. [Google Scholar] [CrossRef] [PubMed]
  56. Kwiatkowski, J.R.; McAloon, A.J.; Taylor, F.; Johnston, D.B. Modeling the process and costs of fuel ethanol production by the corn dry-grind process. Ind. Crops Prod. 2006, 23, 288–296. [Google Scholar] [CrossRef]
  57. Valdovinos-García, E.M.; Barajas-Fernández, J.; Olán-Acosta, M.D.; Petriz-Prieto, M.A.; Guzmán-López, A.; Bravo-Sánchez, M.G. Techno-Economic Study of CO2 Capture of a Thermoelectric Plant Using Microalgae (Chlorella vulgaris) for Production of Feedstock for Bioenergy. Energies 2020, 13, 413. [Google Scholar] [CrossRef] [Green Version]
  58. Razzak, S.A.; Ali, S.A.M.; Hossain, M.M.; deLasa, H. Biological CO2 fixation with production of microalgae in wastewater—A review. Renew. Sustain. Energy Rev. 2017, 76, 379–390. [Google Scholar] [CrossRef]
  59. Hapońska, M.; Clavero, E.; Salvadó, J.; Farriol, X.; Torras, C. Pilot scale dewatering of Chlorella sorokiniana and Dunaliella tertiolecta by sedimentation followed by dynamic filtration. Algal Res. 2018, 33, 118–124. [Google Scholar] [CrossRef]
  60. Vandamme, D.; Foubert, I.; Fraeye, I.; Meesschaert, B.; Muylaert, K. Flocculation of Chlorella vulgaris induced by high pH: Role of magnesium and calcium and practical implications. Bioresour. Technol. 2012, 105, 114–119. [Google Scholar] [CrossRef] [Green Version]
  61. Schlesinger, A.; Eisenstadt, D.; Bar-Gil, A.; Carmely, H.; Einbinder, S.; Gressel, J. Inexpensive non-toxic flocculation of microalgae contradicts theories; overcoming a major hurdle to bulk algal production. Biotechnol. Adv. 2012, 30, 1023–1030. [Google Scholar] [CrossRef] [PubMed]
  62. Show, K.-Y.; Yan, Y.-G.; Lee, D.-J. Chapter 7—Algal biomass harvesting and drying. In Biofuels from Algae, 2nd ed.; Pandey, A., Chang, J.-S., Soccol, C.R., Lee, D.-J., Chisti, Y., Eds.; Elsevier: Amsterdam, The Netherlands, 2019; pp. 135–166. ISBN 978-0-444-64192-2. [Google Scholar]
  63. Hoffman, J.; Pate, R.C.; Drennen, T.; Quinn, J.C. Techno-economic assessment of open microalgae production systems. Algal Res. 2017, 23, 51–57. [Google Scholar] [CrossRef] [Green Version]
  64. Davis, R.; Aden, A.; Pienkos, P.T. Techno-economic analysis of autotrophic microalgae for fuel production. Appl. Energy 2011, 88, 3524–3531. [Google Scholar] [CrossRef]
  65. Divakaran, R.; Sivasankara Pillai, V.N. Flocculation of algae using chitosan. J. Appl. Phycol. 2002, 14, 419–422. [Google Scholar] [CrossRef]
  66. Udom, I.; Zaribaf, B.H.; Halfhide, T.; Gillie, B.; Dalrymple, O.; Zhang, Q.; Ergas, S.J. Harvesting microalgae grown on wastewater. Bioresour. Technol. 2013, 139, 101–106. [Google Scholar] [CrossRef] [PubMed]
  67. Goswami, R.K.; Mehariya, S.; Verma, P.; Lavecchia, R.; Zuorro, A. Microalgae-based biorefineries for sustainable resource recovery from wastewater. J. Water Process Eng. 2021, 40, 101747. [Google Scholar] [CrossRef]
Figure 1. Summary of technologies included in the different process stages to produce microalgae biomass. Adapted from [56].
Applsci 11 04386 g001
Figure 2. Flowsheet for the cultivation stage (technology B).
Applsci 11 04386 g002
Figure 3. Flowsheet for the harvesting section (primary and secondary) and drying stage, of scenario 1 (case C, D and E).
Applsci 11 04386 g003
Figure 4. Flowsheet for the harvesting section (primary and secondary) and drying stage, of scenario 12 (case C, D and E).
Applsci 11 04386 g004
Figure 5. Flowsheet for the harvesting section (primary and secondary) and drying stage, of scenario 24 (case C, D and E).
Applsci 11 04386 g005
Figure 6. Distribution of energy consumption in the harvesting and drying stages of biomass. All scenarios are fed from the PBR effluent.
Applsci 11 04386 g006
Figure 7. Distribution of the production cost in the harvesting and drying stages of the biomass. All scenarios are fed from the PBR effluent.
Applsci 11 04386 g007
Figure 8. Total energy consumption vs. total production cost per kg biomass produced.
Applsci 11 04386 g008
Figure 9. Total water consumption vs. total production cost per kg biomass produced.
Applsci 11 04386 g009
Figure 10. Scenarios for the production of high-quality biomass (harvested with Chitosan).
Applsci 11 04386 g010
Table 1. Energy requirement in second stage of harvest.
Technology
(Case)
Energy Consumption
Considered (kWh/m3 Feed)
Energy Consumption
Reference (kWh/m3 Feed)
Centrifugation (D1)8.703.3 [39], 3.6–10.8 [40], 0.7–1.30 [41]
Vacuum filter (D2)5.800.1–5.9 [40], 1.22–5.9 [41]
Belt filter press (D3)0.880.054–0.384 [39], 0.16–0.88 [40]
Pressure filter (D4)0.900.88 [40], 0.5–0.9 [41]
Table 2. Technological scenarios to produce dry microalgae biomass. Adapted from [56].
No.ScenarioNo.ScenarioNo.Scenario
1B-C1-D1-E19B-C2-D1-E117B-C3-D1-E1
2B-C1-D1-E210B-C2-D1-E218B-C3-D1-E2
3B-C1-D2-E111B-C2-D2-E119B-C3-D2-E1
4B-C1-D2-E212B-C2-D2-E220B-C3-D2-E2
5B-C1-D3-E113B-C2-D3-E121B-C3-D3-E1
6B-C1-D3-E214B-C2-D3-E222B-C3-D3-E2
7B-C1-D4-E115B-C2-D4-E123B-C3-D4-E1
8B-C1-D4-E216B-C2-D4-E224B-C3-D4-E2
Table 3. Summary of Results for Primary Harvest (Flocculation).
VariableCase C1Case C2Case C3
Biomass Production (tons/year)77.7378.9178.91
Annual Flocculant Consumption (tons/year)2.590.630.754
Material Cost
(US $/year)
11915441579
Energy Consumption (kWh/year)572057205721
Operating Cost (US $/year)700060007000
Unit Production Cost (US $/kg)0.090.070.09
Table 4. Summary of Results for Secondary Harvest (Centrifugation and Filtering).
VariableCase D1Case D2Case D3Case D4
Biomass Production (tons/year)69.95769.95769.95769.957
Energy Consumption (kWh/year)16,77790279411399
Operating Cost
(US $/year)
76,00015,00071,00015,000
Unit Production Cost (US $/kg)1.080.211.010.21
Table 5. Summary of Results for the Drying stage (Spray Dryer and Drum Dryer).
VariableCase E1Case E2
Biomass Production (tons/year)69.95769.957
Energy Consumption (kWh/year)2,8162,177
Operating Cost (US $/year)37,00019,000
Unit Production Cost (US $/kg)0.530.28
Publisher’s Note: MDPI stays neutral with regard to jurisdictional claims in published maps and institutional affiliations.

