Article

Municipal Solid Waste Management and Waste-to-Energy Potential from Rajshahi City Corporation in Bangladesh

by
Md. Ahasan Habib
1,
Mim Mashrur Ahmed
1,
Muhammad Aziz
2,
Mohd. Rafiqul Alam Beg
1 and
Md. Emdadul Hoque
1,*
1
Department of Mechanical Engineering, Rajshahi University of Engineering & Technology, Rajshahi 6204, Bangladesh
2
Institute of Industrial Science, The University of Tokyo, 4-6-1 Komaba, Meguro-Ku, Tokyo 153-8505, Japan
*
Author to whom correspondence should be addressed.
Appl. Sci. 2021, 11(9), 3744; https://doi.org/10.3390/app11093744
Submission received: 8 March 2021 / Revised: 13 April 2021 / Accepted: 16 April 2021 / Published: 21 April 2021
(This article belongs to the Special Issue New Trends in Waste Management Models)

Abstract

:
Waste management is becoming one of the most challenging tasks for developing countries in order to ensure good human health, as well as a healthy environment. Rajshahi City Corporation (RCC) is one of the 12 city corporations in Bangladesh. Various environmental and human health problems have arisen due to a lack of proper knowledge of waste management. Thus, the aim of this work is to illustrate the present status of MSW generation and management in Rajshahi City Corporation, Bangladesh. Fifty households were selected throughout RCC for waste collection, which represent approximately all types of households in RCC. From the qualitative and quantitative analysis, it is estimated that the approximate MSW generation in RCC is 358.19 t/d (tons/day) at an approximate rate of 0.4214 kg/person/d. Calorific values of the wastes have also been determined using the ultimate analysis results of the MSW. A higher calorific value of the dry MSW has been calculated as 14.9 MJ/kg. Moisture content of the MSW has been found to be 48.28%. It is also estimated that the possible power generation (steam energy to electrical power) from MSW generated in RCC is 159.40 MWh/d. Lastly, future scopes of MSW management and different waste management measures that need to be taken are illustrated. Waste-to-energy (WTE) conversion has been given priority and anaerobic digestion (AD) has been found to be an interesting prospect in this sector. Techno-economic analysis of the AD has been conducted. Energy potential from the proposed plant has been calculated as 3.85 MW and the payback period has been found to be 4.9 years. It has been observed that employing AD on a large scale can not only reduce the waste, but also meet a large portion of the energy demand of this city.

1. Introduction

Municipal solid waste (MSW) management is one of the most crucial challenges for developing and under-developed countries. Developed countries produce more waste compared to that of the others. However, they have good management systems as they invest a large portion of money in this management sector. In developing countries like Bangladesh, MSW management is a major problem, as it involves a lot of expenditure. Additionally, people give little attention towards waste management. MSW generation increases with population growth and urbanization. It is becoming more challenging, as more land is needed to dispose the waste [1]. A rapid increase in MSW can cause high environmental pollution and various hazards to the inhabitants. MSW management is not only a technical problem, but rather different political, legal, environmental and economic factors influence the system [2]. In most of the cities of Bangladesh, including Rajshahi City Corporation (RCC), MSW is dumped in open fields, which is not an ideal way to dispose solid waste because it causes environmental pollution and ecological imbalance. The urban population of Bangladesh is increasing at a high rate of 6% annually and it is concentrated mostly in six major cities, i.e., Dhaka, Rajshahi, Chattogram, Barishal, Sylhet, and Khulna. It is estimated that about 13% of the total population and about 55–60% of the total urban population live in these six major cities [3]. In these cities, the estimated per capita waste generation is about 0.5 kg/d (day), where only 0.2 kg/d of it is carried to disposal sites and the rest is disposed of locally, creating huge environmental problems due to poor management practices [4]. For ensuring ecofriendly cities, the government is trying to find a safe and sustainable solution for the efficient management of solid wastes.
Several studies have been done on MSW management worldwide and in Bangladesh in the past few years. Rana performed a feasibility study of waste to energy (WTE) and power generation in Dhaka city, Bangladesh [5]. He suggested WTE conversion as a solution for the waste management problem in Dhaka. Among a number of methods, composting was found to be convenient for Dhaka, as waste generated in this city is mostly organic. It was assumed that an initial investment of BDT 50 million (Bangladeshi taka) is required, and the payback period would be 7.1 years [5]. In 2008, researchers collected wastes from all household groups, which were segregated and weighed, from Chattogram city, Bangladesh. Waste generation was found to be 1.3 kg/household/d and 0.25 kg/person/d. From the survey, it was found that 44% of the residents were willing to pay USD 0.3 to 0.4 per month to the waste collectors. It was suggested that the service charge should be based on the waste generated by individual households. The study adequately showed that household waste can be converted to resources through segregation at the source [6]. In another work, researchers studied traditional solid waste recycling patterns in Rajshahi City Corporation of Bangladesh. They found that about 1906 people were involved in recycling activities in the city. It was estimated that approximately 28.13 t of solid wastes were handled in the Rajshahi City Corporation area every day. Only five factories were involved in the preliminary processing of recyclable wastes. The main recycled materials were found to be iron, glass, plastic and paper [7]. In 2014, researchers reviewed different MSW types that are currently being used for renewable energy sources. MSW in Bangladesh contains a relatively high proportion of organic matter. They showed that, using a landfill gas recovery process, electricity generation from MSW in six megacities would be approximately 186,408 kWh/d. It was found that WTE incineration systems are the source of large amount of renewable energy in Bangladesh [8]. Another work focused on an improved solid waste management system of Rajshahi City Corporation in Bangladesh. The authors also focused on the characterization and composition of MSW, including moisture content and calorific value. They found that the moisture content was above 60% on average, and the calorific value was found to be 15.51 MJ/kg. Recoverable electrical energy was approximated as 4.482 MWh/d. Lastly, the authors recommended the appropriate technology to be used for MSW disposal in RCC [9]. Islam et al. considered municipal waste and sugarcane bagasse as renewable energy sources. They conducted a study about the quantity of power that can be harnessed from wastes and bagasse, and compared it with the power demand of RCC in Bangladesh. Possible power production from waste was approximated as 119.8 MWh/d and from bagasse, it was approximated as 544 MWh/d [10]. In 2014, an author investigated the generation, characteristics and management of MSW in RCC of Bangladesh and energy generation by the landfill technique. The energy potential from the landfill gas was estimated to be around 5.3 MW from a steam turbine process [11]. Beside Bangladesh, a number of works have been done worldwide on MSW management. In 2015, researchers obtained waste generation and composition data from selected households from each region in Ghana. The rate of waste generation in Ghana was found to be 0.47 kg/person/d. It was also found that households separated their waste effectively, averaging 80% [12]. In China, researchers launched a program focusing on MSW source-separated collection in eight major cities in 2011. Considering the status of MSW management, source-separated collection was given high priority. It has been encouraged to separate recyclable and kitchen wastes at the source. As stakeholders play an important role in waste management, it was suggested to explain their responsibilities to them clearly [13].
It is clear that, in the last few years, researchers have worked on illustrating waste management systems in different major cities of Bangladesh. A number of works have been done on the waste management scenario in RCC, Bangladesh [7,14,15]. Possible energy generation was also estimated by various methods [9,11,16,17]. The main aim of this research is to estimate daily MSW generation in RCC and to estimate electric potential from the generated MSW. This work also suggests a suitable waste management plan. Anaerobic digestion has been suggested for implementation in RCC to reduce waste and convert it into useful energy. Therefore, cost analysis of the anaerobic digestion plant has been provided and the payback period of the proposed plant has been determined. To accomplish the objectives, fifty households of different types were surveyed in this work throughout RCC to analyze the waste generation rate. The analyzed data from the investigated households have been used to estimate overall waste generation per day in RCC. Physical (wet) and chemical (dry) compositions of the collected MSW have been analyzed for a better understanding of MSW characteristics. Finally, the calorific value of the MSW and possible electricity generation have been estimated based on this survey. The present status and future recommendations of MSW management with potential treatment strategies are also suggested in this work. The uniqueness of this work is the execution of a door-to-door survey to get a detailed idea about waste composition and the generation rate throughout the city corporation. The selected families represent approximately all types of families who live in RCC. Therefore, the calculated data can be used to estimate the overall waste generation rate and waste composition of this city with high accuracy.

2. Present Status of MSW Management in RCC, Bangladesh

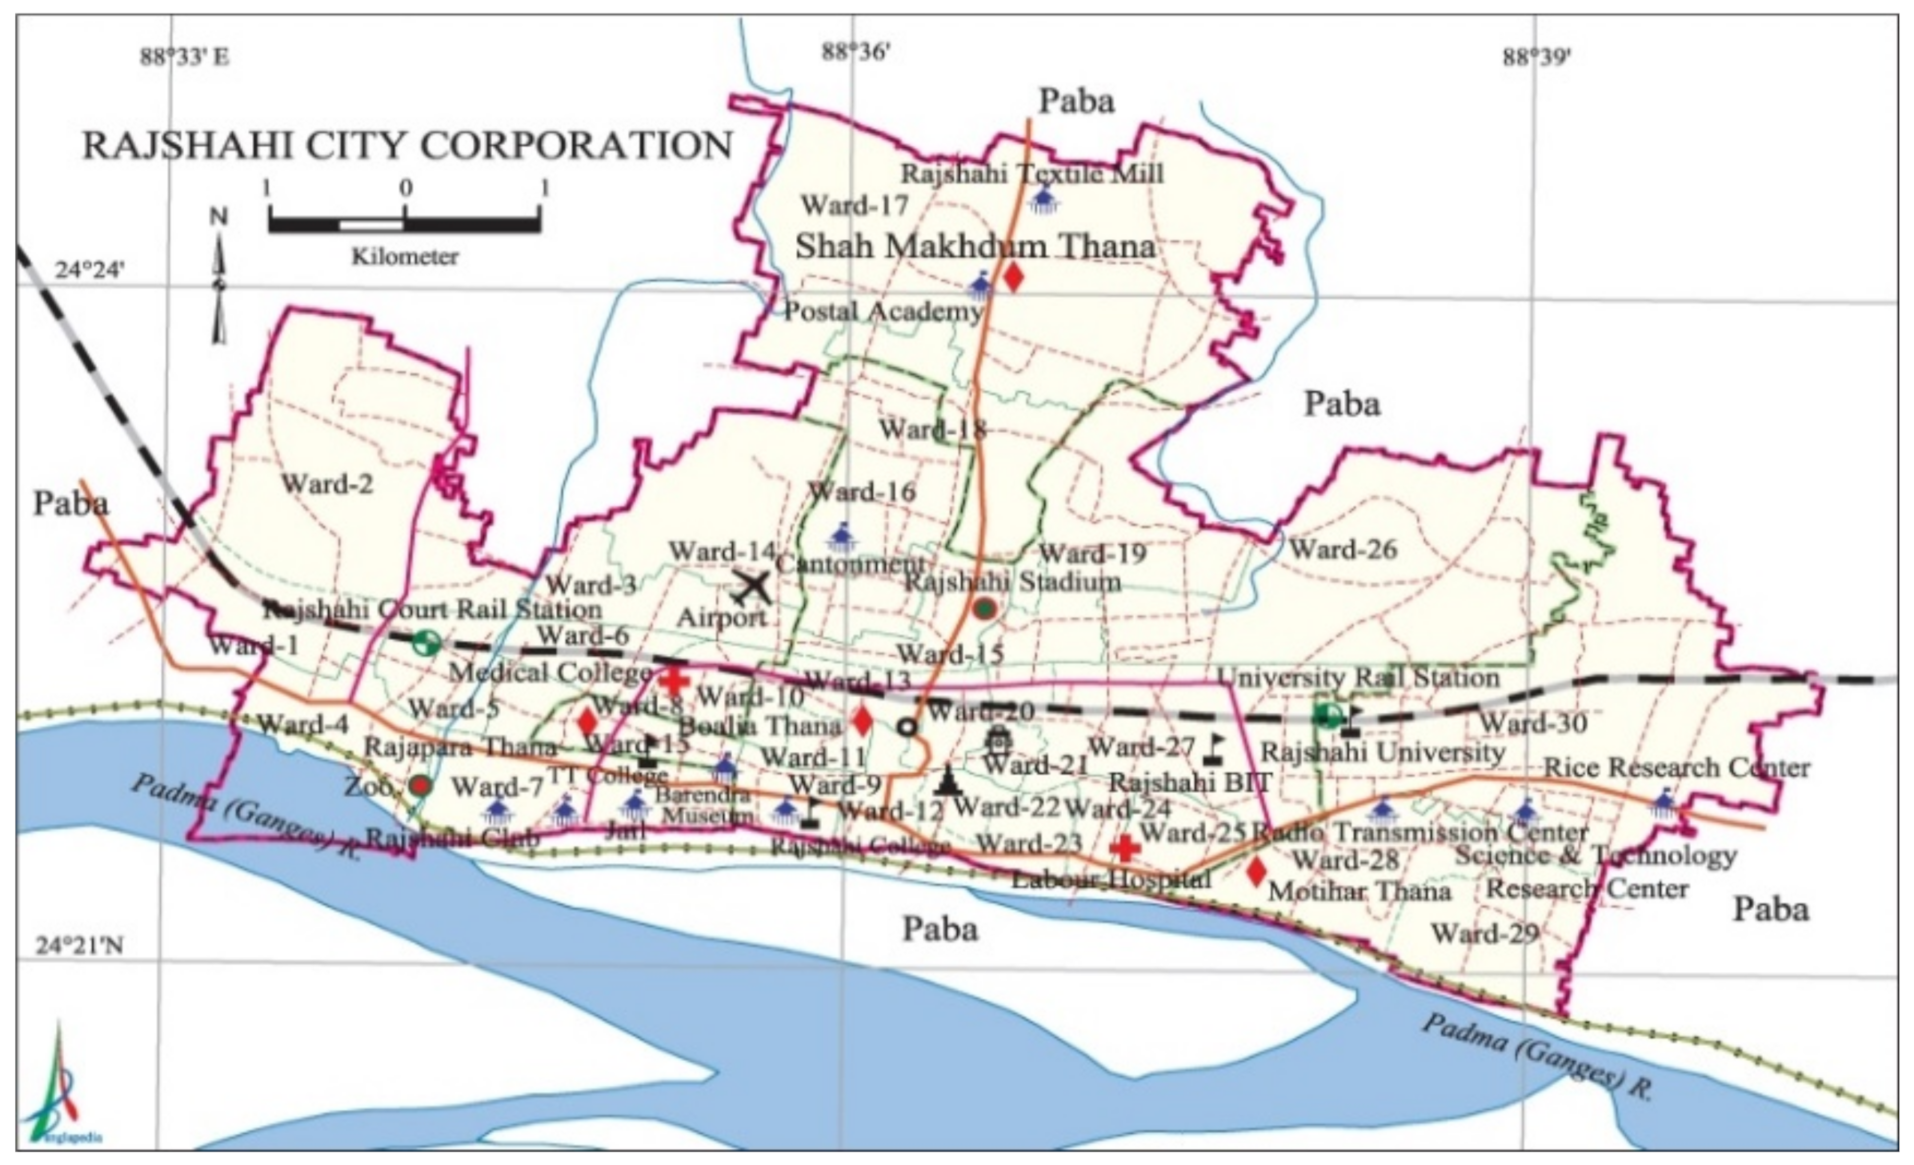
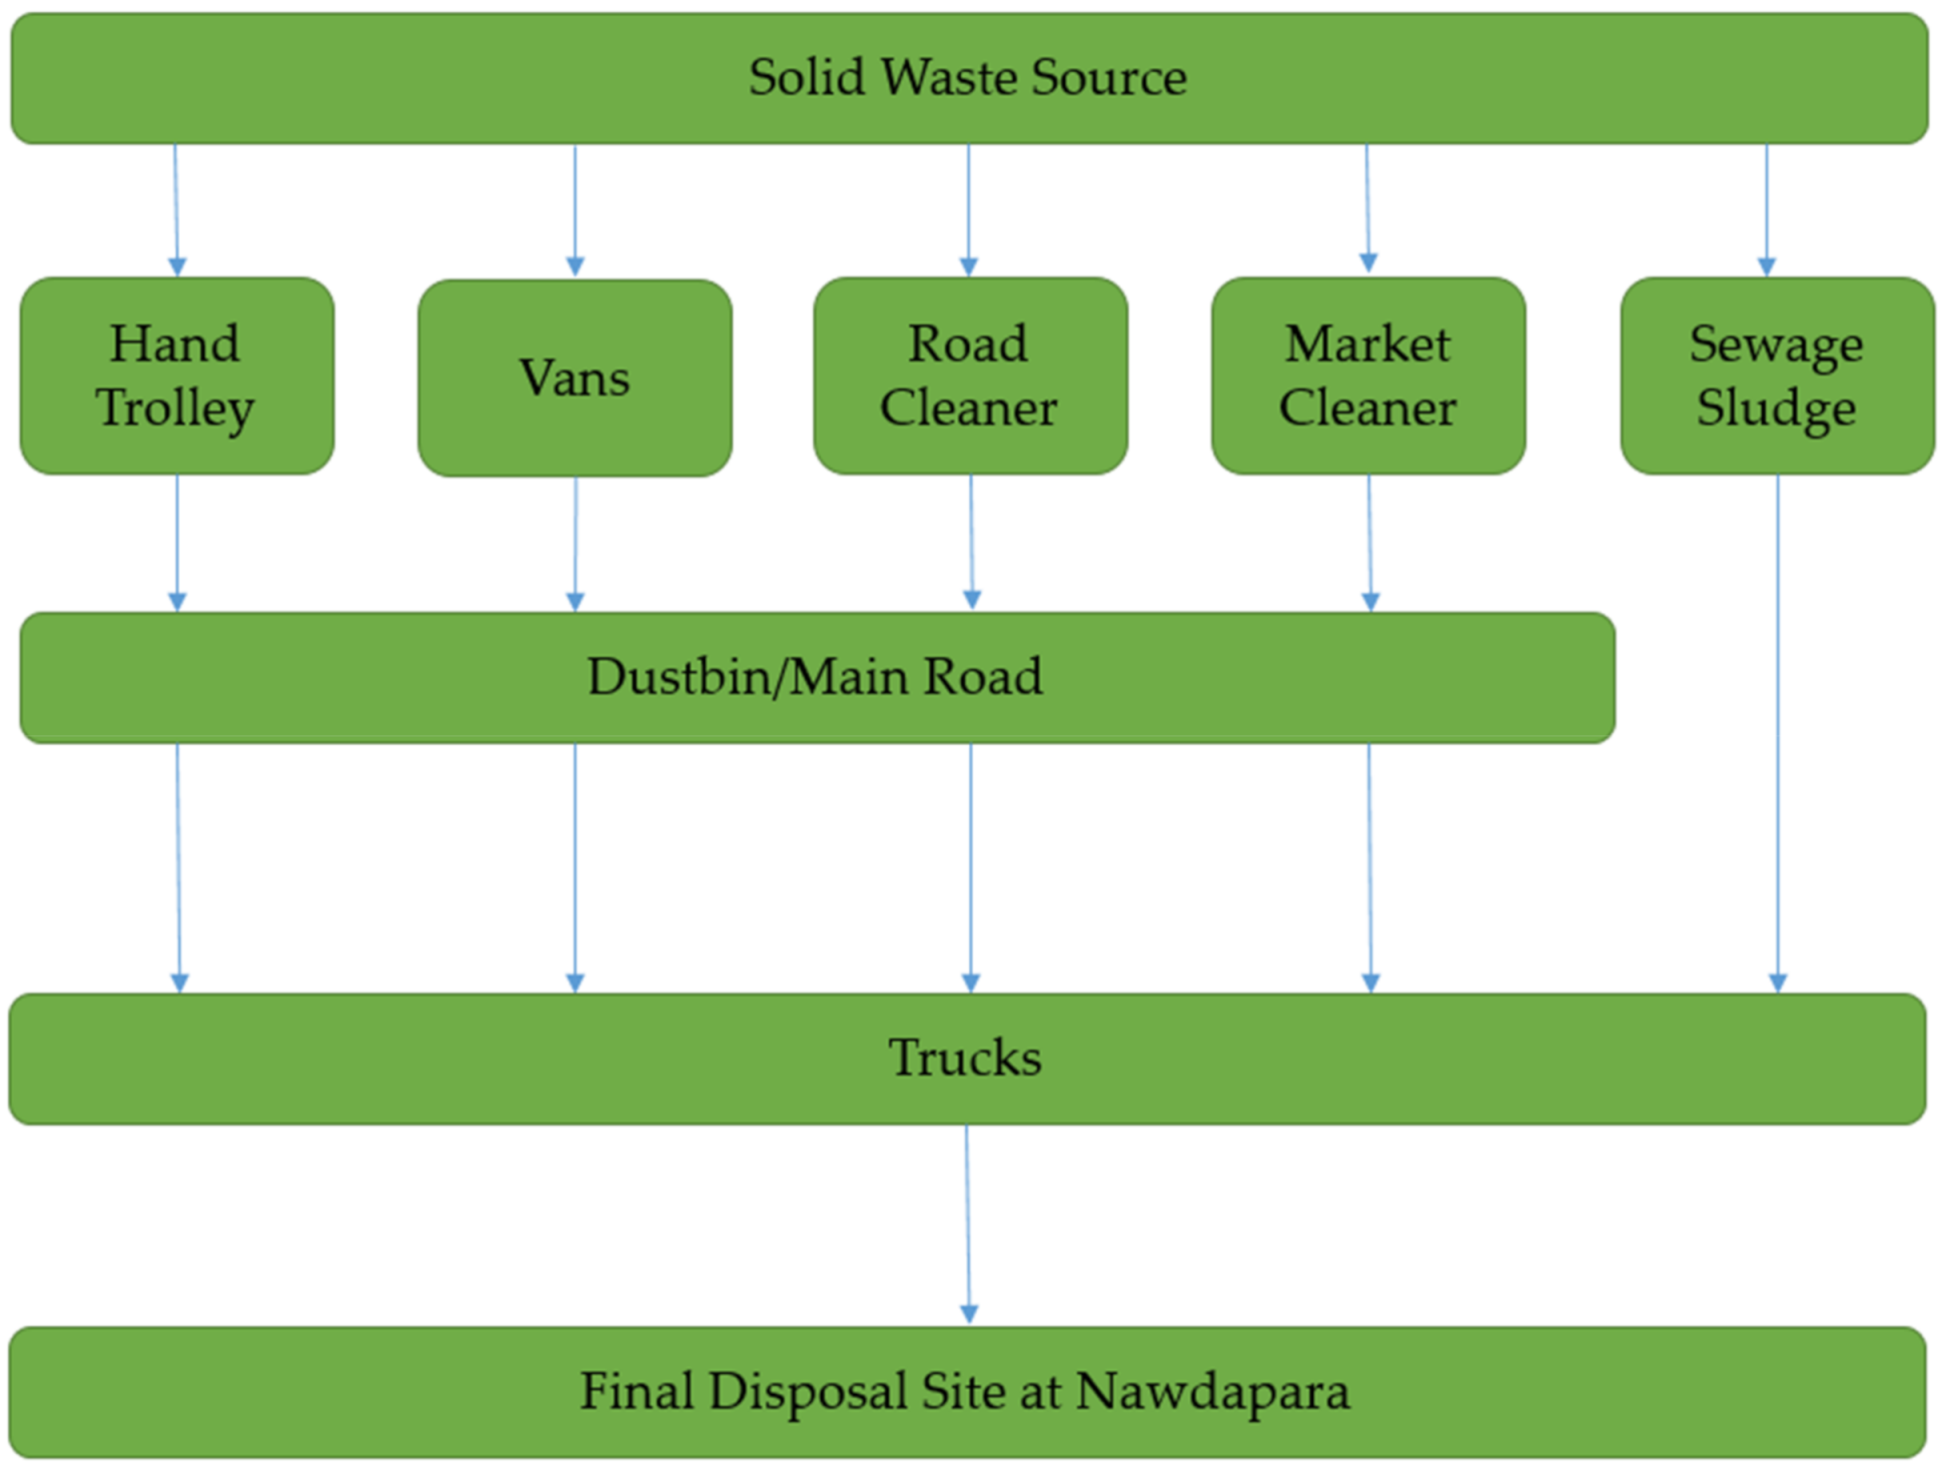
Waste generation is increasing worldwide at an alarming rate. Figure 1 shows the worldwide waste generation scenario, which has been illustrated in annual report of World Bank [18]. From the figure, it is clear that annual waste generation is greatest in East Asia and the Pacific region, at 468 Mt/y (megatons per year), whereas the Middle East and North Africa produce the smallest amount of waste, at 129 Mt/y. Bangladesh is a South Asian country. South Asia stands third in waste generation, at 334 Mt/y. Bangladesh is one of the most densely populated countries with a population of approximately 165 million [19]. Bangladesh has an area of 147,570 km2 and lies between 20°34´ and 26°38´ north latitude and 88°01′ and 92°41′ east longitude. There are twelve city corporations in Bangladesh, including Rajshahi City Corporation. MSW generation per person per day of South Asian countries is illustrated in Figure 2 [20]. It is observed that Bangladesh is the third lowest per capita waste-producing country, and per day MSW generation is approximately 0.41 kg/person. Bangladesh produces less waste per capita compared to most of the South Asian countries. However, improper waste management systems create a variety of problems. Rajshahi stands on the northern bay of the Padma river and is surrounded by the Paba sub-district. RCC is the divisional headquarters of Rajshahi division, and best known as Silk City. The geographical location of the city is 24.05′ to 25.14′ north latitude and 88.09′ to 89.25′ east longitude. The area of the city is 96.69 km2 with an approximate population of 0.85 million. Figure 3 shows a map of Rajshahi City Corporation [21]. The number of sub-districts in RCC is 12, with a total ward number of 30. In 2018, according to the RCC authority, the population of the city was 0.85 million [22]. MSW generation rates per person of the six major cities are approximately equal. Table 1 shows the contribution of different sources in MSW generation of all six major cities, including RCC [23]. Rajshahi is considered as the educational city of Bangladesh due to the presence of many of the educational institutions of the country. Therefore, a large number of students all over the country come here to pursue education. Thus, there are many residences in RCC where the students live and contribute to a major portion of MSW in this city. It is observed that residential solid waste contributes about 77.18% of the total MSW generated in RCC. The physical composition of the solid wastes of six different cities is shown in Table 2 [23]. The literature shows that about 71.1% of MSW comes from food and vegetables in RCC. Finally, Table 3 shows the growth rate of MSW in urban cities in the past few years [24]. It is estimated that, in 2025, the per capita waste generation will be 0.60 kg/d and total MSW generation will be approximately 47,064 t/d. Several solid waste management methods are being followed throughout Bangladesh, such as sanitary landfill, incineration, recovery and recycling and composting. There is one dumping site of 3.5 feet deep with an area of 15.98 acres at Nawdapara and 35 secondary collection points in RCC. A total of 280 t-MSW/d (tons MSW/day) in RCC is disposed of at the disposal area, and another 120 t-MSW/d is collected for composting by people. Nawdapara is situated in ward 17, which is the main dumping site in RCC. As seen from the map of RCC, ward 17 is situated in the middle of the city, which results in a relatively low transportation cost. However, it is not situated in the main city area. As it is relatively far from highly populated area, which creates a less adverse health impact on the people of the city. Due to improper landfilling, wastes spread all over the disposal site, and produce unpleasant odors and cause environmental pollution. Therefore, waste management has become a major problem in RCC like in other cities. WTE can provide a solution to waste disposal in RCC [9]. There are a number of waste management options available, like prevention, reduction, recycling, recovery and disposal. Prevention is the most preferred option, as it is always better than the cure. However, it is not possible to prevent waste generation completely. Disposal is the least preferred method. After prevention, reduction is preferable. By recycling or converting into energy, MSW can be greatly reduced. Table 4 shows the waste management facilities that are available in RCC. Almost all types of garbage trucks have capacities of 5, 3, 2 or 1.5 t, which are used to transport MSW throughout the city. Pushcarts, along with garbage vans, are also used to collect waste, especially in densely populated congested areas. Sometimes, the mismanagement, unskilled handling and transportation of MSW hamper the waste collection procedure and cause environmental pollution. Figure 4 shows the existing MSW management scenario in RCC [9]. Therefore, RCC needs a proper waste management system with possible treatment techniques in order to minimize environmental pollution.

3. Research Methodology

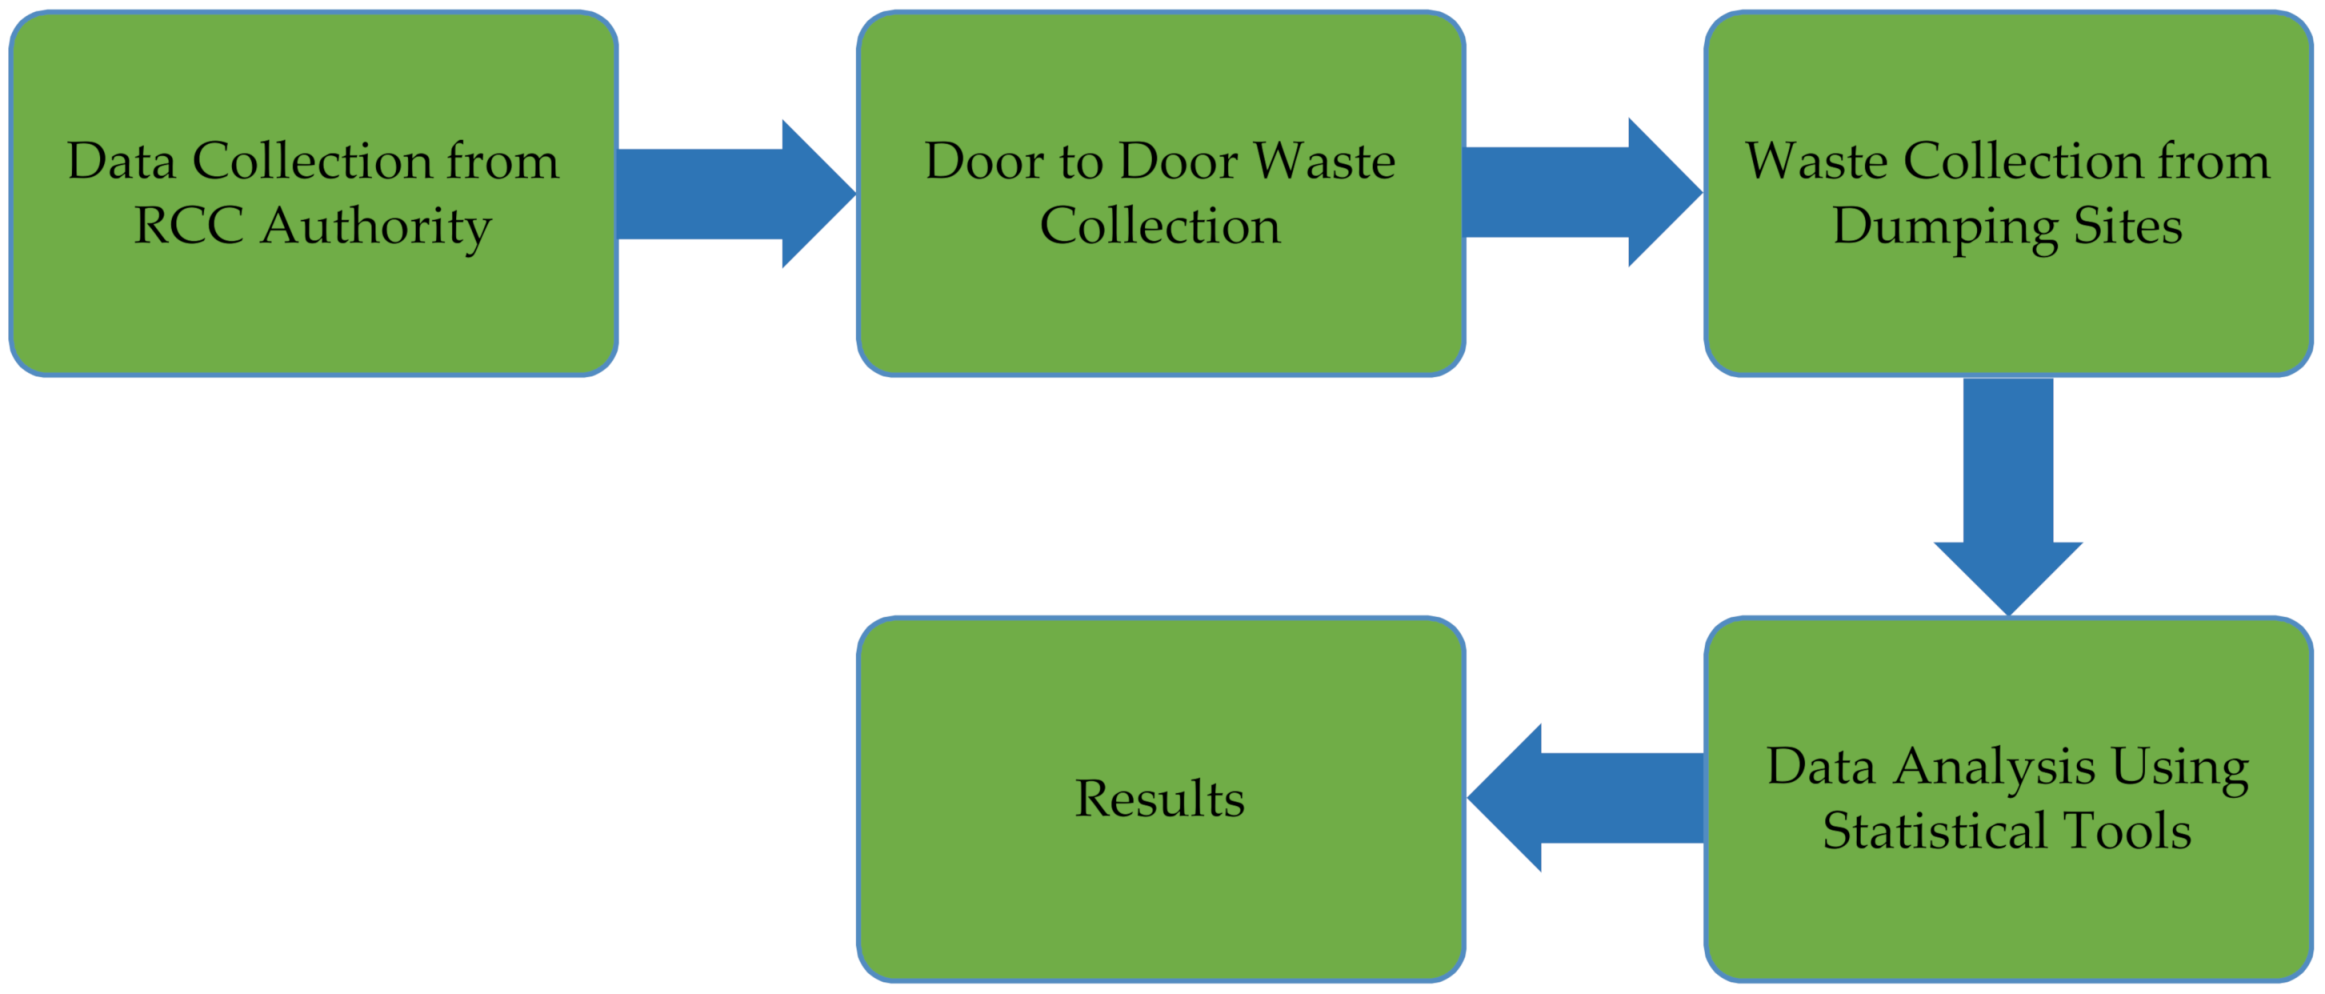
The complete methodology was divided into three sections, i.e., general survey, determination of waste calorific value and, lastly, energy and possible power generation from MSW. Figure 5 presents the flow chart of this research methodology. The entire program of this research is discussed in the following sections.

3.1. Data Collection

Fifty households of different types throughout RCC were selected for a survey. The number of family members, educational level of the interviewee, total waste generation per day, household type, etc. of each household were taken very carefully for further analysis. These fifty households have been selected in such a way that approximately all types of households in RCC have been covered. Therefore, the collected data can be used for calculating the overall waste generation rate of RCC. Chemical composition (dry) tests of the collected MSW were carried out at the Bangladesh Council of Scientific and Industrial Research (BCSIR) and physical analyses (wet) from seven different families were carried out to get an insight into the composition of MSW generated in RCC.

3.2. Calorific Value and Potential Power Generation from MSW

The data obtained from 50 households during the survey were used to estimate the calorific value of MSW, and probable electrical energy that can be generated from it. Firstly, the calorific value of MSW was estimated using Dulong’s formula [25], formulated as:
Heating Value (kJ/kg) = 33800C + 144000(H-O/8) + 9270S,
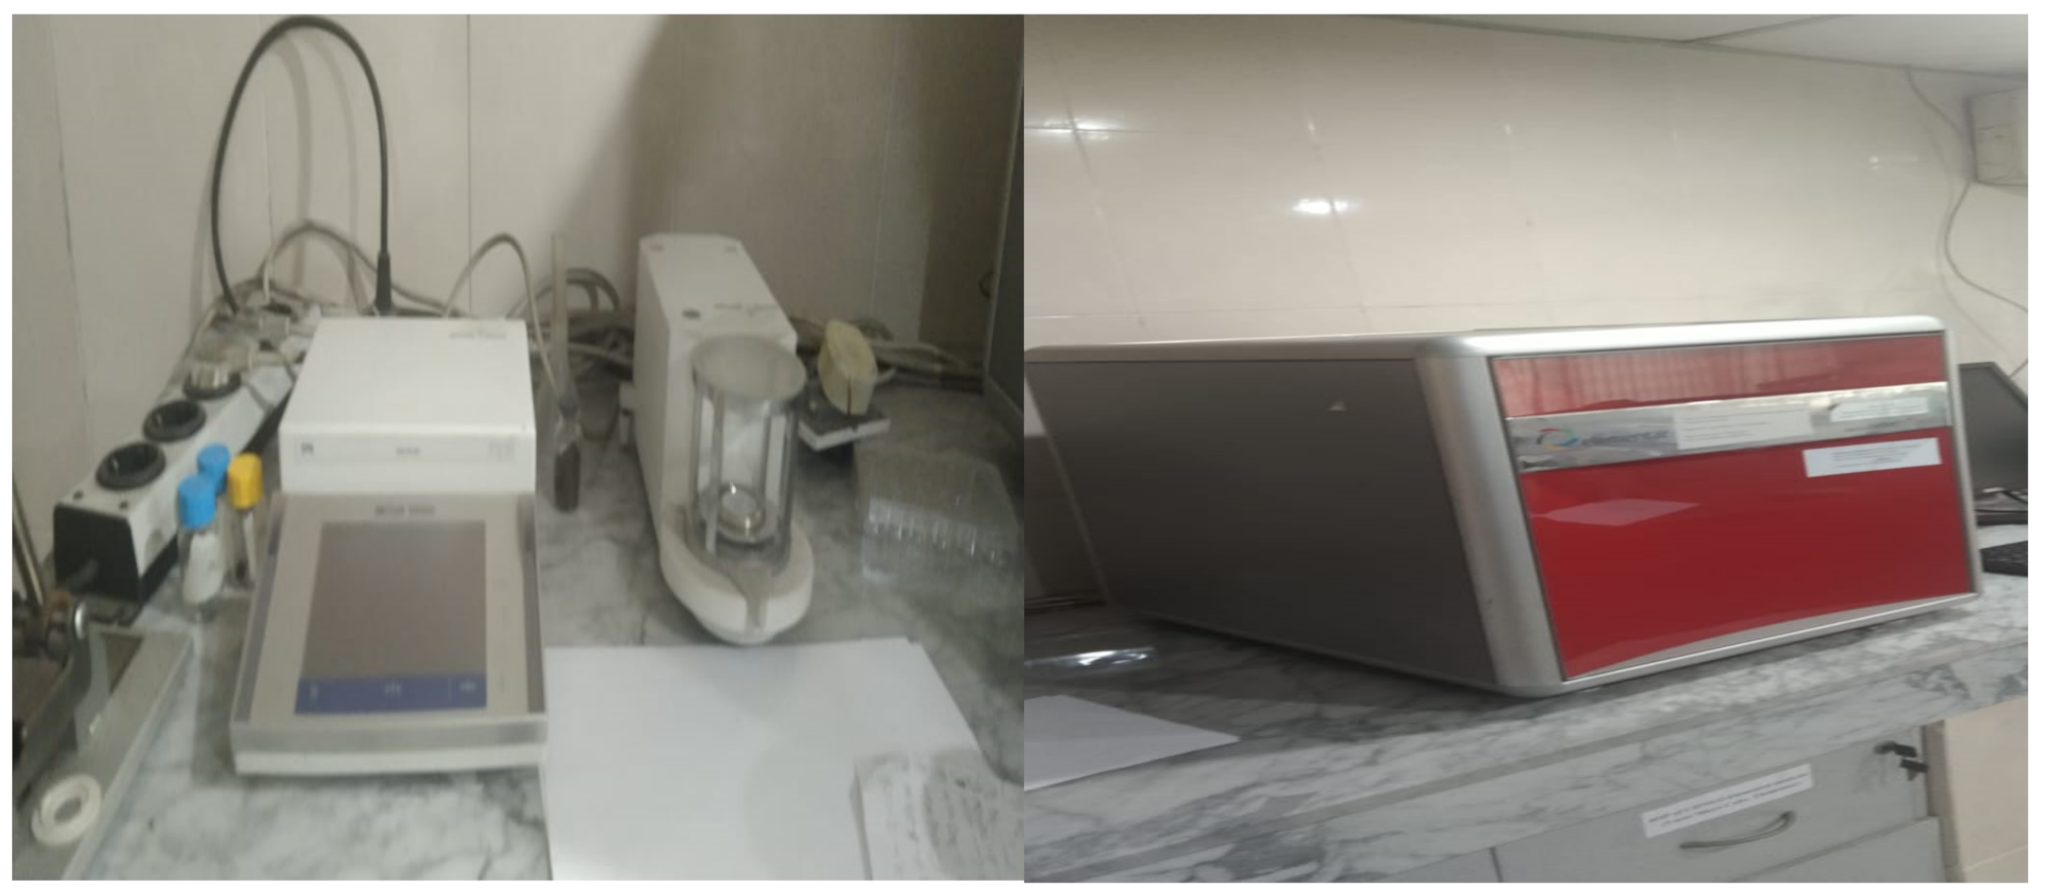
where, C, H, O and S are the carbon, hydrogen, oxygen and sulfur contents (weight %), respectively, in the collected MSW. Elemental analysis of MSW has been carried out at the Bangladesh Council of Scientific and Industrial Research (BCSIR). A CHNSO elemental analyzer (model no.: Vario Micro Cube, Elementar) has been used to determine elemental weight percentages of MSW. The experimental apparatus is illustrated in Figure 6. It is estimated that 70% of total heat energy can be converted into steam energy [26]. Then, from steam energy, net output electrical power was calculated with the following equation [9]:
E NP = E P S A
where
  • E NP = Net electrical power.
  • E P = Electrical power = Steam power/11,395 (kWh/kg).
  • S A = Station service allowance = 0.06 ∗   E P .

4. Results and Discussions

4.1. Estimation of MSW Generation

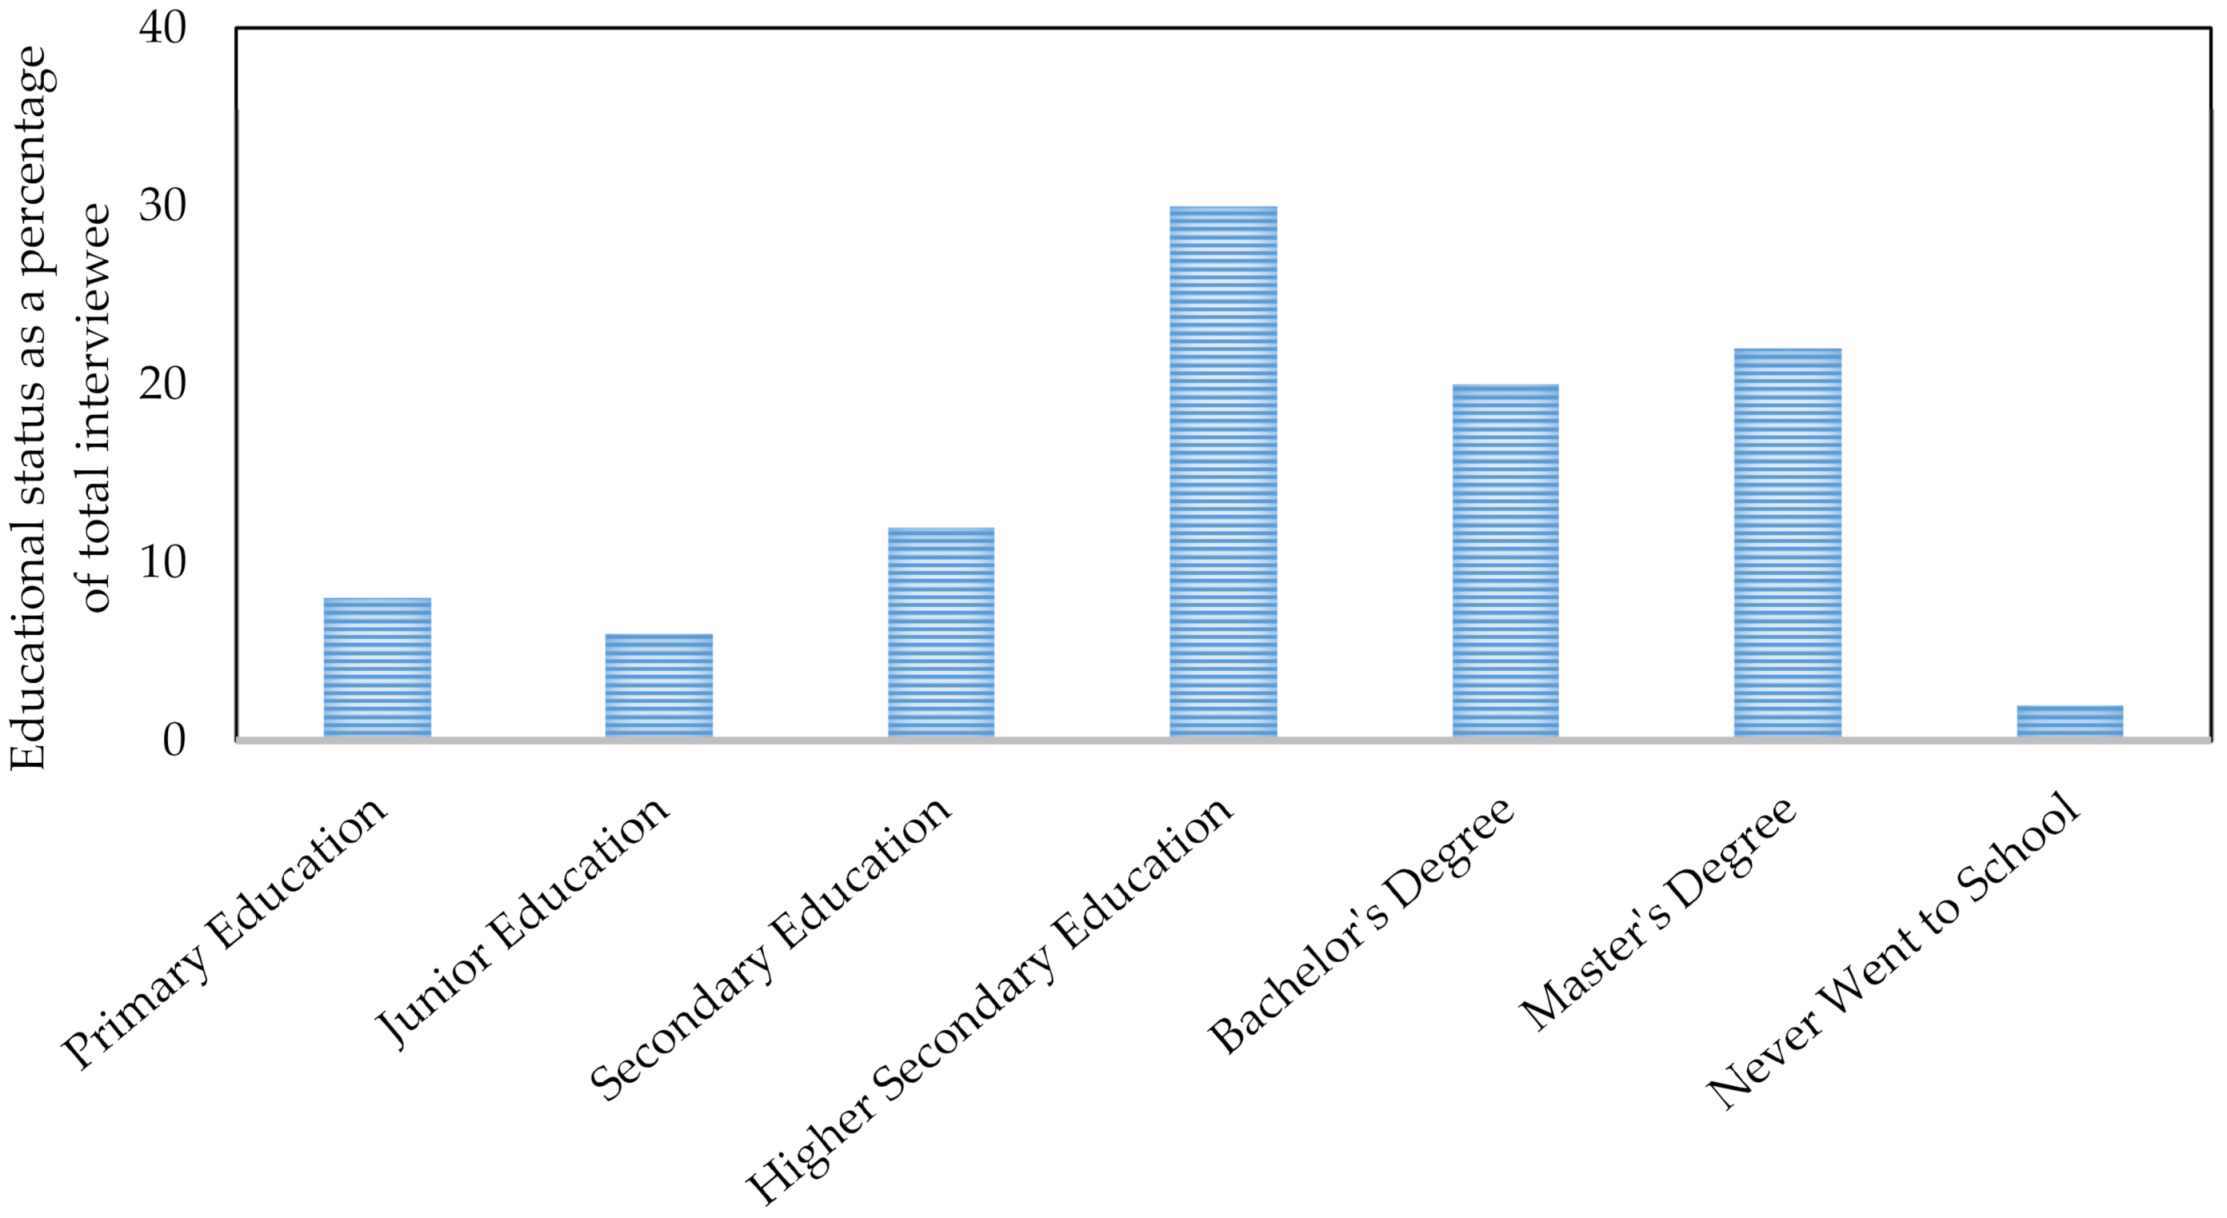
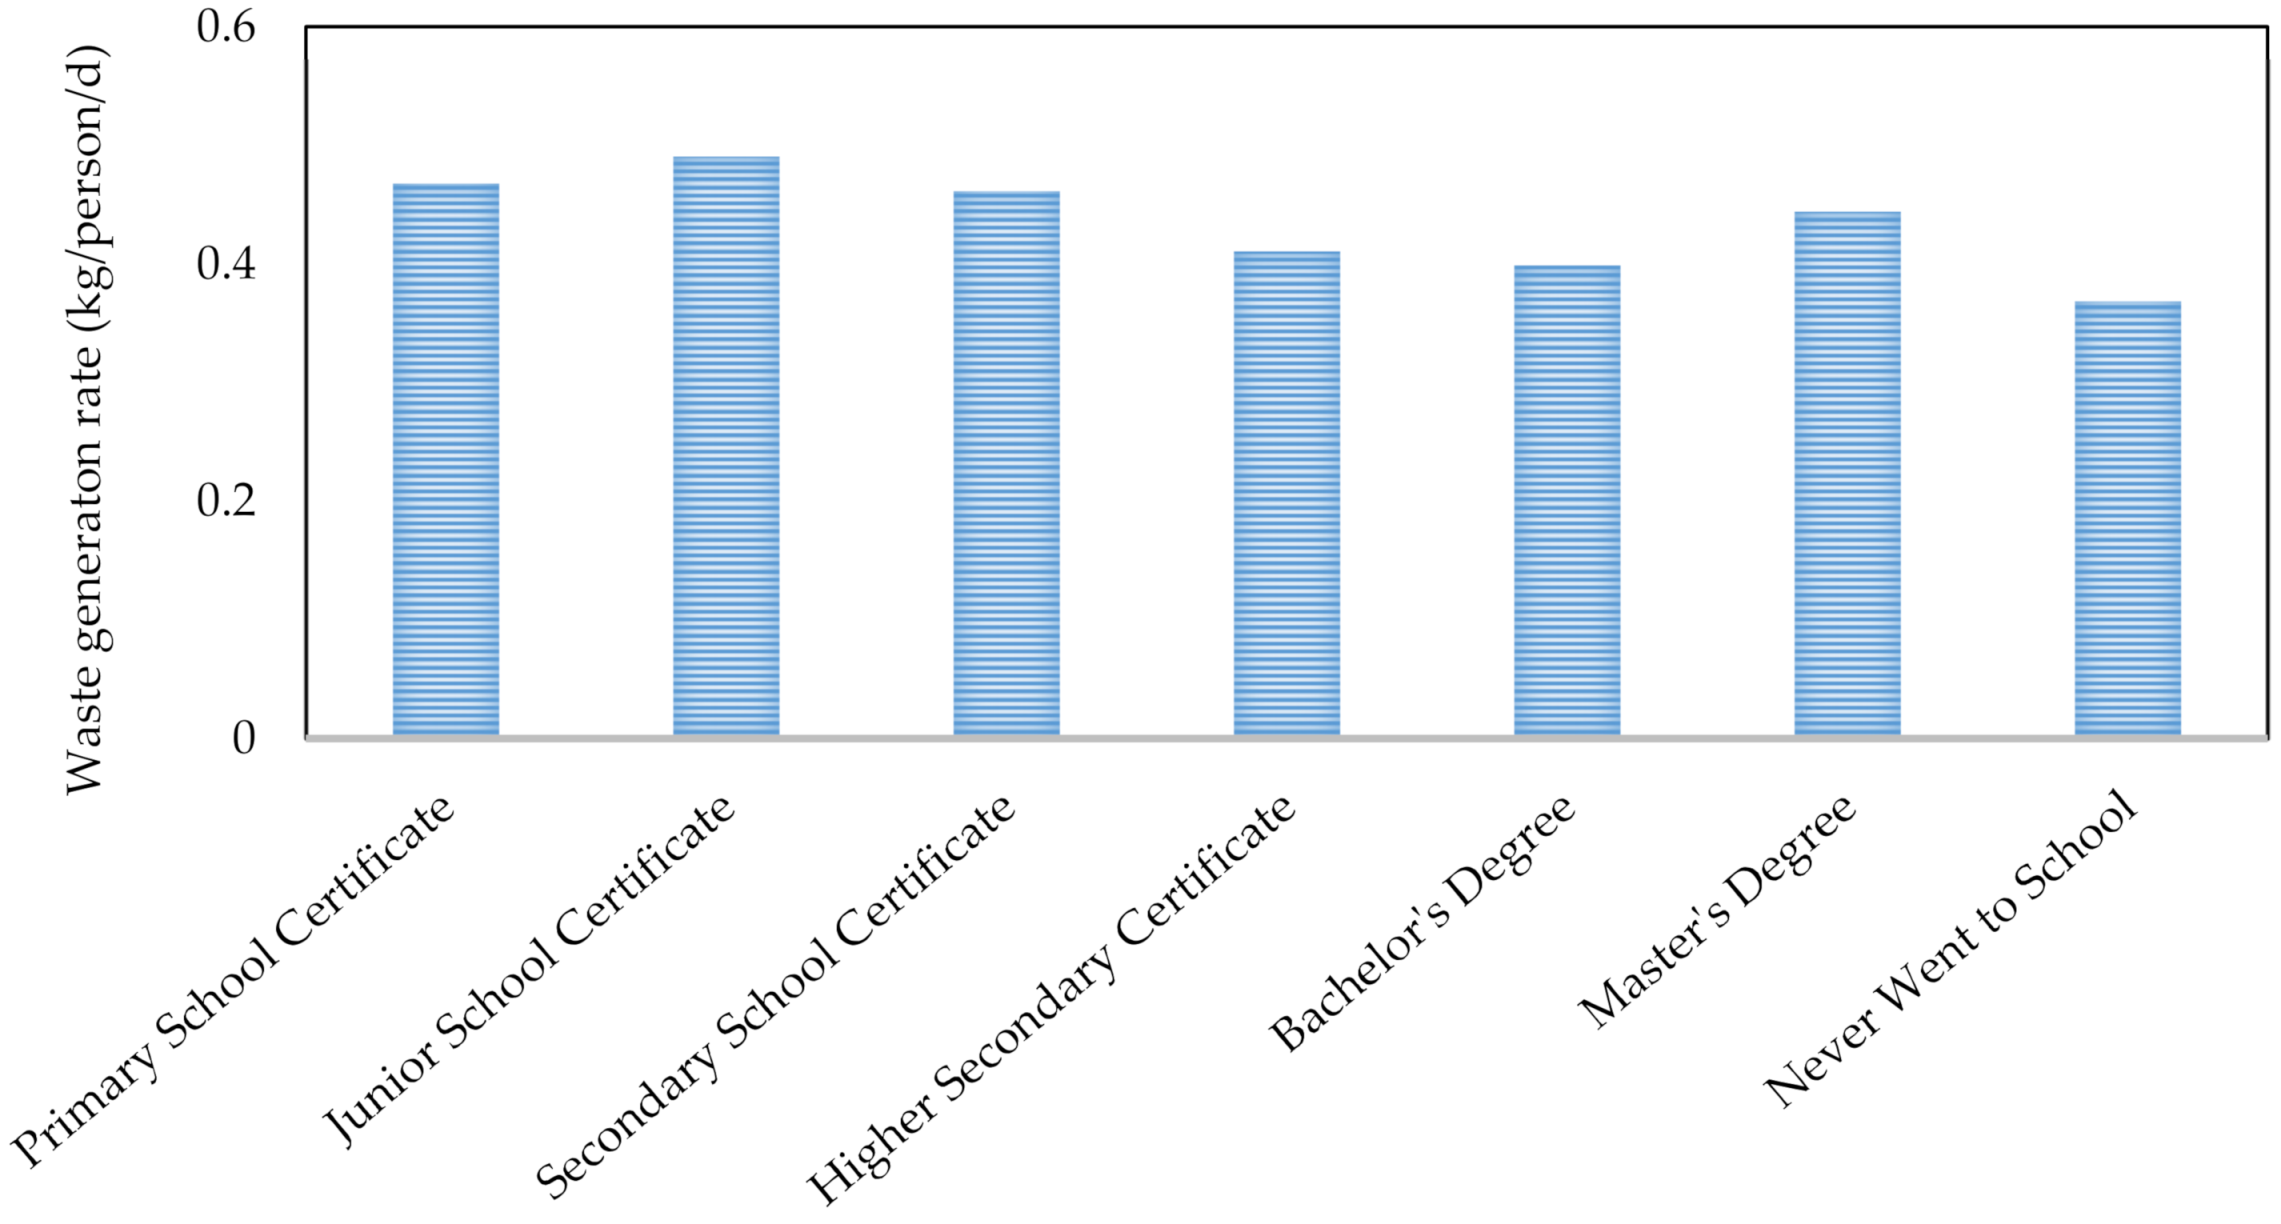
Fifty households of different types were surveyed to get an insight into the MSW generation scenario throughout RCC. Some households and some large residences of students were taken into consideration. The collected data are illustrated in Table 5. It is clearly observed that MSW generation varies with different parameters, like food habits, monthly income, educational level, etc. The total number of people within the 50 households was 772 and the total waste generated by them was 325.321 kg. Therefore, the average waste production was calculated as 0.4214 kg/person/d. Similar results have been observed in previous studies [7,9]. According to the Rajshahi City Corporation authority, the population of the city is approximately 0.85 million [22]. Therefore, the approximate total waste generation in RCC is calculated as 358.19 t/d, which is approximately equal to the data presented by earlier studies [7,9]. The total estimated waste generation per day as well as per person is similar to the results obtained from the previous studies. Haldar et al. estimated that the per capita MSW generation per day is 0.40 kg in RCC, equal to 340 t/d MSW, which is quite similar to the obtained results [9]. Bari et al. also estimated that 341 t of MSW was generated daily in RCC in 2012 [7]. As the population of the city corporation is increasing day by day, the total MSW generated per day would be slightly higher than these results. In this work, per capita waste generation has been found to be almost similar to the previous studies but the total generated MSW per day was slightly higher because of the increased population in RCC. Therefore, it can be said that the selected families represent approximately all types of households in RCC. Figure 7 shows the education level of each of the interviewees as a percentage of the total interviewed people. From the figure, it can be observed that 30% of the interviewees completed higher secondary education. It can also be observed that 2% of the total interviewees did not even go to school. The waste generation rate with respect to educational level is plotted in Figure 8. It can be observed that junior school-educated interviewee households contributed the highest per capita waste generation. Households of interviewees who never went to school contribute the least to MSW generation. Surprisingly, households of interviewees who went to school contribute more waste generation than the households of those who did not go to school. MSW generation rates of semi-pucca (semi-concrete) and pucca (concrete) houses have been found to be 0.48 kg/person/d and 0.412 kg/person/d, respectively. Based on property ownership, rented houses contribute waste at a rate of 0.568 kg/person/d and owned houses contribute 0.410 kg/person/d. Monthly fees paid by all the households are compared in Figure 9. It is observed that 38% of the people pay BDT 30 monthly. Surprisingly, 24% of people do not even pay for waste management. Therefore, social awareness is mandatory in this case.

4.2. Calorific Value and Possible Electricity Generation

4.2.1. Physical Composition of MSW in RCC

After surveying 50 households, seven families were selected as representatives of different households in RCC to analyze the physical composition of the MSW generated by the families. These seven families included at least one of each type of family surveyed. Total waste collected from the seven families was 63.23 kg. The physical composition of MSW from each of the seven families is shown in Table 6. It is observed that a significant amount of solid waste comes from food and vegetables, at about 72.29% on average. This percentage is similar to the one observed in a literature survey where Alamgir et al. observed that about 71.1% of the total MSW in RCC was food and vegetables [23]. An average of 73.19% of the total MSW in RCC was food and vegetables in the work done by Haldar et al. in 2014, which also supports the result of this work [9]. Plastics contribute about 4.74% to waste generation. The average waste generation of the seven families was taken as a reference for analyzing the overall scenario of waste generation. After determining the weight percentage (wet) of MSWs, they were mixed and dried. After drying, different solid wastes were separated and individual weights of the different solid wastes were noted. Finally, from the weight difference, moisture contents of different types of wastes as well as overall moisture content were determined. The moisture content of each of the types is shown in Table 7. It is observed that food and vegetables have the highest moisture content of 63.38%. The total moisture content of MSW in RCC has been calculated as 48.28%. Similar results on moisture contents have also been found through literature surveys [8,14]. The moisture content of MSW was estimated as 45–50% in the research done by Hossain et al. in 2014 [8]. Another two studies estimated an average of around 50% moisture in the MSW of RCC in 2013 and 2014, which is similar to this research [4,9]. Therefore, the seven families that were selected can be considered as representative of the fifty surveyed families.

4.2.2. Chemical Composition (Dry) of MSW at RCC

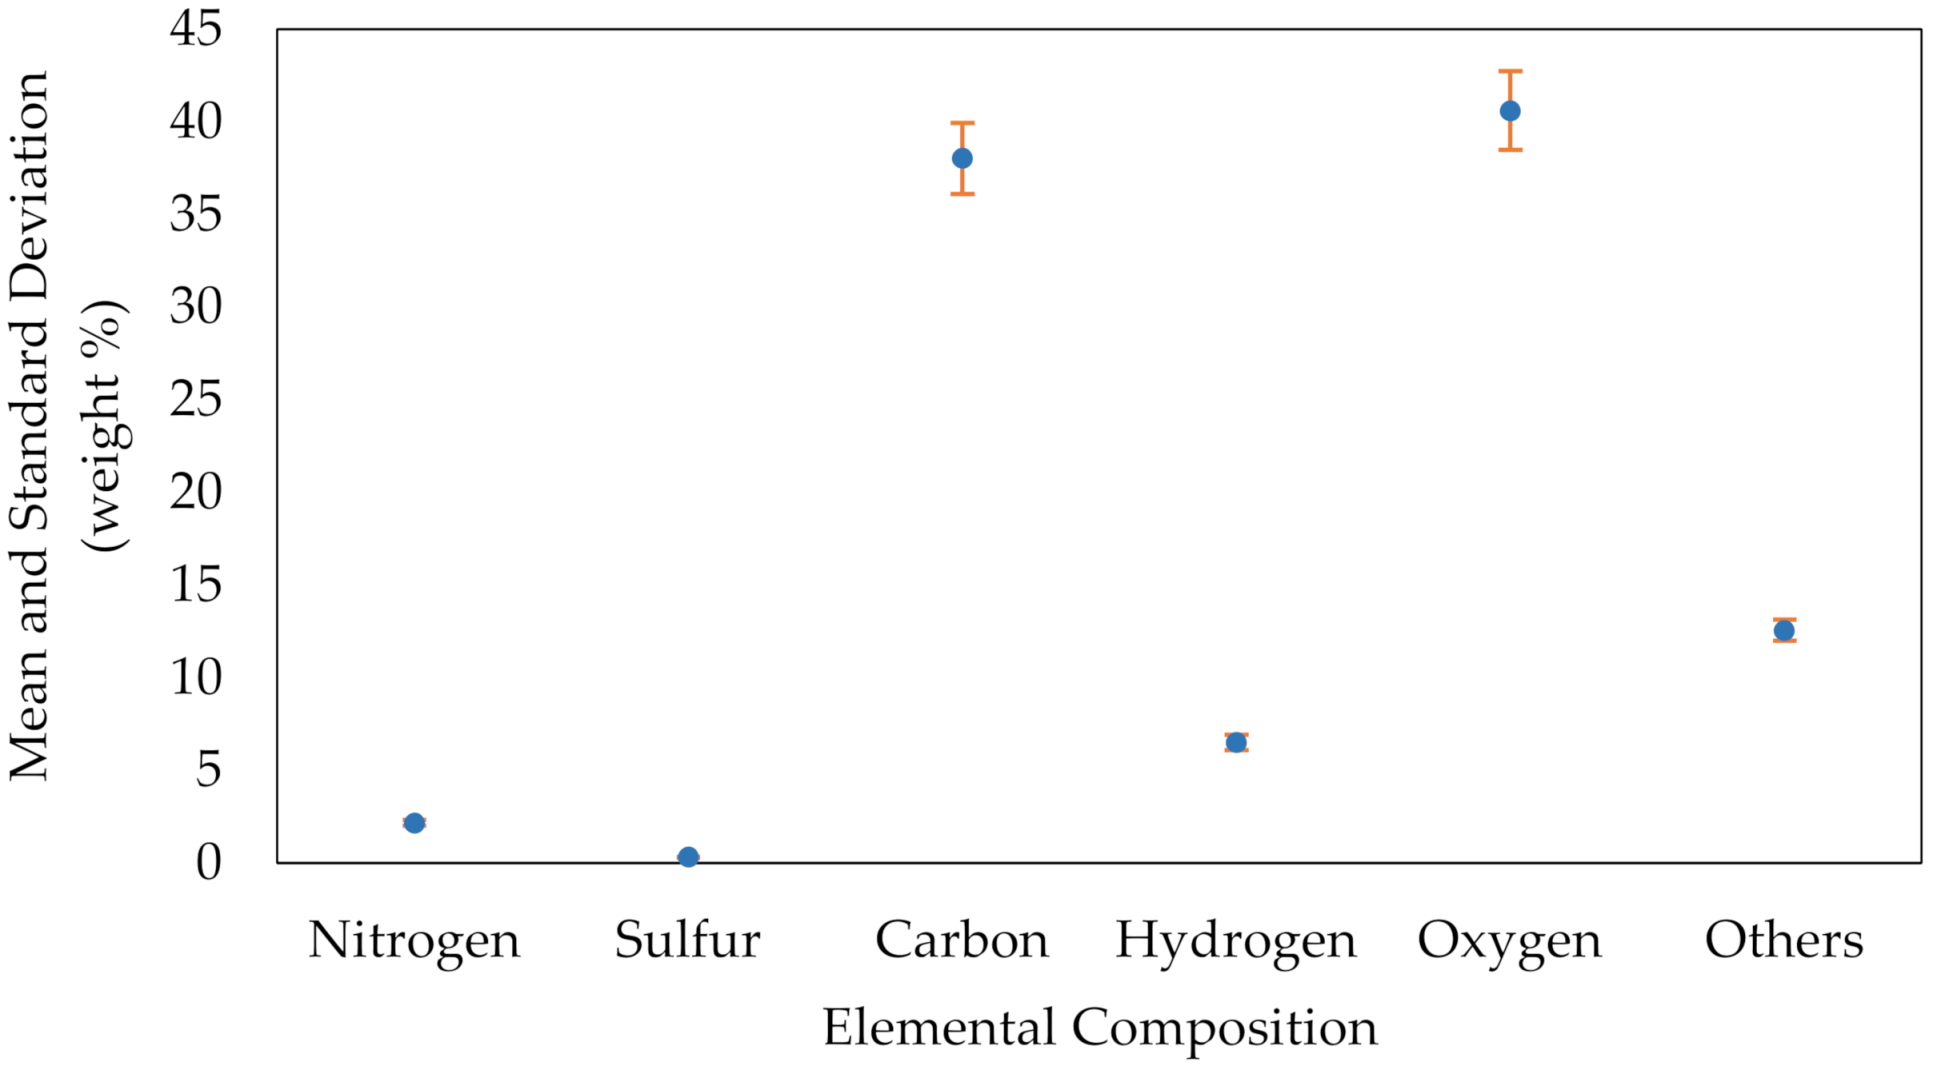
It is very important to know the chemical composition of the MSW in order to implement proper waste management options. The chemical composition of MSW was tested at the Bangladesh Council of Scientific and Industrial Research (BCSIR). A total of five repetitions were done for the elemental composition analysis. Carbon (C), hydrogen (H), nitrogen (N), sulfur (S) and oxygen (O) contents have been found from the analysis. The mean and standard deviations of the percentage composition of the elements, obtained during the trials, are illustrated in Figure 10. These mean values have been considered for further analysis in this research. As observed from the figure, the average oxygen content of MSW in RCC is 40.57%, which is the highest among all the elements present in MSW. The oxygen content of MSW from RCC was also found to be more (40.17%) than in previous studies [9].

4.2.3. Determination of Calorific Value and Potential Electrical Energy

After determining the chemical composition of the MSW, the calorific value of the waste was determined from Dulong’s formula using Equation (1), and the obtained value was 14.90 MJ/kg. Similar calorific value of MSW in RCC have been mentioned in previous studies [9,10]. A 15.51 MJ/kg calorific value of MSW (dry) in RCC was found in the work done by Halder et al. [9]. In another work, the authors estimated the calorific value of MSW collected in RCC. They determined that the calorific value of MSW was around 2638.9 kcal/kg or 11.1 MJ/kg [10]. Calorific values were found to vary from 10 to 17 MJ/kg because of the variation of the composition and moisture content. Furthermore, from the total heat energy, steam energy and net electrical energy were determined, which are illustrated in Table 8. The total potential power output from MSW was found to be 0.8604 kWh/kg. Total waste generation per day was estimated as 358.19 t. As a moisture content of 48.28% has been observed in MSW, the amount of dry waste per day is 185.26 t. Therefore, the energy potential from MSW in RCC is 6.64 MW, which is close to the results obtained in previous studies [11,17]. Therefore, from the empirical equations, it is observed that, approximately, 159.40 MWh electrical energy can be produced per day from MSW generated in RCC. Das et al., in 2014, estimated that about 5.3 MW of electricity can be generated from the generated MSW in RCC, which is slightly less than the result of this research because of a smaller population and, thus, waste generation in 2014 compared to the present conditions [11]. Again, in 2019, authors estimated the energy recovery potential from MSW as 10.2 MW [17]. This estimation is higher than the finding of this research, as the authors did not consider the moisture content in MSW and, therefore, calculated the energy potential considering total generated MSW per day, including moisture.

5. Potential Treatment of Conversion Technologies

Based on the quantity, quality and calorific value of the RCC waste, proper treatment of MSW is recommended for the following three purposes: best waste management, metallic product recovery and WTE production. Different energy recovery processes are available in the literature. Various conversion technologies that can be implemented in RCC include landfill gas recovery, waste recycling, incineration, composting, anaerobic digestion, pyrolysis, gasification, depolymerization, refuse-derived fuel (RFD), etc. This section presents the feasible MSW treatment processes for achieving utmost efficiency.

5.1. Landfill Gas Recovery

Currently, landfill is the only waste management system in RCC without any WTE recovery. As a result, landfill gas retrieval can be a reliable energy recovery system in this city. Methane (CH4) and carbon dioxide (CO2) make up 90 to 98% of landfill gas. The other 2 to 10% of landfill gas includes nitrogen, oxygen and sulfides. Therefore, energy recovery potential through the landfill technique may be incorporated in the waste management system of RCC.

5.2. Waste Recycling

The recycling of waste involves using materials which are at the end of their functional lives as the feedstock for the making of new products. It is seen from Table 7 that metals and paperboard can be recycled for further use with additional processing. In addition to the collection and taking apart of materials from waste, recycling involves subsequent treatment to make saleable products.

5.3. Incineration

Incineration is one of the most common methods used for waste management and it is being used in most of the plants in Asia due to its simplicity [27,28]. For this process, first combustible wastes are separated from the others and dried. MSW as a combustion source for thermochemical conversion applications represents a two-pronged approach in solving its disposal dilemma, as well as a source of energy fuel [29]. However, the handling of incineration residue is still a challenging task. Emissions from this type of thermal conversion are not ecofriendly [30]. Thus, measures must be taken for the controlled emission of various gases. Therefore, thermal transformation of RCC WTE can be a very useful technology for waste management systems due to the generation of heat and energy from the waste. Due to high dioxin emissions and low thermal efficiency recovery of the incineration process, pyrolysis or gasification can be a good replacement for incineration.

5.4. Composting

Composting can be a most versatile method of handling biodegradable wastes. It involves converting waste into manure. In this method, aerobic microorganisms use wastes as a substrate and break the wastes into simpler compounds, i.e., stabilized organic materials (compost), CO2 and water [31]. It is shown in Table 6 that approximately 72.29% of MSW is food and vegetable wastes. Therefore, there is a huge possibility to convert these wastes into biofertilizer. Composting is an attractive method that can reduce the generated MSW of RCC at a considerable rate. Apart from this, composting has various benefits. Compost is very good biofertilizer and can be used in soil to increase the fertility, as well as the productivity, of soil. Compost reduces soil erosion and balances the pH value of soil, which is crucial in the northern part of Bangladesh. As CO2 is the byproduct in the composting process, arrangements should be made to handle the byproducts efficiently.

5.5. Anaerobic Digestion

Anaerobic digestion is another process that breaks down the waste without the presence of oxygen to release renewable gas called biogas. Solid wastes with high moisture contents (i.e., waste food, vegetables, etc.) are very suitable for anaerobic digestion. As biogas contains a significant amount of CH4, it can be used for cooking, power generation, in engines, etc. Rao and Singh, in 2004, carried out digestion for 100 days [32]. The energy yield from the digestion was observed to be 12,528 kJ/kg volatile solids. The conversion efficiency was 84.51% and CH4 content was observed to be 62–72%. However, biogas can be upgraded to biomethane that contains more than 90% CH4 to widen the use of biogas. It is to be noted that 1 Nm3 biomethane (97% CH4) has an energy potential of 9.67 kWh, whereas biogas (60%) CH4 has an energy potential of only 6.0 kWh [33]. Various physiochemical (adsorption, absorption, cryogenic and membrane separation) and biological processes are available for biogas upgradation. The main challenge of upgradation is to eliminate hydrogen sulfide (H2S), CO2 and other impurities from biogas. Therefore, anaerobic digestion can also be an interesting way to manage MSW in RCC.

5.6. Pyrolysis

Pyrolysis is one of the most common methods which is being used worldwide in waste management programs. It is nothing but the decomposition of wastes at an elevated temperature. Pyrolysis is one of the most traditional methods for converting plastic wastes into conventional fuels [34,35]. Pyrolysis oil and gas are hydrocarbon-rich compounds and are comparatively cheaper than conventional fuel [34]. Constantinescu et al. could achieve a maximum test temperature of 450 °C in their research. Derived oil and gas were tested using gas chromatography, elemental analysis, calorimetry, etc. A higher calorific value of the derived oil was in the range of 40.17–45.35 MJ/kg and pyrolysis gas also had a promising heating value [35]. Thus, plastic and plastic wastes possess high energy potential that can be harvested through a pyrolysis process. Therefore, the paper, paper products, polyethylene, wood and rubber of the RCC waste, which is accounted to 10.53 to 15.60% of the total waste, can be converted to useful energy through pyrolysis.

5.7. Gasification

Gasification is a thermochemical conversion of solid or liquid carbon-based material into combustible gases by the supply of a gasification agent. Gasification is also a common method, which is being applied in many countries for WTE conversion. Combustible gas from gasification generally contains CO2, carbon monoxide (CO), hydrogen (H2), CH4, water vapor, trace of hydrocarbons and contaminants, like char particles, ash and tars. A gasification process can be direct (uses an oxygen-controlled atmosphere) or indirect (uses an inert atmosphere) [36]. However, the main difficulty of solid waste gasification is related to the heterogeneity of wastes. Thus, a possible solution can be the production of an RFD with homogeneous and controlled characteristics. Combustible gas produced by this process can be used in gas engines, turbines, boilers, etc.

5.8. Depolymerization

When referring to depolymerization, low-temperature catalytic depolymerization (catalytic cracking) is usually meant. This process has an advantage over pyrolysis, because the process occurs at a comparatively lower temperature than the pyrolysis process. Generally, plastic wastes and tires are suitable for depolymerization. Plastics are more preferable as they have a very high calorific value of between 40 and 46 MJ/kg. In catalytic cracking, with the use of a suitable catalyst, both the performance and distribution of the products of degradation of polymers, as well as the temperature of the process, can be controlled. Most catalysts are a mixture of zeolite, kaolin or quartz. Catalytic depolymerization generally occurs between a temperature of 380 and 480 °C, which is lower than the pyrolysis process. Apart from generated liquid fuel, process gas can also be very useful. Oils generated from this process are sulfur free and chemically pure, which is a great advantage [37].

5.9. Refuse-Derived Fuel (RDF)

RDF is actually made from combustible solid wastes, which are not recycled. The wastes are first dried and compacted and then directly used for combustion. The ideal composition of RDF is a high content of plastics, paper, wood and other organic matter. RDF is an interesting alternative fuel to accomplish reductions of CO2 emissions. Some other advantages of RDF are high calorific value and low production cost [38]. Thus, RDF can be a solution to handle MSW in RCC.
The abovementioned technologies are proposed for optimal treatment of the MSW. However, some other technologies can be used, as well. These discussed methods can be used in an integrated management system of MSW in RCC. As a large amount of MSW is being generated every day in RCC, it is a matter of time to implement these techniques to make an ecofriendly environment in a sustainable approach, as well as to utilize the energy in an efficient way. Table 9 shows the potential treatment of solid waste in RCC, based on the quantity and energy recovery prospects of the waste found in Table 6.

6. Proposed WTE Conversion Technology

Among the various treatment processes mentioned in the preceding section, there are a number of technological challenges in each of the methods. Although landfill is the most common method of waste management in RCC, it is no longer appropriate due to the deficiency of land [17]. Incineration is very common in WTE plants in Asia [39]. However, the main challenges of incineration processes are the implementation of proper flue gas treatment technology and proper carbon dioxide capture and storage technology. They also have high carbon emissions and high emissions of harmful flue gases [40]. Additionally, the drying of wastes in the rainy season is very difficult, which is a great disadvantage of the incineration process and a large amount of fuel is required to execute the incineration process [9]. Though pyrolysis is one of the most common methods for WTE conversion, the major disadvantage is the requirement of a very small particle size for fluidized bed reactors [17]. The main challenge of pyrolysis is the development of the technology to maturity. It is also not suitable for plastic and rubber wastes [40]. Tar removal technology is one of the main technological challenges of the gasification process [40]. The pretreatment process is very costly in the gasification process [5].
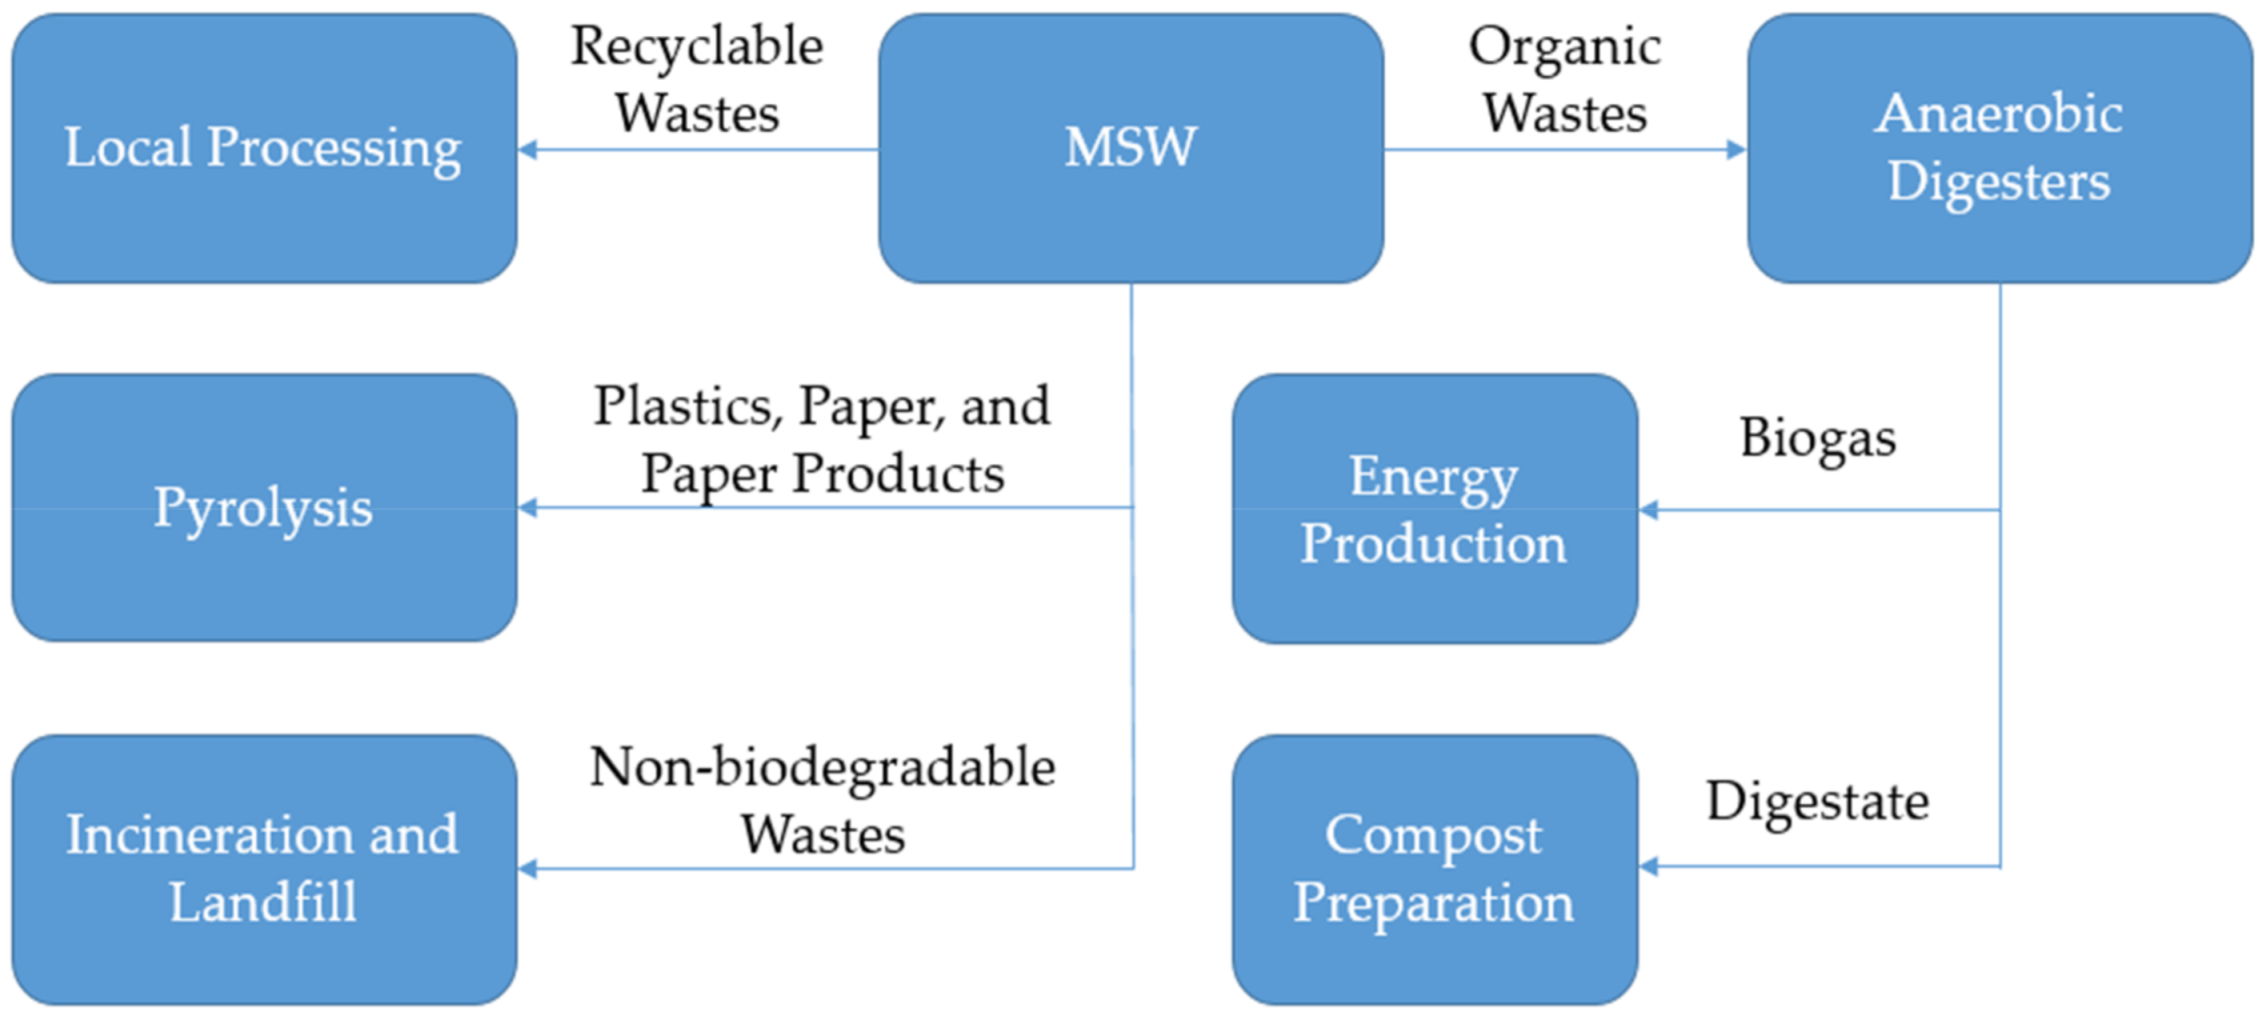
Most (72.29%) of the total wastes have are food and vegetables, which are biodegradable. Thus, anaerobic digestion (AD) can be an attractive energy recovery process to produce electricity, though upgradation of biogas is very challenging for AD. It will not only reduce the landfill waste, but will also meet the high electricity demand in RCC. Another advantage of anaerobic digestion is that it produces both biogas ( CH 4 and CO 2 ) and digestate (innocuous liquid and solid residues) at the same time [41]. Biogas can be used to generate power, where the digestate can be further modified to compost, that can be used in the land. It has less environmental impact, as the byproducts of this process are modified to produce compost. A schematic of the proposed waste management process in RCC is illustrated in Figure 11.
Non-recyclable and non-biodegradable wastes are suggested for incineration and landfill. Recyclable wastes, like metals, should be sent for further processing. Plastics, paper and paper products should be reduced through a pyrolysis process, as pyrolysis oil and gas can provide a significant amount of energy [36,37]. Table 10 shows the energy recovery potential from anaerobic digestion. It has been observed that about 38,850 m3 of biogas can be generated per day from MSW in RCC, which can be used for power generation, as well as other uses, such as cooking. In addition, about 65 tons of compost fertilizer can be produced per day from MSW. Considering that the price of compost fertilizer is BDT 6/kg, about BDT 0.39 million can be saved with the produced compost [17].

7. Techno-Economic Analysis of the Proposed AD Plant

For techno-economic analysis of the AD plant, a few assumptions have been made. The construction duration has been considered to be 3 years. The general lifespan of the AD technology varies from 25 to 30 years [42,43]. In this case, a period of 25 years is considered as the lifetime of the plant. Total operating days have been assumed to be 365 days and operating hours have been assumed to be 7446 h. A summarization of the analysis is presented in Table 11. From the analysis, the payback time of the AD plant has been found to be 4.9 years.

8. Future Recommendations

The waste management system in RCC is, nevertheless, not up to the mark. Improper management results in damaging the ecosystem. Again, due to high population growth rate and economic growth of the city, the waste generation rate is increasing day by day. Therefore, it is necessary to manage the waste properly in order to create a healthy environment and sustainable future. Locally made bins and plastic bags are generally used to collect waste without maintaining any standards. These bins are not suitable, because they cannot prevent bad odors. They also attract stray dogs and birds, which are responsible for wastes spreading all over the roads. Therefore, good technical standards of the waste collection bins should be maintained. The normal waste collection time in RCC is in the morning, when a large number of people are on the roads. Therefore, the waste collection time should be shifted to midnight. Landfill sites should not be in the town, rather, they should be out of the town. Strong waste management laws should be implemented to handle this large amount of waste every day. Economic instruments in the form of taxes, user fees, service charges and fines are very popular in other countries, as they are easy to implement and they strengthen the financial base of the management institutions. Thus, polluters become responsible for generating waste. Therefore, these practices should also be initiated in the city in order to reduce waste generation as much as possible. Again, WTE conversion is an attractive way to resolve waste management, and to use waste to meet a portion of the electricity demand in the city. Different campaigns should be started to create social awareness among people regarding waste management, and media should disseminate news features and advertisements showing the necessities of waste management.

9. Conclusions

In this work, waste generation data of RCC were recorded and the average waste generation per person was calculated as 0.4214 kg/day. Considering this value, the total waste generation in the city corporation per day was estimated to be 358.19 tons. The calorific value of the MSW was determined to be 14.9 MJ/kg, and possible electric energy generation was estimated to be 159.40 MWh/day. Therefore, this possible energy from waste can be used to reduce the energy crisis in RCC. Another advantage of WTE conversion is the reduction of surface water, groundwater and air pollution, which occurs due to open dumping. Furthermore, the revenues will be collected by selling generated power and would generate a reasonable profit. Other important parameters, like recyclable waste values, amount of pollution from the waste, etc., also need to be considered for a better understanding of the overall waste management of RCC. During the survey, it was observed that none of the families had waste separation practices. Thus, source separation of waste should be implemented for better handling of the municipal waste. Controlled dumping, instead of open dumping, should be started. Future recommendations for waste management have been discussed in this work, along with the present conditions of MSW generation and management in RCC, with potential treatment strategies. Therefore, a proper waste management system should be employed without any delay due to the increasing rate of MSW generation in RCC. As an enormous amount of energy can be harvested from this waste, WTE conversion must be given priority. Anaerobic digestion has been found to be reliable in this aspect, as most of the MSW contents are food and vegetables. The energy potential from the anaerobic digestion process has been calculated as 3.85 MW, which can be utilized to meet the energy crisis of this city corporation. Cost analysis of the proposed plant has also been performed and the payback period has been estimated to be 4.9 years.

Author Contributions

All the authors have contributed substantially to the work reported. Conceptualization, M.E.H., M.R.A.B. and M.A.; Methodology and Survey, M.A.H. and M.M.A.; Data Curation, M.A.H. and M.M.A. and M.E.H.; Formal Analysis, M.E.H. and M.A.; Writing—Original Draft Preparation, M.A.H. and M.M.A.; Writing—Review and Editing, M.E.H., M.R.A.B. and M.A. All authors have read and agreed to the published version of the manuscript.

Funding

This research is partially supported by JSPS KAKENHI Grant Number 19K04211.

Institutional Review Board Statement

Not applicable.

Informed Consent Statement

Informed consent was obtained from all subjects involved in the study.

Data Availability Statement

The data presented in this research are available on request from the corresponding author.

Acknowledgments

The authors would like to acknowledge the department of Mechanical Engineering, Rajshahi University of Engineering & Technology, Bangladesh for supporting the research work.

Conflicts of Interest

The authors declare no conflict of interest.

References

  1. Sharholy, M.; Ahmad, K.; Vaishya, R.; Gupta, R.D. Municipal solid waste characteristics and management in Allahabad, India. Waste Manag. 2007, 27, 490–496. [Google Scholar] [CrossRef] [PubMed]
  2. Kum, V.; Sharp, A.; Harnpornchai, N. Improving the solid waste management in Phnom Penh city: A strategic approach. Waste Manag. 2005, 25, 101–109. [Google Scholar] [CrossRef] [PubMed]
  3. Alamgir, M.; McDonald, C.; Roehl, K.; Ahsan, A. Integrated Management and Safe Disposal of Municipal Solid Waste in Least Developed Asian Countries and Technology, Bangladesh; Final Report of ‘Waste Safe’, A feasibility project under the Asia Pro Eco Programmed of the EC; Khulna University of Engineering & Technology: Khulna, Bangladesh, 2005. [Google Scholar]
  4. Farzana, F.; Kabir, M.A. Development of An Integrated GIS Based Methodology for the Selection of Solid Waste Disposal Sites for Khulna City. Khulna Univ. Stud. 2004, 4, 725–731. [Google Scholar]
  5. Rana, M.S. Feasibility of Study Waste to Energy and Power Generation of Dhaka City. Master’s Thesis, University of Dhaka, Dhaka, Bangladesh, 2016. [Google Scholar]
  6. Sujauddin, M.; Huda, S.M.; Hoque, A.T.M.R. Household solid waste characteristics and management in Chittagong, Bangladesh. Waste Manag. 2008, 28, 1688–1695. [Google Scholar] [CrossRef]
  7. Bari, Q.H.; Hassan, K.M.; Haque, M.E. Solid waste recycling in Rajshahi city of Bangladesh. Waste Manag. 2012, 32, 2029–2036. [Google Scholar] [CrossRef]
  8. Hossain, H.M.Z.; Hasna, Q.; Uddin, M.; Ahmed, T. Municipal solid waste (MSW) as a source of renewable energy in Bangladesh: Revisited. Renew. Sustain. Energy Rev. 2014, 39, 35–41. [Google Scholar] [CrossRef]
  9. Halder, P.K.; Paul, N.; Hoque, M.E.; Hoque, A.S.M.; Parvez, M.S.; Rahman, M.H.; Ali, M. Municipal Solid Waste and its Management in Rajshahi City, Bangladesh: A Source of Energy. Int. J. Renew. Energy Res. 2014, 4, 1. [Google Scholar]
  10. Islam, D.; Saifullah, A.Z.A. Solid Waste and Sugarcane Bagasse-A Renewable Source of Energy in Rajshahi City, Bangladesh. In Proceedings of the 4th International Conference on Mechanical Engineering, Dhaka, Bangladesh, 26–28 December 2001; pp. 33–38. [Google Scholar]
  11. Das, B.K. Energy Recovery Potential from Municipal Solid Waste in Rajshahi City by Landfill Technique. Int. J. Renew. Energy Res. 2014, 4, 2. [Google Scholar]
  12. Miezah, K.; Obiri-danso, K.; Kádár, Z.; Fei-baffoe, B.; Mensah, M.Y. Municipal solid waste characterization and quantification as a measure towards effective waste management in Ghana. Waste Manag. 2015, 46, 15–27. [Google Scholar] [CrossRef] [Green Version]
  13. Tai, J.; Zhang, W.; Che, Y.; Feng, D. Municipal solid waste source-separated collection in China: A comparative analysis. Waste Manag. 2011, 31, 1673–1682. [Google Scholar] [CrossRef]
  14. Rahman, M.N. Case Study on the Recent Solid Waste Management Scenario in Rajshahi City, Bangladesh. Am. J. Environ. Prot. 2013, 2, 58. [Google Scholar] [CrossRef] [Green Version]
  15. Imran, M.A.; Islam, M.T. Case Study on the Solid Waste Management of Rajshahi, an Idea to It’s Recycling & Probable Measures for Its Management. In Proceedings of the Waste Safe 2015—4th International Conference on Solid Waste Management in the Developing Countries, Khulna, Bangladesh, 15–17 February 2015. [Google Scholar]
  16. Saifullah, A.Z.A. Electrical Energy Potential from Municipal Solid Waste in Rajshahi City Corporation, Bangladesh. Am. J. Eng. Res. 2015, 4, 69–85. [Google Scholar]
  17. Das, P.; Islam, M.S.; Huda, N. Feasibility analysis of municipal solid waste (MSW) for energy production in Rajshahi City Corporation. AIP Conf. Proc. 2019, 2121, 120004. [Google Scholar]
  18. World Bank Annual Report 2018; World Bank Group: Washington, DC, USA, 2018; Available online: http://documents.worldbank.org/curated/en/630671538158537244/The-World-Bank-Annual-Report-2018 (accessed on 17 April 2021).
  19. Bangladesh Population (2021)—Worldometer. Available online: https://www.worldometers.info/world-population/bangladesh-population/ (accessed on 25 March 2021).
  20. Sebastian, R.M.; Alappat, B. Thermal Properties of Indian Municipal Solid Waste over the Past, Present and Future Years and Its Effect on Thermal Waste to Energy Facilities. Civ. Eng. Urban Plan. Int. J. 2016, 3, 2. [Google Scholar] [CrossRef]
  21. Rajshahi City Corporation—Banglapedia. Available online: http://en.banglapedia.org/index.php?title=Rajshahi_City_Corporation (accessed on 24 March 2021).
  22. Islam, M.; Uddin, M.N.; Rahman, M.M. A GIS-based approach to explore the factors contributing towards Urban residential land development and re-development (LDR): A case of Rajshahi City Corporation area. Geol. Ecol. Landsc. 2020, 1–12. [Google Scholar] [CrossRef]
  23. Alamgir, M.; Bidlingmaier, W.; Glawe, U.; Martens, J.; Sharif, L.A.; Visvanathan, C.; Stepniewski, W. Safe and Sustainable Management of Municipal Solid Waste in Khulna City of Bangladesh. In Proceedings of the Sardinia 2007, Eleventh International Waste Management and Landfill Symposium, S. Margherita di Pula, Cagliary, Italy, 1–5 October 2007; Volume 1, p. 5. [Google Scholar]
  24. Islam, F.A.S. Solid Waste Management System in Dhaka City of Bangladesh. J. Mod. Sci. Technol. 2016, 4, 192–209. [Google Scholar]
  25. Khurmi, R.S.; Gupta, J.K. A Textbook of Thermal Engineering; S. Chand & Company Pvt. Ltd.: Ram Nagar, New Delhi, India, 2016. [Google Scholar]
  26. Themelis, N.J.; Kim, Y.H. Material and energy balances in a large-scale aerobic bioconversion cell. Waste Manag. Res. 2002, 20, 234–242. [Google Scholar] [CrossRef]
  27. Kirunda, M.P. A Case of Kira Town Council, Uganda: Public Participation in Solid Waste Management: Challenges and Prospects. Master’s Thesis, The University of Agder, Kristiansand, Norway, 2009. [Google Scholar]
  28. Zhu, J.; Chow, M.Y. A review of emerging techniques on generation expansion planning. IEEE Trans. Power Syst. 1997, 12, 1722–1728. [Google Scholar]
  29. Abd Kadir, S.A.S.; Yin, C.; Sulaiman, M.R.; Chen, X.; El-Harbawi, M. Incineration of municipal solid waste in Malaysia: Salient issues, policies and waste-to-energy initiatives. Renew. Sustain. Energy Rev. 2013, 24, 181–186. [Google Scholar] [CrossRef] [Green Version]
  30. Sabbas, T.; Polettini, A.; Pomi, R.; Astrup, T.; Hjelmar, O.; Mostbauer, P.; Cappai, G.; Magel, G.; Salhofer, S.; Speiser, C.; et al. Management of municipal solid waste incineration residues. Waste Manag. 2003, 23, 61–88. [Google Scholar] [CrossRef]
  31. Gajalakshmi, S.; Abbasi, S.A. Solid waste management by composting: State of the art. Crit. Rev. Environ. Sci. Technol. 2008, 38, 311–400. [Google Scholar] [CrossRef]
  32. Rao, M.S.; Singh, S.P. Bioenergy conversion studies of organic fraction of MSW: Kinetic studies and gas yield-organic loading relationships for process optimization. Bioresour. Technol. 2004, 95, 173–185. [Google Scholar] [CrossRef] [PubMed]
  33. Kapoor, R.; Ghosh, P.; Kumar, M.; Vijay, V.K. Evaluation of biogas upgrading technologies and future perspectives: A review. Environ. Sci. Pollut. Res. 2019, 26, 11631–11661. [Google Scholar] [CrossRef]
  34. Constantinescu, M.; Bucura, F.; Ionete, R.; Ion-ebrasu, D.; Sandru, C.; Zaharioiu, A.; Marin, F.; Miricioiu, M.G.; Niculescu, V.; Oancea, S.; et al. From Plastic to Fuel—New Challenges. Mater. Plast. 2019, 56, 721–729. [Google Scholar] [CrossRef]
  35. Constantinescu, M.; Bucura, F.; Ionete, R.; Niculescu, V. Comparative Study on Plastic Materials as a New Source of Energy. Mater. Plast. 2019, 56, 41–46. [Google Scholar] [CrossRef]
  36. Belgiorno, V.; De Feo, G.; Rocca, C.D.; Napoli, R.M.A. Energy from gasification of solid wastes. Waste Manag. 2003, 23, 1–15. [Google Scholar] [CrossRef]
  37. Wolosiewicz-Glab, M.; Pieta, P.; Sas, S.; Grabowski, L. Plastic waste depolymerization as a source of energetic heating oils. E3S Web Conf. 2017, 14, 02044. [Google Scholar] [CrossRef]
  38. Brás, I.; Silva, M.; Lobo, G.; Cordeiro, A.; Faria, M.; De Lemos, L.T. Refuse Derived Fuel from Municipal Solid Waste rejected fractions- a Case Study. Energy Procedia 2017, 120, 349–356. [Google Scholar] [CrossRef] [Green Version]
  39. Yuan, K.; Xiao, H.; Li, X. Development and application of municipal solid waste incineration in China. Nengyuan Gongcheng 2008, 5, 43–46. [Google Scholar]
  40. Purnomo, C.W.; Kurniawan, W.; Aziz, M. Technological review on thermochemical conversion of COVID-19-related medical wastes. Resour. Conserv. Recycl. 2021, 167, 105429. [Google Scholar] [CrossRef]
  41. Melville, L.; Weger, A.; Wiesgickl, S.; Franke, M. Anaerobic Digestion; John Wiley & Sons, Ltd.: Hoboken, NJ, USA, 2014. [Google Scholar]
  42. Hadidi, L.A.; Omer, M.M. A financial feasibility model of gasification and anaerobic digestion waste-to-energy (WTE) plants in Saudi Arabia. Waste Manag. 2017, 59, 90–101. [Google Scholar] [CrossRef] [PubMed]
  43. International Renewable Energy Agency (IRENA). Biomass for Power Generation. 2012. Available online: https://www.irena.org/DocumentDownloads/Publications/RE_Technologies_Cost_Analysis-BIOMASS.pdf (accessed on 7 April 2021).
  44. Banks, C.; Zhang, Y. Technical Report: Optimising Inputs and Outputs from Anaerobic Digestion Processes. 2010. Available online: http://randd.defra.gov.uk/Document.aspx?Document=WR0212_8889_TRP.pdf (accessed on 7 April 2021).
  45. International Renewable Energy Agency. Renewable Power Generation Costs in 2014. 2015. Available online: http://www.irena.org/menu/index.aspx?mnu=Subcat&PriMenuID=36&CatID=141&SubcatID=494 (accessed on 7 April 2021).
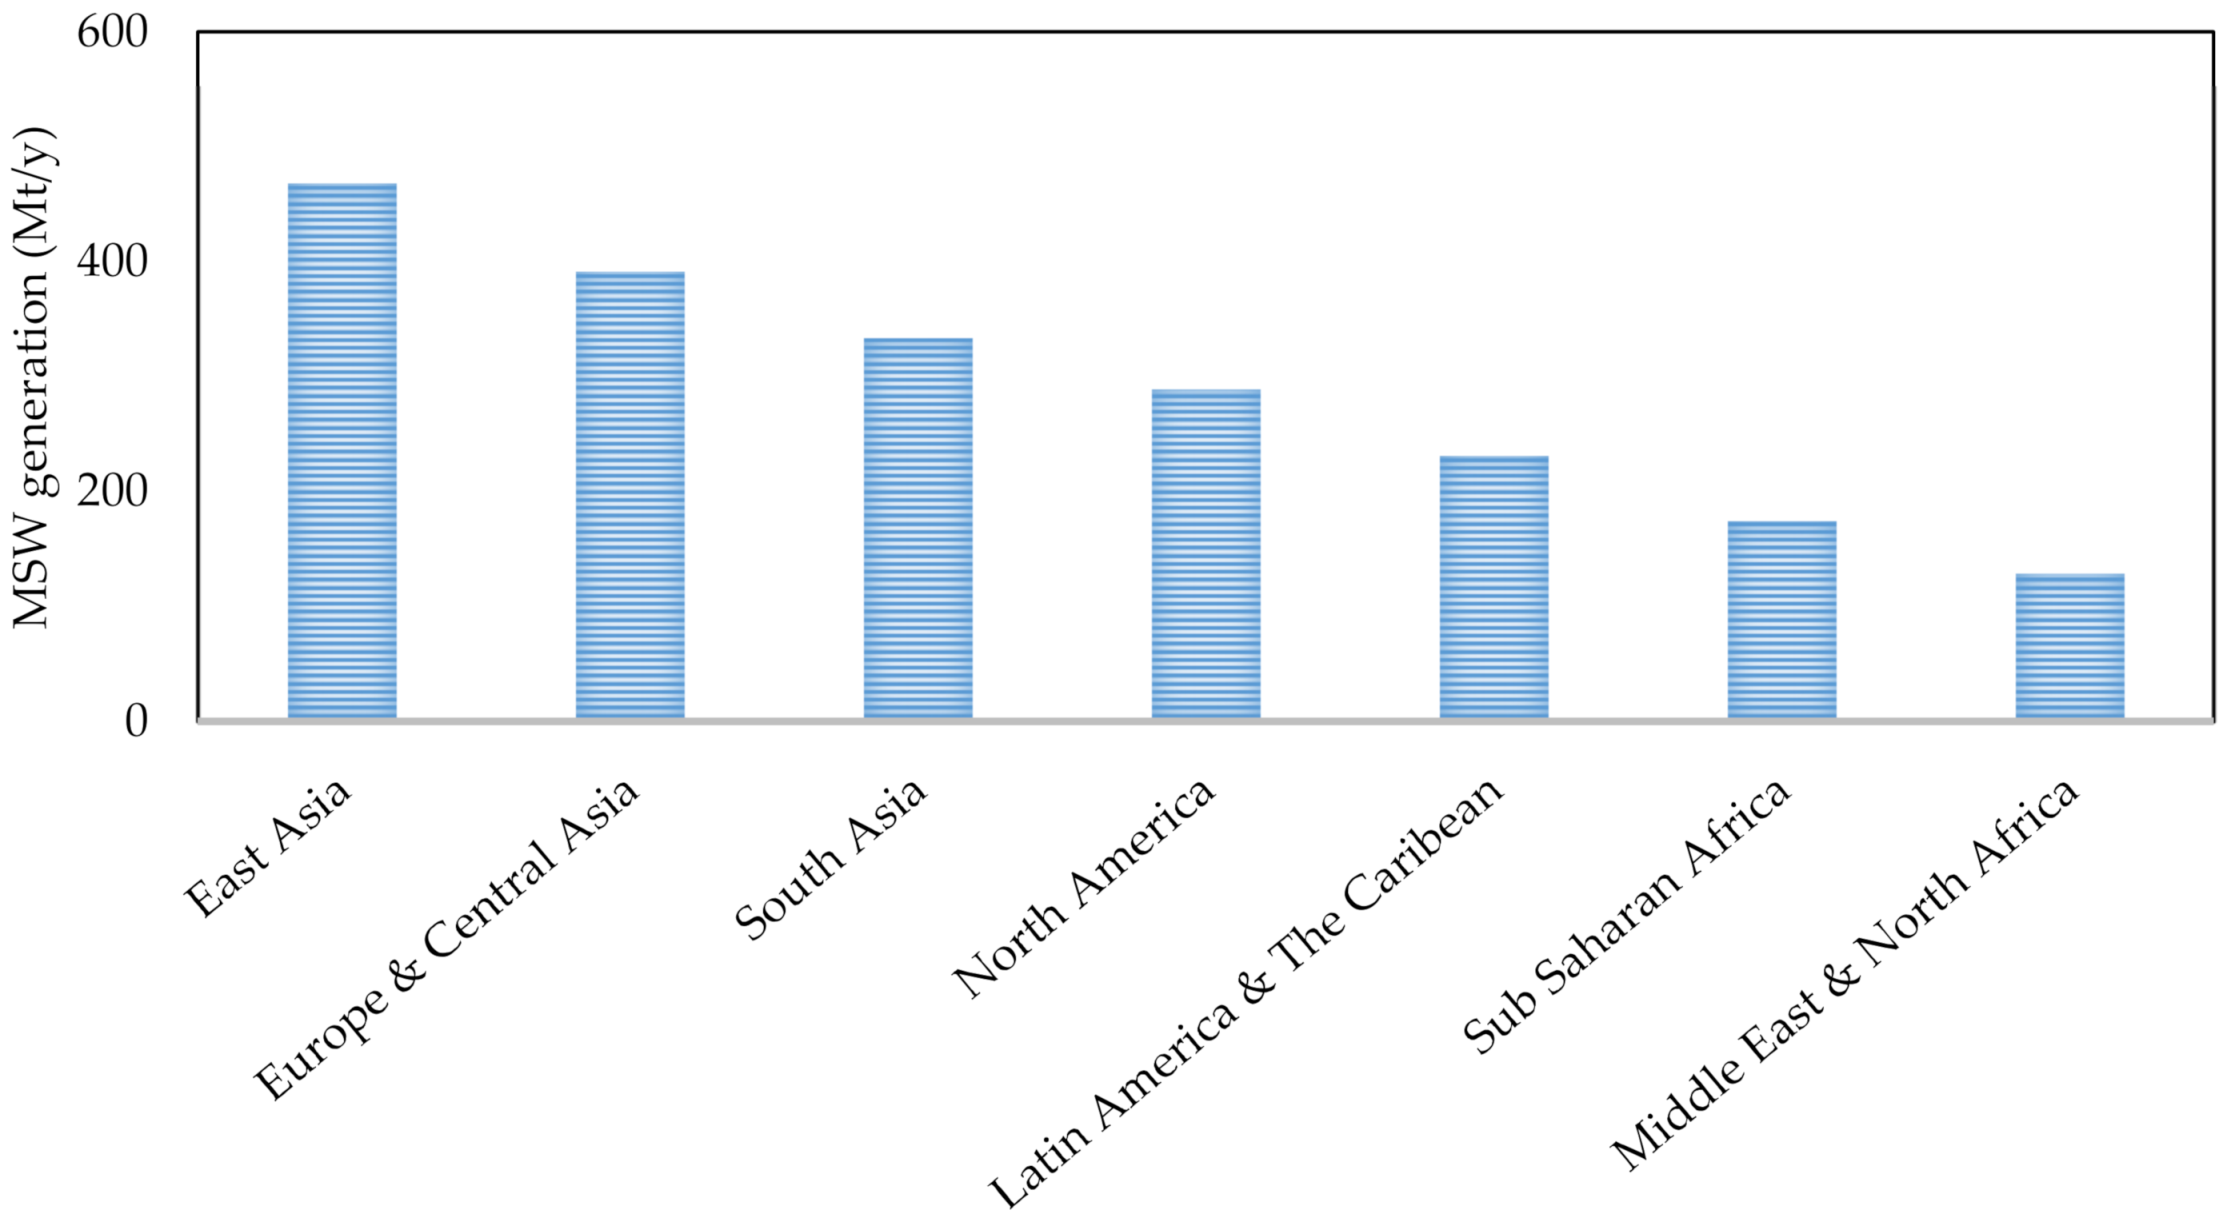
Figure 1. Worldwide annual regional waste generation according to World Bank, 2018.
Applsci 11 03744 g001
Figure 2. Per person MSW generation of South Asian countries.
Applsci 11 03744 g002
Figure 3. Layout of Rajshahi City Corporation [21].
Applsci 11 03744 g003
Figure 4. MSW management scenario of Rajshahi City Corporation [9].
Applsci 11 03744 g004
Figure 5. Flowchart of research methodology.
Applsci 11 03744 g005
Figure 6. Experimental apparatus for elemental analysis of MSW (Vario Micro Cube, Elementar).
Applsci 11 03744 g006
Figure 7. Educational status of interviewees as a percentage of total interviewed people.
Applsci 11 03744 g007
Figure 8. Waste generation rate with respect to educational status.
Applsci 11 03744 g008
Figure 9. Comparison of monthly fees paid by the households.
Applsci 11 03744 g009
Figure 10. Mean and standard deviation of weight percentages of different elements present in MSW.
Applsci 11 03744 g010
Figure 11. Proposed MSW management system in RCC.
Applsci 11 03744 g011
Table 1. Contribution of different sources to MSW generation in all major cities [23].
Sources
(%)
RajshahiKhulnaSylhetBarishalChattogramDhaka
Institutional1.221.021.291.461.141.17
Municipal services1.240.550.801.150.510.53
Residential77.1885.8778.0479.5583.8375.86
Commercial18.5911.6018.4815.5213.9222.07
Others1.770.961.402.320.600.37
Table 2. Physical composition of MSW in different cities of Bangladesh [23].
MSW Composition
(wt%)
RajshahiKhulnaSylhetBarishalChattogramDhakaAverage
Paper and paper products8.909.508.407.209.9010.709.10
Textiles and wood1.901.302.101.902.102.201.90
Food and vegetables71.1078.9073.8081.1073.6068.3074.50
Rubber and leather1.100.500.600.101.001.400.80
Dust, ash and mud products6.503.705.303.105.106.705.10
Glass and ceramics1.100.500.700.501.000.700.80
Polyethylene4.003.103.403.502.804.303.50
Metal1.101.101.101.202.202.001.40
Brick, concrete and stone2.900.101.800.101.101.801.30
Others1.901.201.201.301.302.801.60
Total100100100100100100100
Table 3. Growth rate of MSW in urban cities of Bangladesh in the last few years [24].
YearTotal PopulationUrban Population (% Total)MSW Generation Rate (kg/capita/d)Total MSW Generation (t/d)
199120,872,20420.150.499873.50
200128,808,47723.390.5011,695.00
200432,765,15225.080.5016,382.00
202578,440,00040.000.6047,064.00
Table 4. Waste management facilities in RCC (collected from RCC authority, 2018).
Means of TransportationNumber of Vehicles/Manpower
Truck14
Wheel bars150
Manpower1073
Van210
Table 5. Waste management facilities in RCC (collected from RCC authority, 2018). Waste collection data from different households in Rajshahi (O = Owned, R = Rented, PE = Primary Education, JE = Junior Education, SE = Secondary Education, HE = Higher Secondary Education, BD = Bachelor’s Degree, MD = Master’s Degree, SP = Semi-Pucca/Semi-Concrete, P = Pucca/Concrete).
Residence TypeNo. of PeopleAmount of Waste
(kg)
Educational Status of IntervieweesAmount Being Paid for Waste Collection (BDT)Condition of Residence
Family (O)73.55PE0SP
Family (R)52.74HE30SP
Family (O)42.32JE30SP
Family (R)42.20JE30SP
Family (R)51.98PE0P
Family (O)41.45BD31–60P
Family (O)32.55BD21–30P
Family (O)62.82HE31–60P
Family (O)53.44MD0P
Family (R)42.25BD30P
Family (O)63.05BD30P
Family (R)31.95HE30P
Family (R)52.95HE30P
Family (O)65.10HE40P
Family (R)41.33HE21–30SP
Family (R)41.15HE0SP
Family (O)52.08SE31–60P
Family (R)42.64HE0P
Family (O)83.34JE30P
Family (O)31.85MD30–40P
Family (O)63.75SE0P
Family (O)31.65BD30P
Family (O)42.74JE30SP
Family (O)33.12MD40SP
Family (R)42.58PE0P
Family (O)82.95N/A0SP
Family (O)41.80MD0P
Family (O)73.14BD30P
Family (R)32.36HE30–40P
Family (O)72.56HE30P
Family (R)31.63MD30SP
Family (R)31.32MD0P
Family (R)42.46SE0P
Family (O)32.15HE0P
Family (O)51.72PE30SP
Family (R)32.07MD30–40P
Large Family (O)2611.52SE40SP
Large Family (O)2814.96MD40P
Large Family (O)5216.65MD40P
Large Family (O)9436.00BD40P
Large Family (O)4921.54HE40P
Large Family (O)2411.96HE40P
Large Family (O)3217.12BD30P
Large Family (O)4519.06SE35P
Large Family (O)209.73HE30P
Large Family (O)3211.86BD30P
Large Family (O)155.97MD30SP
Large Family (O)8126.96BD40P
Large Family (O)9225.53HE40P
Large Family (O)177.72MD30SP
Total772325.32
Table 6. Physical composition of MSW collected from seven different families.
MSW Composition Family 1Family 2Family 3Family 4
(%)
Family 5Family 6Family 7Average MSW Composition (%)
Vegetables and food70.1265.3569.4580.7069.1271.1280.2172.29
Paper and paper products7.297.325.732.027.297.293.655.79
Polyethylene4.107.994.314.104.104.603.984.74
Textiles and wood4.683.304.955.084.694.522.564.25
Leather and rubber1.080.380.601.381.080.870.390.82
Metals1.230.903.140.172.141.1301.24
Glass and ceramics0.120.500.580.610.220.121.270.48
Brick, concrete and stones3.484.184.350.273.463.072.763.08
Dust, ash and mud products6.437.006.123.436.445.433.225.43
Others1.802.751.801.601.701.701.871.88
Total 100
Table 7. Moisture contents of different MSW components collected from seven families.
MSW CompositionWeight before Drying (kg)Weight after Drying (kg)Weight Percentage (dry)Moisture Content (%)
Food and vegetables45.4716.6526.3363.38
Paper and paper products3.663.315.249.56
Polyethylene3.002.794.427.00
Textiles and wood2.692.624.152.60
Rubber and leather0.520.470.749.62
Metal and tins0.780.771.211.28
Glass and ceramics0.300.290.473.33
Brick, concrete and stone1.951.903.002.56
Dust, ash and mud products3.432.744.3320.12
Others1.191.161.832.52
Total63.2332.70 48.28
Table 8. Determination of net electrical power from MSW in RCC.
Heat
Energy
(MJ/kg)
Steam Energy
(MJ/kg)
Electrical Power, EP
(kWh/kg)
Station Service
Allowance, SA (kWh/kg)
Net electrical Power ENP
(kWh/kg)
14.9010.430.91530.05490.8604
Table 9. Potential treatment of MSW.
Treatment TechniqueCategory of Solid WastePercentage of Total Waste
Composting/anaerobic
digestion/incineration
Vegetable and food wastes72.29%
LandfillingDust, ash, mud, brick, concrete, stone, glass, ceramic, etc.10.87%
Pyrolysis/gasificationPaper, paper product, polyethylene, wood, rubber, etc.10.53–15.6%
RecyclingMetals1.24%
Table 10. Energy recovery potential from anaerobic digestion.
Total MSW Generation358.19 tons/day
Food and Vegetables259 tons/day (72.29%)
Total Biogas Generation *38,850 m3
Compost Fertilizer **65 tons/day
* From 1 ton of MSW, 150 m3 biogas can be produced by anaerobic digestion [5]. ** 250 tons of compost fertilizer can be produced from 1000 tons of MSW by anaerobic digestion [5].
Table 11. Techno-economic analysis of anaerobic digestion technology.
Input ParametersValues
Beginning design year2021
Construction duration3 years
Year of the beginning of operation2024
Lifetime25 years
Year of the end of operation2049
Electricity generation from 1 ton of organic waste [42,44]0.992 MWh
Operating days in a year365
Operating hours in a year7446
Waste capacity per year(259 ∗ 365) or 94,535 tons
Plant capacity factor [42,43]85%
Facility annual throughput per year(94,535 ∗ 85%) or 80,355 tons
Electricity generation efficiency [42,45]36%
Electricity production per year(80,355 ∗ 0.992 ∗ 36%) or 28,696 MWh
Plant capacity(28,696/7446) or 3.85 MW
Capital expenditure per MW [42,45]USD 4,339,000 or BDT 369 million
Capital expenditure (CAPEX)(369 ∗ 3.85) or BDT 1421 million
Fixed operating cost (% of CAPEX/year) [42,45]3
Fixed operating cost(1421 ∗ 3%) or BDT 42.6 million
Variable operating cost (USD 4.4*MWh) [42,43](4.4 ∗ 28,696) or USD 126,262.2 or BDT 10.7 million
Revenue from compost per dayBDT 0.39 million
Revenue from compost per yearBDT 142 million
Cost of electricity (assumed)BDT 7 per kWh (generally varies in between BDT 6 and 8)
Annual revenue from electricity(7 ∗ 28,696 ∗ 1000) or BDT 201 million
Annual net cash inflow(201 + 142 − 42.6 − 10.7) or BDT 290 million
Payback period (CAPEX/annual net cash inflow)(1421/290) or 4.9 years
Publisher’s Note: MDPI stays neutral with regard to jurisdictional claims in published maps and institutional affiliations.