1. Introduction
Increasing populations mean there is an increased need for water suitable for human consumption and recreation while simultaneously negatively impacting the quality of water available. The increase in water demand, in conjunction with the growing frequency of extreme climate change events, has made the rapid prediction of population dynamics within an ecosystem essential for the effective management of harmful algal blooms (HABs) within drinking water reservoirs, recreational lakes and private lakes. HABs and the subsequent cyanotoxins they are able to produce pose a global threat to water bodies. For example, in 2008 over 35 states in the U.S. had documented HABs associated with cyanobacteria [
1] with all 50 states reporting HAB events by 2015 [
2]. Xiao et al. [
3] reported HAB frequency in China increased by 40% each decade. HABs are a global issue impacting drinking water, recreation and aquaculture [
4]). The increasing prevalence of potential HABs in lakes and reservoirs across the world has become a significant challenge for both in-lake management and toxin removal (e.g., in drinking water plants). Alum has been shown to bind phosphorus, both in water treatment and when used as an agent to bind legacy phosphorus in water bodies [
5].
The proper operation of coagulation/flocculation, sedimentation and filtration steps in conventional surface water treatment plants has been found to be effective at removing cyanobacteria cells [
6]. The most common coagulants used during the coagulation/sedimentation process to remove excessive phosphorus are aluminum sulfate (alum), and ferric chloride. The coagulants can only be used once and continuously produce a waste stream commonly referred to as a water treatment residual (WTR). Water treatment plants in the United States produce more than 2 million tons/year of WTR [
7,
8]; with global WTR production reaching 10 million tons/day [
9]. Processing and handling WTRs often require a significant portion of water treatment plant operating expenses [
10]. Researchers have found that WTRs can be used to adsorb reactive phosphorous (PO
43−) which could lead to viable reuse of WTRs [
11,
12,
13,
14,
15].
While source water protection and monitoring programs do assist with identification of sources and potential long term changes to reduce source water runoff, they do not address phosphorus (PO43−) concentrations in incoming waterways. Even the best monitoring and protection programs, while able to capture in-stream PO43− concentrations, often do not have a way to remove PO43− or to quantify changes in in-stream PO43− concentration reductions. One approach to HAB management that would address incoming PO43− would be to remove excess nutrients levels in field as a pre-treatment step. WTR has the ability to capture PO43− and has potential to be a cost effective method to capture and remove PO43−, in streams/tributaries prior to entering a reservoir, lake, or other HAB-prone body of water. Using WTRs upstream provides in-stream nutrient reduction, enables the quantification of PO43− removal, and provides a beneficial reuse of a waste material.
There have been several approaches investigated for reducing PO
43− upstream such direct addition of amendments to source water, wetlands or riparian buffers [
16]. For instance, Churchill et al. [
17] found that 5 mg/L of alum added directly to the inlet of Jameson Lake, Washington USA reduced phosphorus levels in the lake from 0.13 mg/L to below 0.02 mg/L. Although effective, this would require a constant addition of alum. Similarly, while constructed wetlands are effective at nutrient reduction, they are not widely implemented due to their large footprint, long residence time and clogging [
18]. An approach to increase the effectiveness of constructed wetland’s ability to remove phosphorus and offset some of the drawbacks is to use sorbents in constructed wetlands. Bolton et al. [
19] added hemp biochar to a wetland, resulting in reduced PO
43− concentration, from 15.5 mg/L to less than 2 mg/L (PO
43−). Another key approach has been to reduce the amount of nonpoint source phosphorus runoff from agricultural lands [
20]. Shedekar et al. [
21] used 4.5 × 10
7 g of aluminum treated slag steel in a 72 m by 1.5 m trench to sorb 27% of dissolved PO
43− from farm areas. Fratczak et al. [
22] used a 1.5 m deep, 1.5 m side, and 10 m long limestone barrier to obtain a 13% phosphorus removal efficiency in a riparian buffer. Although effective, both the aforementioned trench and buffer systems required a large footprint, and the media was not refreshable.
Other research has used WTR as an amendment in buffer strips. Wagner et al. [
23] found that if the rain event created a water velocity of with a travel time of approximately 3 s over the buffered area, there was insufficient time for the WTR amendment to bind PO
43−. Habibiandehkordi et al. [
24] also found that effectiveness of amended buffer strips was dependent on flowrate, size of the buffer strip and time of service. While not all of the above mentioned experiments used WTR and none used small-scale, rechargeable instream gate structures such as those evaluated in this research, they do corroborate the hypothesis that this approach can provide long-term effectiveness as well as contribute to the actual removal of sequestered PO
43− from the system completely.
The objectives of the current research were to: 1. design a full-scale passive treatment system utilizing WTR to adsorb PO
43− from surface water and 2. determine the in-field effectiveness of the treatment system. Design of the treatment system involved the selection of appropriate material to ‘bag’ the WTR as well as a series of cartridges to house the mesh bags filled with WTR material. This research builds upon laboratory testing using batch sorption–desorption isotherms and a continuous flow column of Al-WTR for PO
43− removal. Batch experiments determined a cumulative adsorption of 33.93 mg PO
43−/Kg-WTR. The continuous column experiments which utilized more water had a higher PO
43− uptake of 123 mg PO
43−/Kg-WTR. Full details of the lab scale assessment of the WTR can be found in Carleton and Cutright [
25].
2. Materials and Methods
2.1. Residual Characterization
Six WTR samples were collected during this study. At each sampling date, alum-based WTR (Al-WTR) was collected and stored in separate five-gallon buckets. A portion of each sample was left out to air-dry. A sieve analysis was performed to determine the average particle sizes for the WTR samples. A No. 10 sieve, No. 200 sieve, and a pan were utilized to distinguish between the different particle sizes of gravel, sand, and silt and clay [
26] The No. 10 sieve has a nominal diameter of 2 mm, retaining gravel-sized particles. The No. 200 sieve has a nominal diameter of 0.075 mm, retaining sand-sized particles. Any material that passed through the No. 200 sieve was silt- and/or clay- sized. Each sieve’s mass was measured, and then the WTR sample was added and manually shaken for three minutes. The mass of the sieves after the shaking was then measured to calculate the weight and percent for each WTR characterization.
2.2. Measurement of PO43− Concentration
At each time step, reactive phosphorus (PO
43−) was determined by Method 8048 provided by the Hach DR/890 Colorimeter (Hach Company, Loveland, CO, USA) [
27]. It is equivalent to USEPA method 365.2 and an accepted method for drinking water analysis.
Samples were collected once every two weeks starting 2 June 2020 through 20 October 2020. Individual gates could not be sampled on 22 August 2020 as the site could not be accessed. At each sampling event, triplicate water samples were collected from approximately 5.08 cm below the surface immediately before and after the gate (i.e., in front and back) to determine the PO43− concentration before and after water passed through the gate. During any sampling event, if the PO43− concentration was higher after the gate, and at least 25% of the cartridges were submerged under the water surface, cartridges were removed and refreshed with new WTR media.
Triplicate samples were also collected from the middle of the channel approximately 1 m upstream of Gate 1 and 1 m down stream of Gate 8 to create a baseline of upstream and downstream levels. Upstream samples were used to determine changes in reactive PO43− levels due to influent conditions such as increase due to nutrient run off or decreases due to high rain events. Due to the full length of the ditch (239.5 m) and stream velocity (0.04 m/s), downstream samples were only used to provide a snapshot of the level on the day of collection.
Samples were placed in a cooler for transportation to the laboratory and analyzed within one hour of collection. The PO
43− concentration was determined by Method 8048 provided by the Hach DR/890 Colorimeter (Hach Company, Loveland, CO, USA) [
27]. It is equivalent to USEPA method 365.2 and an accepted method for drinking water analysis.
The difference between the PO
43− values between the front and back of an individual gate was used to determine the mg PO
43−/L adsorbed by the WTR (positive number) or released by the WTR (negative value) using Equation (1). The concentration was then multiplied by the total area of the cartridge (A, 0.372 m
2), the percentage of cartridge area in contact with the water (i.e., %submerged), and the stream velocity (v, m/d) as shown in Equation (1). This provided the mg PO
43− removed per day.
2.3. Determination of Average Flowrate
A Geopacks Flowmeter (Model # ZMFP126-S) was used to observe flow. Velocities in m/s were observed with the meter and converted to flow rates using the 4.27-m width and observed 0.61-m depth at the time of reading. The average non-storm event flow rate was 0.11 ± 0.03 m3/s when more than two weeks without rain and 0.47 m3/s one week after a heavy rain event. It was not possible to measure flow during a rain event for safety reasons.
2.4. Selection and Assessment of Mesh Bags for Holding WTR
Several mesh materials were investigated. The constraints of continuous submerged conditions, solar radiation, and temperature fluctuations ruled out many of the materials. Polyester was selected over nylon due to less brittleness after being submerged and potential to autoclave if the mesh needed to be sterilized [
28,
29,
30]. Four different mesh sizes of polyester mesh (Component Supply Company, Sparta, TN, USA) were selected with nominal pore diameters: 53, 70, 120, and 160 µm. The mesh is used to hold the WTR inside the cartridges at each gate. Four different combinations were investigated: one with a single layer and three double layer variations combining two different mesh sizes (a larger mesh size on the outside and the smaller mesh size on the inside). The four combinations investigated were 53 µm, 53/120 µm, 70/120 µm, and 70/160 µm.
A 1.83-m piece of rebar was installed in Eckert’s Ditch at Dawley road approximately 4.58 m north of the culvert in the center of the stream channel. Eight 0.25-cm-long mesh bags were sewn and fastened from the pole using cable ties. The first four mesh bags filled with Al-WTR were weighed, and then placed into Eckert’s Ditch for 48 days. Upon removal, it was determined that the cotton used to sew the mesh bags had deteriorated and was not suitable for use in this experiment.
The thread was replaced with a water and UV resistant nylon thread, and pre-weighed WTR filled meshed bags were again placed in Eckert’s Ditch, this time for 53 days. Upon removal, the bags were air-dried and reweighed to determine the mass loss. The mass lost was extrapolated to calculate the potential mass loss of a full-scale 11.35-kg bag. This weight was chosen as the maximum weight of the cartridge after consulting with the watershed personnel; anything heavier was deemed to be impractical due to the necessity of manually removing the underwater cartridges while in a canoe. This amount was then multiplied by the total number of bags that would be contained in eight gates, each comprised of four mesh-bags containing cartridges to estimate the mass lost for the entire system over a one-month period. One month was selected as the timeframe as it was anticipated that the WTR in the full-size cartridges would have to be replaced monthly. Overall, the 53/120 mesh released the least amount of Al-WTR and was selected for use in the full scale system, with the 53/120 mesh estimated (
Table 1) to lose roughly 2.03 kg over one month. This amount of loss was the least concerning as it is less than the amount of sediment introduced from runoff during a single storm event. Nor does it introduce any foreign contamination into the system as the WTR was made from the watershed it is being utilized within.
2.5. Design of Full-Scale Cartridge
A series of eight structures for passive treatment were installed in Eckert’s Ditch, which are referred to as gates. These gates house four cartridges, each containing a mesh bag filled with Al-WTR. The design included selecting appropriate dimensions, manufacturing process, and material and size of both the gates and the mesh bags.
The design of each individual cartridge dimension was primarily driven by the unit weight of the WTRs. Additional factors included the cartridge material type, the typical cross-sectional geometry necessary for support, and measured flow conditions in Eckert’s Ditch. Each gate had a length restriction which limited the full size to no more than half the cross-sectional length of Eckert’s Ditch to facilitate a serpentine flow in a channelized stream. On average, the length of each gate was 3.66 m; a 1.22 m wide gate design, divided into four 0.3-m sections (to allow for to 0.3-m cartridges in parallel). The two middle 0.3-m sections house the cartridges, and the two outside 0.3-m sections provide a solid face made of 2.54-cm thick PVC, angled slightly to direct water flow towards the cartridges. The average water depth in Eckert Ditch is 0.61 m). Parallel cartridges were stacked two high to making the height 0.62 m. The final dimension was the width which was designed specifically to the specifications of the cartridge design.
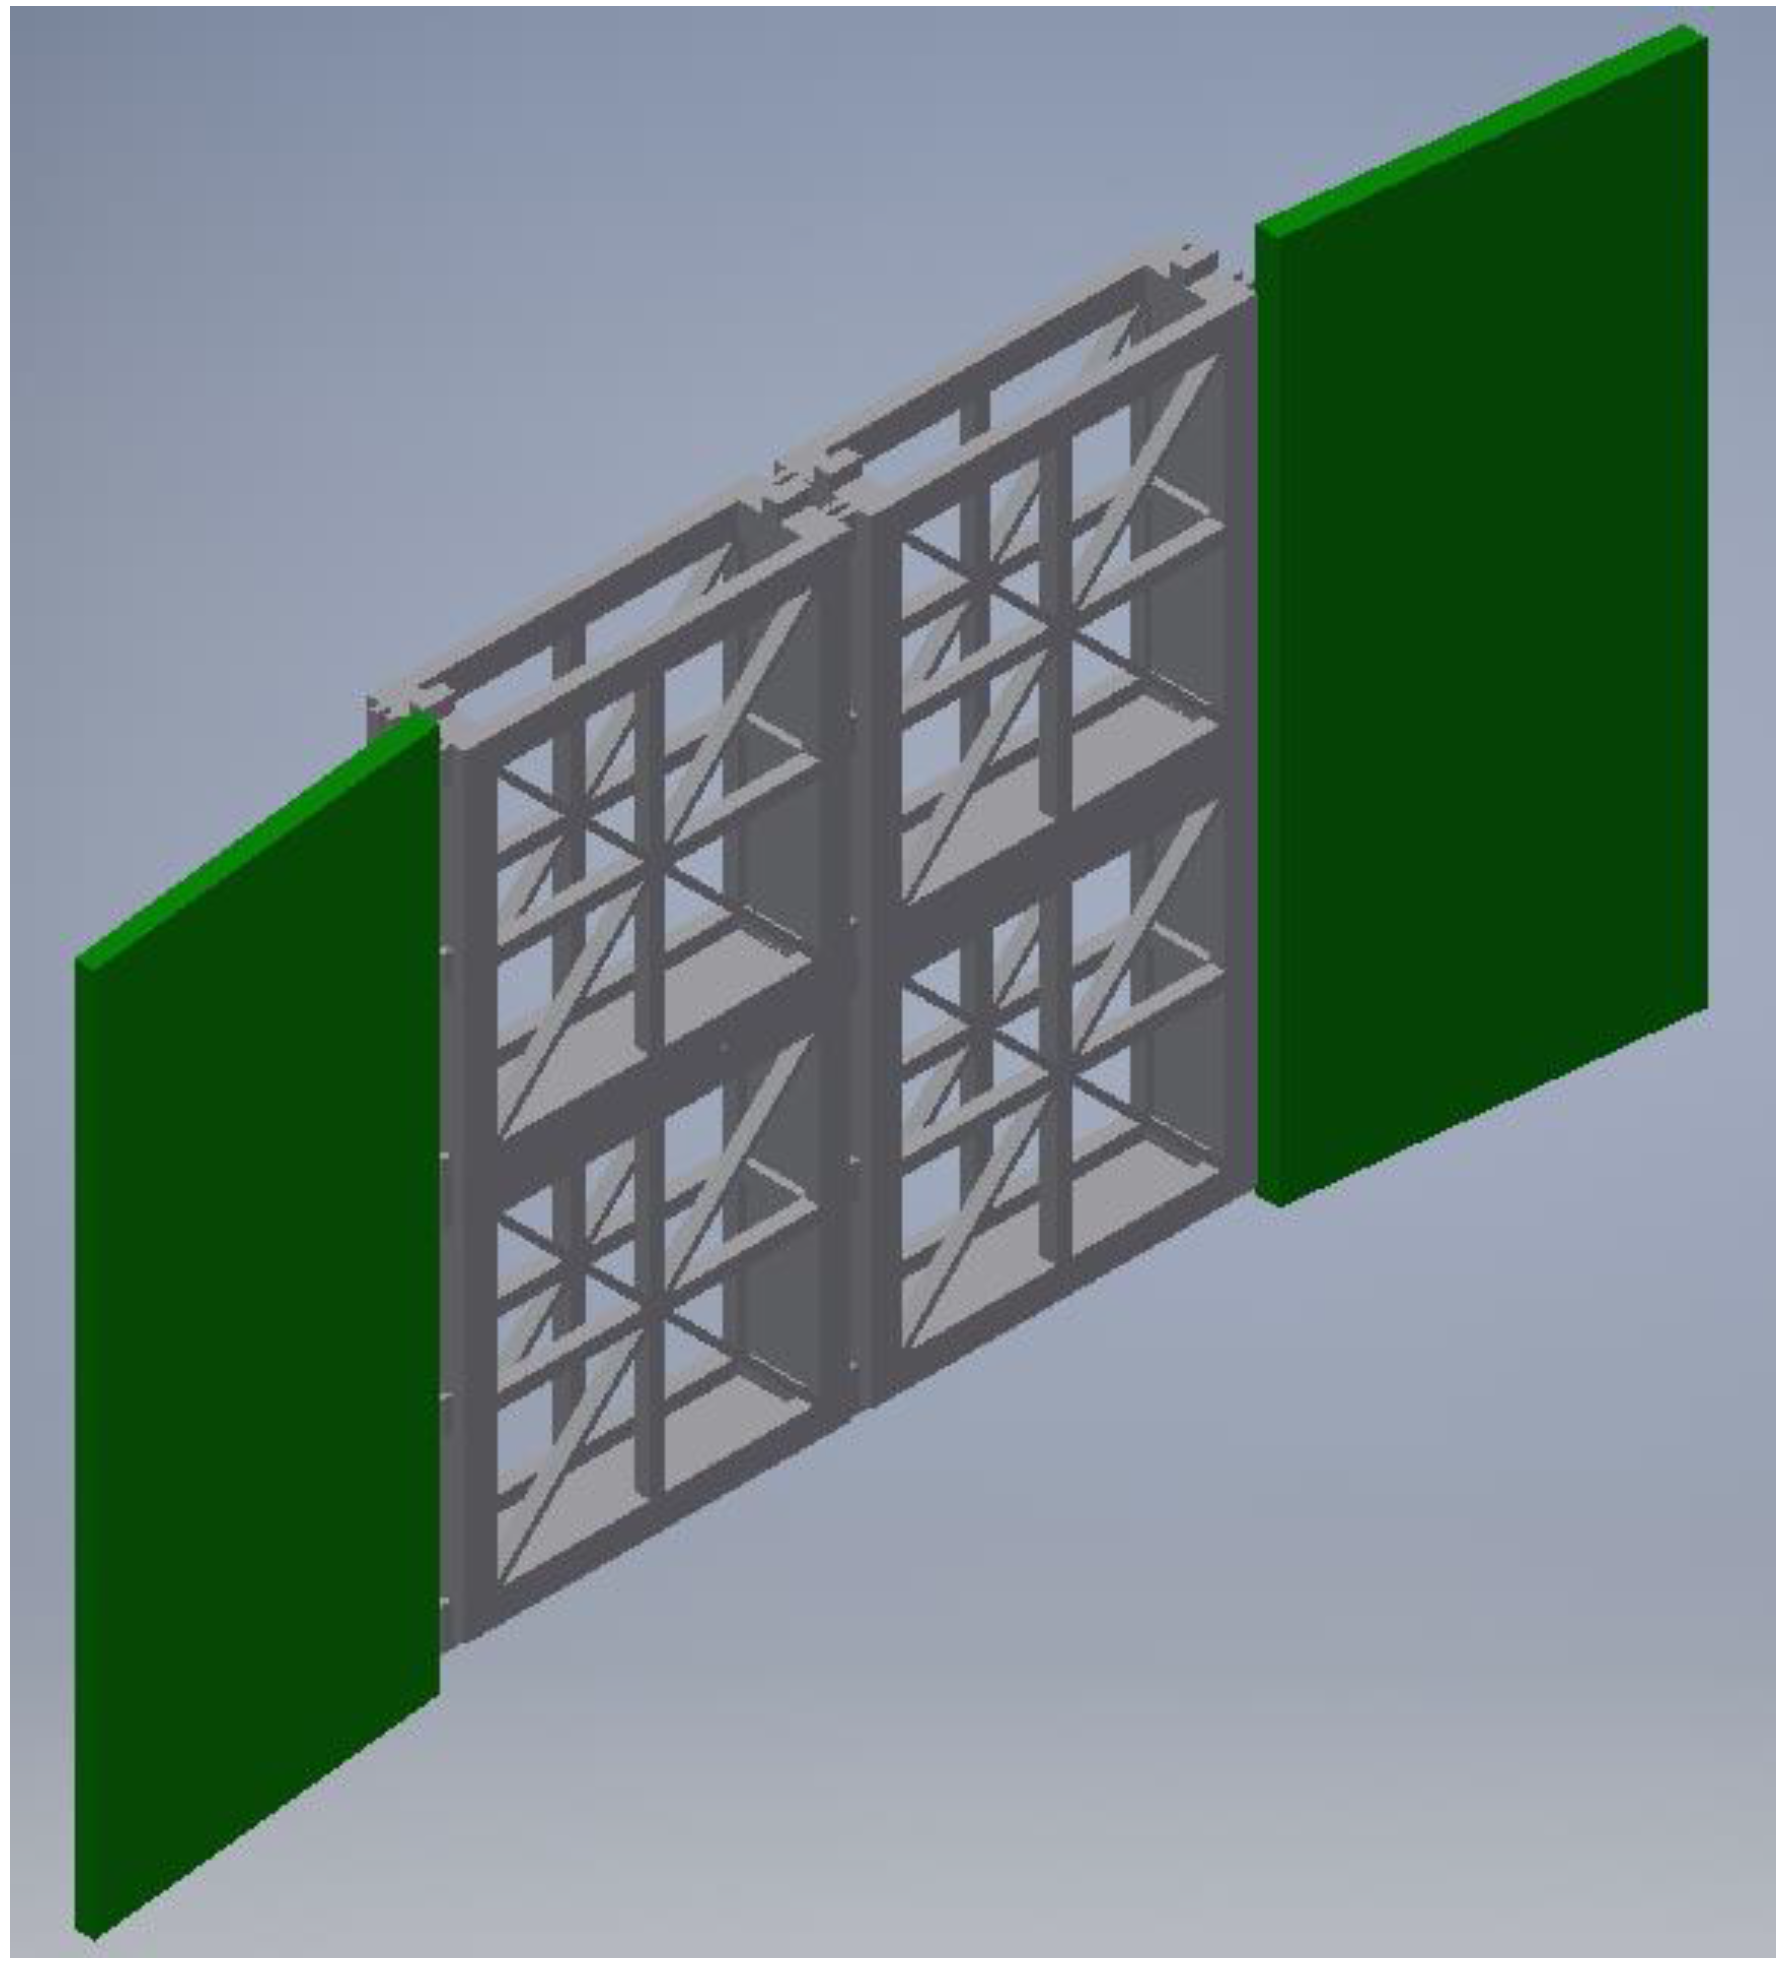
Figure 1 shows a representation of the final gate design. The cartridge dimensions were 0.31 m·L, by 0.31 m·H, by 7.62 cm·W.
The actual cartridge design was U shaped, with cross bars for support. The goal was to have as much open space as possible, to allow for greater flow through the area. However, additional support was necessary to keep the mesh bag containing WTR stationary. Therefore, a star design was ultimately incorporated, with 1.27-cm members running laterally, longitudinally, and diagonally in both directions. Each cartridge has a small cut in the bottom and extra material in the same spot on top to “lock” the cartridges in place and prevent cartridge movement within the gate. Additionally, each cartridge has a semi-track on the outside edge to accommodate nylon rope leads, which assist with installation and removal in field. A semi-track along the sides and bottom was selected instead of continuous track to save on print volume, reduce weight, and reduce material costs.
The full-sized custom cartridges required custom 3D printing, chosen primarily due to the flexibility in 3D printing capabilities. Fusion Deposition Modeling (FDM) was chosen because of the wide range of printing materials available. Since the cartridges will be submerged for long periods of time in source waters for a drinking water treatment plant, it was determined that the material selected must be in-line with other materials used to make potable water. Other considerations included potential for leaching, potential degradation due to UV-exposure, and potential degradation due to being submerged for long periods of time.
Two common 3D printing materials, acrylonitrile butadiene styrene (ABS) and polylactic acid (PLA), were ruled out. ABS due to leaching concerns of the styrene component, and PLA because it was not suitable for use in submerged applications. Two other materials met the conditions necessary for the gate installation: biocompatible polycarbonate (PC-ISO) and Ultem
TM 1010. Polycarbonate is a biocompatible grade, high-strength, high-impact resistant thermoplastic. Ultem
TM 1010 is a member of the ULTEM
TM Resin family of amorphous thermoplastic polyetherimide (PEI) and is available for general purposes and at certified grades. The certified grade is biocompatible and is approved for food contact with National Sanitation Foundation (NSF) 51. The NSF 51 certification deals with food equipment materials, such as plastic materials.
Table 2 contains information on all materials considered.
Food-grade certified, biocompatible polycarbonate was selected as the material for the cartridges as it was deemed the most cost effective. The cartridges were manufactured by FATHOM (Oakland, CA, USA). Prior to installation, photographic evidence of the cartridges was conducted to assist with documenting physical degradation/weathering that might occur while deployed in the field.
2.6. Preliminary Field Test, Full Gate Installation and Monitoring Approach
Preliminary cartridge design was tested from 1 July 2019 to 7 August 2019 with just one cartridge filled with Al-WTR placed in Eckert’s Ditch (
Supplemental Figure S1). A temporary gate made from two angle irons (3.81 cm × 0.32 cm), one u-gauge signpost (1.27 cm × 182.8 cm × 0.16 cm) and one steel bar (2.54 cm × 182.8 cm) to secure the cartridge. A second cartridge was tested from 26 September 2019 to 25 October 2019.
No physical damage occurred to the test cartridge during the preliminary testing. Despite this, the research team decided that long term in-field use and the need for a more ‘rugged’ installation/removal dictated additional support needs. This was addressed by thickening the corners of the star shape walls where they connect to the sides, top and bottom of the cartridge.
Full-sized gates were installed in Eckert Ditch in April 2020 and May 2020. Gates were installed in a zig-zag pattern, staggered to allow water to flow both through and around the gates. Gate 1 is located on the west bank of Eckert Ditch at Dawley Road. Gate 2 is located on the east bank, several feet down stream of Gate 1. Continuing downstream, all sequential odd number gates are on the west bank and even number gates on the east bank. A simplified sketch of the gate and sample locations are provided in
Figure 2.
Eckert Ditch is a shallow, flashy ditched stream, prone to flooding and changing water speed/height during storm events.
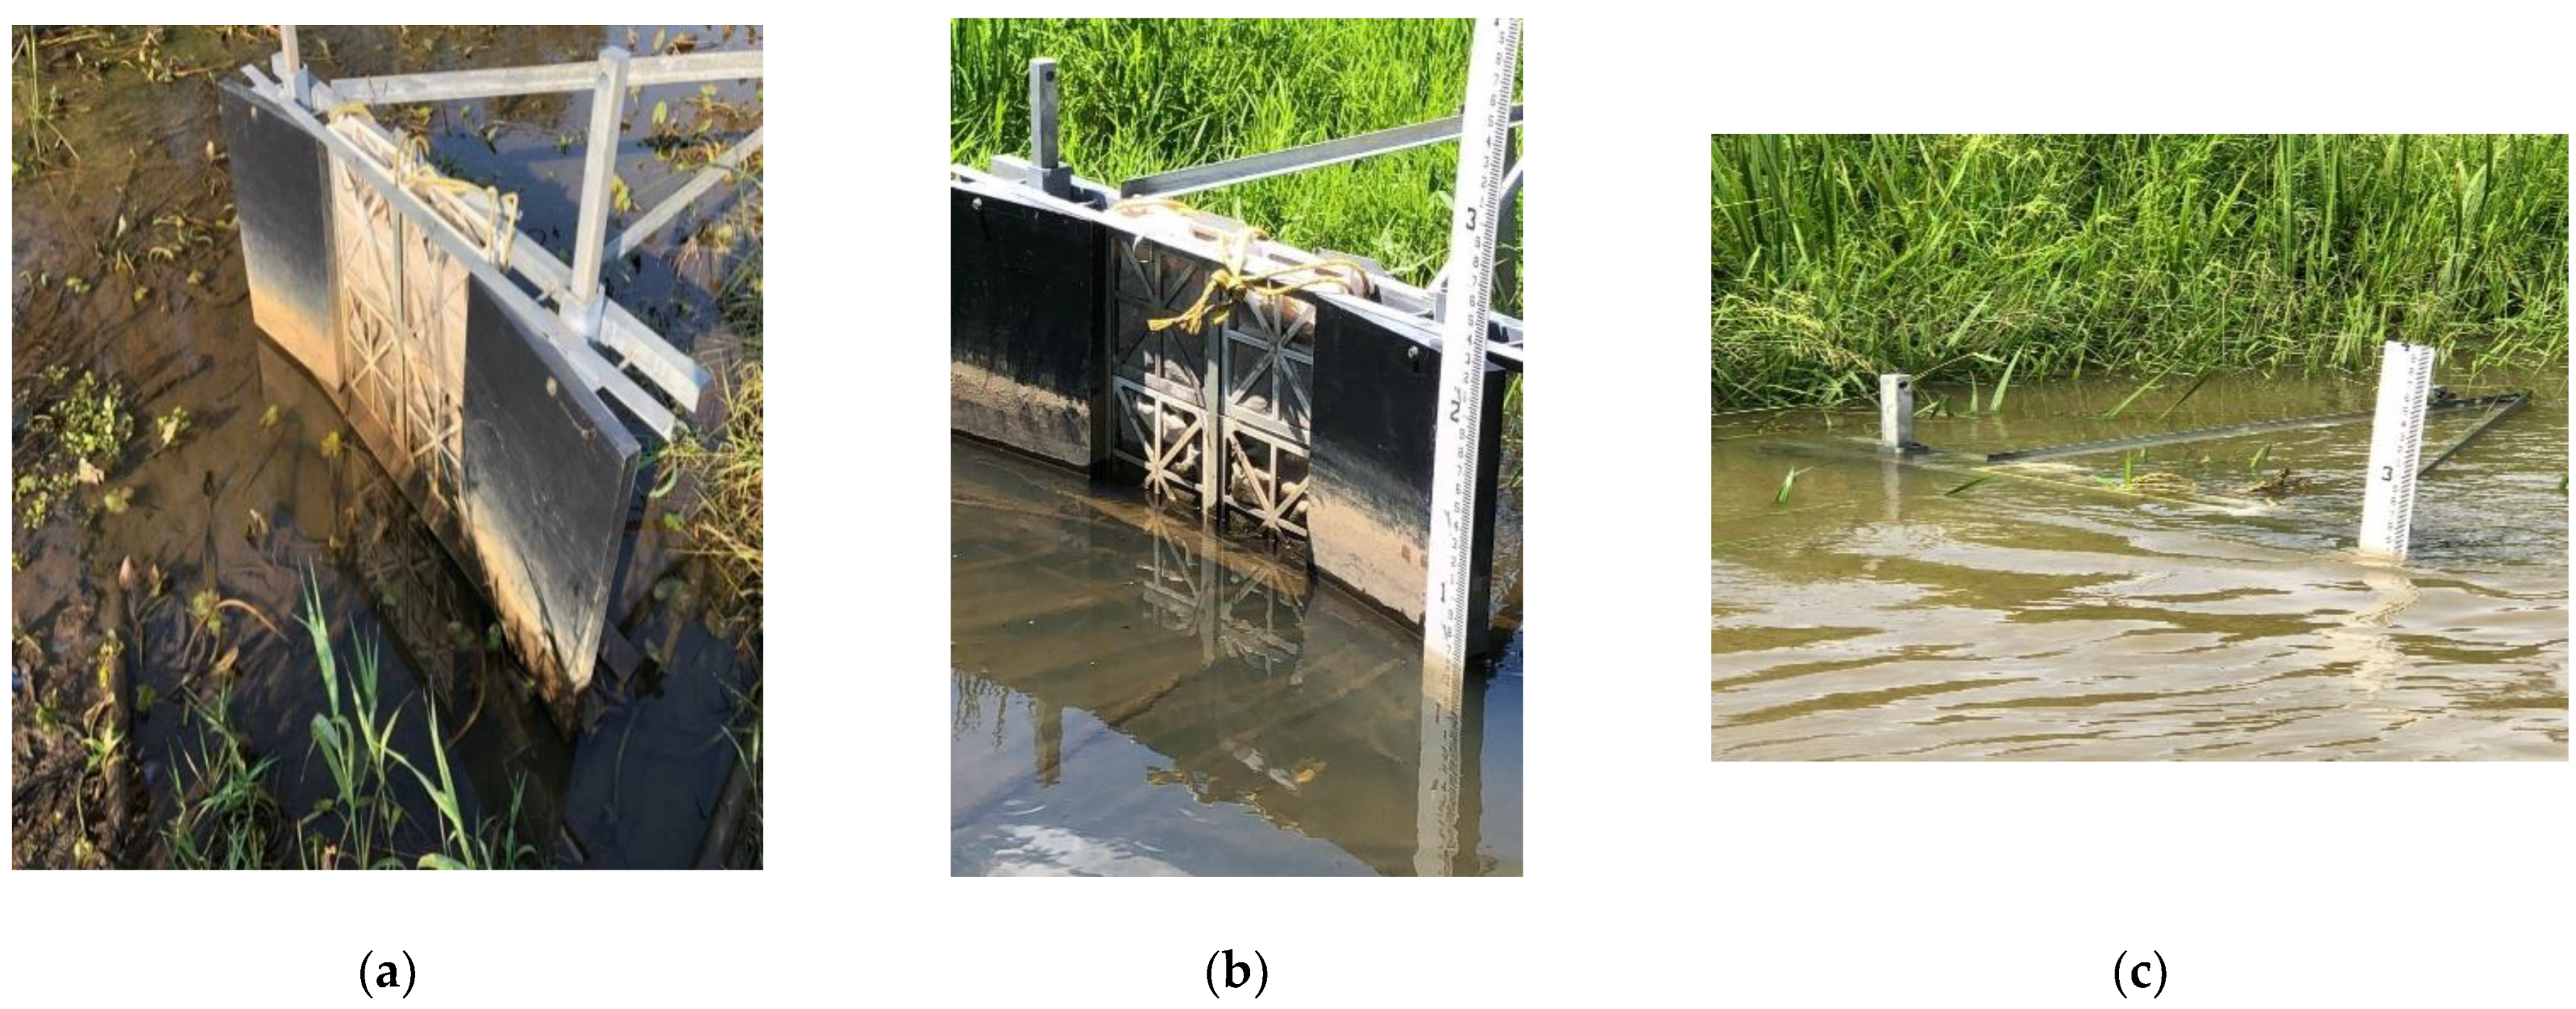
Figure 3a demonstrates ‘normal’ water levels, as well as significantly changing water levels during such events. This was tracked across sampling dates and different gates during the same sampling event. An independent depth marker was used to provide more accurate measurements of the water level (
Figure 3b) to assess how much of each of cartridge was in contact with water. Tracking the water level is important as effectiveness of the gates are a function of the WTR capacity, but only when they are submerged in water.
3. Results
As mentioned earlier, samples were taken immediately before and after each gate to determine the PO
43− concentration (
Figure 2).
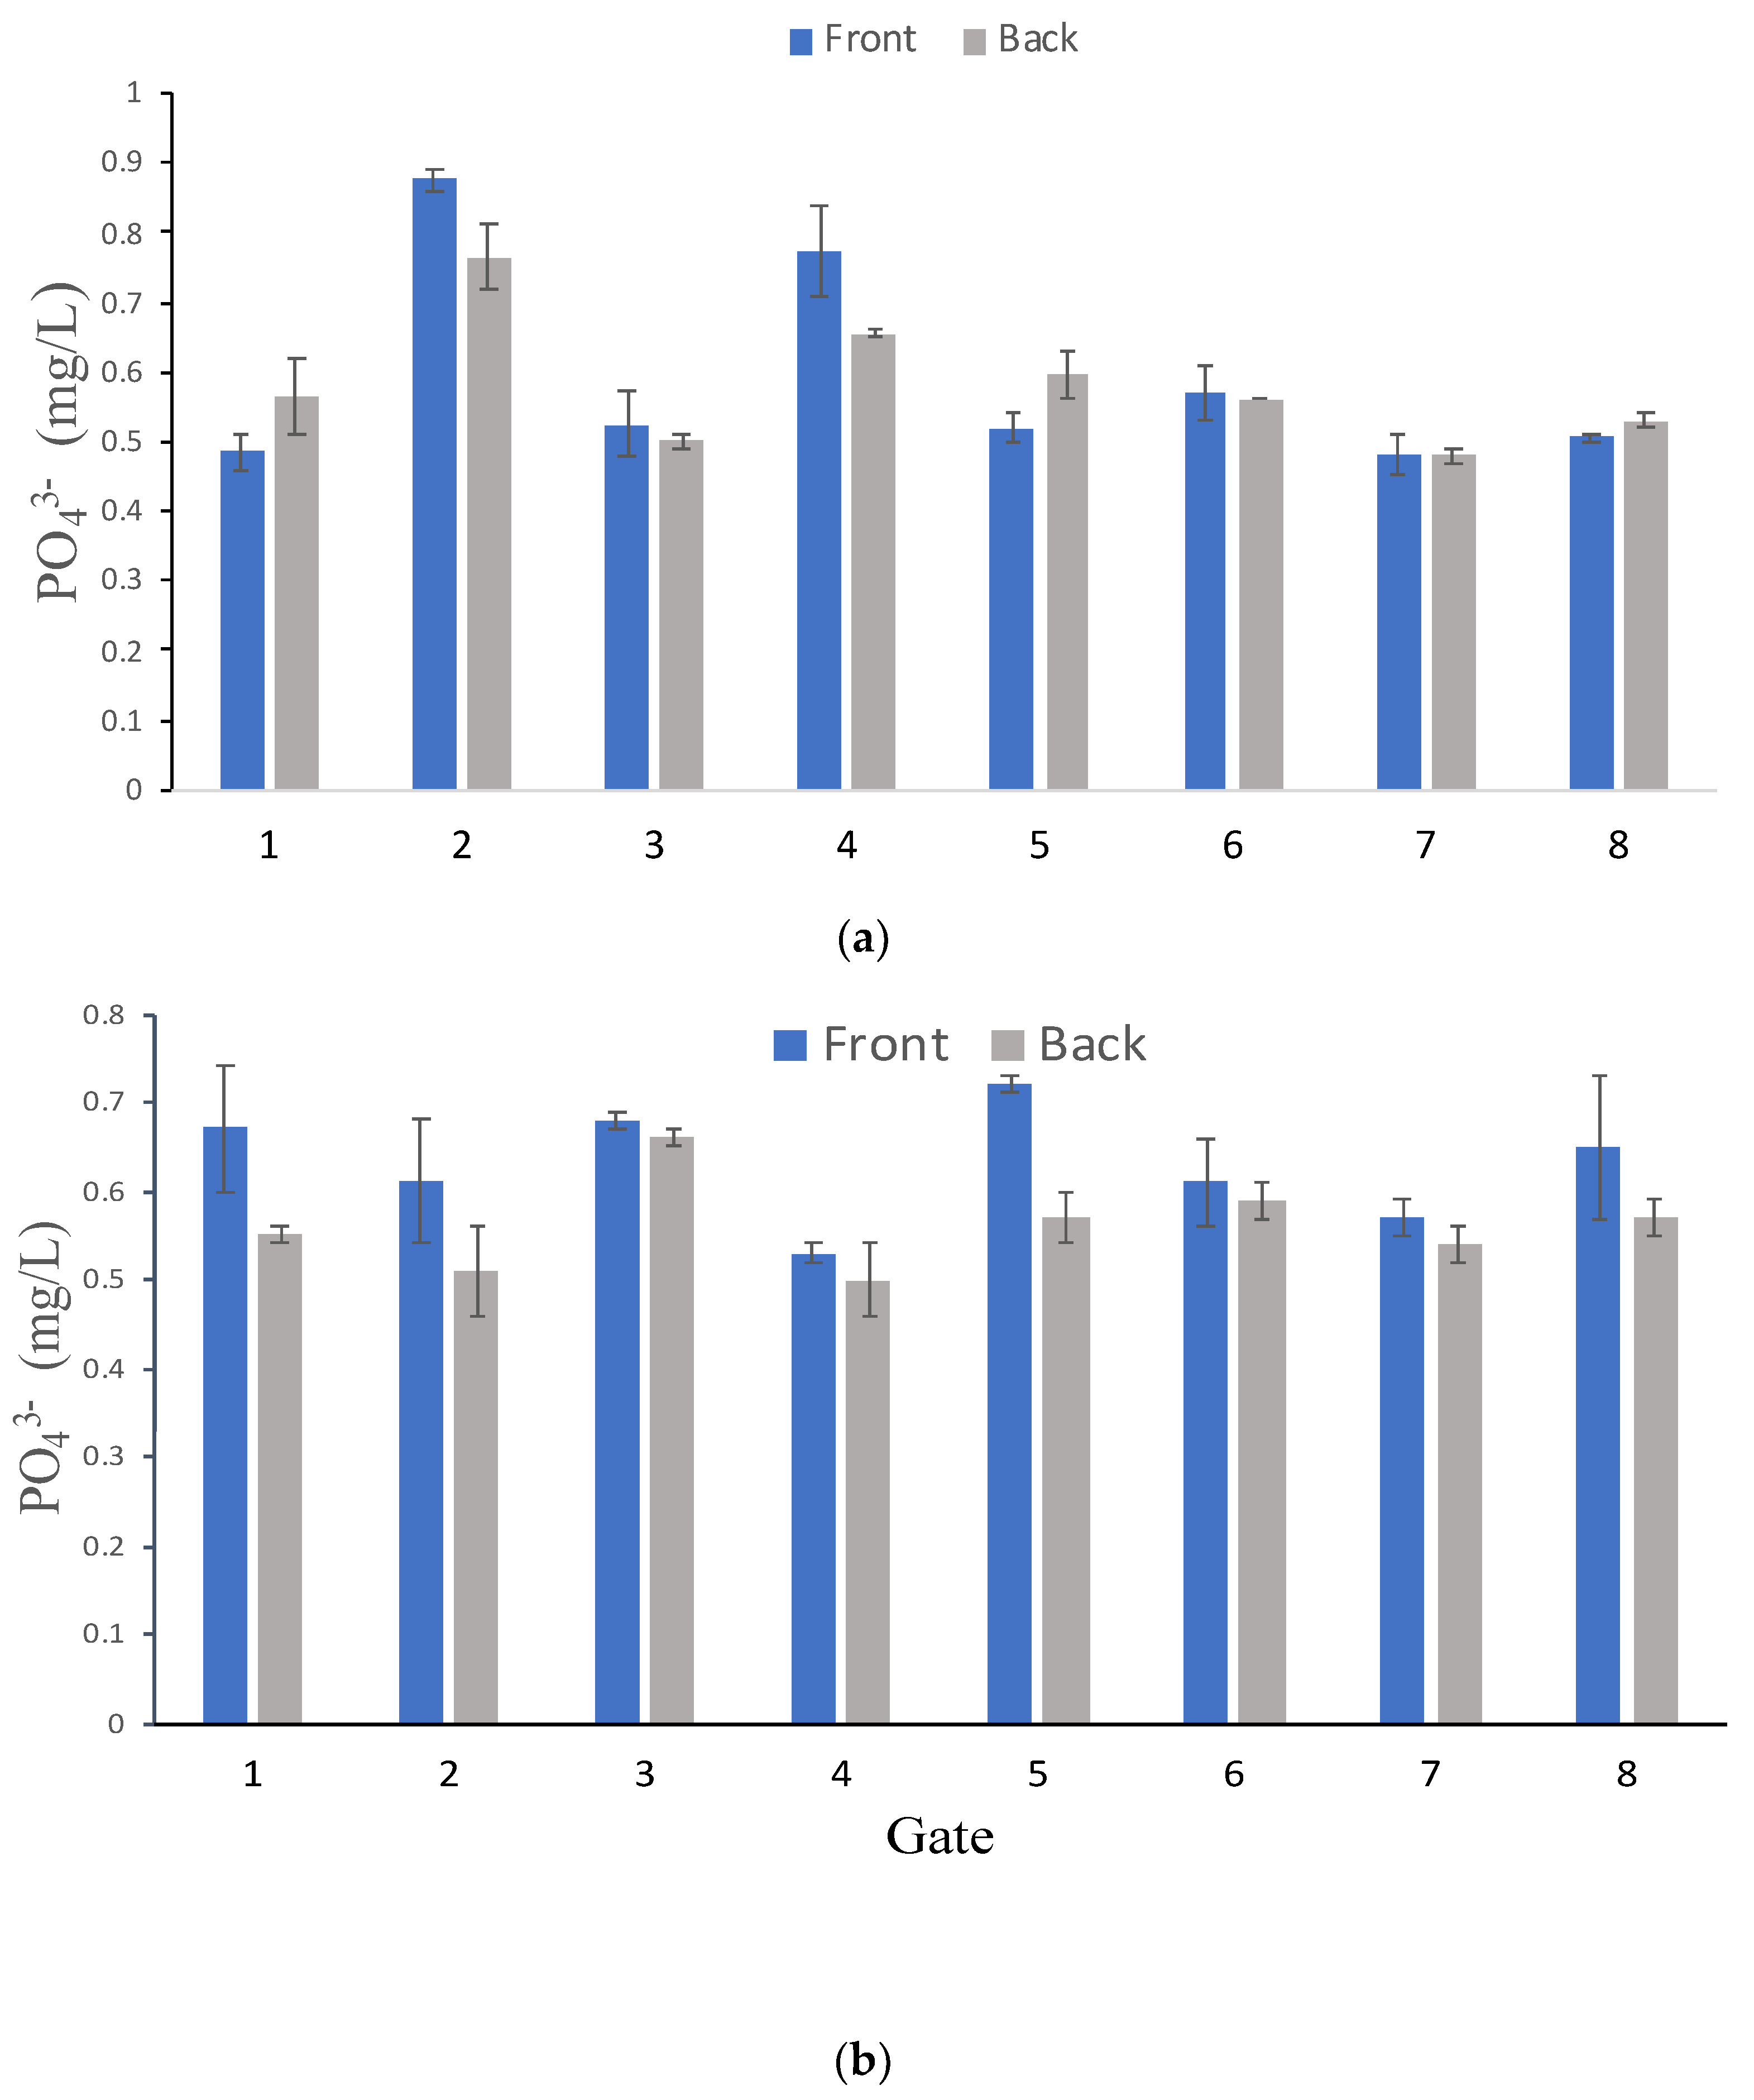
Figure 4 contains a representative field evaluation of two sampling events on 2 June 2020 and 8 September 2020. As expected, PO
43− concentration varied as water moved downstream from the system. The PO
43− concentration was higher before and lower after passing through the Al-WTR contained in the four cartridges of Gates 2, 3 and 4 on June 2 (
Figure 4a). Water levels in Eckert’s Ditch were observed to impact the amount of contact with the Al-WTR in the four cartridges within the gates (i.e., low water level resulted in a lower percentage of the gate and subsequent WTR in the cartridges submerged). As shown in
Figure 4b, the mg PO
43− concentration immediately after the gate was lower than that before the gate for all gates. On 8 September 2020 the amount of each gate area that was in contact with the water (i.e., % submerged) ranged from 0 to 75%, whereas on 8 September 2020 all but Gate 2 were 100% submerged (
Table 3).
The water level and flow in Eckert Ditch can change dramatically with weather events. Generally, the site has very slow flow, but during even moderate rain events the stream can overflow banks, flood the surrounding land and roads, and increase flowrate. The increased water level and flowrate is heavily dependent on the elevation of Lake Rockwell Reservoir as Eckert Ditch is close enough that reservoir conditions affect stream conditions. A combination of low flowrate and high water level are ideal for the system as the passive–reactive adsorption system being used has increased efficiency with increased contact between PO43− and the WTR. If the flowrate is too fast the water will not have adequate contact time with the WTR in the cartridges. During high rain events, the water flowrate will be high. However, as the increased water level in Eckert’s Ditch dissipates slowly due to a similar increased water elevation in Lake Rockwell, the flow rate is decreased while maintaining a higher than average water level.
In addition to evaluating gate performance at each sampling event, changes of each gate with time and the number of times the cartridges had to be refreshed were also tracked. As expected, the WTR replacement frequency decreased through the system as the first few gates were exposed to the highest PO
43− concentrations. The cartridges in Gate 1 were replaced twice while other gates were replaced only once (
Table 4). As was shown in
Table 1, each cartridge contained 11.35 kg WTR for a total of 45.4 kg WTR per gate. Replacing the cartridges in Gate 1 yielded a total of 136.2 kg WTR used for the season, whereas Gates 2–7 only used 90.8 kg. Four extra mesh bags and cartridges enabled all cartridges in a gate to be replaced at the same time they were removed with fresh WTR in the spare cartridges. This reduced the need for a second visit and only briefly taking the gate out of service (around 15 min for each refresh event). All cartridges were removed from the Gates at the end of October in preparation for winter conditions. Visual inspection of the cartridges and mesh bags indicated that none had experienced any major damage while deployed in field.
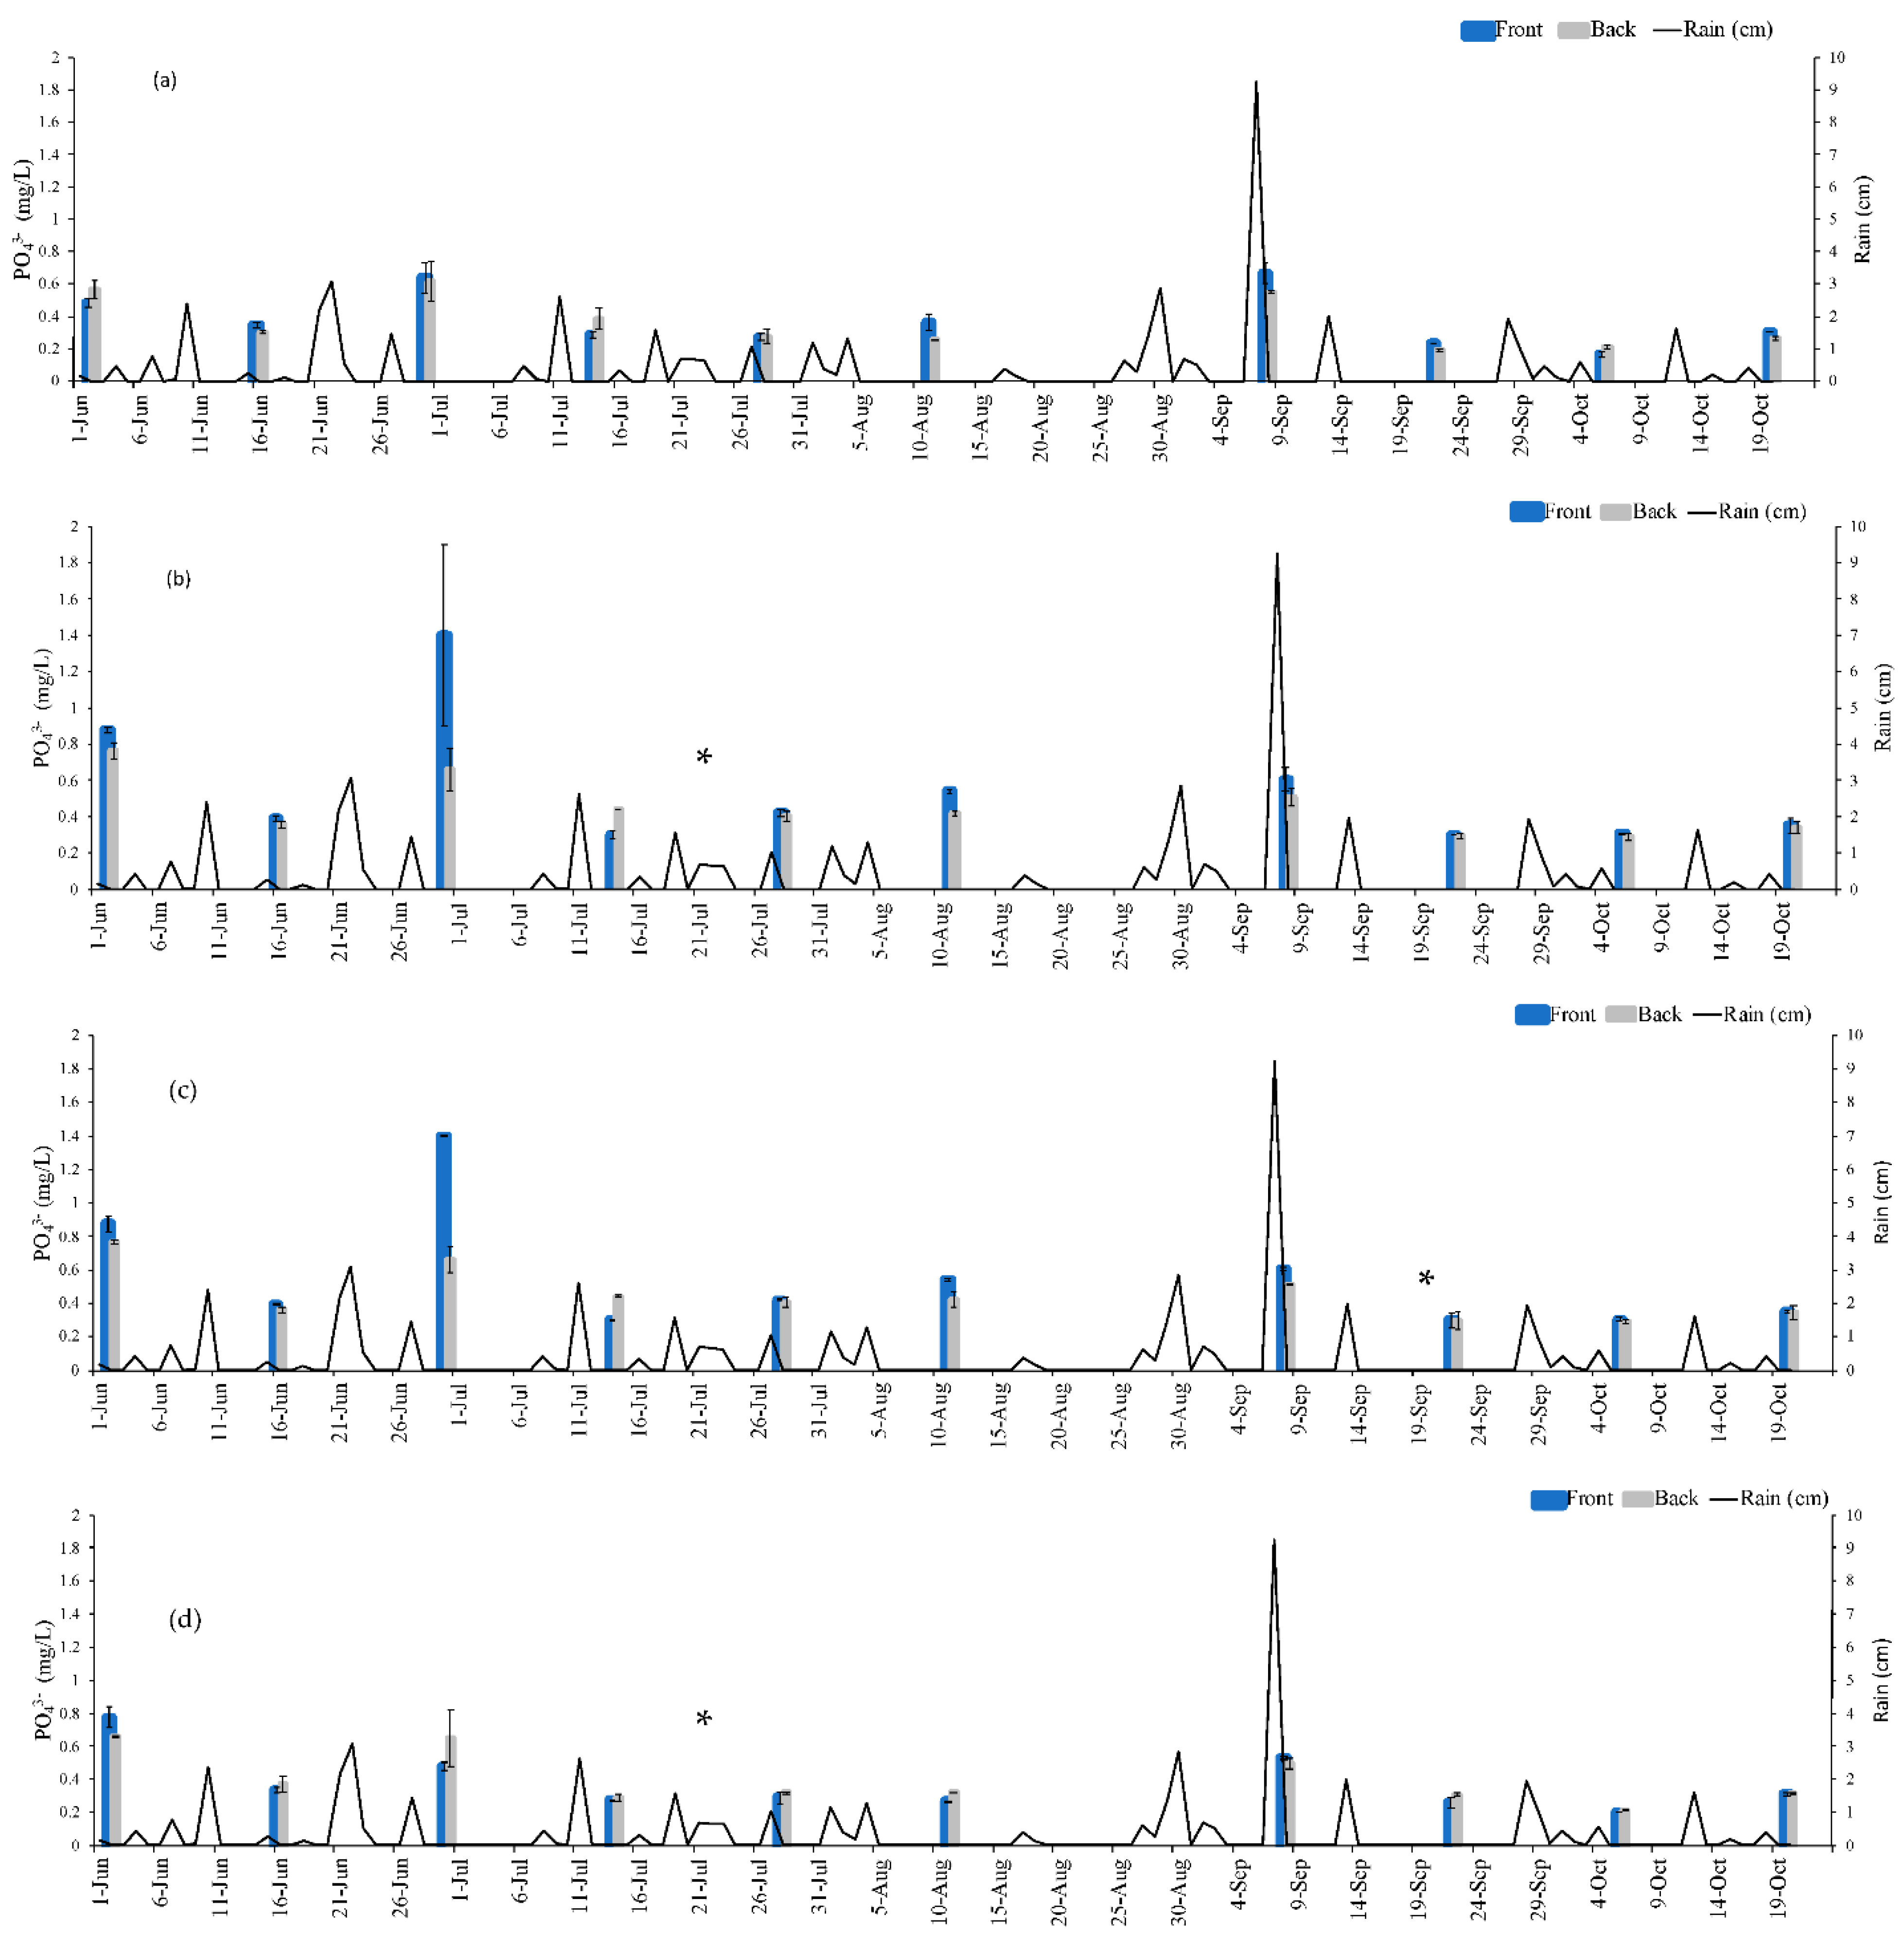
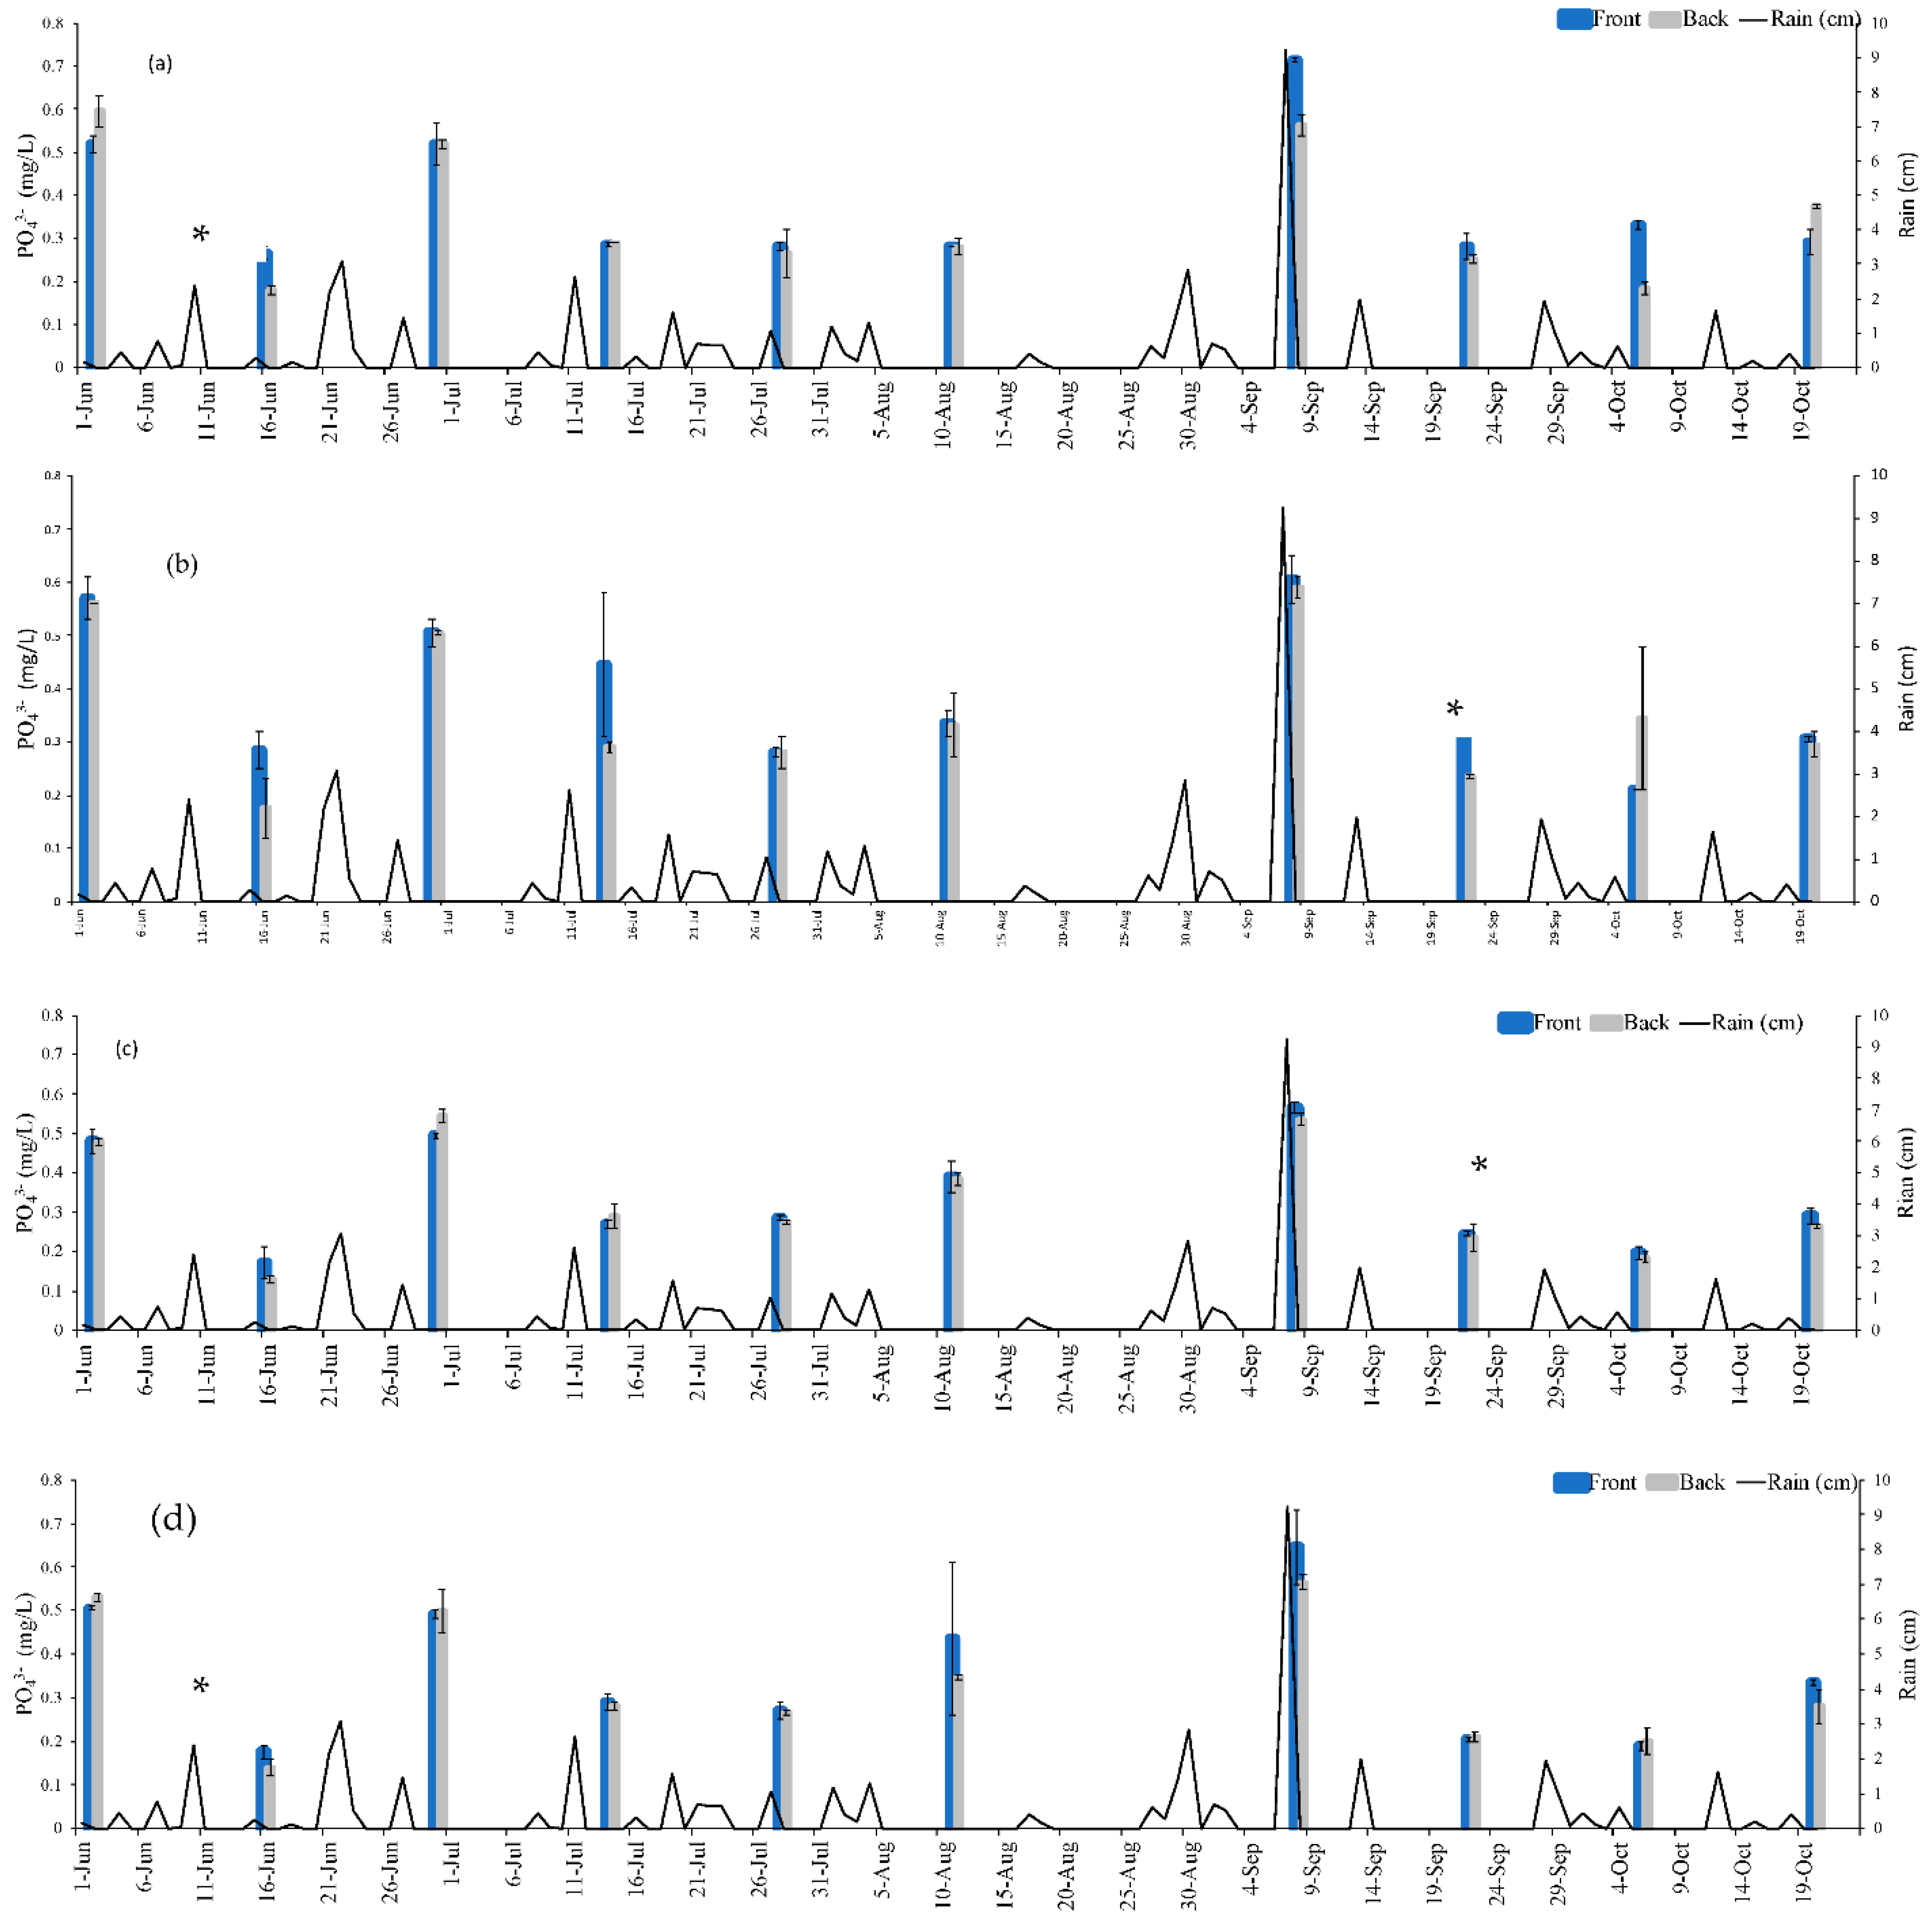
Figure 5 and
Figure 6 contains details on the PO
43− concentration immediately before and after passing through the gates (i.e., back) throughout the season for the Gates 1–4 and Gates 5 and 6, respectively.
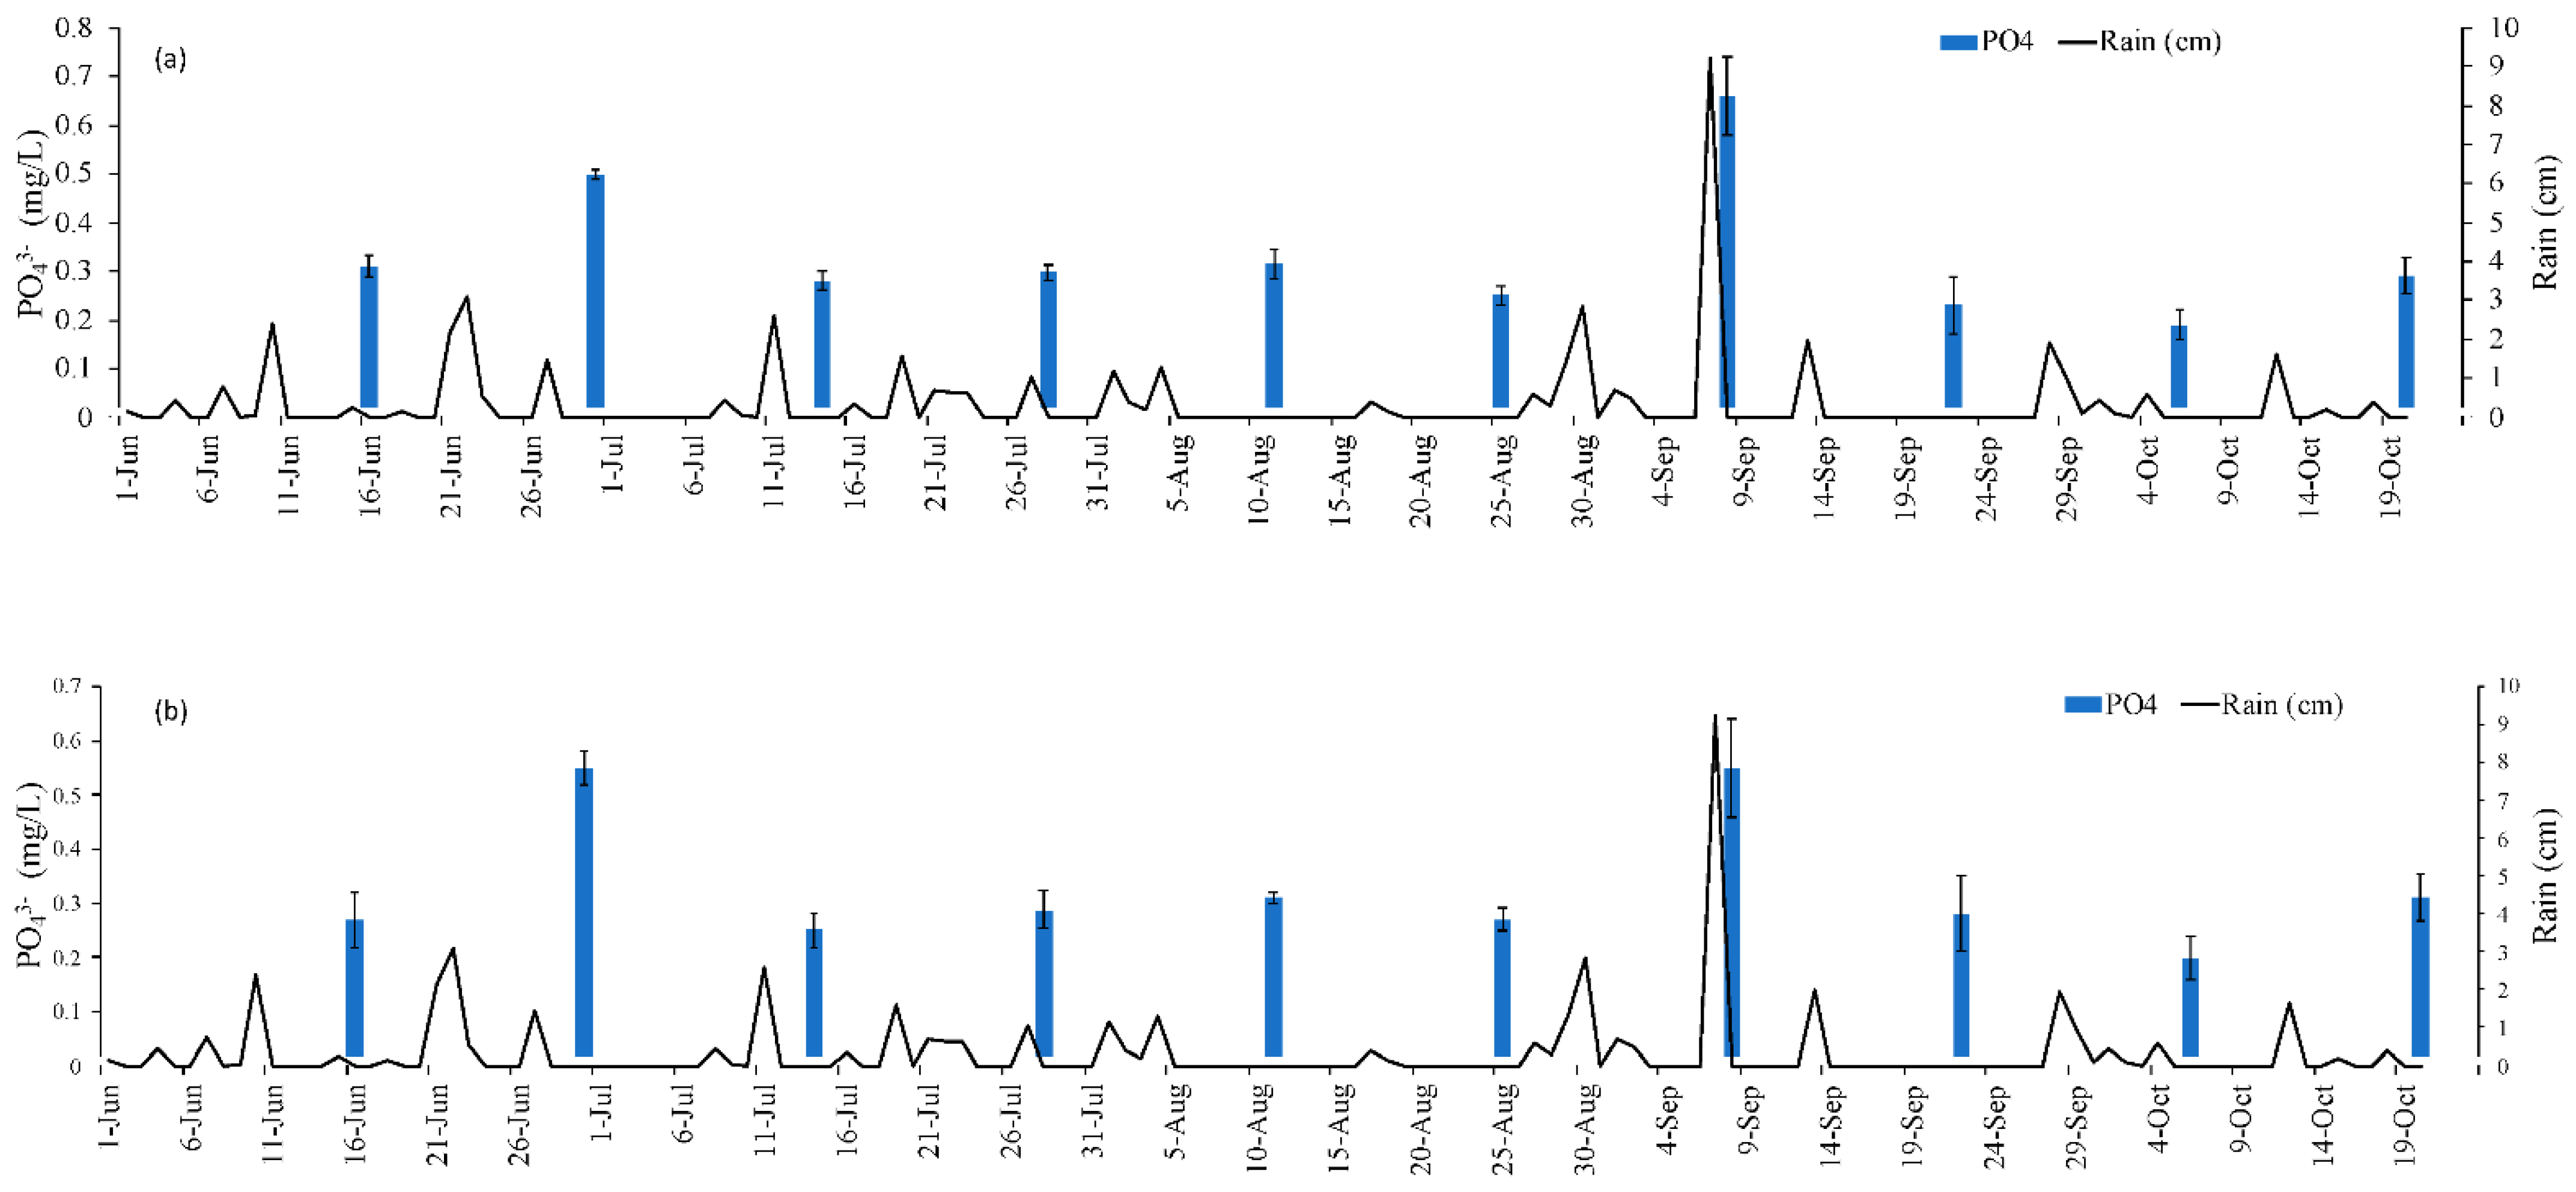
Figure 7 contains the average upstream (1 m before the first gate) and downstream (1 m after the last gate) PO
43− concentrations in Eckert Ditch (as indicated in
Figure 2), which were used to establish a baseline for the waterbody. Each figure also includes the amount of rainfall that occurred during the time the gates were in the field.
As shown in
Figure 7, some sample dates depicted mg PO
43−/L that were lower downstream than it was upstream (PO
43− removal), while others had higher downstream concentrations (increase in PO
43−). For instance, on June 16 the upstream and downstream concentrations were 0.31 mg PO
43−/L and 0.27 mg PO
43−/L, respectively, while August 25 had upstream and downstream levels of 0.25 mg PO
43−/L and 0.27 mg PO
43−/L, respectively. It is not possible to know exactly how much PO
43− was removed by the system by solely evaluating the upstream and downstream concentrations due to variability in field conditions (runoff entering the waterbody at multiple locations, fluctuating water levels and velocity, etc.). The results immediately before and after each gate provide a snapshot of the phosphorus sequestration at each gate. The PO
43− concentration before and after each gate (shown in
Figure 5 and
Figure 6) was input into Equation (1) in conjunction with the % of the cartridge submerged (
Table 3) and the average stream velocity (0.044 m/s) to provide an estimate of how much PO
43− was removed by the gates during each sampling event. Using this approach, it was determined that a total of 556.31 g PO
43− was removed from Eckert’s Ditch. The sampling dates were spread across 151 day (2 June to 20 October). Dividing 556.31 g PO
43− by 151 days of operation yields an approximate 3.68 g PO
43− removed/d.
During individual sampling events, desorption of previously bound PO
43− was minimal. Desorption was estimated by comparing the difference between the PO
43− concentration of samples collected in front of the gate to those collected in the back of the gate. A negative value would indicate that more was released from WTR than was retained. For individual gates that had a higher ‘back’ than ‘front’ PO
43− mg/L, the values were in the range of 0.01–0.1 mg/L PO
43−. Miller et al. [
39] modelled their laboratory results where WTR had adsorbed 40 g/Kg-WTR and predicted that less than 2% phosphorus would desorb from WTR when used in a field application. It is important to note that 556.31 g PO
43− removed does not include the impact of cartridges for the entire season, but only the days of sampling events, which implies that the actual PO
43− removal for the season was much higher than the measured values. Lowering the upstream PO
43− concentration could significantly impact HAB potential by limiting nutrient availability [
40].
4. Discussion
The United Nations has identified water quality improvement as a global need [
41]. Possible methods range from modelling where possible contaminants are coming from to placement of best management practices to development of new techniques to reduce nutrient loads either before or after they enter the water body [
42]. The four main requirements for a passive removal of PO
43− are high enough influent concentration (i.e., >0.2 mg/L), placement of the structure/barrier in the proper location, flow through the system at an acceptable rate, and ability to replace spent material [
43]. Although the introduction mentioned steel-slag for PO
43− removal, the discussion will focus on WTR or systems configured closer to the Gate system. Please refer to Claveau-Mallet et al. [
44] and Shedekar et al. [
21] for more details on the effectiveness of steel slag.
Miller et al. [
39] evaluated use of WTR as a 1-m thick passive barrier to remove PO
43− but did not provide any details on the full-sized structure other than that the material could be in place for decades depending on the flowrate and initial concentration. Zhao et al. [
45] placed a 65-cm alum sludge layer in an experimental fed-batch-constructed wetland to treat wastewater from an animal farm in Ireland. It achieved mean monthly removal efficiencies of 75–94% for influent total phosphorus levels of 10.7–33.3 mg/L with a batch 4 h. contact time.
Figure 5 and
Figure 6 indicated a removal of 0.02–0.74 mg/L PO
43− depending on the sample date. This range was lower as grab samples do not provide a continuous evaluation. Since at least half the gates were nearly always submersed to some extent, a potential continuous removal of PO
43− was possible thereby increasing the subsequent total amount of PO
43− removed. The percentage submergence of each gate (
Table 3) depended on the amount of preceding precipitation. For instance, seven of the gates were completely submerged on September 8 after receiving over 9 cm of rain the day before. The fact that at least half the system was in constant contact with water could potentially overcome water velocity issues identified by Wagner et al. [
23] and Habibiandehkordi et al. [
24]. It was not possible to track velocity changes during a severe storm, however even when the velocity after a storm was ~0.18 m/s, more water was still in contact with the Gates as the water level had increased. As mentioned in the
Section 3, the water level was slow to dissipate due to the impact of elevation levels in Lake Rockwell.
The study conducted by Karczmarczyk and Bus [
46], which was the closest to our Gate system, used suspended reactive curtains (i.e., filters containing reactive materials) for binding phosphorous. The material was suspended from a pole placed above a 1-m wide by 2 m long × 14 cm water body. The system used three rows of eight filters containing 50 g autoclaved aerated concrete (AAC) per filter and the system decreased PO
43− from 1.35 to 0.19 mg PO
43−/L and increased pH from 7.61 to 8.72. In order to fully compare Karczmarczyk and Bus [
46] with this study, dynamic similarity was used to bring WTR used to the same scale. For Karczmarczyk and Bus [
46], the system contained 0.28 m
3 of water and was operated for 34 days which translated to 0.13 Kg AAC/m
3-d. The treatment area of Eckert Ditch is 289.56 m long with an average width of 0.76 m and water depth of 0.61 m. Each gate contained 45.4 Kg WTR for a total 766.76 Kg WTR that was used for 151 days yielding 0.04 Kg WTR/m
3-d. The WTR used in the Gate system was one order of magnitude smaller than that of AAC. In addition, the WTR did not need to be autoclaved prior to use.
The approach described in this manuscript is more versatile in that the cartridges in the gate can be easily changed as often as needed to accommodate changes in flow, water chemistry, and increased inputs during storm events. Our proposed approach also utilizes WTR that was generated from treating the source water it came from. This means that anything that desorbed from the WTR would have been previously sorbed from the source water, making it a closed system. Other processes have used WTR as adsorbents, though there is no indication that these materials were generated from the source water.
5. Conclusions
The project expanded on laboratory-scale research to design a full-scale passive treatment system for removing PO43− from a tributary before it entered a drinking water reservoir. The system was comprised of eight treatment gates, with each gate containing four cartridges filled with approximately 11.35 kg of WTR. The cartridges were 3D printed from food-grade certified, biocompatible polycarbonate. Cartridges were installed in later April and early May and removed at the end of October. One season of service saw removal of 556.31 g PO43− or approximately 3.68 g PO43− removed/d. The gate system provided PO43− sequestration in-stream and removed all sequestered PO43− from the system when the media was refreshed. While there is room to improve gate, cartridge, and mesh bag design, the use of WTR to bind and remove PO43− in a stream upstream of a drinking water reservoir shows incredible promise for controlling nutrient loading into water bodies by removing pollution upstream. This system has the potential for utilization in streams with known phosphorus issues, and provides measurable results showing the actual reduction in PO43− from the water system. The novelty is a refillable, rechargeable system provides in-stream nutrient control that, with minimal upkeep, provides nutrient sequestration without permanently adding material to the waterways, reducing sedimentation and accelerated eutrophication of reservoirs and lakes.
Though there are initial setup costs, once the system is in place the costs dramatically decrease. As the system relies on beneficially reused Al-WTR, which conventional WTPs pay to dispose, there is minimal cost associated with the procurement of the material, even when combined with the assumed costs associated with staff hours to collect, fill, and exchange cartridges. The system is affordable by even small utilities/communities, reduces accelerated sedimentation/eutrophication associated with using alum or clay products for legacy phosphorus sequestration, provides measurable PO43− removal, and permanently removes sequestered phosphorus from the watershed.


