
Resilience Assessment for the Northern Sea Route Based on a Fuzzy Bayesian Network


Abstract
1. Introduction
1.1. Literature Review
1.2. Discussion of Existing Studies
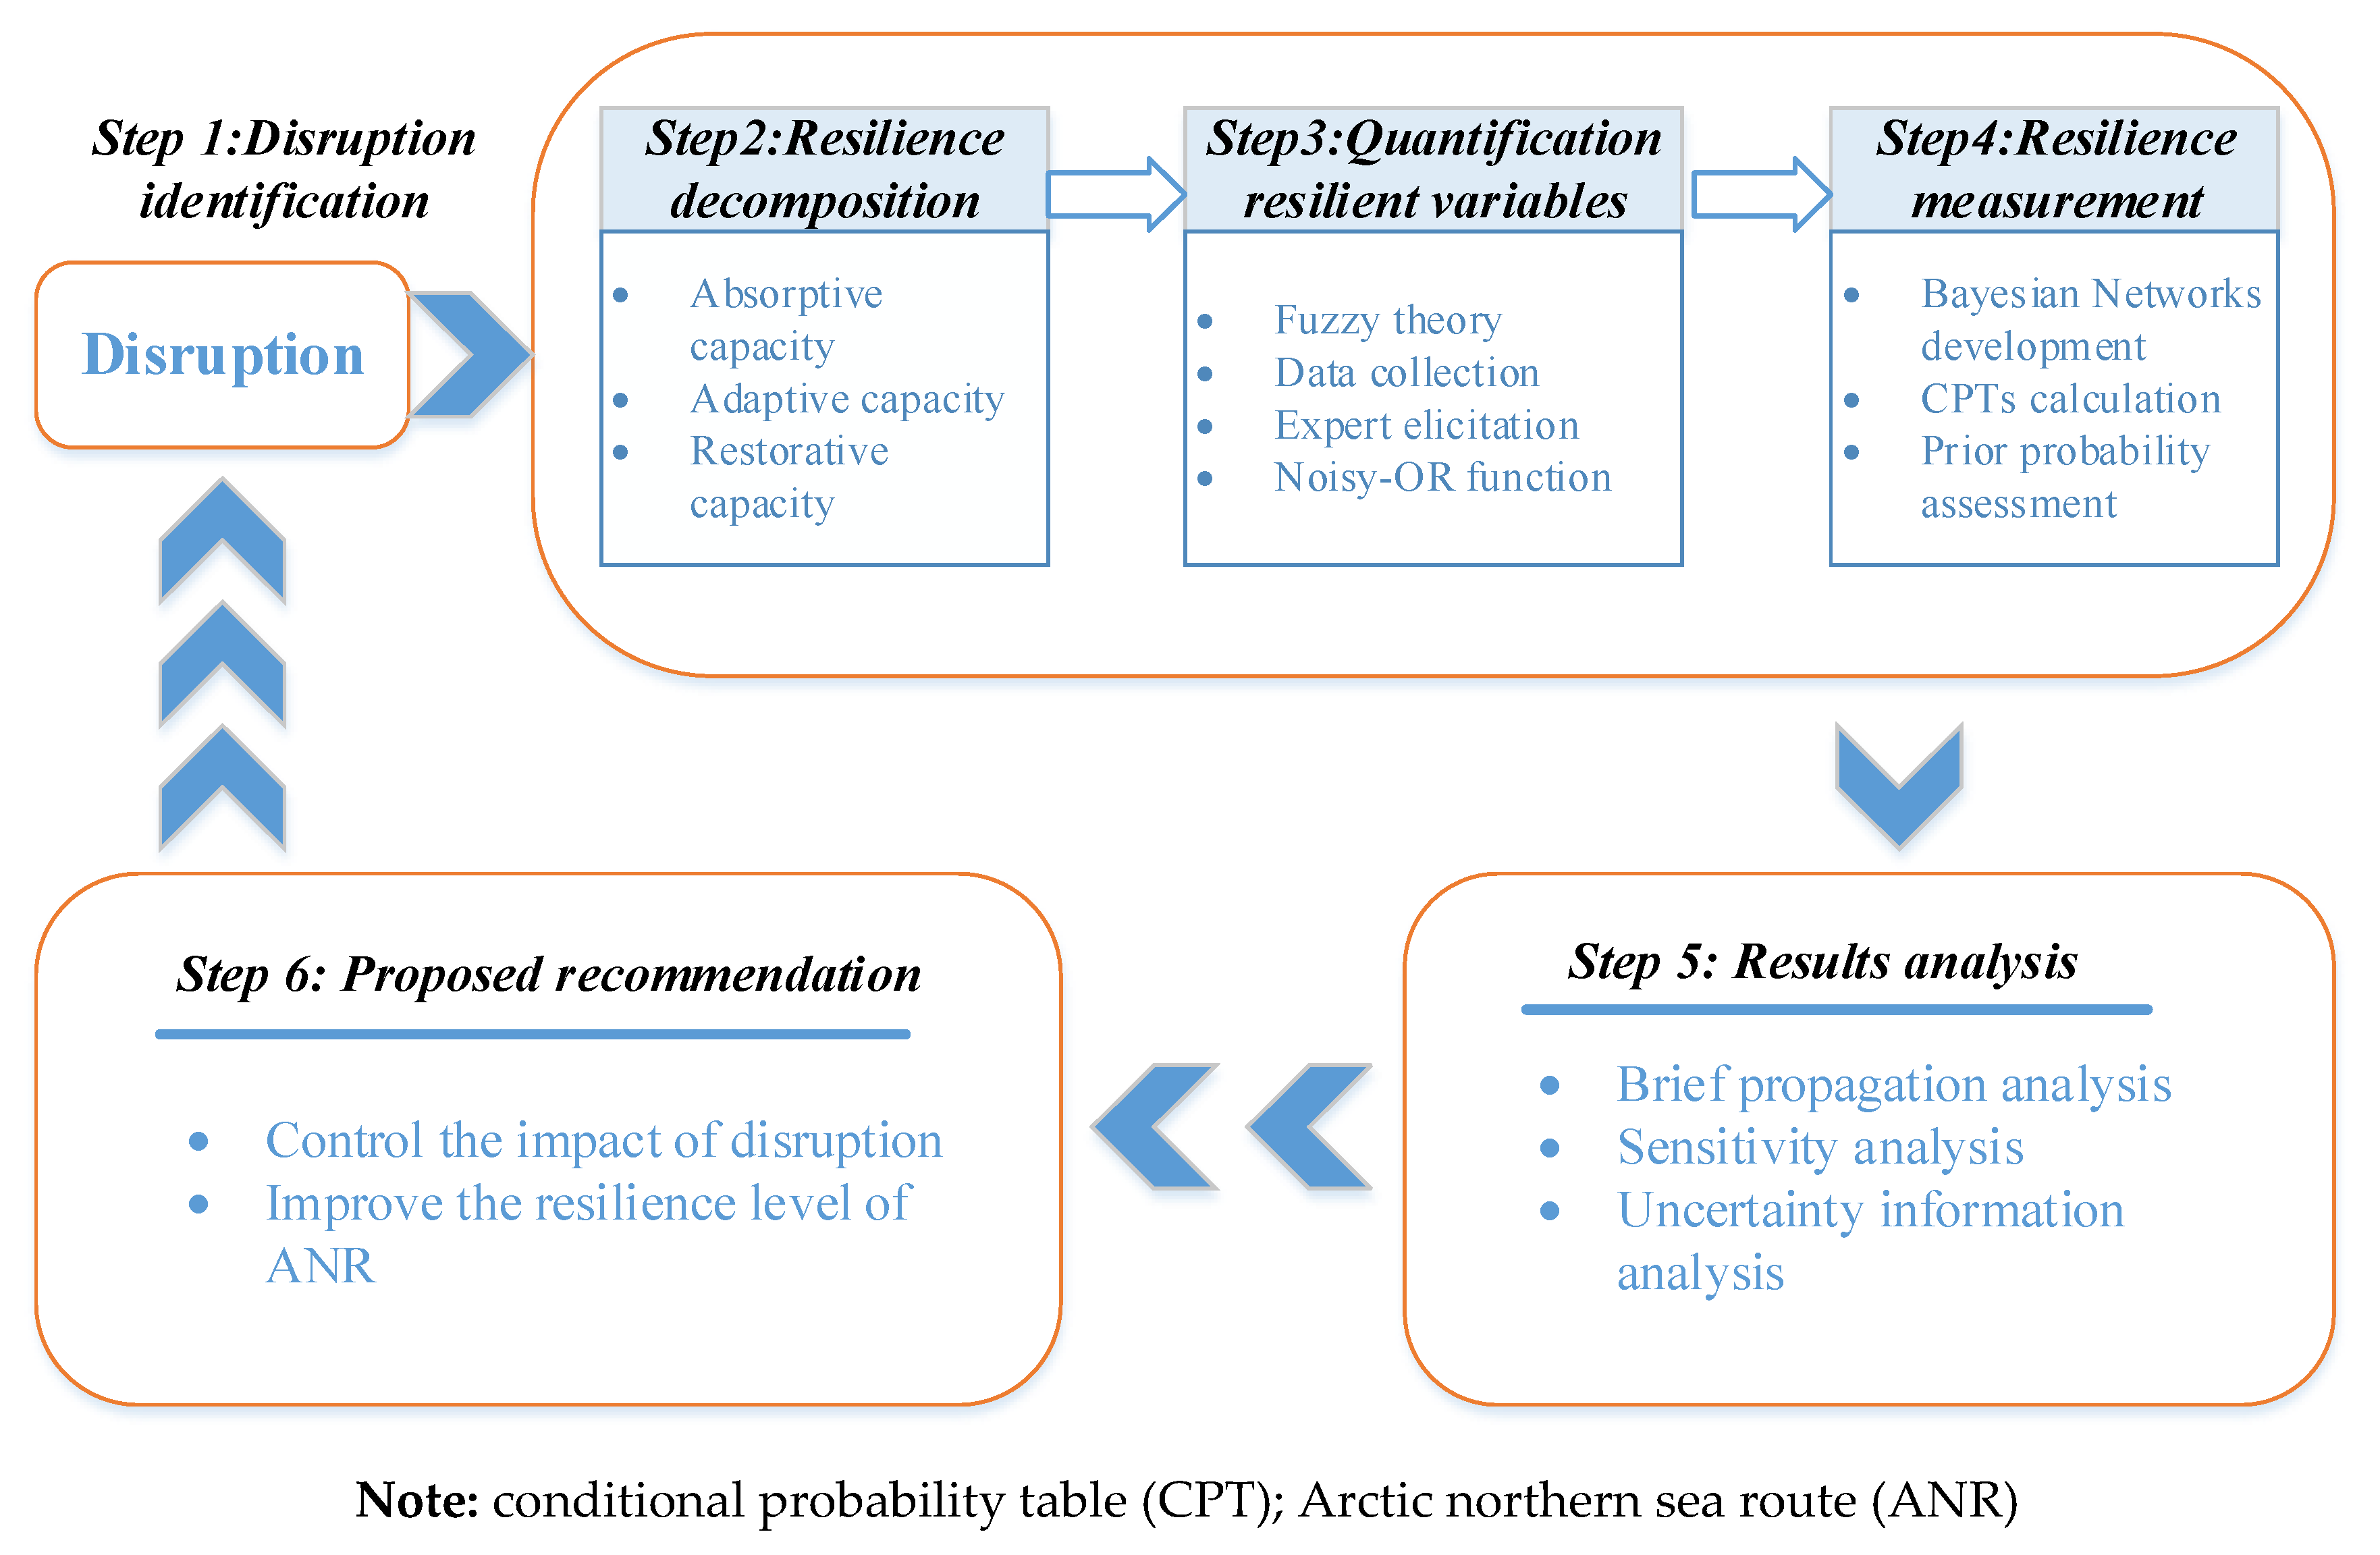
- A system resilience analysis framework is explored to improve the safeguard capacity of the NSR in mitigatingvarious disruptions that affect safe transit along the NSR;
- A methodology is established to conduct a resilience assessment of the NSR based on the integration of fuzzy theory, a BN, and information entropy theory;
- The proposed fuzzy BN-based model can effectively cope with the uncertainty and unavailability of information associated with Arctic waters;
- The conduction of different types of analyses, such as forward and backward propagation, sensitivity, and information entropy analyses, helps us obtain a complete understanding of NSR resilience.
1.3. Organization
2. Proposed Resilience Measurement Methodology
2.1. Fuzzy Theory
2.1.1. Fuzzy Number Selection to Design a Questionnaire
2.1.2. Weight Determination for the Expert Capacity
- ⮚
- With respect to fuzzy numbers in pairwise comparison matrices, the geometric mean technique is applied to obtain the synthetic pairwise comparison matrix, , as follows:where is the pairwise comparison matrix of the Kthindicator for the expert capability evaluation.
- ⮚
- The fuzzy weights of the criteria for each expert can be calculated by the following equation:where the fuzzy weight of the ithexpert is indicated by .
- ⮚
- The fuzzy weights for each criterion are defined as follows:where denotes the fuzzy weight of the ithcriterion, for which indicate the lower, middle, and upper values of the fuzzy weights of the ithcriterion, respectively.
- ⮚
- The weight of each expert is computed by employing the center of area technique, as follows:
2.1.3. Expert Viewpoint Aggregation
2.2. Bayesian Network Theory
2.2.1. Prior Probability Calculation for Nodes without Parents
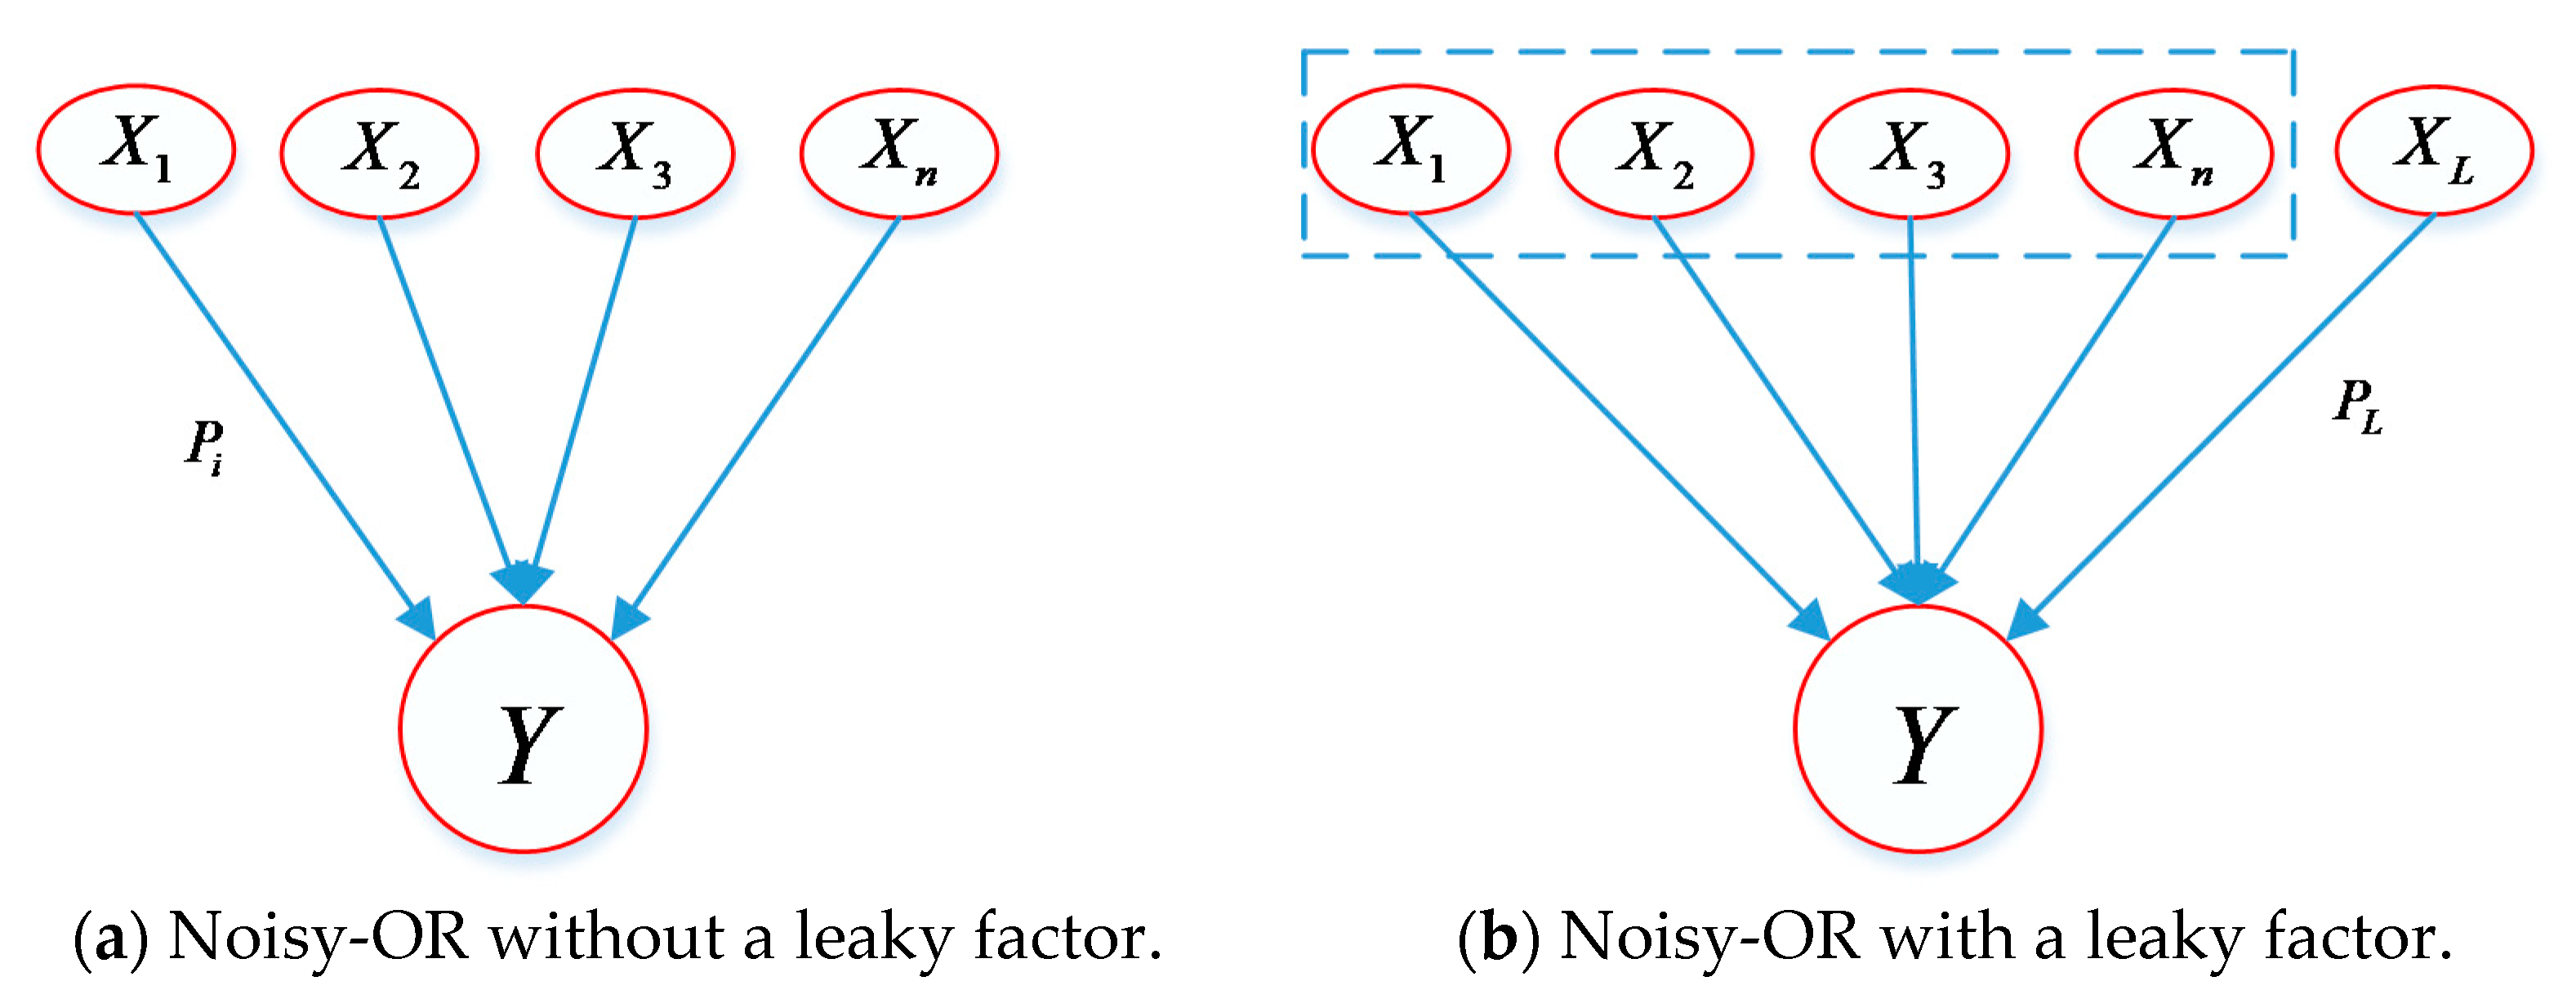
2.2.2. Conditional Probability Table Calculation with the Noisy-OR Function
- (1)
- All the nodes in the proposed Bayesian network can be regarded as Boolean variables; that is, the nodes have binary states, true or false, representing positive or negative outcomes, respectively;
- (2)
- The causes (parent nodes) of are mutually independent;
- (3)
- The probability that is true when only one causal factor, , is true while all other factors except are false can be expressed as:where represents the connection probability between the parent node, , and the corresponding child node, . The connection probability can be derived by:
2.3. Information Entropy Theory
3. Model Established for NSR Resilience Measurement
3.1. Scenario Development
3.2. Disruption Identification
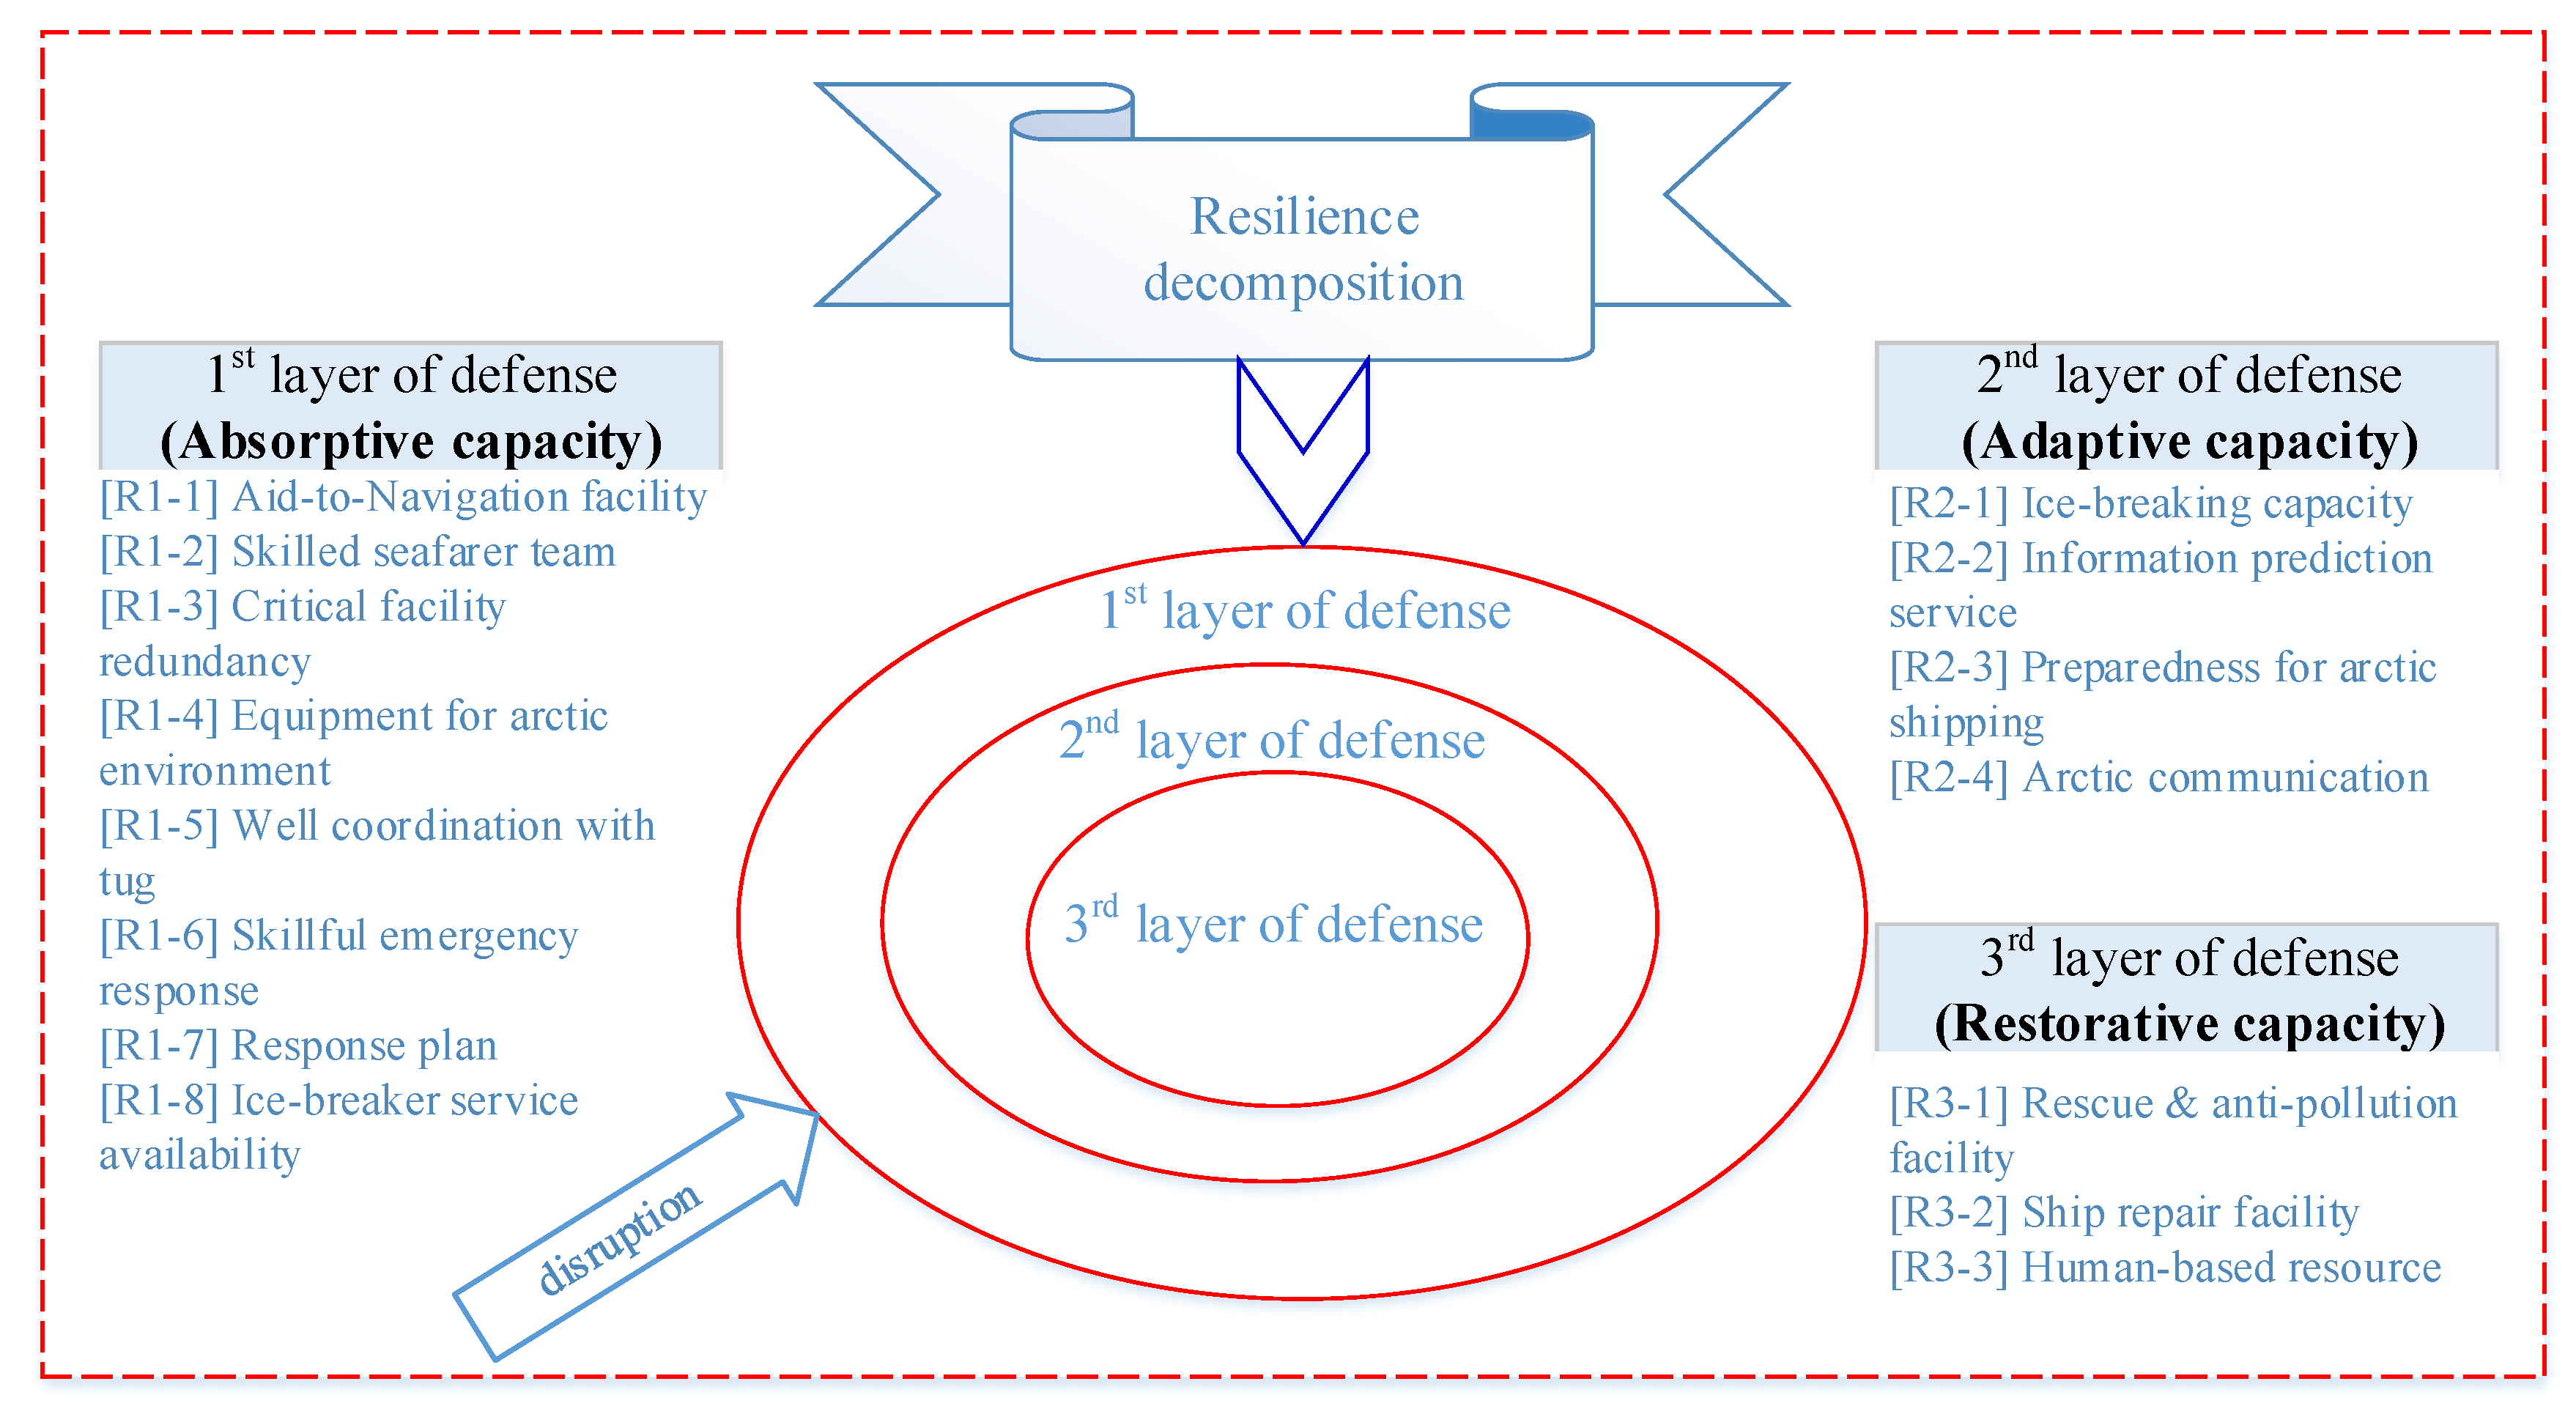
3.3. Resilience Capacity Decomposition for the Arctic Northeast Route
3.3.1. Absorptive Capacity
3.3.2. Adaptive Capacity
3.3.3. Restorative Capacity
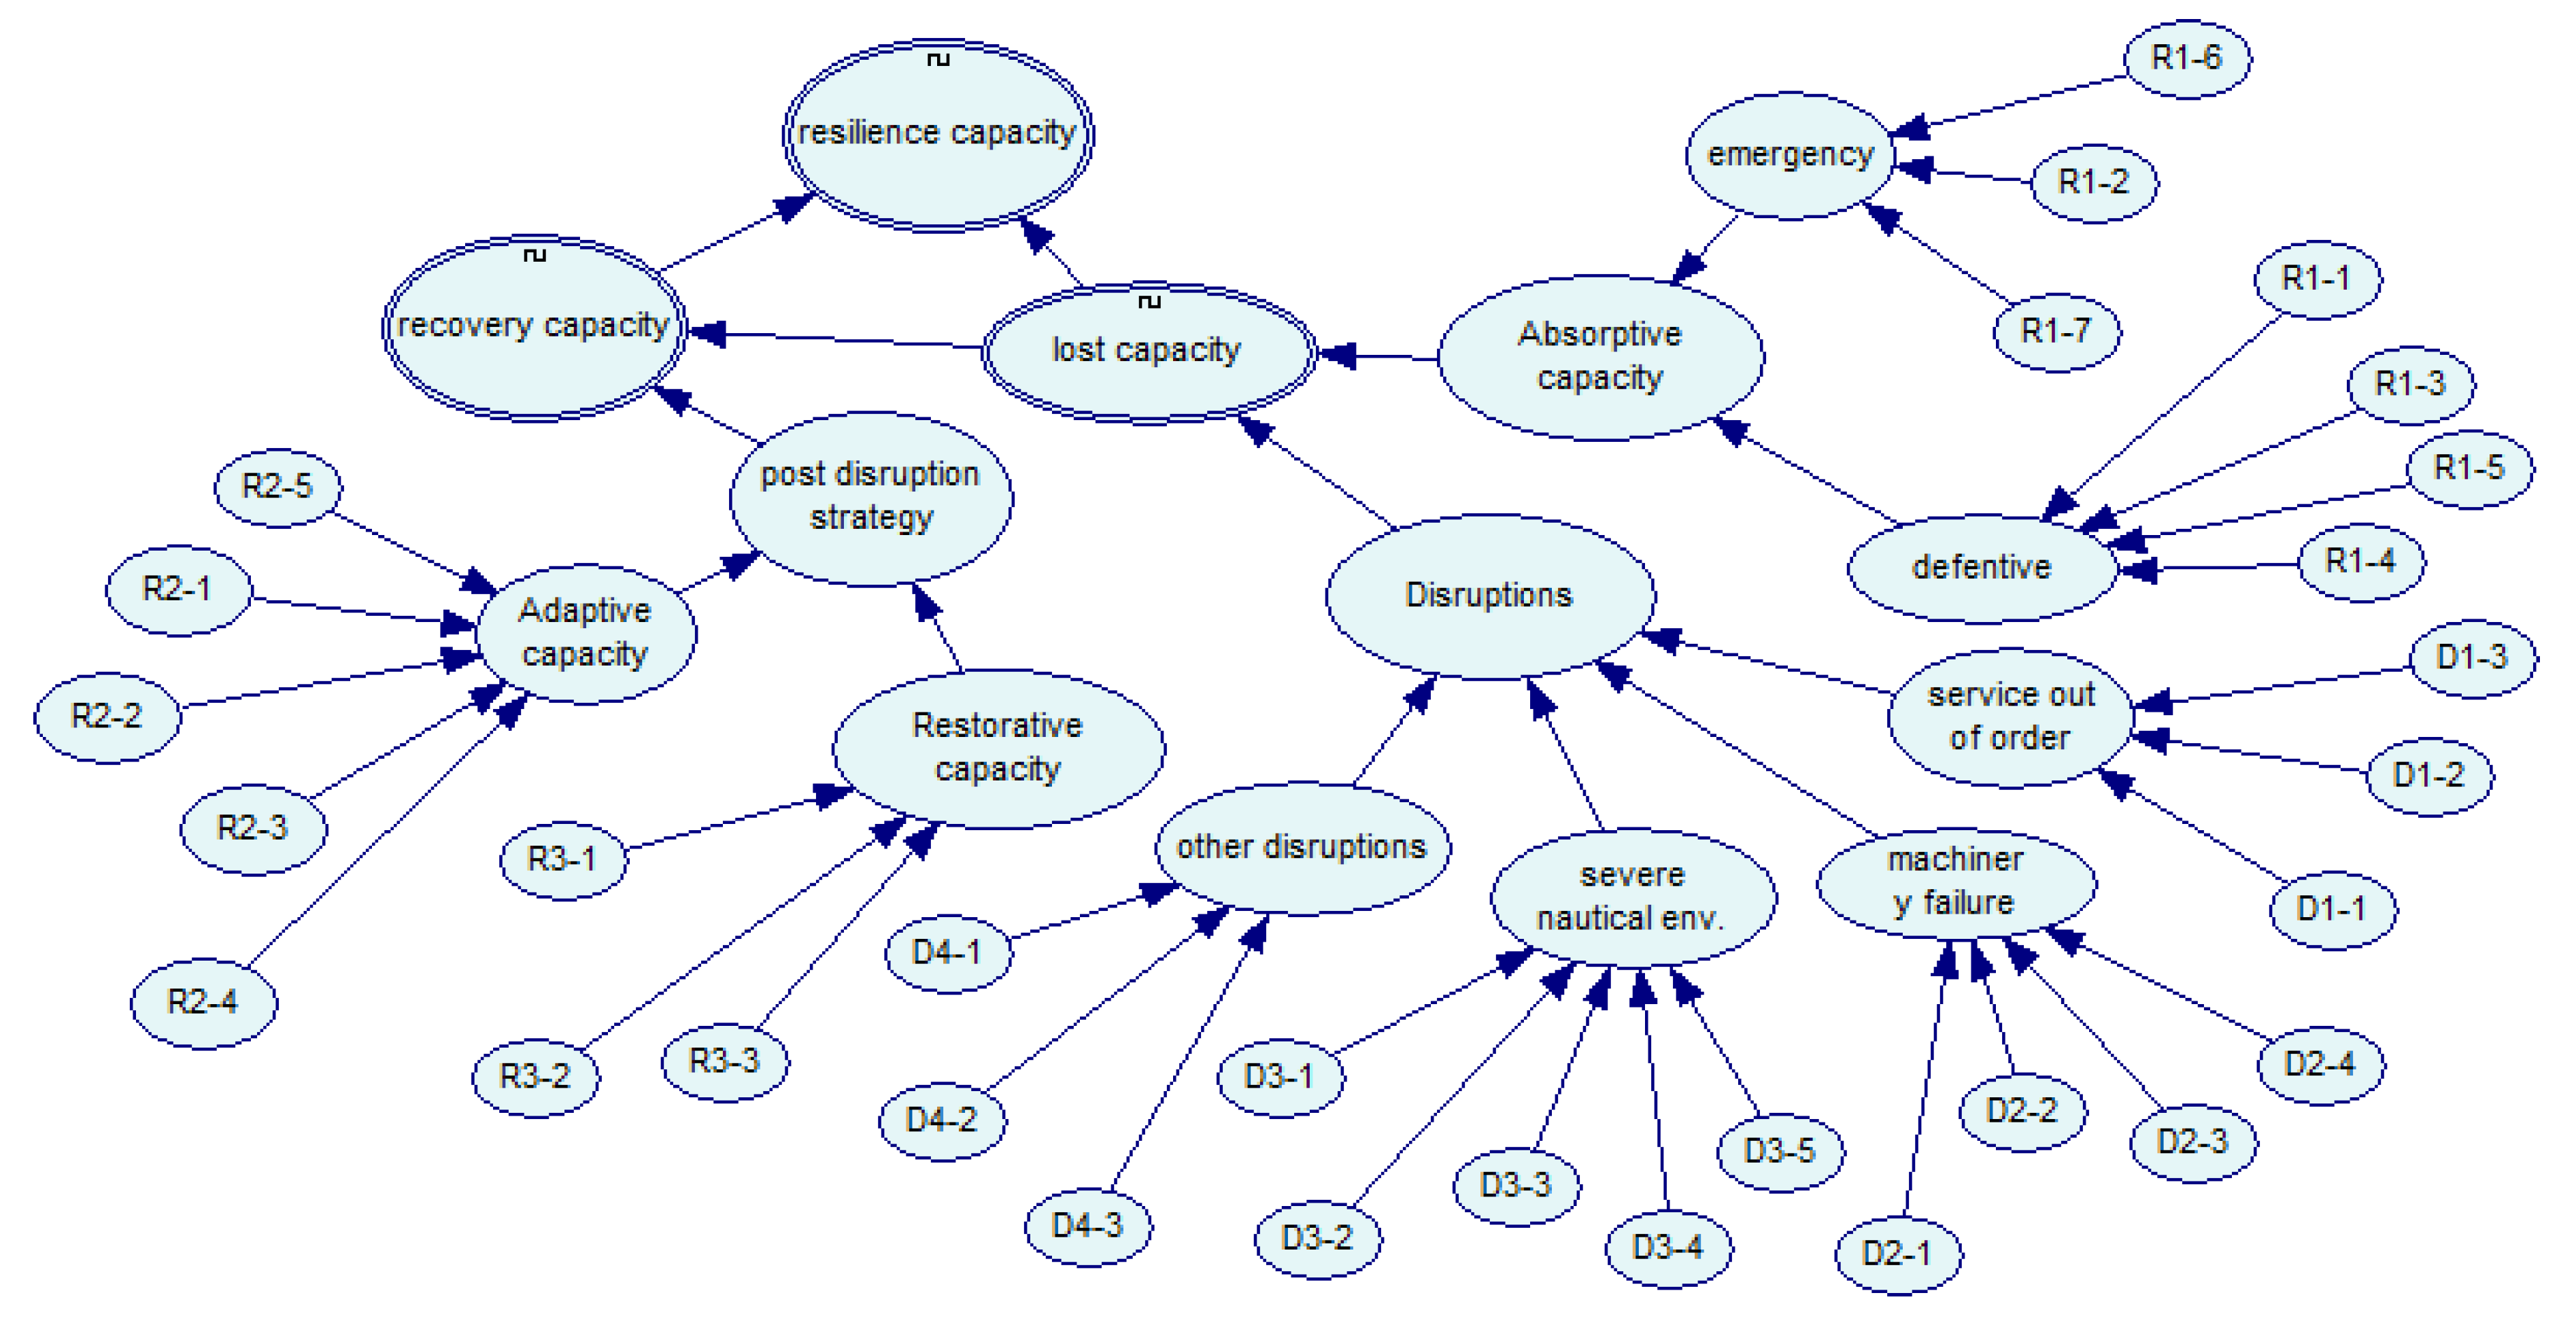
3.4. Resilience Measurement Using the Fuzzy Bayesian Network
3.4.1. Reliability Quantification for the Employed Experts
- A heterogeneous group of experts is usually preferred to a homogenous group. In a heterogeneous group, the individual experience of each expert receives considerable attention;
- With respect to the education and experience of the experts in a field, the longer they have focused on a subject (academic or practical subject), the more accurate their intuitionistic judgement is;
- With respect to expert familiarity with a subject, especially through practical experience, an experienced specialist can theoretically master every detail of the subject.
3.4.2. Calculation of the Prior Probabilities of the Nodes without Parent Nodes
3.4.3. Calculation of the Condition Probability Table for the Network
3.5. Resilience Quantification
4. Results and Discussion
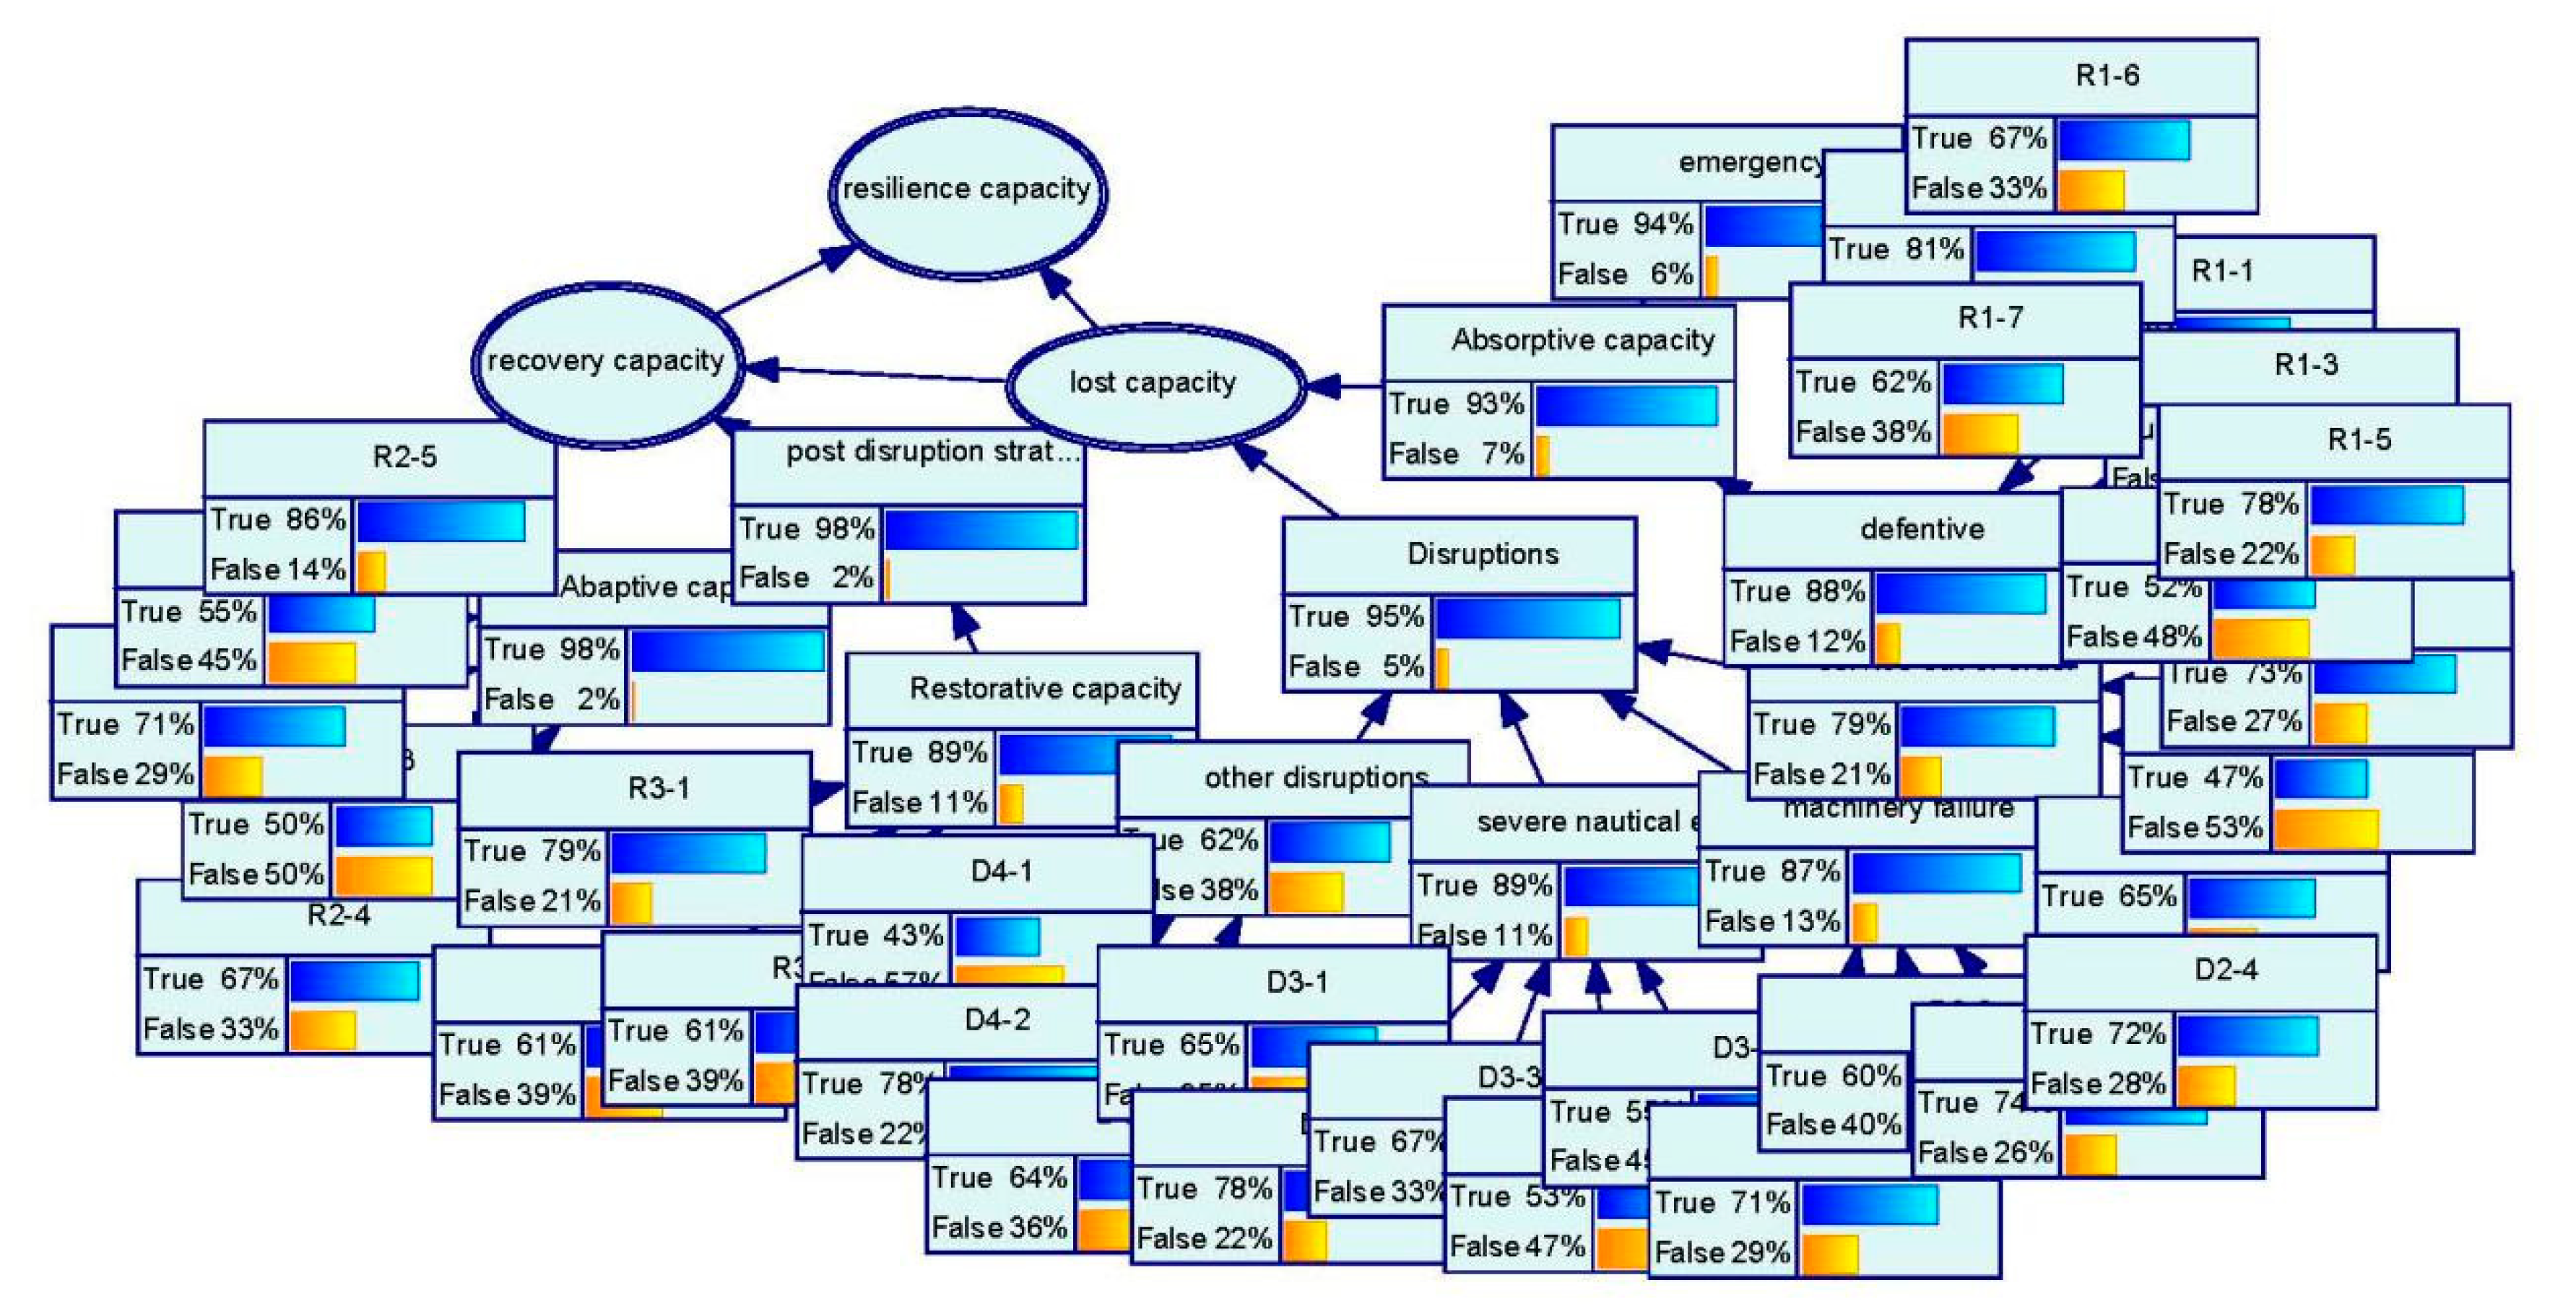
4.1. Belief Propagation Analysis
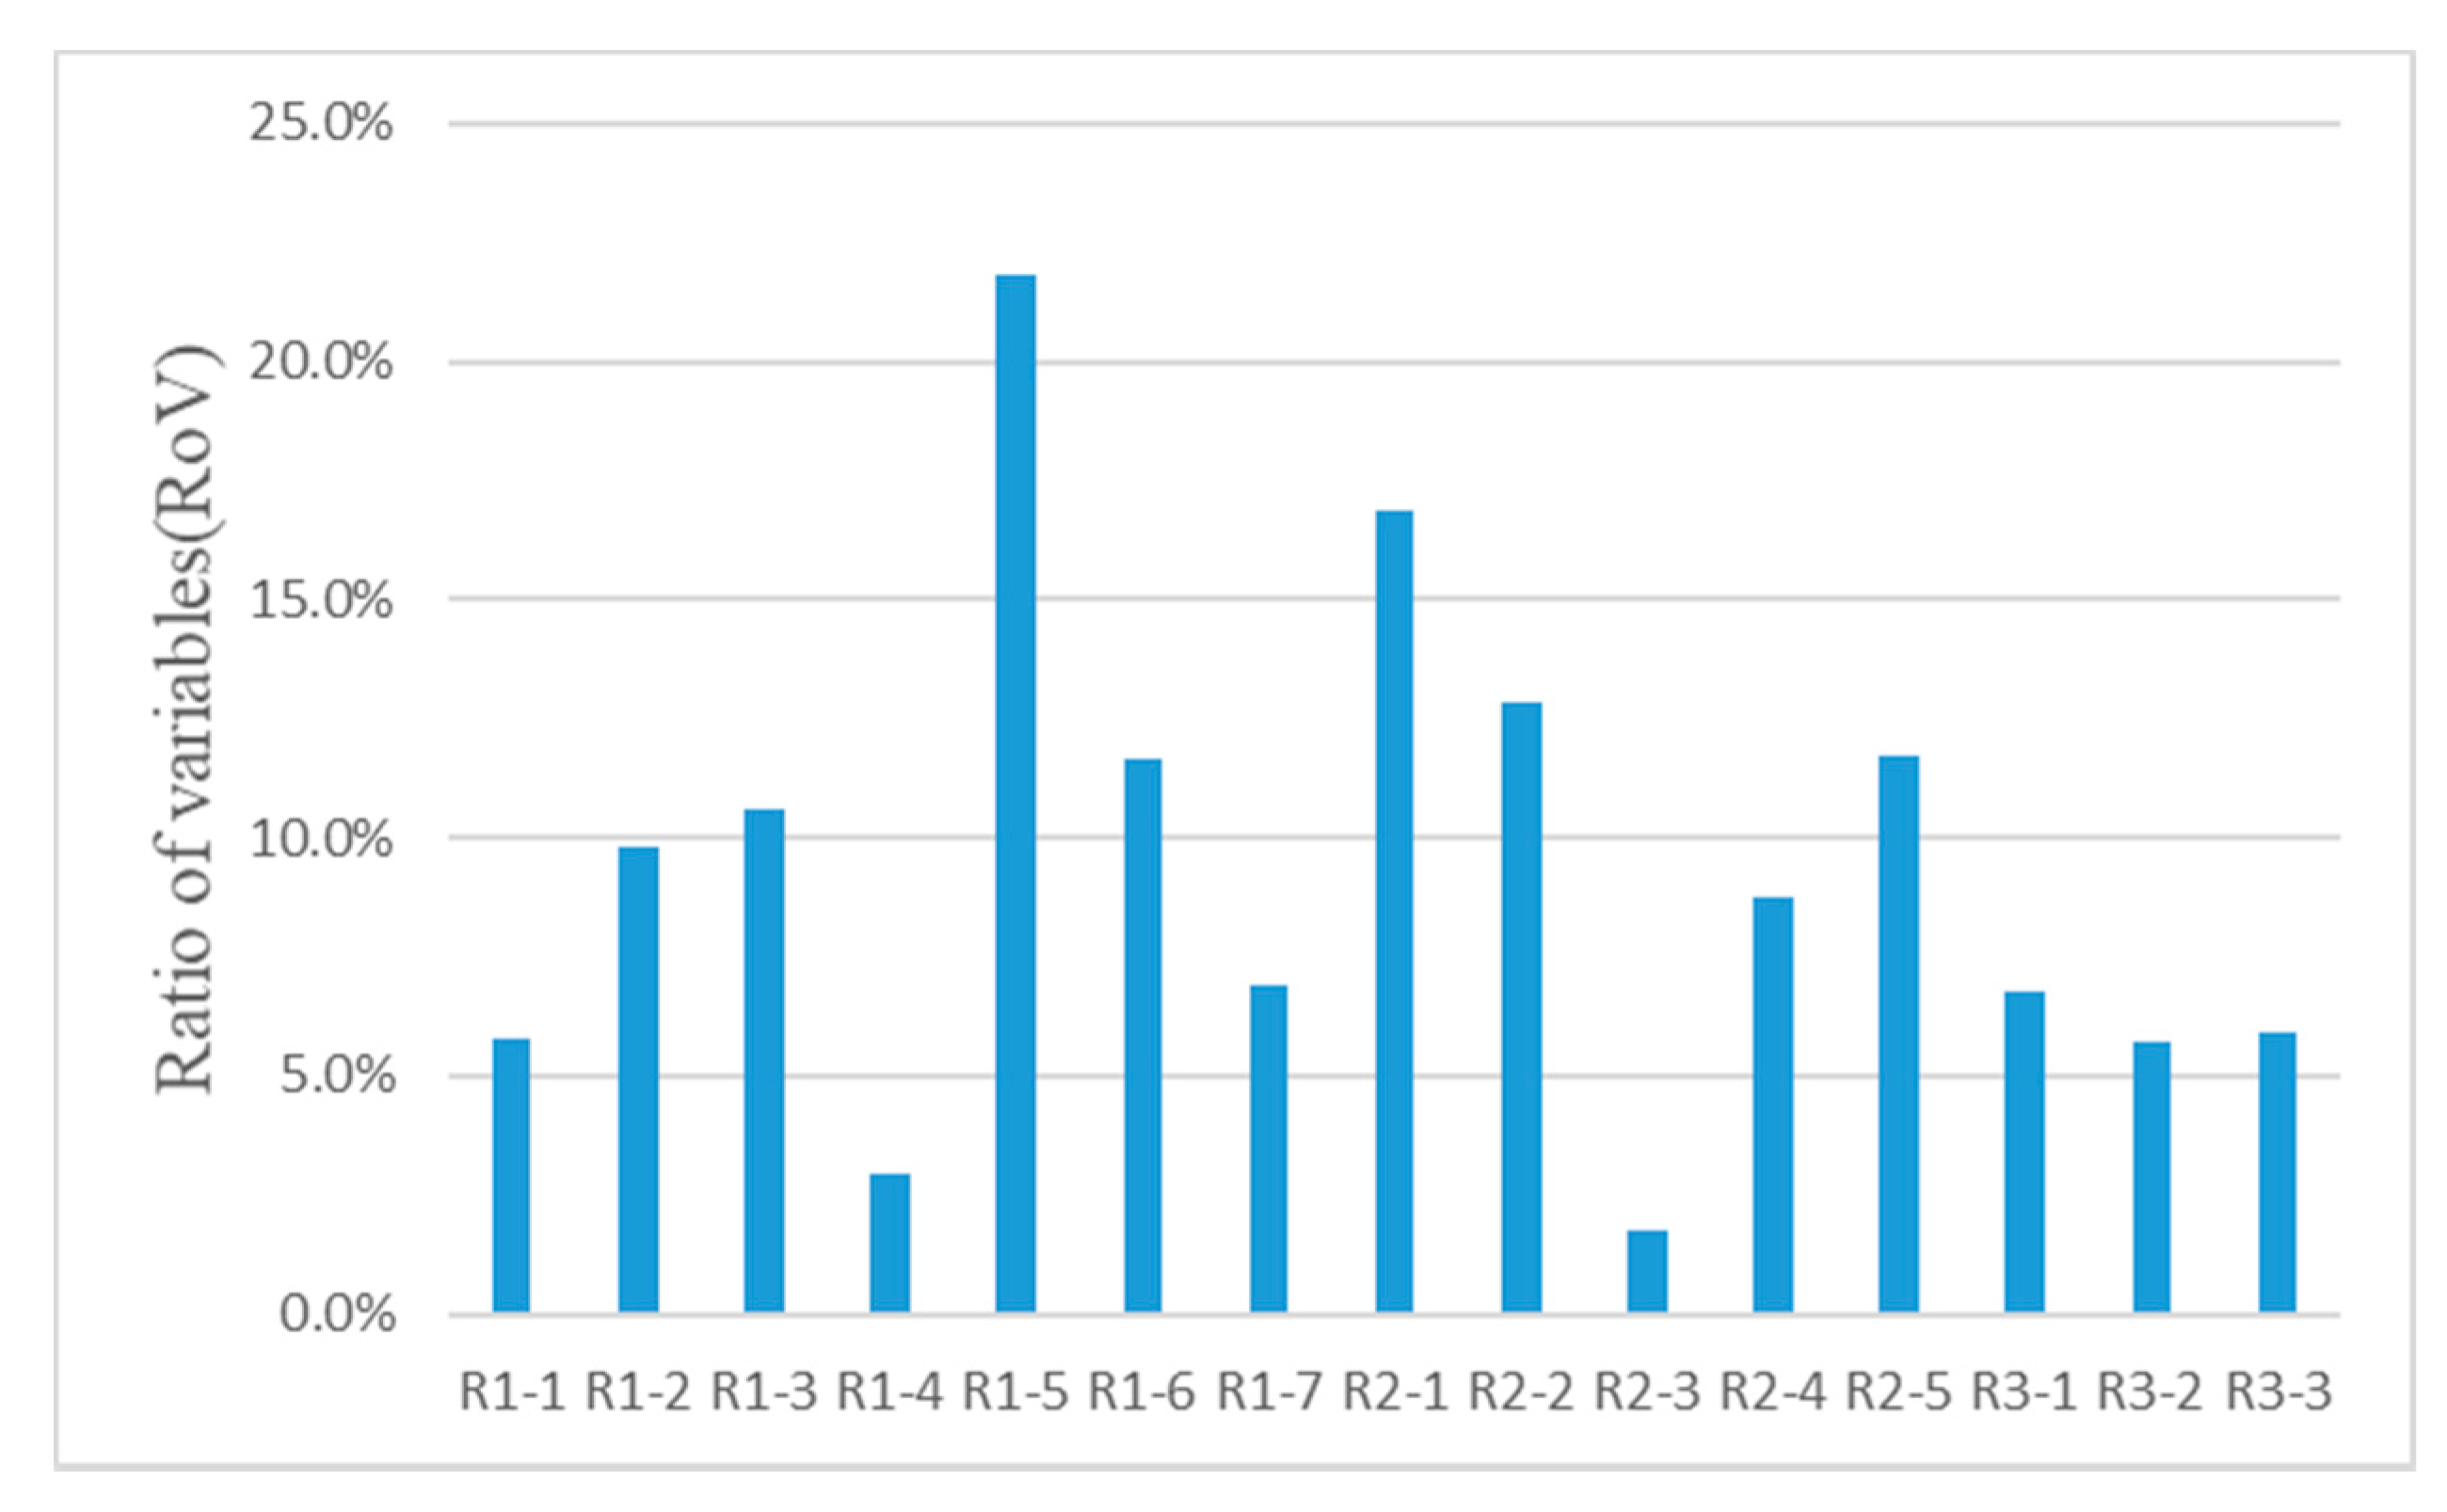
4.2. Sensitivity Analysis
4.3. Uncertainty Analysis Based on Information Entropy Theory
5. Conclusions
Author Contributions
Funding
Institutional Review Board Statement
Informed Consent Statement
Conflicts of Interest
References
- Gascard, J.-C.; Riemann-Campe, K.; Gerdes, R.; Schyberg, H.; Randriamampianina, R.; Karcher, M.; Zhang, J.; Rafizadeh, M. Future sea ice conditions and weather forecasts in the Arctic: Implications for Arctic shipping. Ambio 2017, 46, 355–367. [Google Scholar] [CrossRef]
- Wang, H.; Zhang, Y.; Meng, Q. How will the opening of the northeast Sea Route influence the Suez Canal Route? An empirical analysis with discrete choice models. Transp. Res. A Policy Pract. 2018, 107, 75–89. [Google Scholar] [CrossRef]
- Schøyen, H.; Bråthen, S. The Northern Sea Route versus the Suez Canal: Cases from bulk shipping. J. Transp. Geogr. 2011, 19, 977–983. [Google Scholar] [CrossRef]
- Sun, K.; Zhang, J.J. Corporate engagement in the age of Arctic development and its implications for Chinese Corporations. J. Ocean Univ. 2017, 2, 71–77. [Google Scholar]
- Jiang, X.; Fan, H.; Zhang, Y.; Yuan, Z. Using interpretive structural modeling and fuzzy analytic network process to identify and allocate risks in Arctic shipping strategic alliance. Polar Sci. 2018, 17, 83–93. [Google Scholar] [CrossRef]
- Shyu, W.-H.; Ding, J.-F. Key Factors Influencing the Building of Arctic Shipping Routes. J. Navig. 2016, 69, 1261–1277. [Google Scholar] [CrossRef]
- Senol, Y.E.; Aydogdu, Y.V.; Sahin, B.; Kilic, I. Fault Tree Analysis of chemical cargo contamination by using fuzzy approach. Expert Syst. Appl. 2015, 42, 5232–5244. [Google Scholar] [CrossRef]
- Zhang, M.; Zhang, D.; Goerlandt, F.; Yan, X.; Kujala, P. Use of HFACS and fault tree model for collision risk factors analysis of icebreaker assistance in ice-covered waters. Saf. Sci. 2019, 111, 128–143. [Google Scholar] [CrossRef]
- Goerlandt, F.; Goite, H.; Banda, O.A.V.; Höglund, A.; Ahonen-Rainio, P.; Lensu, M. An analysis of wintertime navigational accidents in the Northern Baltic Sea. Saf. Sci. 2017, 92, 66–84. [Google Scholar] [CrossRef]
- Kum, S.; Sahin, B. A root cause analysis for Arctic Marine accidents from 1993 to 2011. Saf. Sci. 2015, 74, 206–220. [Google Scholar] [CrossRef]
- Baksh, A.A.; Abbassi, R.; Garaniya, V.; Khan, F. Marine transportation risk assessment using Bayesian Network: Application to Arctic waters. Ocean Eng. 2018, 159, 422–436. [Google Scholar] [CrossRef]
- Jalonen, R.; Riska, K.; Hanninen, S. A Preliminary Risk Analysis of Winter Navigation in the Baltic Sea; Finnish Maritime Administration: Helsinki, Finland, 2005. [Google Scholar]
- Kujala, P.; Hänninen, M.; Arola, T.; Ylitalo, J. Analysis of the marine traffic safety in the Gulf of Finland. Reliab. Eng. Syst. Saf. 2009, 94, 1349–1357. [Google Scholar] [CrossRef]
- Holling, C.S. Resilience and Stability of Ecological Systems. Annu. Rev. Ecol. Syst. 1973, 4, 1–23. [Google Scholar] [CrossRef]
- Fiksel, J. Designing Resilient, Sustainable Systems. Environ. Sci. Technol. 2003, 37, 5330–5339. [Google Scholar] [CrossRef] [PubMed]
- Hollnagel, E.; Woods, D.D.; Leveson, N. Resilience Engineering: Concepts and Precepts; Ashgate Publishing Limited: Farnham, UK, 2006. [Google Scholar]
- Vogus, T.J.; Sutcliffe, K.M. Organizational resilience: Towards a theory and research agenda. In Proceedings of the 2007 IEEE International Conference on Systems, Man and Cybernetics, Montreal, QC, Canada, 7–10 October 2007; pp. 3418–3422. [Google Scholar]
- Gilberto, C.G. Linkages between vulnerability, resilience, and adaptive capacity. Glob. Environ. Chang. 2006, 16, 293–303. [Google Scholar]
- Smale, S. Assessing Resilience and Vulnerability: Principle, Strategies and Actions. Ann. Bot. 2008, 101, 403–419. [Google Scholar]
- Engel, K.E.; Warner, J.F. Resilience in Talcahuano, Chile: Appraising local disaster response. Disaster Prev. Manag. Int. J. 2019, 28, 585–602. [Google Scholar] [CrossRef]
- Di Nardo, M.; Mariano, C.; Teresa, M.; Madonna, M. An adaptive resilience approach for a high capacity railway. Int. Rev. Civ. Eng. 2020, 11, 98–105. [Google Scholar] [CrossRef]
- Attoh-Okine, N.O.; Cooper, A.T.; Mensah, S.A. Formulation of Resilience Index of Urban Infrastructure Using Belief Functions. IEEE Syst. J. 2009, 3, 147–153. [Google Scholar] [CrossRef]
- Hossain, N.U.I.; Jaradat, R.; Hosseini, S.; Marufuzzaman, M.; Buchanan, R. A framework for modeling and assessing system resilience using a Bayesian network: A case study of an interdependent electrical infrastructure system. Int. J. Crit. Infrastruct. Prot. 2019, 25, 62–83. [Google Scholar] [CrossRef]
- Hossain, N.U.I.; Amrani, S.E.; Jaradat, R.; Marufuzzaman, M.; Buchanan, R.; Rinaudo, C.; Hamilton, M. Modeling and assessing interdependencies between critical infrastructures using bayesian network: A case study of inland waterway port and surrounding supply chain network. Reliab. Eng. Syst. Saf. 2020, 198, 106898. [Google Scholar] [CrossRef]
- Hossain, N.U.I.; Nur, F.; Hosseini, S.; Jaradat, R.; Marufuzzaman, M.; Puryear, S.M. A Bayesian network based approach for modeling and assessing resilience: A case study of a full service deep water port. Reliab. Eng. Syst. Saf. 2019, 189, 378–396. [Google Scholar] [CrossRef]
- Adger, W.N. Social ecological resilience: Are they related? Prog. Hum. Geogr. 2019, 24, 347–364. [Google Scholar] [CrossRef]
- Vugrin, E.D.; Warren, D.E.; Ehlen, M.A. A resilience assessment framework for infrastructure and economic systems: Quantitative and qualitative resilience analysis of petrochemical supply chain to a hurricane. Process Saf. Progr. 2011, 30, 280–290. [Google Scholar] [CrossRef]
- Henry, D.; Ramirez-Marquez, J.E. Generic metrics and quantitative approaches for system resilience as a function of time. Reliab. Eng. Syst. Saf. 2012, 99, 114–122. [Google Scholar] [CrossRef]
- Kelly, D.L.; Smith, C.L. Bayesian inference in probabilistic risk assessment? The current state of the art. Reliab. Eng. Syst. Saf. 2009, 94, 628–643. [Google Scholar] [CrossRef]
- Fenton, N.; Neil, M. Risk Assessment and Decision Analysis with Bayesian Networks; CRC Press: Boca Raton, FL, USA, 2012. [Google Scholar]
- Rathnayaka, S.; Khan, F.; Amyotte, P. SHIPP methodology: Predictive accident modeling approach. Part II. Validation with case study. Process. Saf. Environ. Prot. 2011, 89, 75–88. [Google Scholar] [CrossRef]
- Khakzad, N.; Khan, F.; Amyotte, P. Safety analysis in process facilities: Comparison of fault tree and Bayesian network approaches. Reliab. Eng. Syst. Saf. 2011, 96, 925–932. [Google Scholar] [CrossRef]
- Khakzad, N.; Khan, F.; Amyotte, P. Dynamic risk analysis using bow-tie approach. Reliab. Eng. Syst. Saf. 2012, 104, 36–44. [Google Scholar] [CrossRef]
- Qiao, W.L.; Liu, Y.; Ma, X.X.; Liu, Y. Human Factors Analysis for Maritime Accidents Based on a Dynamic Fuzzy Bayesian Network. Risk Anal. 2020, 1, 13444. [Google Scholar] [CrossRef]
- Hosseini, S.; Barker, K. A Bayesian network model for resilience-based supplier selection. Int. J. Prod. Econ. 2016, 180, 68–87. [Google Scholar] [CrossRef]
- Amundson, J.; Faulkner, W.; Sukumara, S.; Seay, J.; Badurdeen, F. A Bayesian Network Based Approach for Risk Modeling to Aid in Development of Sustainable Biomass Supply Chains. Comput. Aided Chem. Eng. 2012, 30, 152–156. [Google Scholar] [CrossRef]
- Han, S.Y.; Marais, K.; de Laurentis, D. Evaluating System of Systems resilience using interdependency analysis. In Proceedings of the 2012 IEEE International Conference on Systems, Man, and Cybernetics (SMC), Seoul, Korea, 14–17 October 2012; pp. 1251–1256. [Google Scholar]
- Hosseini, S.; Barker, K. Modeling infrastructure resilience using Bayesian networks: A case study of inland waterway ports. Comput. Ind. Eng. 2016, 93, 252–266. [Google Scholar] [CrossRef]
- Van Laarhoven, P.; Pedrycz, W. A fuzzy extension of Saaty’s priority theory. Fuzzy Sets Syst. 1983, 11, 229–241. [Google Scholar] [CrossRef]
- Chang, D.-Y. Applications of the extent analysis method on fuzzy AHP. Eur. J. Oper. Res. 1996, 95, 649–655. [Google Scholar] [CrossRef]
- Miller, G.A. The magical number seven, plus or minus two: Some limits on our capacity for processing information. Psychol. Rev. 1956, 101, 343–352. [Google Scholar] [CrossRef] [PubMed]
- Nicolis, J.S.; Tsuda, I. Chaotic dynamics of information processing: The “magic number seven plus-minus two” revisited. Bull. Math. Biol. 1985, 47, 343–365. [Google Scholar]
- Chen, S.J.; Hwang, C.L. Fuzzy Multiple Attribute Decision Making: Methods and Applications, Lecture Notes in Economics and Mathematical Systems, No. 375; Springer: Berlin/Heidelberg, Germany, 1992. [Google Scholar]
- Ramzali, N.; Lavasani, M.R.M.; Ghodousi, J. Safety barriers analysis of offshore drilling system by employing Fuzzy Event Tree Analysis. Saf. Sci. 2015, 78, 49–59. [Google Scholar] [CrossRef]
- Gupta, S.; Bhattacharya, J. Reliability Analysis of a conveyor system using hybrid data. Qual. Reliab. Eng. Int. 2007, 23, 867–882. [Google Scholar] [CrossRef]
- Omidvari, M.; Lavasani, S.; Mirza, S. Presenting of failure probability assessment pattern by FTA in Fuzzy logic (case study: Distillation tower unit of oil refinery process). J. Chem. Health Saf. 2014, 21, 14–22. [Google Scholar] [CrossRef]
- Kabir, S.; Yazdi, M.; Aizpurua, J.I.; Papadopoulos, Y. Uncertainty-Aware Dynamic Reliability Analysis Framework for Complex Systems. IEEE Access 2018, 6, 29499–29515. [Google Scholar] [CrossRef]
- Qiao, W.L.; Liu, Y.; Ma, X.X.; Liu, Y. A methodology to evaluate human factors contributed to maritime accident by mapping fuzzy FT into ANN based on HFACS. Ocean Eng. 2020, 197, 106892. [Google Scholar] [CrossRef]
- Buckley, J.J. Fuzzy hierarchical analysis. Fuzzy Sets Syst. 1985, 17, 233–247. [Google Scholar] [CrossRef]
- Jensen, F.V.; Nielsen, T.D. Bayesian Networks and Decision Graphs; Springer Science and Business Media LLC: Berlin/Heidelberg, Germany, 2007. [Google Scholar]
- Kabir, S.; Papadopoulos, Y. Applications of Bayesian networks and Petri nets in safety, reliability, and risk assessments: A review. Saf. Sci. 2019, 115, 154–175. [Google Scholar] [CrossRef]
- Jensen, F.V.; Nielsen, T.D. Bayesian Networks and Decision Graphs, 2nd ed.; Springer Science and Business Media LLC: New York, NY, USA, 2009. [Google Scholar]
- Wang, Y.F.; Xie, M.; Chin, K.S.; Fu, X.J. Accident analysis model based on Bayesian Network and Evidential Reasoning approach. J. Loss Prev. Process Ind. 2013, 26, 10–21. [Google Scholar] [CrossRef]
- Zarei, E.; Khakzad, N.; Cozzani, V.; Reniers, G. Safety analysis of process systems using Fuzzy Bayesian Network (FBN). J. Loss Prev. Process. Ind. 2019, 57, 7–16. [Google Scholar] [CrossRef]
- Agnieszka, O. Learning Bayesian Network Parameters from Small Data Sets Application of Noisy-OR Gates. Int. J. Approx. Reason. 2001, 27, 165–182. [Google Scholar]
- Ellis, B.; Brigham, L. 2009: Arctic Marine Shipping Assessment 2009 Report. Arctic Council Rep., 189p. Available online: https://oaarchive.arctic-council.org/handle/11374/54 (accessed on 5 November 2020).
- Zakharov, V.F. Sea Ice in the Climate System: A Russian View; NSIDC Special Report 16; NSIDC: Boulder, CO, USA, 1997; Available online: https://nsidc.org/pubs/special/16/NSIDC-specialreport-16.pdf (accessed on 11 November 2020).
- Royal Institution of Naval Architects. Safety Guidance for Naval Architects. Second Editions. 2010. Available online: http://www.rina.org.uk/hres/safety%20guidance%20for%20naval%20architects%20_%20second%20edition%20_%20march%202010%20_%20final%20inc%20tb%20edits.pdf (accessed on 10 January 2021).
- Lloyd’s Register. Written Evidence (ARC0048). Lloyd’s Register. 2015. Available online: https://www.parliament.uk/globalassets/documents/lords-committees/arctic/Lloyds-Register-ARC0048.pdf (accessed on 11 November 2020).
- Afenyo, M.; Khan, F.; Veitch, B.; Yang, M. Arctic shipping accident scenario analysis using Bayesian Network approach. Ocean Eng. 2017, 133, 224–230. [Google Scholar] [CrossRef]
- Fu, S.; Zhang, D.; Montewka, J.; Zio, E.; Yan, X. A quantitative approach for risk assessment of a ship stuck in ice in Arctic waters. Saf. Sci. 2018, 107, 145–154. [Google Scholar] [CrossRef]
- Sahin, B.; Kum, S. Risk Assessment of Arctic Navigation by Using Improved fuzzy-AHP Approach. Int. J. Marit. Eng. 2015, 157, 241. [Google Scholar]
- Halliday, W.D.; Tetu, P.L.; Dawson, J.; Insley, S.J.; Hilliard, R.C. Tourist vessel traffic in important whale areas in the western Canadian Arctic: Risks and possible management solutions. Mar. Policy 2018, 97, 72–81. [Google Scholar] [CrossRef]
- Olsen, D.J.; Pitman, N.D.; Basak, S.; Wunsche, B.C. Sketch-Based Building Modelling. Graphics Group Technical Report #2011-002, Department of Computer Science, University of Auckland. 2011. Available online: http://www.cs.auckland.ac.nz/burkhard/Reports/GraphicsGroupTechnicalReport2011_002.pdf (accessed on 5 November 2020).
- Stoddard, M.A.; Etienne, L.; Fournier, M.; Pelot, R.; Beveridgle, L. Making sense of Arctic maritime traffic using. The Polar Operational Limits Assessment Risk Indexing System (POLARIS). IOP Conf. Ser. Earth Environ. Sci. 2016, 34, 012034. [Google Scholar] [CrossRef]
- Zhang, M.; Zhang, D.; Fu, S.; Yan, X.; Goncharov, V. Safety distance modeling for ship escort operations in Arctic ice-covered waters. Ocean Eng. 2017, 146, 202–216. [Google Scholar] [CrossRef]
- Khan, B.; Khan, F.; Veitch, B.; Yang, M. An operational risk analysis tool to analyze marine transportation in Arctic waters. Reliab. Eng. Syst. Saf. 2018, 169, 485–502. [Google Scholar] [CrossRef]
- Milaković, A.-S.; Gunnarsson, B.; Balmasov, S.; Hong, S.; Kim, K.; Schütz, P.; Ehlers, S. Current status and future operational models for transit shipping along the Northern Sea Route. Mar. Policy 2018, 94, 53–60. [Google Scholar] [CrossRef]
- Rose, A. Economic Resilience to Disasters, Community and Regional Resilience Initiative Research Report 8. 2009. Available online: http://www.resilientus.org/library/Research_Report_8_Rose_1258138606.pdf (accessed on 20 November 2020).
- Maritime Safety Administration of China. Guidance on Arctic Navigation in the Northeast Route; China Comm Press: Beijing, China, 2014. (In Chinese) [Google Scholar]
- Biringer, B.; Vugrin, E.; Warren, D. Critical Infrastructure System Security and Resiliency; CRC Press: Boca Raton, FL, USA, 2016. [Google Scholar]
- Yazdi, M.; Daneshvar, S.; Setareh, H. An extension to fuzzy developed failure mode and effects analysis application. Saf. Sci. 2017, 98, 113–123. [Google Scholar] [CrossRef]
- Celik, M.; Lavasani, S.M.; Wang, J. A risk-based modelling approach to enhance shipping accident investigation. Saf. Sci. 2010, 48, 18–27. [Google Scholar] [CrossRef]
- Miri-Lavasani, M.R.; Wang, J.; Yang, Z.; Finlay, J. Application of fuzzy fault tree analysis on oil and gas offshore pipelines. Int. J. Mar. Sci. Eng. 2011, 1, 29–42. [Google Scholar]
- Lavasani, S.M.; Zendegani, A.; Celik, M. An extension to Fuzzy Fault Tree Analysis (FFTA) application in petro-chemical process industry. Process Saf. Environ. Protect. 2015, 93, 75–88. [Google Scholar] [CrossRef]
- Fenton, N.; Neil, M.; Lagnado, D.A. A general structure for legal arguments about evidence using Bayesian networks. Cogn. Sci. 2013, 37, 61–102. [Google Scholar] [CrossRef]
- Salteli, A.; Chan, K.; Scott, E.M. Sensitivity Analysis; John Wiley and Sons: New York, NY, USA, 2000. [Google Scholar]


| Linguistic Expressions | Fuzzy Trapezoidal Numbers |
|---|---|
| Very Low (VL) | (0,0,0.1,0.2) |
| Low (L) | (0.1,0.25,0.25,0.4) |
| Medium (M) | (0.3,0.5,0.5,0.7) |
| High (H) | (0.6,0.75,0.75,0.9) |
| Very High (VH) | (0.8,0.9,1,1) |
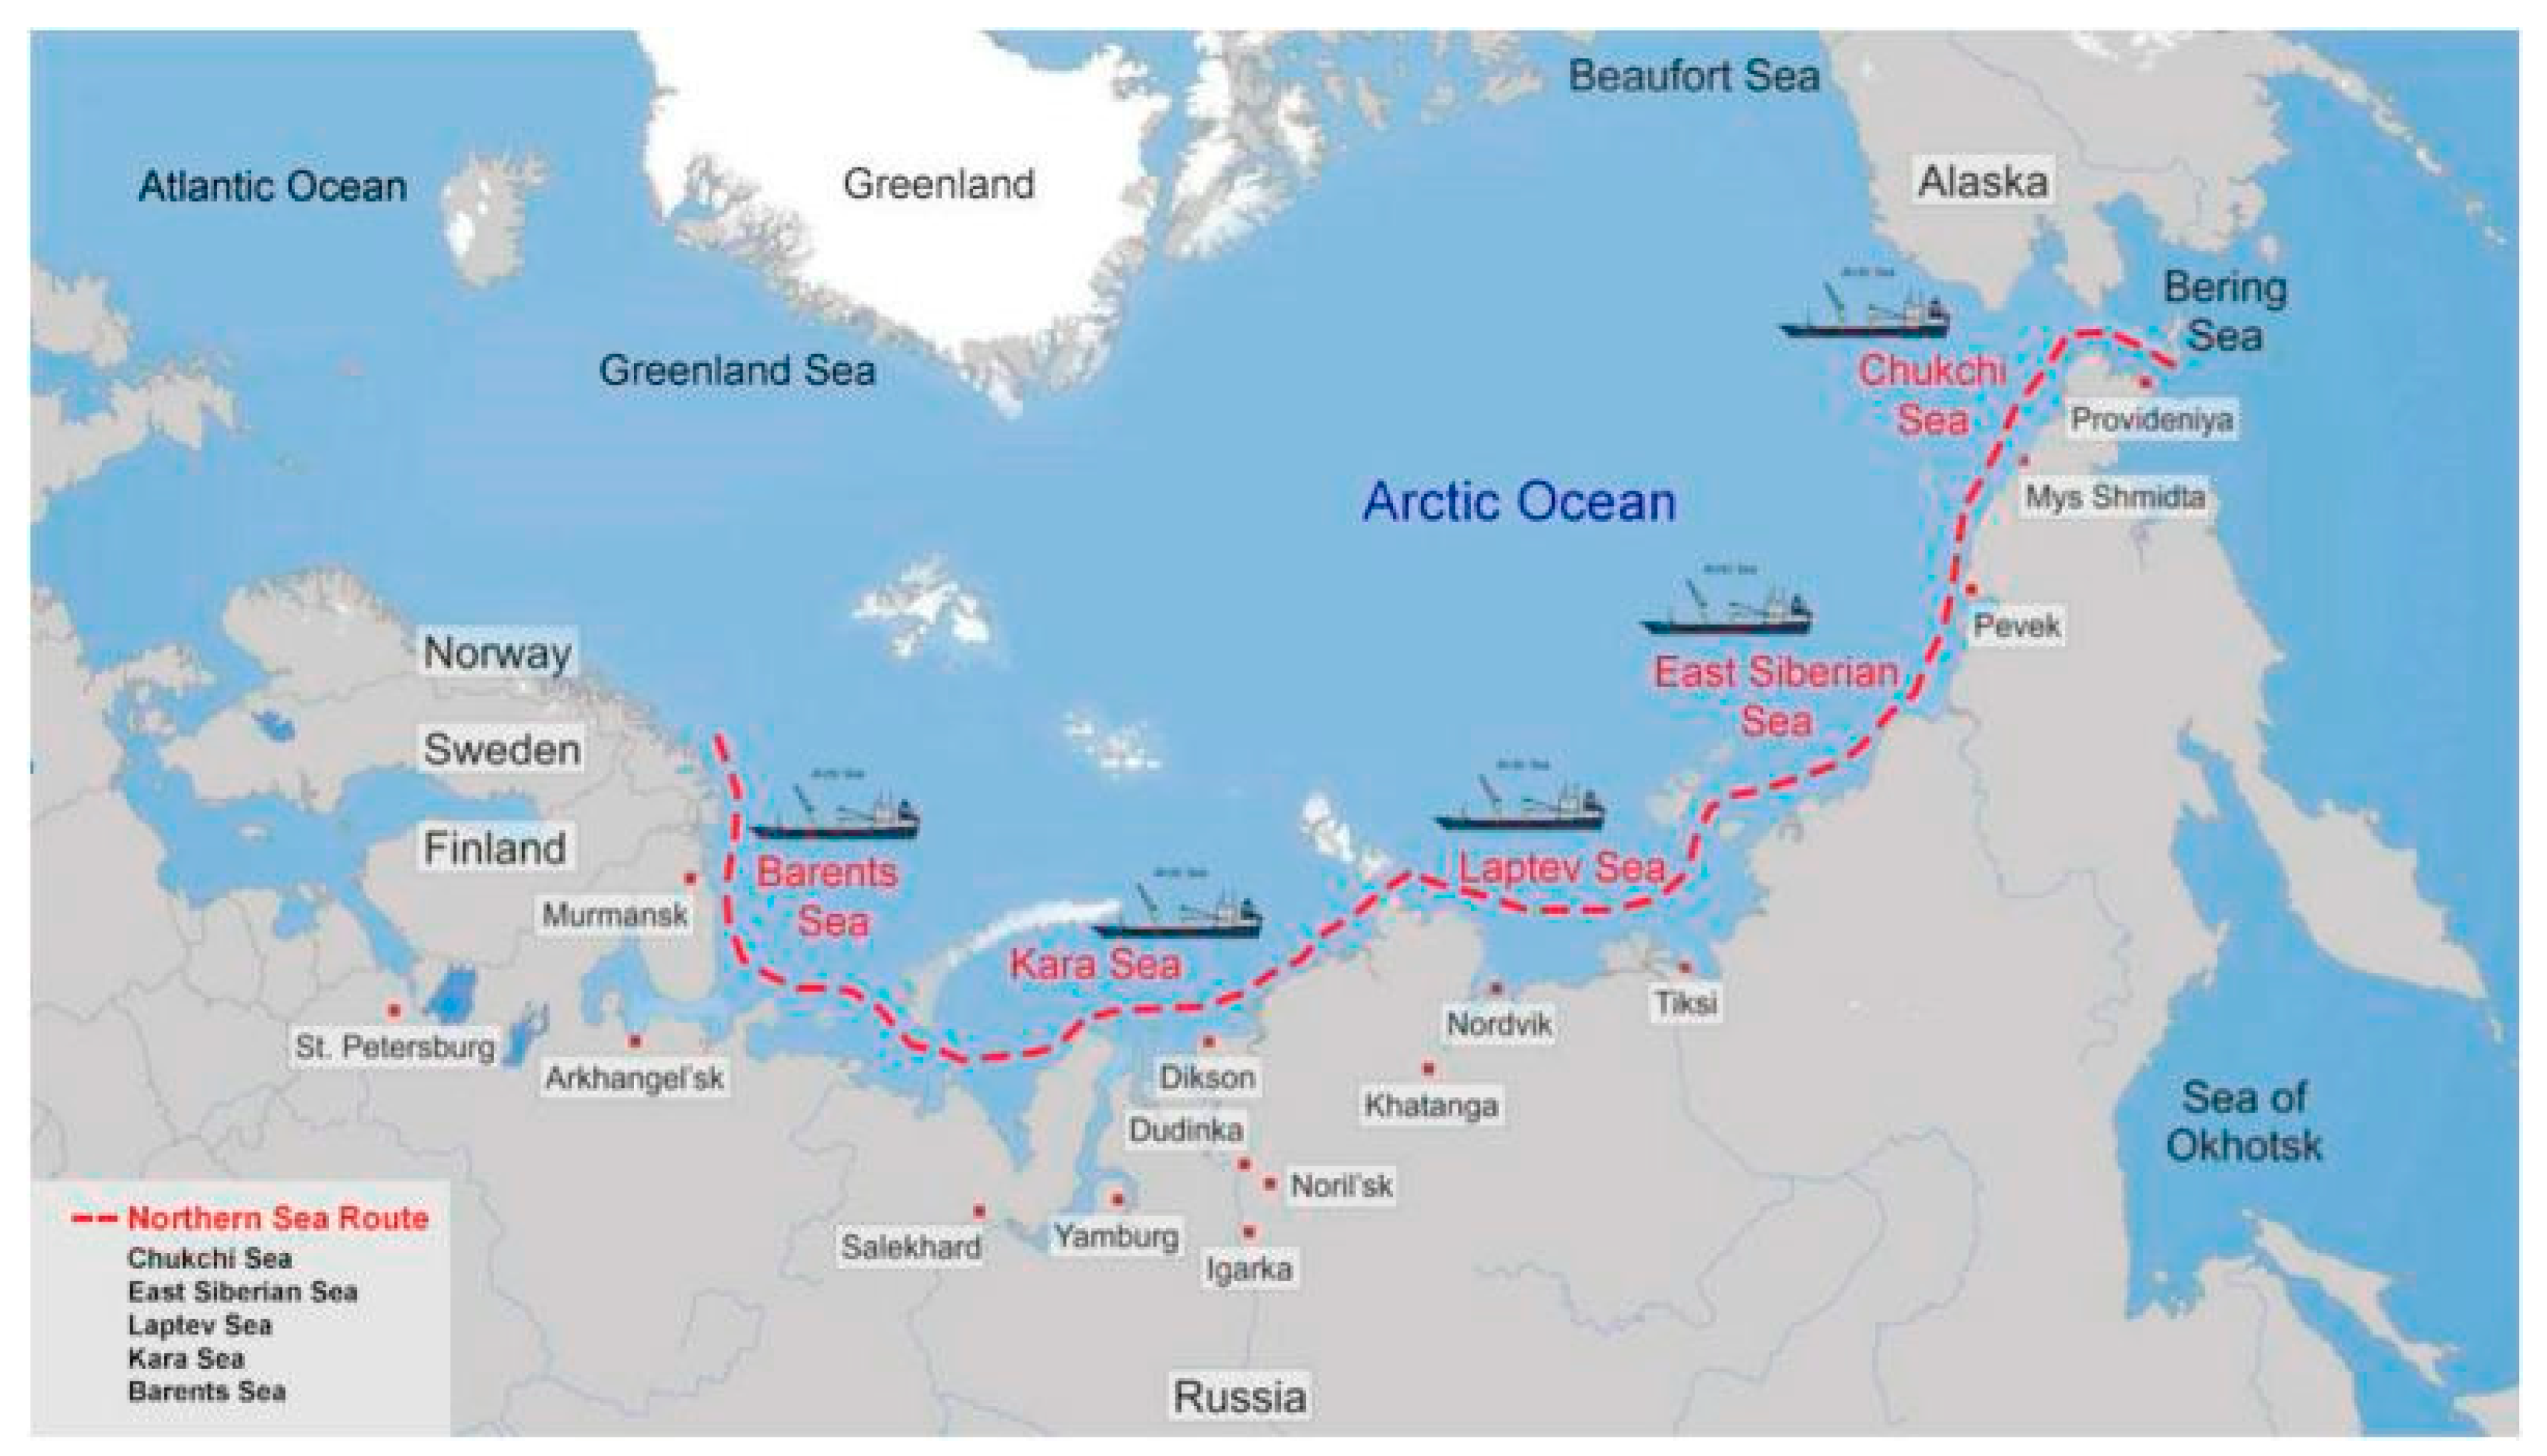
| Sea | March (Million km2) | September (Million km2) | Seasonal Changes |
|---|---|---|---|
| Barents Sea | 0.855 | 0.128 | 85% |
| Kara Sea | 0.830 | 0.266 | 68% |
| Laptev Sea | 0.536 | 0.196 | 63% |
| East Silerian Sea | 0.770 | 0.516 | 33% |
| Chukchi Sea | 0.595 | 0.196 | 67% |
| No. | Disruption | Description |
|---|---|---|
| 1 | Weather forecast inaccuracy | The weather along the Arctic Northeast Route is complex and variable, making it difficult to predict; as a result, the NSR security system suffers from information uncertainty associated with weather forecasts [60] |
| 2 | Sea chart incomplete | The navigation chart for the NSR is still incomplete due to complex factors such as the geological conditions, lack of hydrographic ship information, and political intervention [61] |
| 3 | Communication/positioning unavailable | According to the database for maritime accidents (DAMA of Det Norske Veritas), missing safety instructions and defective communication can impact the safety level of navigation in Arctic waters [62] |
| 4 | Malfunction of power plant | Based on the comments from experts of the Canadian Transport Agency, the malfunction of power plants, such as engine failure and power and back-up power failures, are the primary causes of ship collisions, foundering, and grounding along the NSR [11] |
| 5 | Damaged propeller/steering gear | The propeller and steering gears of ships that use the NSR can be severely damaged by icebergs, which cause considerable disruptions to the NSR safety [60] |
| 6 | Malfunction of deck machinery | In the case of extremely low temperatures, some deck machinery may malfunction, thus impacting normal ship operation along the NSR [61] |
| 7 | Restricted function of nav. instruments | The navigation instruments on ships may not work properly due to the influence of high latitudes, which can put the ship at risk [63] |
| 8 | Low temperature | Low temperatures can easily affect the performance of security-related equipment such as the hull, windlass, and mooring winch [64] |
| 9 | Iceberg/floating ice | The existence of sea ice, such as icebergs, floating ice, and old ice, is the main feature that distinguishes the NSR from other sea lanes globally; the impact of ice on the safety of ships is continuous and inevitable [65] |
| 10 | Poor visibility | Poor visibility caused by steam fog, ice fog, blowing snow, and other processes along the NSR is frequently encountered and limits the watchkeeping of navigation officers [64] |
| 11 | Rough sea | Most of the currents in the NSR are along the coast of a shallow-water continental shelf, and the currents in the narrow straits between the islands are strong, thus creating challenges for polar navigation [66] |
| 12 | Magnetic storm | Magnetic storms can greatly disturb the NSR security system in the field of communication and influence navigation instruments [35] |
| 13 | Obstacles other than ice | Underwater obstacles such as reefs, beaches, and unknown explosives are potential disruptions that threaten the effectiveness of the NSR precautions [67] |
| 14 | Seafarer competency | Seafarers on ships sailing along the NSR are faced with considerable ship handling and emergency challenges, which can potentially affect the function of the NSR precautions [61] |
| 15 | Geopolitics | The ships sailing along the NSR have to consider different laws and regulations, including those at the local, national, and international level; additionally, sometimes political considerations are involved, making the decision-making process very complex. [68] |
| Features | Description |
|---|---|
| Aid-to-navigation facility | The aid-to-navigation (A-to-N) facilities, including visual and audible A-to-N facilities, racons, radar marks, and shore-based Automatic Identification System (AIS) stations, are critical for navigating safely along the NSR. There are approximately 1240 coastal visual signs and 300 floating markers associated with the NSR [68]. |
| Skilled seafarer team | Compared with conventional shipping route, the NSR is characterized by lots of special risks. The skilled seafarer team can swiftly evaluate the situation and take effective countermeasures with teamwork to deal with potential risks. In addition, a skilled seafarer team can develop a harmonious atmosphere in which everyone can limit the defense risk. |
| Critical facility redundancy | The redundant critical facilities, such as those that provide emergency power backup, high power conservation, extra positioning techniques, and backup navigation instruments, are able to strengthen the robustness of the security system and restrict the consequences of disruptions. |
| Equipment for arctic environment | The equipment designed for the arctic environment can effectively defend against or absorb the risks caused by weather condition, such as low temperatures, frost, and moisture, especially the equipment allocated on deck, including cranes, mooring winches, and windlasses, which are exposed to the external environment. |
| Coordination with icebreaker | Icebreaker assistance operations play an essential role in ice-covered waters to reduce the risk of accidents, such as ice collisions and propeller or rudder damage. In addition, the case of trapped vessels by ice can also be avoided, and the disruption introduced by large amounts of floating ice can be absorbed [8]. |
| Ice pilots/navigators | The assistance provided by ice pilots or navigators can defend against or attenuate various risks caused by disruptions; this approach is suitable for the case in which a shipmaster has little experience navigating in ice along the NSR. The organizations providing ice pilot services can be obtained from the NSRA [68]. |
| Skilful emergency response | Under unpredictable situations related to heavy fog, floating ice, and strong wind in the NSR region, a proficient emergency response group can establish counteractive measures to response to the threats. Besides, a skilled seafarer can fully utilize the available resources, which are essential for mitigating various risks [27]. |
| Response plan | A detailed response plan corresponding to various predictable disruptions and risks encountered along the NSR is useful for guiding seafarers or operators to take appropriate actions during disruptions, thus keeping the disruption or risk controllable. |
| Navigational publications | Navigational publications refer to charts and other navigational publications, such as those used for guidance in arctic navigation, lists of radio signals, and notices to mariners; ice charts, which are useful for monitoring the risk related to sea ice, are particularly important [67,70] |
| Features | Description |
|---|---|
| Ice-breaking capacity | The ice-breaking capacity allows the vessels to adapt to a risk or disruption caused by floating ice in ice-covered waters along the NSR. The ice-breaking capacity can be improved by strengthening the hull to bear ice loads for safe navigation in ice fields [70]. |
| Information prediction services | Information prediction services include those for sea ice coverage, thickness, and motion, as well as weather conditions [1]. Under the conditions of predictable information, in the case of a disruption, seafarers and operators can take action in advance, for example, by anchoring to avoid a disruption or risk, changing the designed route, or requesting assistance from an icebreaker. |
| Preparedness for arctic shipping | Before navigating into ice-covered waters, vessels must be fully prepared, including obtaining extra fuel reserves, psychological preparation, understanding all the regulations that must be observed, preparing for low temperatures, etc.; in case of a disruption, the vessel can make some changes based on their preparations to adapt to the new situation caused by the disruption [70]. |
| Arctic communication | Arctic communication, including radar, radio, and International Maritime Satellite Organization (INMARSAT) communication, can coordinate operations from ship to ship and ship to icebreaker to adapt to the harsh environment and sailing conditions along the NSR [67]; additionally, Arctic communication helps vessels in the NSR region get assistance and guidance during disruptions, thus making risks controllable. |
| Features | Description |
|---|---|
| Rescue and anti-pollution facility | Rescue and anti-pollution facilities are utilized to restore the shipping capacity of the NSR after natural disasters and accidents. Currently, there are three rescue and research centers established temporally along the NSR from July to October. In addition, the rescue and anti-pollution capacities of the ports (20 approximately) along the NSR need to be improved for the quick restoration of the damaged route. |
| Ship repair facility | Ship repair facilities, such as yards, docks, gate operations, cranes, and warehouses, are essential for vessels that experience hull damage, machinery malfunctions, and propeller damage. Notably, the restorative capacity aimed at damaged ship repair will be limited if the stakeholders have little interest in investment. |
| Human-based resources | The restorative capacity associated with human-based resources includes service restoration and technology restoration, which are substantial parts of the post-disaster strategy. Restoration may include communication, navigation, pilot service, ice-breaker assistance, and weather and hydrology information systems. |
| Item | Age | Occupation | Educational Level | Certificate Rank | Job Tenure |
|---|---|---|---|---|---|
| Expert 1 (E1) | 53 | Senior seafarer | Bachelors of navigation | Senior Captain | He has been working on board a ship for nearly 25 years; as a senior captain, he sailed the Arctic Northeast Route recently. |
| Expert 2 (E2) | 50 | Senior seafarer | Bachelors of navigation | 2nd Officer | He has been working on board a ship for nearly 15 years; currently, he is certified as a Chief Officer working on a ship capable of navigating the NSR. |
| Expert 3 (E3) | 48 | Professor | Ph.D. of navigation | Senior Captain | He has been working on board ships since 1991 and obtained the certificate of senior captain; currently, he is an associate professor focusing on Arctic sea transport. |
| Expert 4 (E4) | 41 | Associate professor | Masters of marine engineering | Chief engineer | He has been working on ships since 2001, beginning as a cadet and eventually becoming a chief engineer; currently, he is an associate professor focusing on risk assessments of Arctic transport. |
| Expert 5 (E5) | 43 | Safety manager | Masters of navigation technology | Chief officer | He has been working on board ships since 2001, eventually becoming a chief officer; he is familiar with marine operation and equipment management for ships transiting Arctic waters. |
| Indicator | Classification | Score | Indicator | Classification | Score |
|---|---|---|---|---|---|
| Professional position | Senior academic | 5 | Experience (2) | 6–9 | 2 |
| Junior academic | 4 | ≤5 | 1 | ||
| Engineer | 3 | Education level | Ph.D. | 5 | |
| Technician | 2 | Masters | 4 | ||
| Worker | 1 | B.S. or B.E. | 3 | ||
| Age | ≥50 | 4 | Junior college | 2 | |
| 40–49 | 3 | School level | 1 | ||
| 30–39 | 2 | Certificate rank | Senior Cap. or C/E | 5 | |
| ≤30 | 1 | Cap. or C/E | 4 | ||
| Experience (1) | ≥30 years | 5 | C/O or 2/E | 3 | |
| 20–29 | 4 | Operational Officer/engineer | 2 | ||
| 10–19 | 3 | ratings | 1 |
| Expert | Position | Experience | Education | Age | Certificate | Weight |
|---|---|---|---|---|---|---|
| Expert 1 | Senior seafarer | 30 | Bachelors | 53 | Senior Captain | 0.189 |
| Expert 2 | Senior seafarer | 27 | Bachelors | 50 | 2nd Officer | 0.121 |
| Expert 3 | Professor | 18 | Ph.D. | 48 | Senior Captain | 0.300 |
| Expert 4 | Associate professor | 22 | Masters | 41 | Chief engineer | 0.206 |
| Expert 5 | Safety manager | 8 | Masters | 43 | Chief officer | 0.184 |
| Item | Aggregated Value | Item | Aggregated Value | Item | Aggregated Value |
|---|---|---|---|---|---|
| D1-1 | 0.6528 | D3-4 | 0.5325 | R1-6 | 0.67 |
| D1-2 | 0.4615 | D3-5 | 0.5445 | R1-7 | 0.6198 |
| D1-3 | 0.7225 | D4-1 | 0.4355 | R2-1 | 0.5445 |
| D2-1 | 0.7084 | D4-2 | 0.7807 | R2-2 | 0.7085 |
| D2-2 | 0.6036 | D4-3 | 0.6438 | R2-3 | 0.5021 |
| D2-3 | 0.7338 | R1-1 | 0.5887 | R2-4 | 0.6635 |
| D2-4 | 0.7138 | R1-2 | 0.8142 | R2-5 | 0.8594 |
| D3-1 | 0.6468 | R1-3 | 0.4994 | R3-1 | 0.7897 |
| D3-2 | 0.7818 | R1-4 | 0.5079 | R3-2 | 0.6083 |
| D3-3 | 0.6641 | R1-5 | 0.7892 | R3-3 | 0.6097 |
| Expert Judgement | |||||
|---|---|---|---|---|---|
| : | M | H | H | M | H |
| : | M | L | L | M | VH |
| : | VH | H | M | H | H |
| Aggregation of expert judgement (the same method as adopted for the aggregated value in Table 10) | |||||
| Conditional probability calculation by the Noisy-OR model | |||||
| …… | |||||
| Conditional probability table for the node “nav. Service out of order” (Y) | |||||
| State of the Absorptive Capacity | True | False |
|---|---|---|
| Expression | PDO × ASC | 0 |
| State of the Post-Disruption Capacity | True | False |
|---|---|---|
| Expression | LC × 0.80 | 0 |
| Scenario | R1-2 | R2-2 | R3-1 | Absorptive Capacity (%) | Adaptive Capacity (%) | Restorative Capacity (%) | Resilience (%) |
|---|---|---|---|---|---|---|---|
| Base | -- | -- | -- | 93.4 | 98.0 | 88.2 | 78.5 |
| 1 | false | -- | -- | 89.2 (↓) | 98.0 | 88.2 | 78.1 (↓) |
| 2 | false | false | -- | 89.2 | 94.8 (↓) | 88.2 | 77.8 (↓) |
| 3 | false | false | false | 89.2 | 94.8 | 65.7 (↓) | 75.9 (↓) |
| Capacity Type | Conditional Entropy | Mutual Information | Implication of Mutual Information |
|---|---|---|---|
| Absorptive capacity () | 0.421 | 0.322 | The uncertainty of system resilience can be reduced by 32.2% in the case of a good knowledge of absorptive capacity |
| Adaptive capacity () | 0.440 | 0.303 | The uncertainty of system resilience can be reduced by 30.3% in the case of a good knowledge of adaptive capacity |
| Restorative capacity () | 0.542 | 0.201 | The uncertainty of system resilience can be reduced by 20.1% in the case of a good knowledge of restorative capacity |
Publisher’s Note: MDPI stays neutral with regard to jurisdictional claims in published maps and institutional affiliations. |
© 2021 by the authors. Licensee MDPI, Basel, Switzerland. This article is an open access article distributed under the terms and conditions of the Creative Commons Attribution (CC BY) license (https://creativecommons.org/licenses/by/4.0/).
Share and Cite
Qiao, W.; Ma, X.; Liu, Y.; Lan, H. Resilience Assessment for the Northern Sea Route Based on a Fuzzy Bayesian Network. Appl. Sci. 2021, 11, 3619. https://doi.org/10.3390/app11083619
Qiao W, Ma X, Liu Y, Lan H. Resilience Assessment for the Northern Sea Route Based on a Fuzzy Bayesian Network. Applied Sciences. 2021; 11(8):3619. https://doi.org/10.3390/app11083619
Chicago/Turabian StyleQiao, Weiliang, Xiaoxue Ma, Yang Liu, and He Lan. 2021. "Resilience Assessment for the Northern Sea Route Based on a Fuzzy Bayesian Network" Applied Sciences 11, no. 8: 3619. https://doi.org/10.3390/app11083619
APA StyleQiao, W., Ma, X., Liu, Y., & Lan, H. (2021). Resilience Assessment for the Northern Sea Route Based on a Fuzzy Bayesian Network. Applied Sciences, 11(8), 3619. https://doi.org/10.3390/app11083619