Article

Convolutional Neural Networks for Differential Diagnosis of Raynaud’s Phenomenon Based on Hands Thermal Patterns

1
Department of Neurosciences, Imaging and Clinical Sciences, University G. d’Annunzio of Chieti-Pescara, 66100 Chieti, Italy
2
Department of Medicine and Aging Science, Dermatologic Clinic, G. D’Annunzio University, 66100 Chieti, Italy
*
Author to whom correspondence should be addressed.
Appl. Sci. 2021, 11(8), 3614; https://doi.org/10.3390/app11083614
Submission received: 29 March 2021 / Revised: 11 April 2021 / Accepted: 15 April 2021 / Published: 16 April 2021
(This article belongs to the Special Issue Artificial Intelligence Applications and Innovation)

Abstract

:
Raynaud’s phenomenon (RP) is a microvessels’ disorder resulting in transient ischemia. It can be either primary or secondary to connective tissue diseases, such as systemic sclerosis. The differentiation between primary and secondary to systemic sclerosis is of paramount importance to set the proper therapeutic strategy. Thus far, thermal infrared imaging has been employed to accomplish this task by monitoring the finger temperature response to a controlled cold challenge. A completely automated methodology based on deep convolutional neural network is here introduced with the purpose of being able to differentiate systemic sclerosis from primary RP patients by relying uniquely on thermal images of the hands acquired at rest. The classification performance of such a method was compared to that of a three-dimensional convolutional neural network model implemented to classify thermal images of the hands recorded during rewarming from a cold challenge. No significant differences were found between the two procedures, thus ensuring the possibility to avoid the cold challenge. Moreover, the convolutional neural network models were compared with standard feature-based approaches and showed higher performances, thus overcoming the limitations related to the feature extraction (e.g., biases introduced by the operator). Such automated procedures can constitute promising tools for large scale screening of primary RP and secondary to systemic sclerosis in clinical practice.

1. Introduction

Raynaud’s phenomenon (RP) is a common vascular disorder consisting of recurrent, long-lasting, and episodic vasospasm of the fingers and toes often manifesting as discoloration and pain [1]. RP is typically induced by cold exposure and emotional stress [2]. It affects approximately 5–10% of the population (prevalently females) [3], with a worldwide distribution, although its prevalence is elevated in cold climates where the risk of exposure to low ambient temperatures is greater [4]. RP is classified as primary RP (PRP) if there is no known underlying illness and secondary when associated with a disorder detected upon assessment [5]. The distinction is important because prognosis, severity, and treatment can all be affected [6]. Secondary RP can be associated with many systemic rheumatic diseases. The most frequent association is with systemic sclerosis (SSc) [7].
SSc is a complex autoimmune connective tissue disease that is characterized by progressive generalized obliterative vasculopathy and widespread aberrant tissue fibrosis [8]. Although SSc is a heterogeneous disease, RP occurs in most patients, affecting ∼96% of them [9]. RP is considered the most common and one of the earliest symptoms of this disease [10]. SSc-associated RP typically has a lag period that can last several years before additional SSc organ-specific disease manifestations emerge [10,11]. Whereas in primary or ‘idiopathic’ RP, tissue ischemia is transient or reversible, in secondary RP persistent tissue ischemia can occur, resulting in digital ulceration and/or gangrene [12].
Frequently in the early stages of disease there is not a clear-cut difference between PRP and secondary PR. Indeed, many RP patients have no sign of systemic disease, although they do present with subtle nailfold abnormalities. Conversely, the differential diagnosis of PRP versus secondary RP is of utmost importance to allow for the earliest successful treatment of this condition and the associated underlying disease. Since RP impacts the finger thermoregulatory system, the evaluation of the finger thermoregulatory impairment is crucial to distinguish between PRP and RP secondary to SSc [13]. To this aim, finger temperature can be monitored through thermal infrared (IR) imaging technique.
Thermal IR imaging is a contactless, non-invasive technique which provides a map of a body’s superficial temperature by measuring its emitted infrared radiation [14,15,16]. It has been widely used in medicine to assess cutaneous temperature and its topographic distribution as well as to monitor the psychophysiological state of an individual [17,18]. Considering that the skin temperature depends on local blood perfusion and thermal tissue properties, thermal IR imaging provides important indirect information concerning circulation and thermoregulatory functionality of the cutaneous tissue [14]. This technique has been employed to differentiate primary from secondary RP, often by monitoring the finger response to a controlled cold challenge [19]. Indeed, SSc, PRP, and healthy controls (HC) show different thermal recovery to the same functional stimulation (i.e., cold challenge) [13]. Therefore, the differentiation among HC, SSc, and PRP was usually performed based on statistical analysis of simple descriptors of the cutaneous temperature recovery (e.g., lag time, time to reach a given recovery threshold) [19]. However, such an analysis procedure involves identifying the regions of interest on the fingers from which the statistical descriptors of the temperature recovery are computed as well as choosing the best descriptors to use for the classification. Hence, the intervention of an expert operator is required, thus introducing operator-dependent bias on the classification outcome.
Furthermore, since in PRP or SSc patients the blood vessels in the extremities are over-sensitive to changes in temperature, the administration of a cold challenge can be a very uncomfortable, and frequently painful, process. In addition, a major problem has been the lack of a standardized protocol that regularize such a challenges’ administration procedure. It would therefore be desirable to develop an automated classification approach able to differentiate between PRP, SSc, and HC, thus limiting the human intervention and without the administration of a cold stimulus.
In this perspective, machine learning approaches are valuable to minimize or avoid the clinician’s intervention and to speed up diagnosis. Indeed, such approaches are suitable for solving complex task and limiting human intervention. Presently, machine learning algorithms are gaining popularity across a wide range of innovative applications, such as smart houses [20] and autonomous vehicles [21] but also in physiological signal classification [22,23] or to support disease diagnosis [24,25]. Machine learning approaches can be feature-based or data-driven [26]. In the traditional feature-based machine learning approach, features are manually selected and extracted. The difficulty with this approach is that it is necessary to choose which features are important and, as the number of classes to classify increases, feature extraction can become cumbersome. On the other hand, data-driven methods provide a principled set of mathematical methods for extracting meaningful features from data [27]. Specifically, it learns from and makes predictions based on data. Those approaches are usually performed by employing advanced machine learning algorithm such as a deep neural network. Indeed, a deep neural network model exploits multiple layers of nonlinear information processing for feature extraction and transformation as well as for pattern analysis and classification [28]. Figure 1 shows the difference between the data driven and feature-based methods.
With respect to a deep neural network, deep convolutional neural networks (DCNNs) have become the leading architecture for most image classification tasks [29]. DCNNs make use of kernels (also known as filters), to detect features throughout an image. A kernel is a matrix of values, called weights [28]. They are typically composed of three types of layers: convolution, pooling, and fully connected layers. The first two perform feature extraction, whereas the third maps the extracted features into a final output, which is often a classifier. DCNNs find complex relationships by minimizing a cost function (a measure of error between the DCNN and real outputs) through the use of gradient descent approaches and a backpropagation algorithm [30]. DCNNs have been widely used in biomedical images analysis and they have reached excellent classification outcomes [31,32].
In this study, a novel automated DCNN classification methodology that aims to distinguish among PRP, SSc, and HC based on patient’s hand thermal patterns measured at rest (i.e., without the administration of a cold challenge) is presented. The performances of the proposed classifier were compared to that of a DCNN model implemented to classify hands thermal images of participants undergoing the cold challenge procedure (CCP). Moreover, for both the analyses, the DCNN models’ performances were compared to those of a feature-based machine learning approach. The comparison between different models allowed us to investigate the capability of the DCNN classifier based on the thermal image at rest to identify PRP, SSc, and HC with respect to approaches that require the administration of a cold challenge and the intervention of an expert operator.

2. Materials and Methods

2.1. Paticipants

The experimental session involved 36 participants: 13 healthy, 11 PRP, and 12 SSc participants (Table 1). Participation was strictly voluntary. Before the start of the experimental trials, the participants were adequately informed about the purpose and protocol of the study. All participants signed an informed consent form, which outlined the methods and the purposes of the experimentation in accordance with the Declaration of Helsinki [33]. The study was approved by the Institutional Review Board and Local Ethical Committee of the School of Medicine of the University of Chieti-Pescara (protocol code AC052514 12/07/2016).
SSc patients were recruited from voluntary patients attending the Dermatologic Clinic of the University G. d’Annunzio, Chieti, Italy from December 2016 to February 2017. All the patients fulfilled the ACR-EULAR Collaborative Initiative Criteria for scleroderma [34]. PRP patients were recruited from the Capillaroscopy outpatients service of the Dermatologic Clinic of the University G. d’Annunzio, Chieti, Italy from December 2016 to February 2017. Healthy individuals were recruited from parents of dermatologic oncology patients attending the outpatients service of the Dermatologic Clinic of the University G. d’Annunzio, Chieti, Italy from December 2016 to February 2017. All healthy individuals did not disclose any history of vascular disease or present with any type of vascular disease or vasoactive drug.
PRP and SSc patients were a priori classified according to the criteria and the methods established in 2001 by the American College of Rheumatology [35,36]. All the patients received continuative vasodilator therapy for RP (Pentoxyfillin, calcium channel blockers) which was not discontinued for the purposes of the study. PRP and SSc patients’ exclusion criteria were a history of bronchial asthma; renal or hepatic failure; hypotension; moderate or severe arterial hypertension; history of drug or alcohol abuse, smoking, gout, gastric ulcers, or cerebral or cardiac ischemic disease; and sympathectomy of the upper limb performed within 12 months of the beginning of the study. HC exclusion criteria were cigarette smoking; cardiovascular, or neurovascular disorders; hypertension; any overt dermatological or immunological disease; all types of therapeutic treatment; and history of drug or alcohol abuse. Moreover, participants were requested to refrain from vigorous exercise, caffeine, and alcohol for 4 hours prior to the assessment.

2.2. Procedure

Upon arrival, each participant was left in the experimental room for 15 min [37] to allow participants to achieve proper acclimatization to the room environmental conditions and the baseline skin temperature to stabilize. The recording room was set at a standardized temperature (23 ± 0.5 °C) and humidity (55%) by a thermostat according to the International Academy of Thermology guidelines [38]. Participants sat comfortably on a chair during acclimatization and measurement periods. The experimental paradigm consisted of the IR-images recording of the dorsal aspect of both hands, before and after the administration of a cold challenge. The first ones were necessary to obtain the baseline of the fingers’ temperature and the remaining ones were useful to monitor the temperature recovery. The participant’s hands were placed on a non-reflective, black surface, where the hands shape was drawn to maintain the same position before and after the cold stimulus. The cold challenge was administered by immersing the hands (protected from getting wet by thin, disposable latex gloves) for 2 min in a 3 L water bath maintained at 10 °C. After the cold challenge, the gloves were removed, and the hands were returned to their original position on the non-reflective surface. Each recording session lasted 23 min including both baseline (3 min), recovery phases (20 min), beside the time needed for the cold stress (2 min) that was not recorded. The images were acquired every 30 s.

2.3. Data Acquisition

A FLIR SC3000 digital thermal camera was used in the experiment. It is characterized by a Focal Plane Array of 320 × 240 Quantum Well Infrared Photodetectors, sensitive to the thermal radiation in the 8–9 μm band. The temperature sensitivity/noise equivalent temperature difference of the thermal camera is 0.02 K. The thermal camera was blackbody-calibrated to factory specifications by means of periodic calibration performed by the Quality Management Systems of FLIR, which is certified to comply with ISO 9001:2008. The process of blackbody calibration is described in [37]. Such a process is useful to remove noise-effects related to the sensor drift/shift dynamics and optical artefacts. In accordance to literature [39], cutaneous emissivity was considered as ε ≈ 0.98. The thermal camera was placed 1.5 m distant from the hands’ dorsum and it was placed perpendicular to the analyzed region [40].
The thermal images acquired were used to feed the DCNN models. In detail, the thermal image corresponding to the central part of the baseline period was chosen as representative of the resting condition for each participant. The whole CCP including the rewarming condition was instead represented by a sub-sample of thermal images constituted by extracting an image every three minutes.

2.4. Data Analysis

The data were analyzed considering the two conditions: thermal data acquired before the cold challenge (i.e., baseline data or hands’ thermal images at rest) and data related to the whole CCP (i.e., baseline and recovery data). For each of the two conditions, a DCNN and a feature-based model such as the support vector classifier (SVC) were implemented to classify PRP, SSc, and Healthy participants. The performances of all the models were compared employing the McNemar–Bowker test. Figure 1 shows the DCNN and SVC processing pipeline implemented for the baseline analysis.
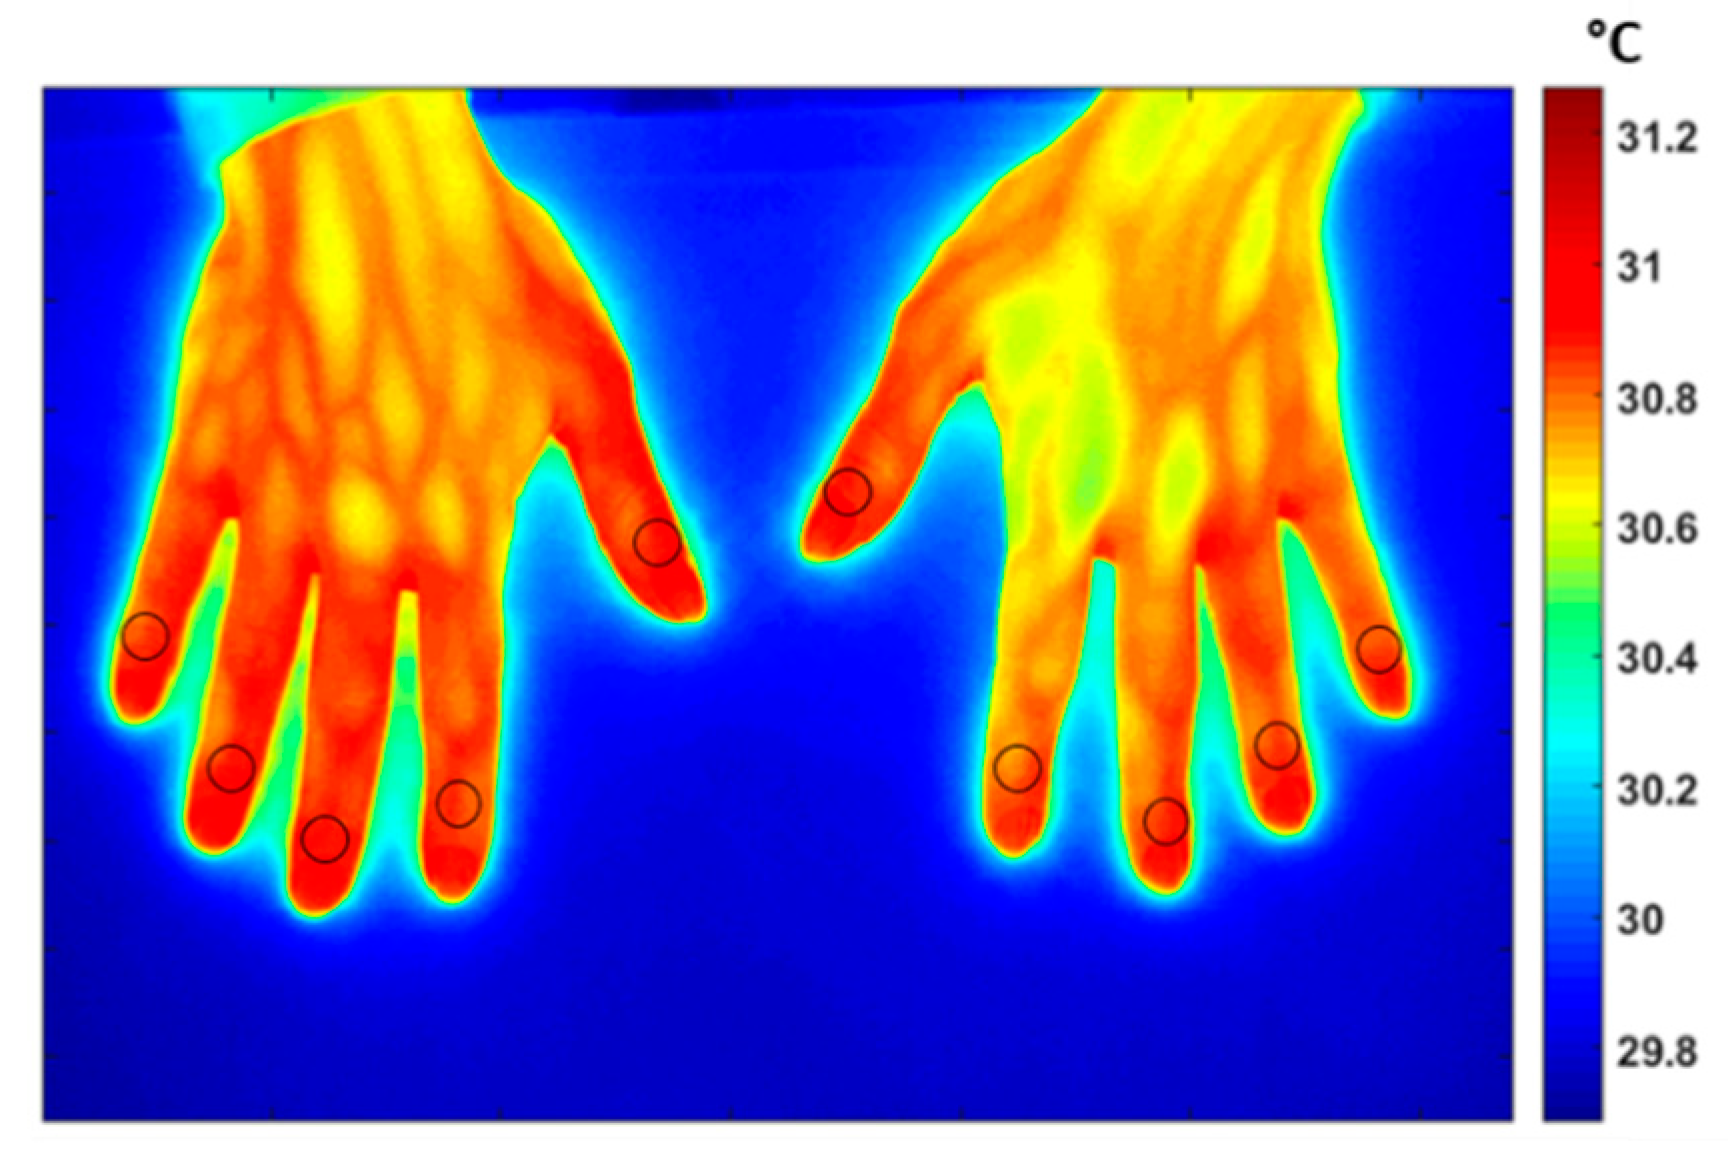
Concerning the feature-based approach for each finger of both hands, baseline and rewarming curves were obtained by averaging the temperature of the pixels within a specific region of interest. The regions of interest were identified as the nail-bed regions [19] (Figure 2). Displacement between images were corrected manually using anatomical landmarks based on the fingers profile [19].

2.4.1. Baseline Analysis

DCNN Model

The IR images of the dorsum of both participants’ hands during the baseline condition were used as the input of the DCNN model implemented to differentiate PRP from SSc and HC. The DCNN model was developed according to the following processing steps:
  • Input images preprocess. Firstly, the IR images were down sampled from 320 × 240 to 80 × 107 pixels and normalized by subtracting the average value of the entire set of images. A Principal Components Analysis was then adopted to reduce the number of spatial features while keeping the information characterizing the object to be analyzed. The number of components kept was 20 with a cumulative explained variance ratio of 0.95.
  • Model architecture design. The DCNN structure employed in this work was heuristically chosen in similarity with previously reported DCNN structures on biological images or signals classification [41]. The DCNN was composed of 3 convolutional layers, 3 pooling layers, and 1 fully connected prior to the output layer. The first convolutional layer consisted in 32 filters (size 5 × 5) applied to the input images to obtain 32 feature maps of the images. The other 2 convolutional layer were both composed of 10 filters (size 5 × 5). The activation function employed in all the 3 convolutional layers to add nonlinearity to the network, were the Rectified Linear Unit (ReLU) function. Then, as pooling layer (or down-sampling layer) a MaxPooling were chosen, where the largest element from the rectified feature map was retained. A filter size of 3 × 3, 3 × 4 and 2 × 2 for the 3 MaxPooling layers, respectively, was implemented to reduce the dimensionality of each feature to 1 after the 3 convolutional layers and before the fully connected layer. The fully connected layer consisted in 20 neurons employed to summarize information and compute the class score. Lastly, a softamx function was used in the output layer, which outputs a probability value from 0 to 1 for each of the 3 classification classes (PRP, SSc, and healthy). All the biases of the DCNN were initialized to a small constant, i.e., 0.1, whereas the weights were initialized in a pseudo-random manner employing a truncated normal distribution (standard deviation = 0.1). The DCNN architecture is shown in Figure 1a.
  • Model optimization. The model optimization was primarily focused on how to reduce overfitting. Indeed, developing a DCNN model with a small sample size inevitably involves high risk of overfitting. A technique used to address overfitting is regularization [42]. In this study, a Ridge Regression (L2 regularization) was implemented by adding the sum of the squared values of the model coefficient (weights) as a penalty term to the loss function. The loss function employed in this study was the categorical cross-entropy, therefore after performing the regularization technique it resulted in the following Equation:
    L o s s r = y k   log y ^ k   + λ 2 ω i 2  
    where y ^ k   is the kth scalar value of the model output, yk is the corresponding target value, and the constant λ times the sum of the squared weight ( ω ) values is the regularization term. The λ value was set to 0.01. This was intended to reduce model complexity and make the model less prone to overfitting. In addition, instead of using a fixed learning rate hyperparameter for the presented model, which could lead the model to converge too quickly to a suboptimal solution, a tunable learning rate over the training process was implemented. In detail, a function was implemented to reduce learning rate by a factor of 0.1 once learning stop improving during at least 10 epochs.
  • Model evaluation. To evaluate the model performance, a categorical cross-entropy was employed, which is suitable for multiclass classification task. The optimization procedure was iterated for 100 epochs with a batch size of 6 samples. To address the model generalization performance, a leave-one-out cross-validation procedure was performed [43]. The metrics used for evaluating the model was the accuracy, sensitivity, and specificity. Accuracy represents the percentage of correct predictions out of the total number of test samples. Sensitivity is the proportion of predicted true positives out of all patients with the disease, whereas specificity represent the percentage of the predicted true negatives out of all participants who do not have the disease [44]. Those metrics were performed by counting the number of correct DCNN predictors after an argmax evaluation of the DCNN output vector, averaged among the plateau iterations. This procedure was conducted following the leave one-out cross-validation. The overall sensitivity and specificity of the classifier were obtained by averaging the sensitivity and specificity of each class, respectively.
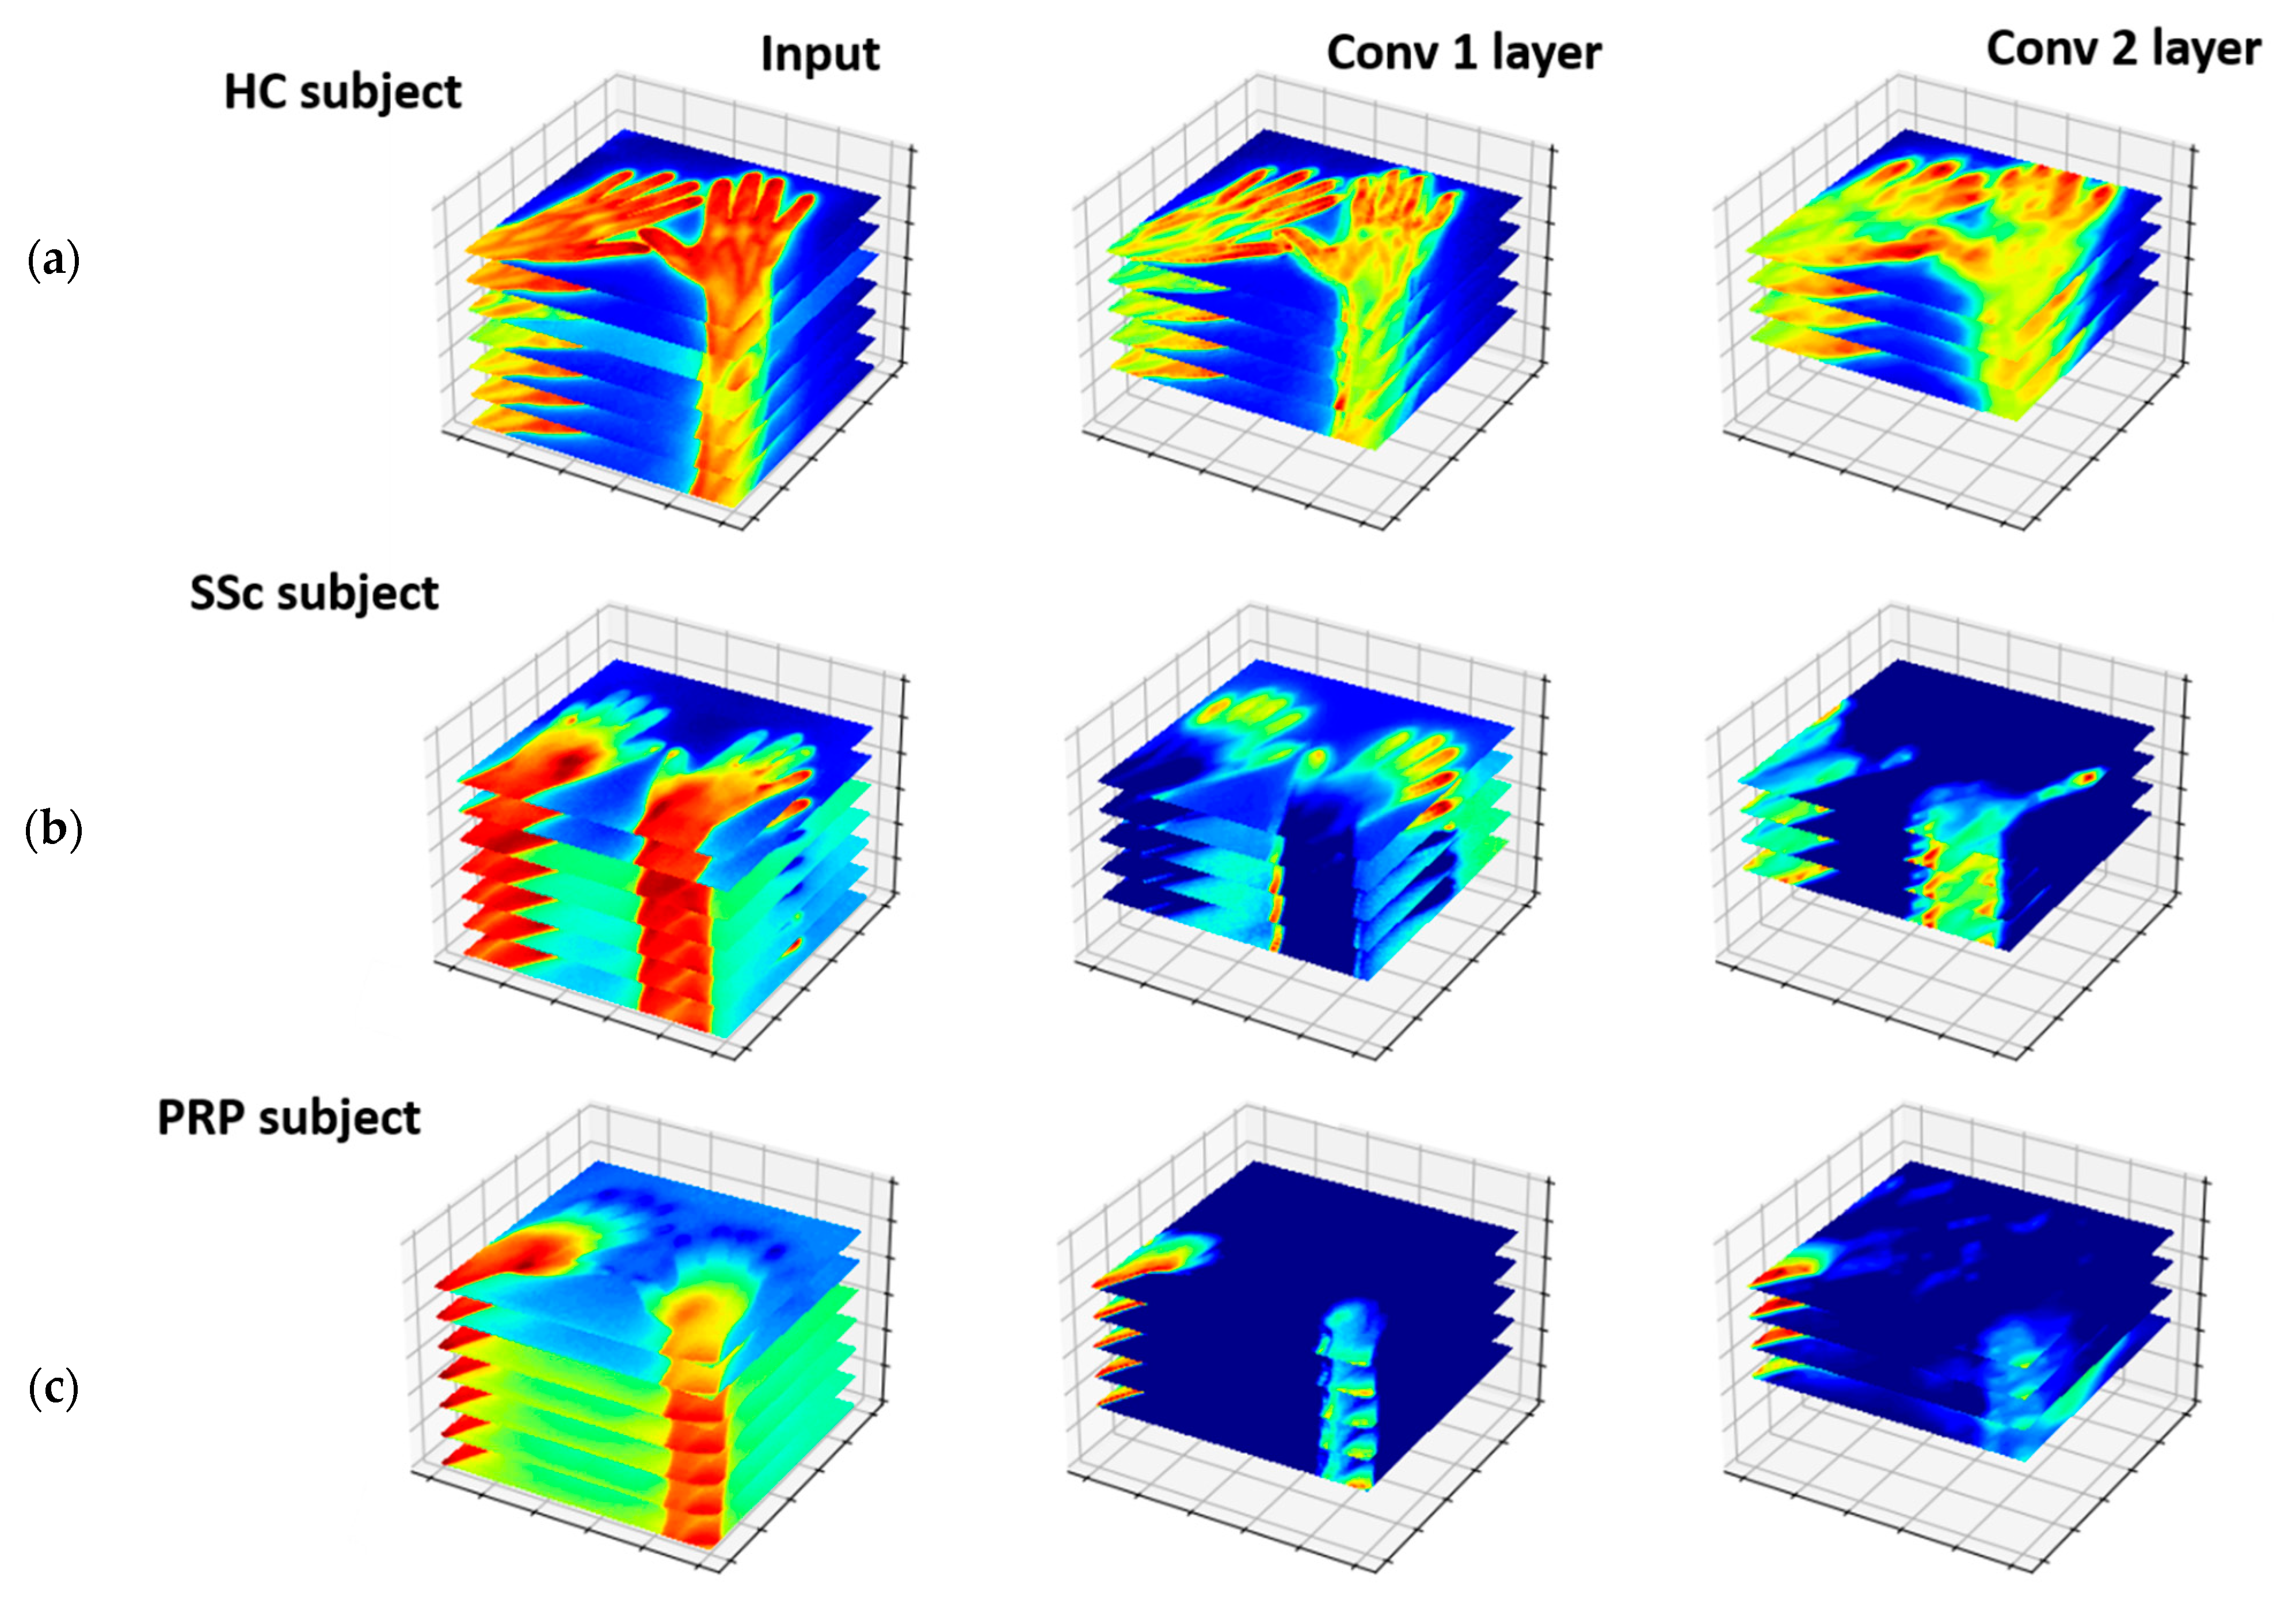
The described DCNN model was implemented in Python using Keras API with TensorFlow backend. For model evaluation, the scikit learn library was utilized. Figure 3 shows an example of the input images, respectively, for HC, SSc, and PRP participants, and the related feature maps resulting as output from the first two convolutional layers.

Feature-Based Analysis

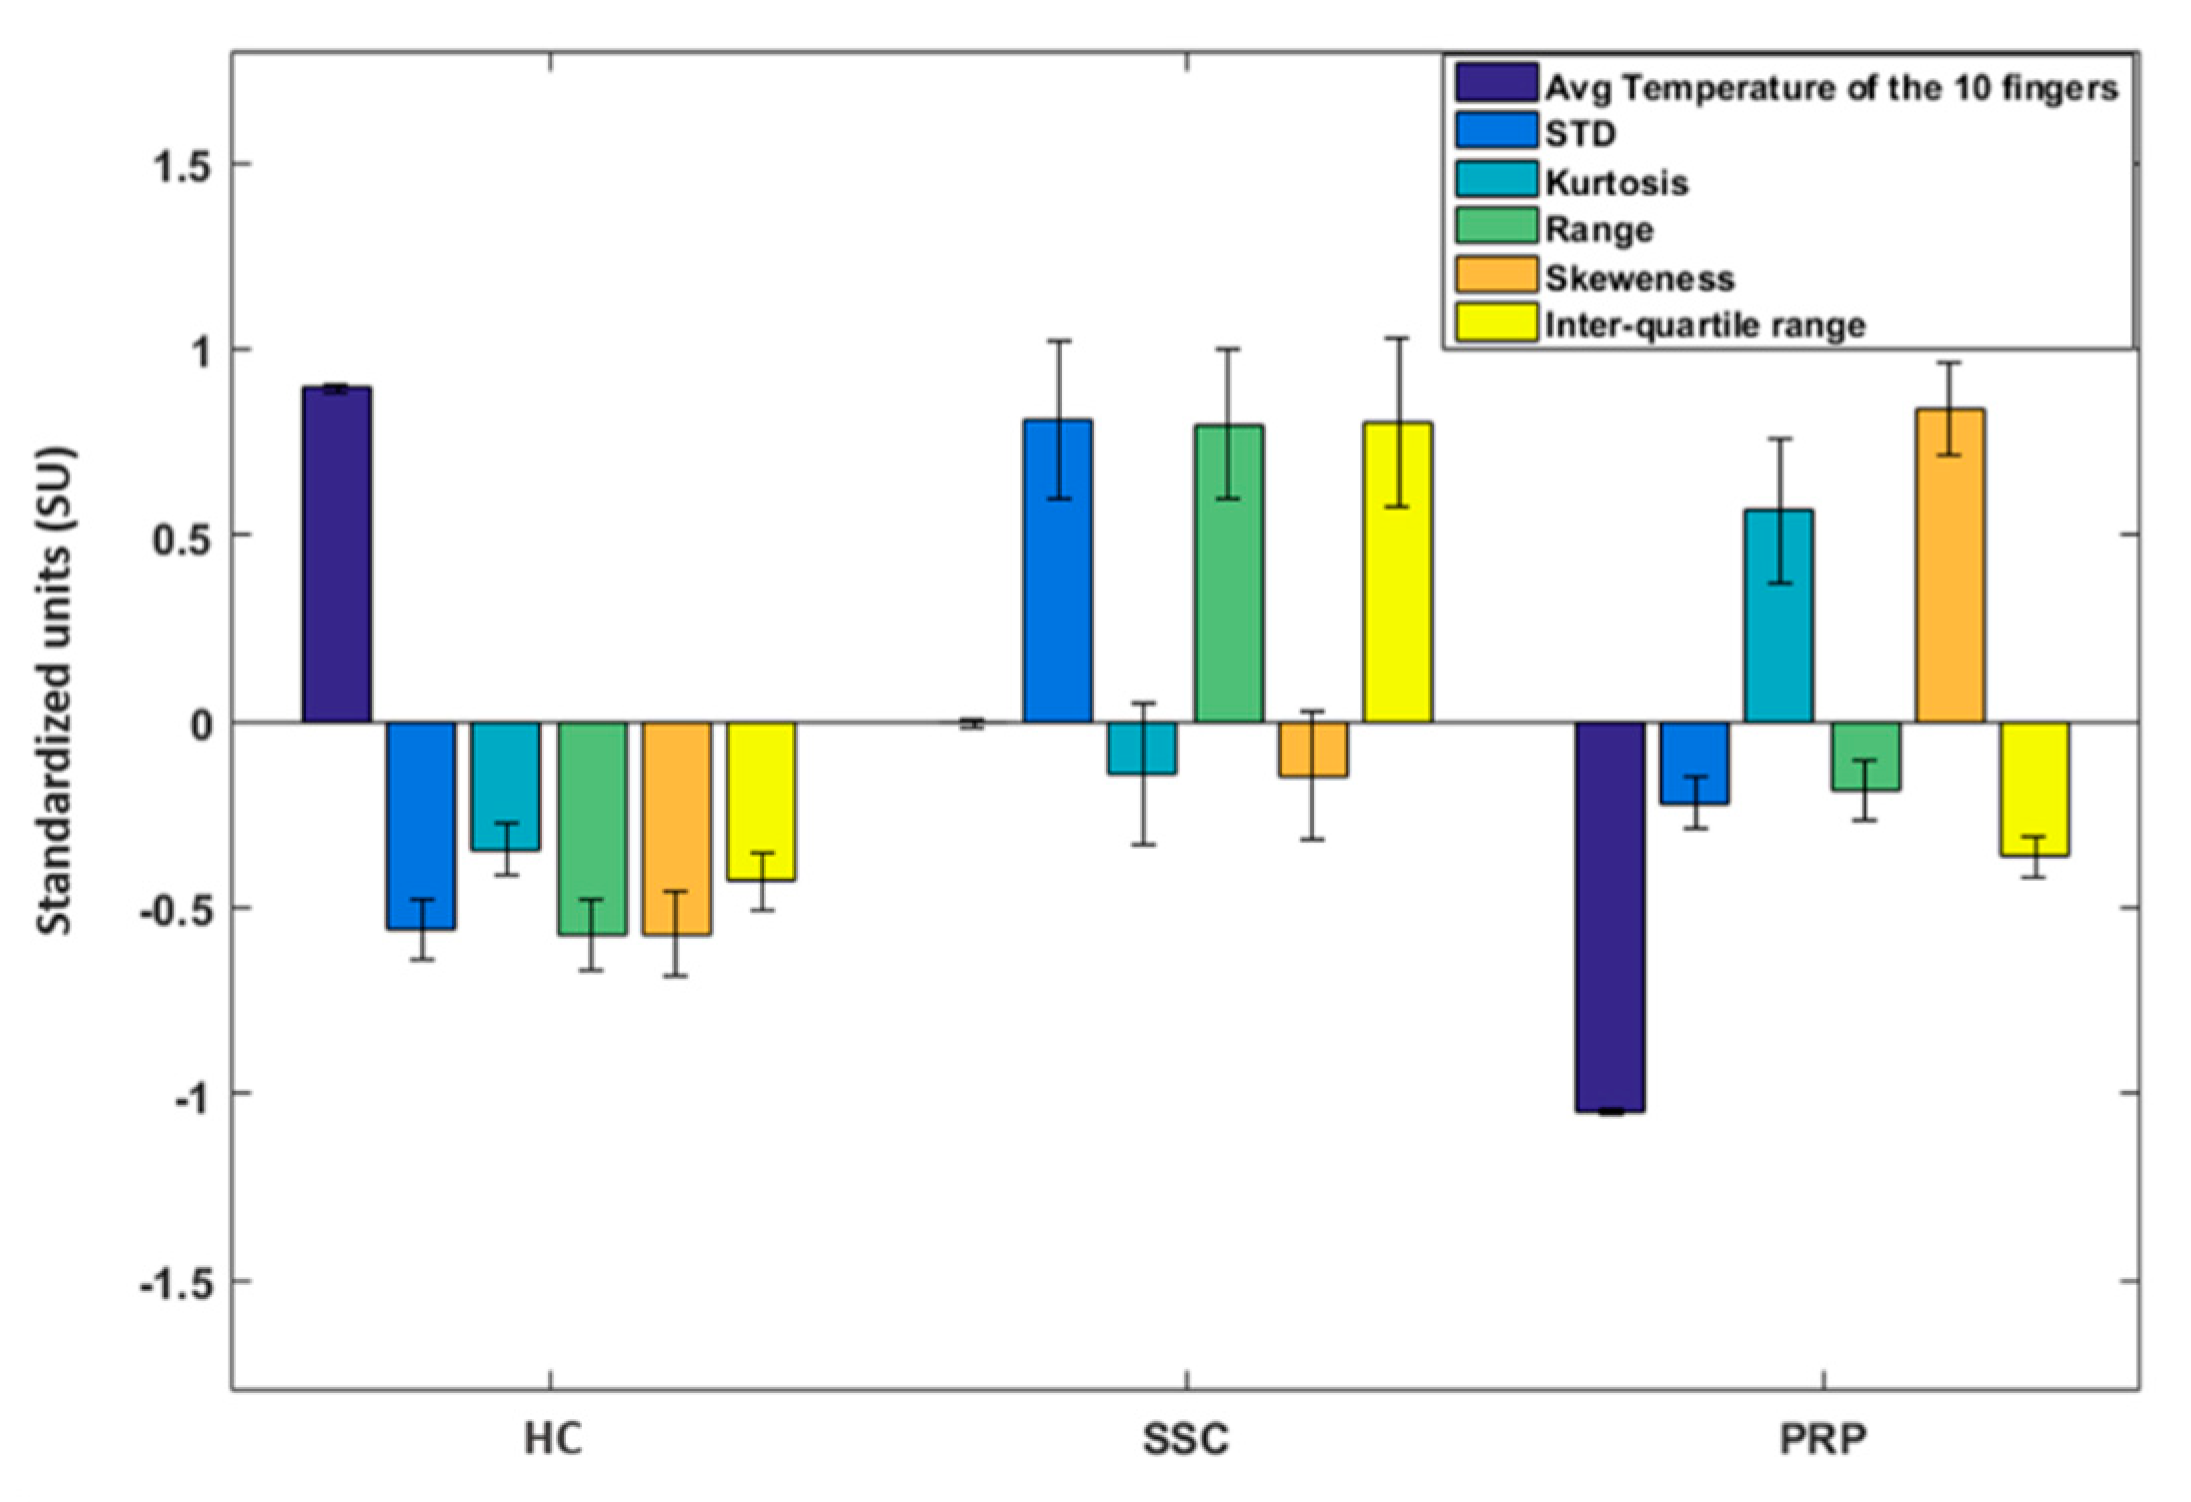
A feature extraction algorithm was then implemented to extract features of interest from the same IR-images of the baseline condition. In detail, a region of interest present on each fingers’ nail bed was manually selected. For each region of interest, the temperature average value was extracted. Region of interests are shown in Figure 2. The extracted temperature data were then normalized by subtracting the average value of the entire dataset. In addition, for each participant, features related to the 10 fingers normalized temperature distribution were estimated. These features were: the standard deviation (STD), kurtosis, skewness, range (i.e., the difference between the largest and smallest values of the distribution), and the inter-quartile range (i.e., the difference between the third and first quartile). Figure 4 shows the group mean and standard deviation of the 10 fingers’ temperature average value, and of all the other features z-score normalized.
As a machine learning approach, the SVC was implemented. Specifically, the SVC was computed using radial basis function (RBF) as a kernel function (non-linear). Such a function has the following formula for two vectors u and v:
RBF (u, v) = exp(−γ ‖u−v‖2)
where γ is a hyperparameter used as similarity measure between two data point. For the purpose of our study γ was set as follows:
γ = 1/(number of features = 15)
whereas the regularization hyperparameter C was set to 5. The SVC generalization capabilities were assessed through cross-validation. The same cross-validation procedure employed for the DCNN model were utilized. The metrics employed to be evaluated were the accuracy, sensitivity, and specificity. The z-score normalized features constituted the SVC inputs.

2.4.2. CCP Analysis

3-Dimensional DCNN

A 3-dimensional DCNN (3D-DCNN) model was implemented to classify the thermal images recorded during the whole CCP (i.e., baseline and recovery conditions) in the three classes (HC, SSc, and PRP). Due to the high computational load and the time required to analyze all the images of the recorded IR video (one every 30 s for 20 min, 40 images in total), a representative sample was considered for the successive analyses. This sample was composed of IR-images extracted every three minutes. The baseline image was also added to the set of images to better describe the rewarming phenomenon and in accordance with previous studies [13,19].
The 3D-DCNN differs from the 2D in the convolutional filter type. Indeed, it applies a three-dimensional filter to the dataset and the filter moves in three-directions (x, y, z) to calculate the low-level feature representations. Their output shape is a three-dimensional volume space. Architectures with volumetric (i.e., spatially 3D) convolutions have been successfully used in video analysis or 3D medical images [45,46]. In this case, time acts as the third dimension [47].
The 3D-DCNN model was implemented following the same processing step used to develop the DCNN model (Section 2.4.1). The batch of input images underwent the same preprocessing procedure as described in Section 2.4.1, whereas the model architecture design slightly changed. The number of 3D-filters in the three convolutional layers remained the same, whereas the filter sizes were, respectively, 5 × 5 × 4, 3 × 3 × 2, 3 × 4 × 3, and the three MaxPooling, respectively, 3 × 3 × 1, 3 × 3 × 1, 3 × 4 × 2. In this way the dimensionality of each feature was reduced to 1 before the fully connected layer. Finally, the model optimization and evaluation were conducted as previously described. The features map resulting as output from the first 2 convolutional layers together with the batch of input images, respectively for HC, SSc, and PRP participants are shown in Figure 5.

Feature-Based Analysis

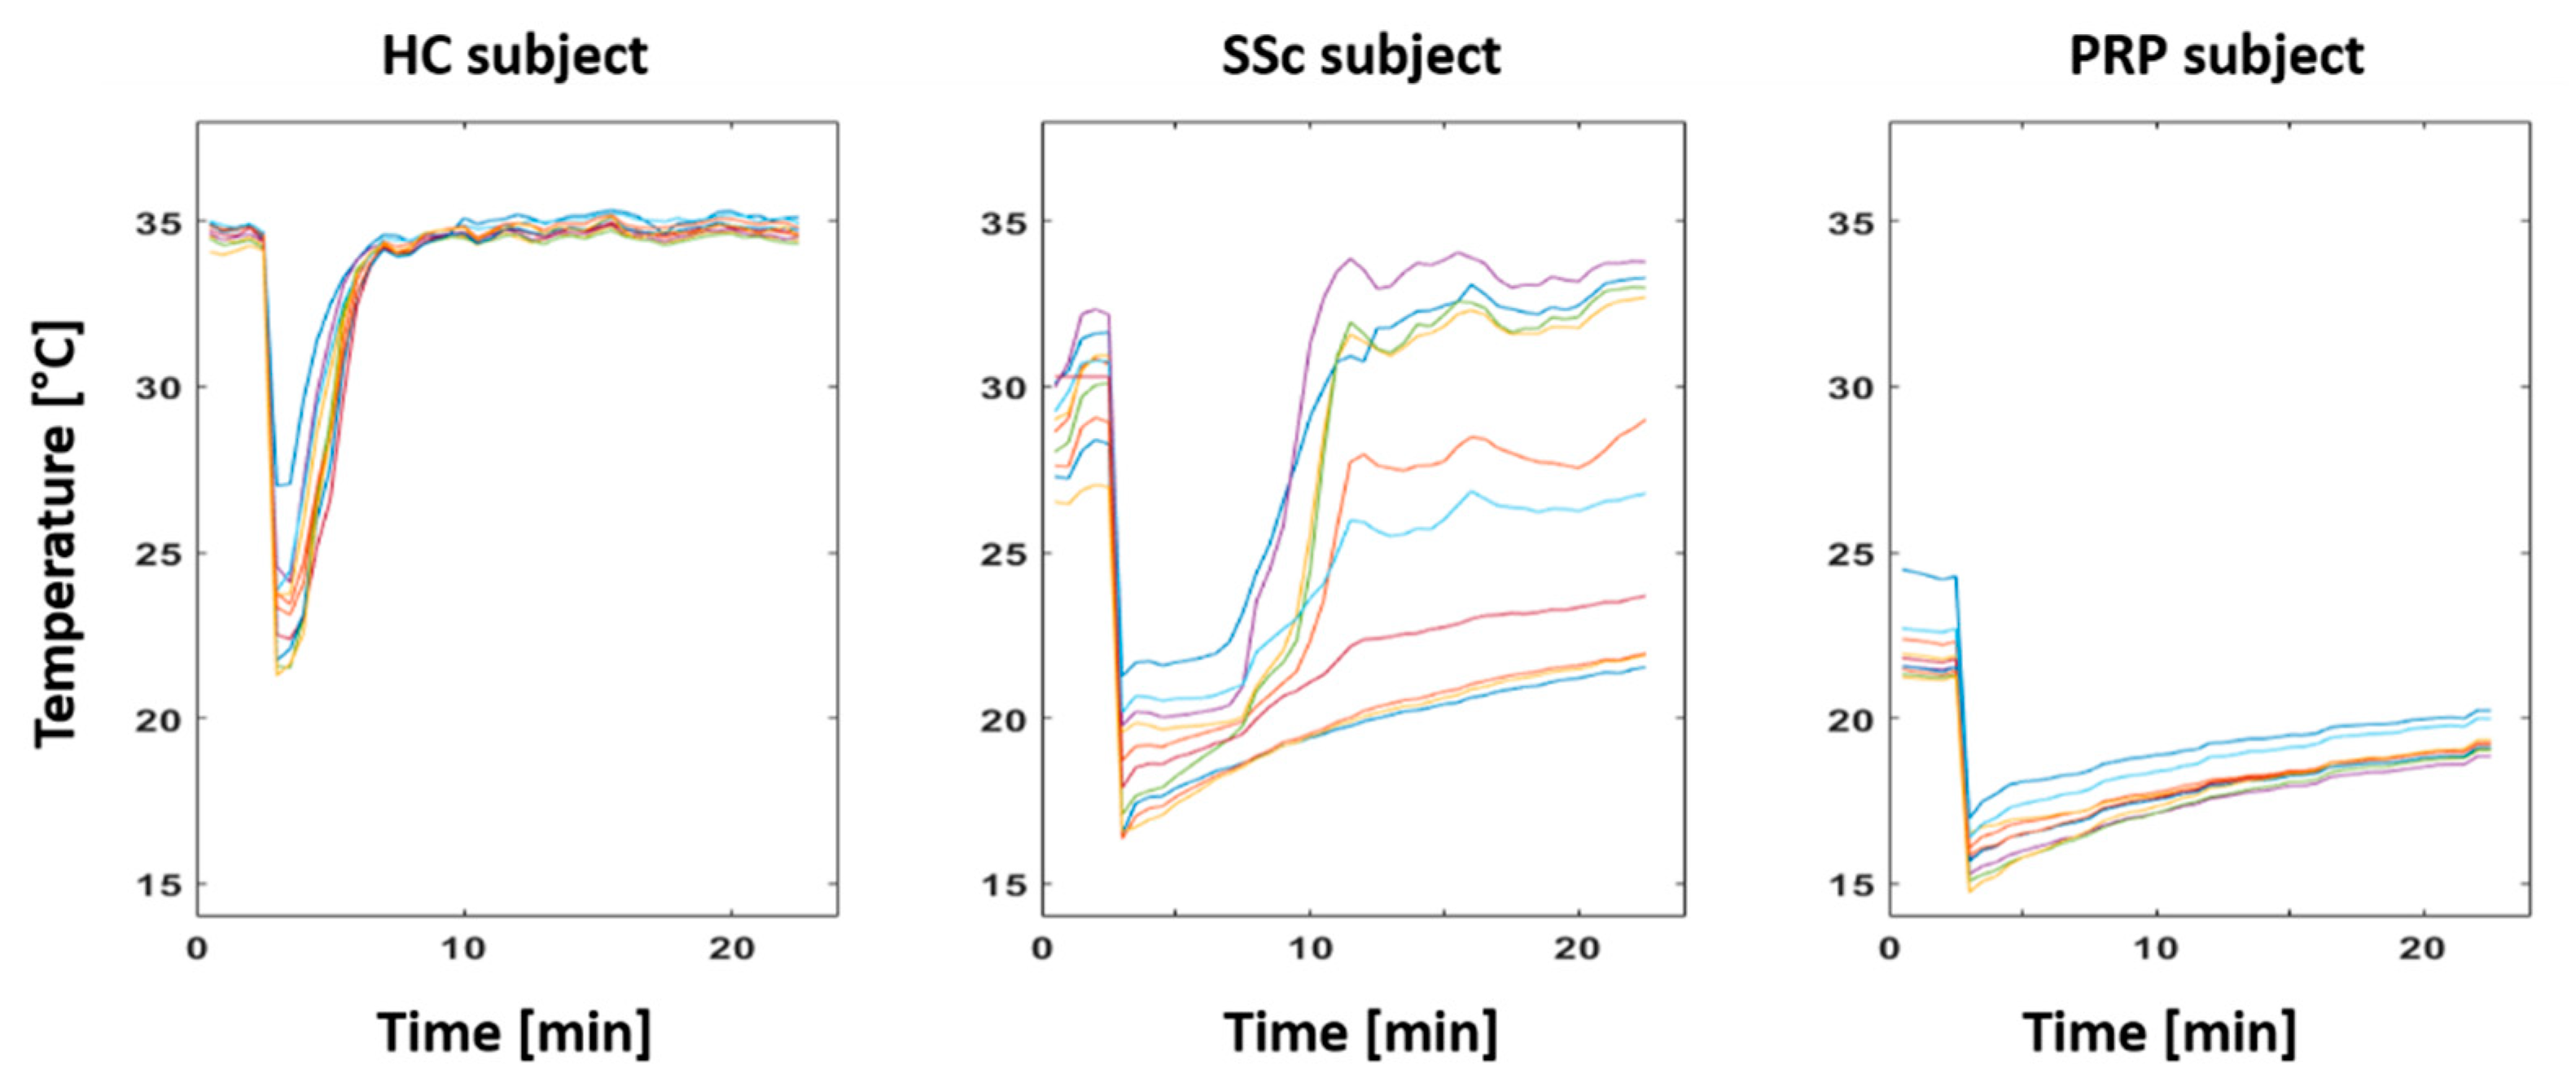
The feature-based analysis on the CCP data was performed by extracting features of interest from the fingers’ temperature trend. Such a trend was obtained by averaging the temperatures of the selected regions of interest (see Figure 2) throughout the experiment. The temperature time courses of each finger of a representative HC, SSc, and PRP participant are shown in Figure 6.
The extracted temperature data were then normalized by subtracting the average value of the entire dataset. The features identified to characterize the dynamic response of the finger’s temperature to the cold challenge were the following:
  • Delay time: the time required for the finger’s temperature after the cold challenge to reach 50% of its final value (i.e., the recovery temperature after 20 min from the cold stress).
  • Rise time: the time required for the finger’s temperature to rise from 10% to 90% of its final value.
  • Recovery time: time required for the finger’s temperature to reach the 68% of the difference value between the baseline temperature and the temperature soon after the cold challenge.
  • Steady state error: the difference between the baseline temperature value and the final recovery temperature value.
  • Delta: difference between the finger’s temperature on its final recovery point and the temperature soon after the stimulus.
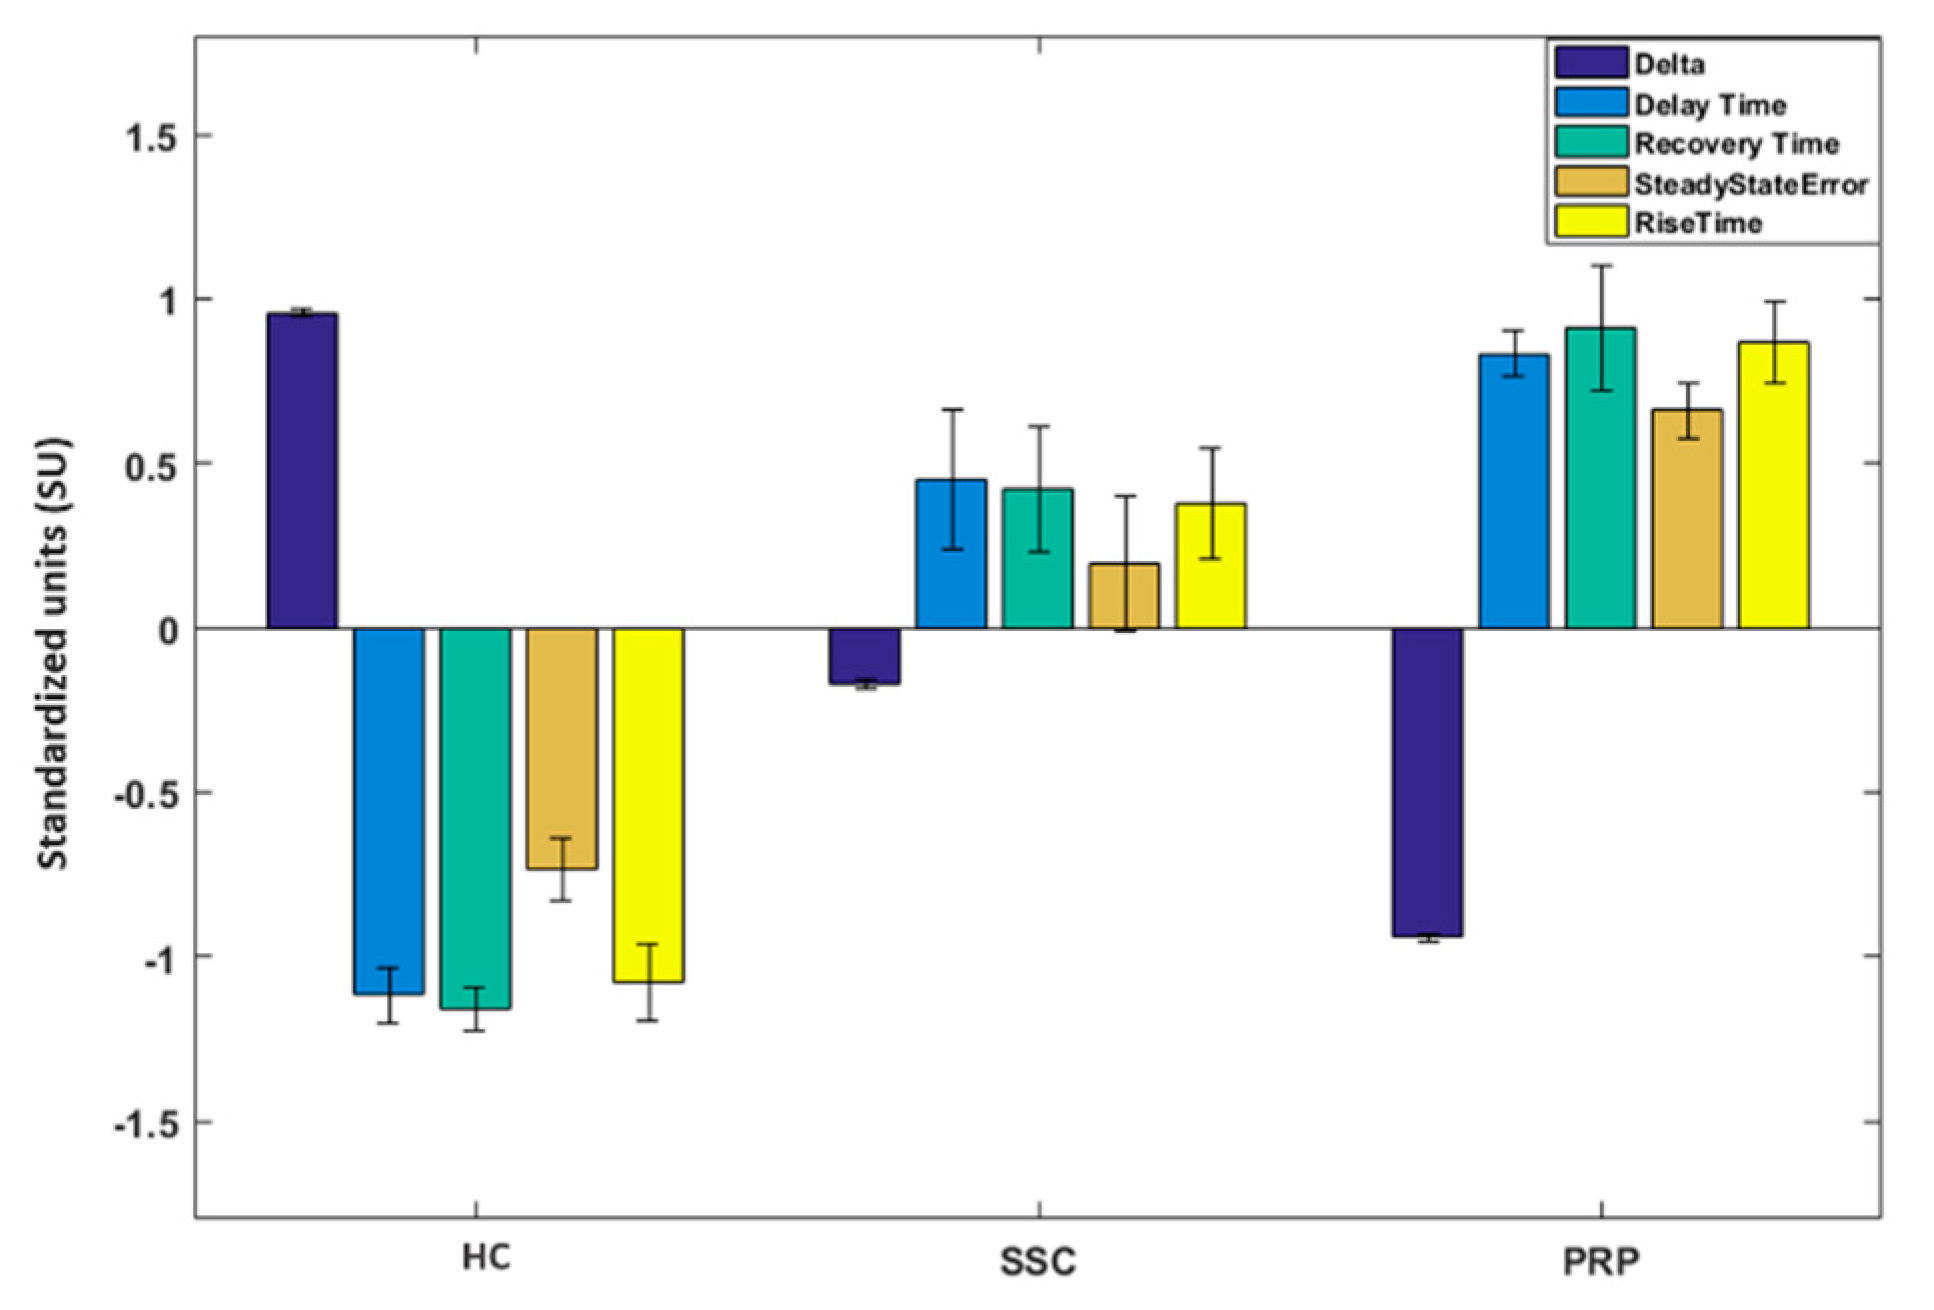
These five features were collected from each of the participants’ fingers, for a total of 50 features per participant. Indeed, these features are commonly used in literature to describe the fingers’ recovery phase from a cold stimulus [13,19,48] in PR patients. The group mean of all the features averaged among fingers and the related standard deviation are reported in Figure 7. These features were z-score normalized and used as input to the SVC, which was preformed to classify HC, SSc, and PRP participants. The SVC was implemented using RBF as a kernel function with γ = 1/50, and the same hyperparameters were employed for the baseline classification.

3. Results

3.1. Baseline Results

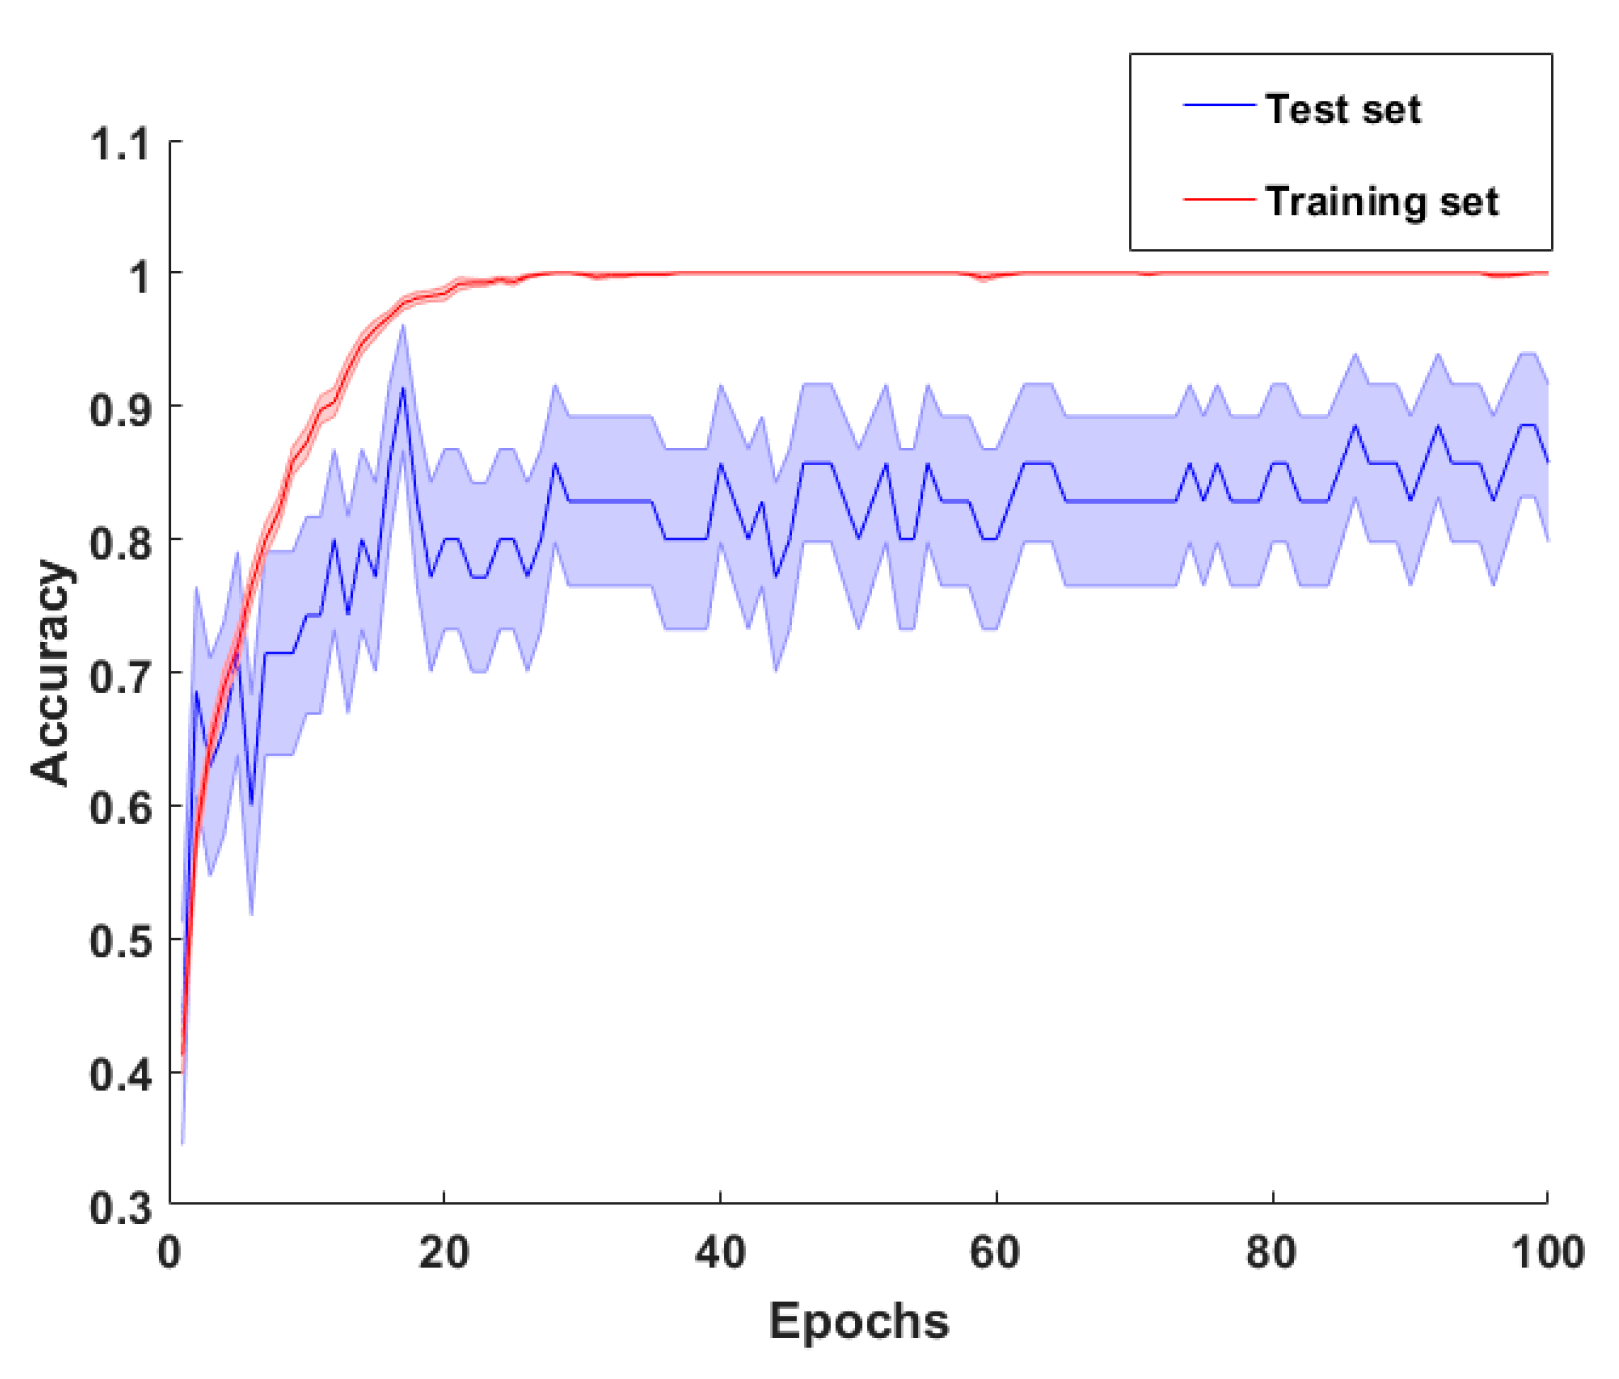
The DCNN average accuracy and the related standard error are reported in Figure 8 as a function of the training epoch for training and the testing set, respectively. No overfitting effect (decrease of the accuracy at increasing epoch) is visible in the testing set, proving the efficacy of the employed procedure. The DCNN accuracy in the test sample reached a plateau value of 0.84 ± 0.05 and a maximum value of 0.91 ± 0.04.
With respect to the feature-based analysis, performed by using the SVC, an accuracy of 0.77 was obtained. The sensitivity and specificity values for each of the 3 classes analyzed are shown in Table 2.

3.2. CCP Results

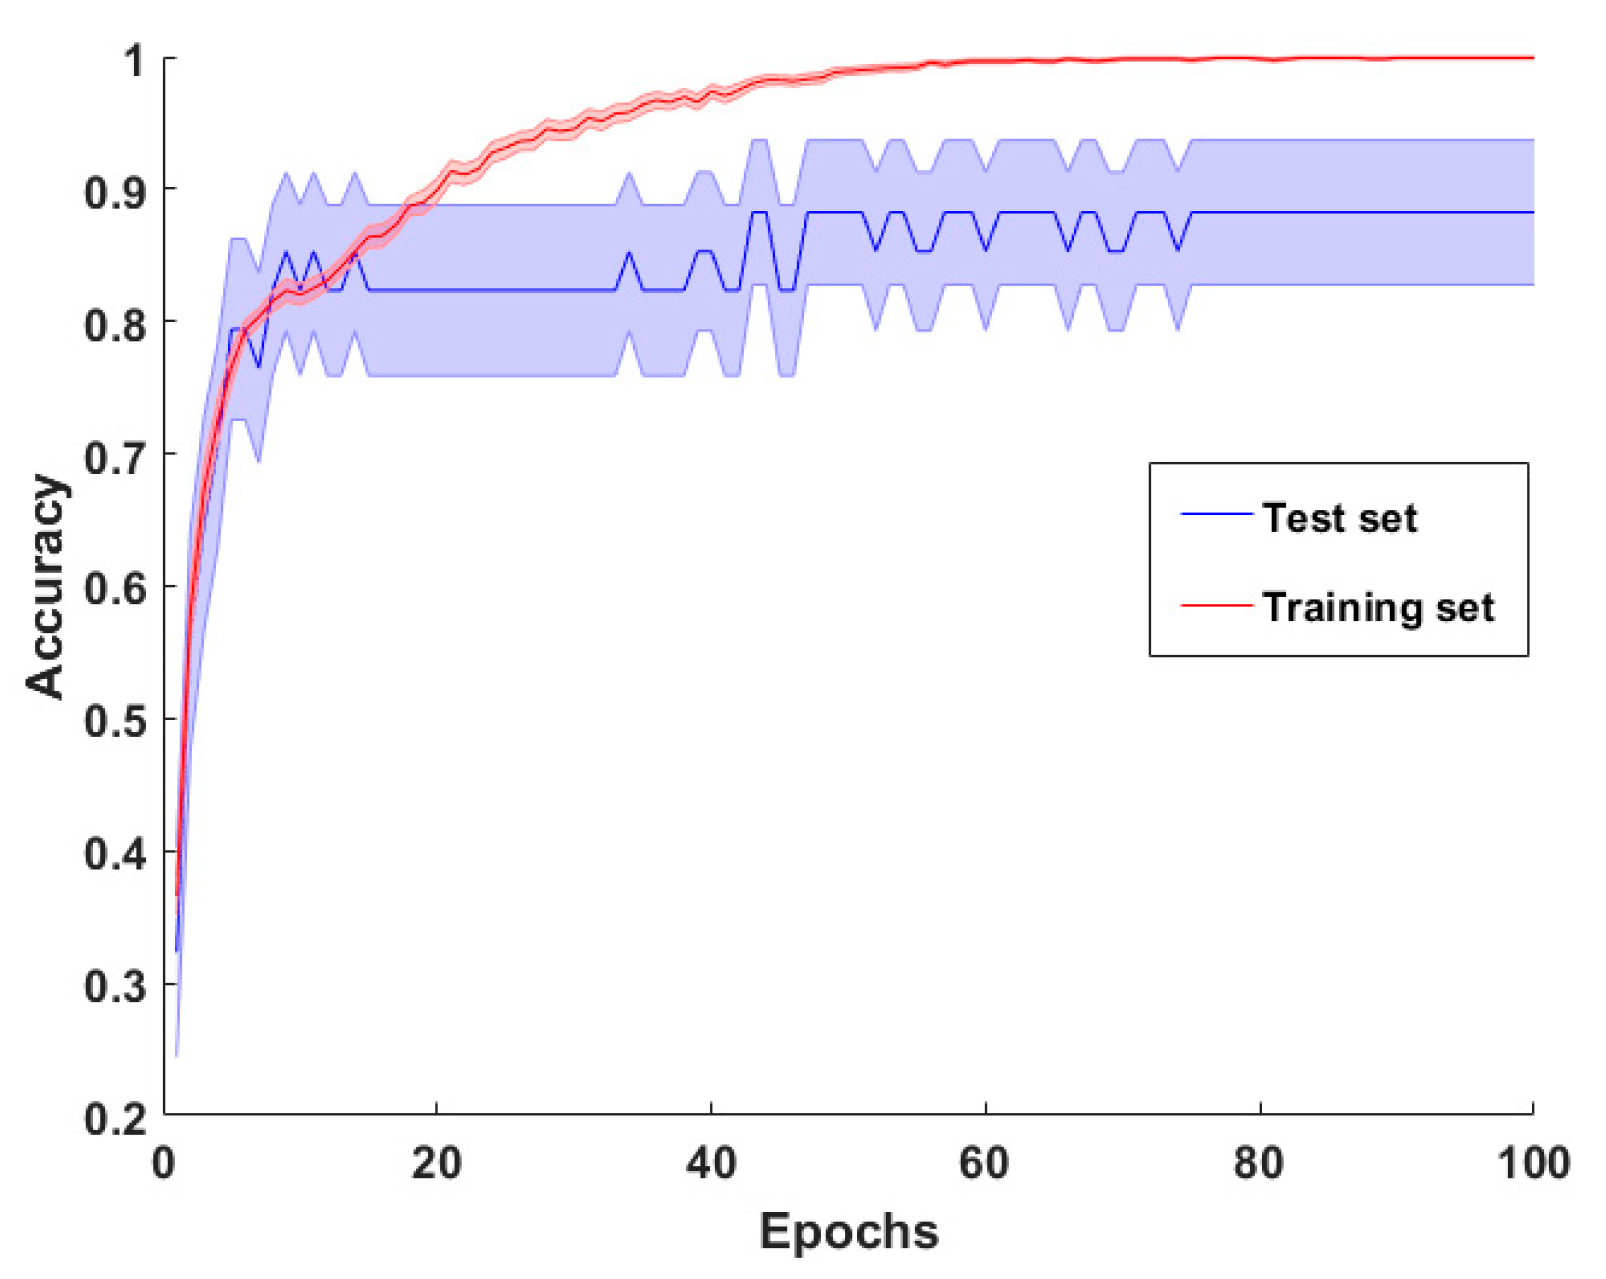
The accuracy trend of the 3D-DCNN model as a function of training epochs for training and test set is reported in Figure 9. The model did not show any overfitting effect. The plateau value of the average accuracy was reached at 0.88 ± 0.05.
The SVC accuracy achieved a value of 0.83. The sensitivity and specificity for each of the three classes analyzed are reported in Table 3 for both the 3D-DCNN and SVC classifiers.

3.3. Baseline vs. CCP Results

To test the statistical significance of the differences in the classifier performances, a McNemar–Bowker test was performed on the classifiers’ prediction outcome [49]. Indeed, whereas McNemar’s test requires that there are only two possible categories for each classification outcome to be tested, in the McNemar–Bowker test the outcome analyzed can be classified in more than two classes. No statistical difference was found between the classifiers’ performance in the two experimental procedures (i.e., baseline vs. CCP). In detail, both comparisons between the DCNN and the 3D-DCNN performance and between the baseline SVC and the CCP SVC performance were found not significant (B = 2, df = 3, p = n.s. and B = 0.8, df = 3, p = n.s, respectively).
Within the procedures, the difference between the performances of the machine learning approaches employed were also tested and no statistically significant difference was reported. In detail, both comparisons between the DCNN and the SVC performance in the baseline condition (B = 0.6, df = 3, p = n.s.) and between the 3D-DCNN and the SVC in CCP (B = 2.7, df = 3, p = n.s.) were not significant. The overall performance metrics of both classifiers in both procedures are shown in Table 4.

4. Discussion

RP is associated with characteristic abnormalities in the function and morphology of the vasculature, which can result in irreversible digital ischemia. Although RP is usually idiopathic (PRP), it can occur as part of an underlying disorder such as in SSc. The condition of vasoconstriction of PRP or SSc require different clinical treatments. It is therefore important to develop reliable methods able to differentiate between a PRP patient and an RP secondary to SSc patient with high specificity. To this end, thermal IR imaging has been widely used as a support to clinical diagnosis. However, the thermographic protocols often incorporate some form of a temperature challenge, usually cold, and need to be performed by an experienced operator. In this study, a completely automated methodology was developed to differentiate SSc from PRP patients by relying uniquely on IR images of the hands acquired at rest. The outcome of such an automated procedure was compared to those obtained with procedures involving the cold challenge and manual selection of the features. No statistically significant differences were found in the comparison, thus favoring the automated procedure performed at basal condition. The differences found between the classes of participants, and the procedures adopted are detailed in the following subsections.

4.1. Thermoregulatory Difference between Classes

Thermoregulation is a complex mechanism that is mostly regulated by the autonomic nervous system. Specifically, sympathetic cholinergic nerves mediate the cutaneous vasodilation in response to whole-body heating, whereas noradrenergic nerves are involved in the cutaneous vasoconstriction during whole-body cooling [50]. Concerning localized stimuli, skin warming induces cutaneous vascular responses due to temperature-sensitive afferent neurons and nitric oxide, whereas local cutaneous vasoconstriction in response to direct cooling of the skin is due to sensory and sympathetic noradrenergic nerves and non-neural mechanisms [50]. The thermal responses of an HC, PRP, and SSc participant’s hands to a cold challenge are shown in Figure 6.
PRP is associated with abnormal responses to the environmental temperature and activity (i.e., vasospasm) related to vessels’ diseases [51]. Typically, PRP produces symmetrical ischemia lasting 15–20 min, involving both hands with a more sensitive finger. Patients with PRP usually exhibit mild episodes that do not hamper daily activities and generally improve with aging [52,53], whereas SSc patients are affected by intense and frequent ischemic events, associated with ulcers in 25–39% of cases [54,55].
SSc’s vascular reactivity and occlusive disease are related to a complex interaction between endothelial cells, smooth muscle cells, the extracellular matrix, and intravascular circulating factors [51]. The impairment of the endothelium induces overproduction of the vasoconstrictor endothelin-1 and underproduction of the vasodilator nitric oxide and prostacyclin. The diminished production of vasodilatory neuropeptides together with an over-regulation of the vascular smooth muscle adrenoreceptor (α2c-AR), leads to an abnormal vasoconstrictive response to stress or cold stimuli. Moreover, severe vasospasms induce repeated episodes of vasoconstriction, provoking occlusion of the microcirculation and injuries [56].
The findings of the present study further confirm the capability of thermal IR imaging to provide information regarding the physiology of the superficial blood circulation [57]. Moreover, the good classification performance obtained using images acquired at rest demonstrated that the vascular impairment associated to RP and SSc generated peculiar superficial temperature distribution of the hands even in the absence of an ongoing bout of the disease.

4.2. Comparisons with Previous Studies and Discussion on Machine Learning Results

Several research studies focused on the development of reliable methods able to differentiate between PRP patients and RP secondary to SSc patients with high specificity. Since changes in temperature pattern of the finger and toes are a clinical manifestation of RP, the evaluation of the finger thermoregulatory impairment is essential to detect the presence of the disease and to differentiate the two forms of this disorder. To this end, thermal IR imaging has been widely used as a support to clinical diagnosis. However, the thermographic protocols often incorporate some form of temperature challenge, usually cold, and need to be performed by an experienced operator. For instance, de Campos et al. employed thermal IR imaging together with cold stress procedure to classify RP patients [58]. The authors used a linear discriminant analysis as a classification method. The best result obtained on the classification of RP, in primary and secondary reached an accuracy of 0.80. Ismail et al., performed RP classification through the use of thermal IR imaging and cold challenge procedure [19]. The overall classification outcome of 0.87 of correctly classified participants was achieved by employing a multiple logistic regression algorithm followed by a receiver operating characteristic curve analysis. Moreover, studies such as Viana et al., demonstrated a statistically significant difference between the thermal IR time course of RP patients versus healthy ones during the recovery from a cold challenge [59]. Similar results were obtained in [2,60]. Recent studies explored the possibility to classify RP patients based on their hands’ temperature in baseline condition [61,62]. Horikoshi et al. demonstrated that the baseline nail fold temperature was significantly lower in RP patients than in controls [48]. Martini et al., proved that at baseline, higher temperatures at the distal interphalangeal joint and lower temperatures at metacarpophalangeal joints were observed in PRP compared to the secondary RP [61]. A considerable step forward would be the implementation of a completely automated procedure to avoid the use of a cold challenge and limit human intervention. To these aims, an automated data-driven DCNNs classifier that allows differentiation among PRP, SSc, and HC based on their hands’ baseline IR image is presented in this study. The classifier’s performance was compared to those of a feature-based approach. In addition, the DCNN model for IR images at rest was compared to a 3D-DCNN model fed with the hands’ IR images acquired during the whole CCP. Each implemented model was cross-checked for performances evaluation.
Regarding the basal condition, the DCNN implemented was able to classify PRP, SSc, and HC with a high degree of accuracy, i.e., an overall accuracy of 0.84, an overall sensitivity of 0.83, and specificity of 0.91. On the other hand, the feature-based approaches achieved an overall accuracy of 0.77, sensitivity of 0.77, and specificity of 0.88. With respect to the CCP, the 3D-DCNN model was able to classify PRP, SSc, and HC with an overall accuracy of 0.88, sensitivity of 0.88, and specificity of 0.94, whereas the SVC delivered a classification with an overall accuracy of 0.83, a sensitivity of 0.80, and specificity of 0.90. An investigatory analysis of the feature maps resulting from the convolutional layers (Figure 3 and Figure 5) permits an insight on the feature extraction process performed by the DCNN and 3D-DCNN models. Both models seem to focus on the difference among fingers and dorsum temperature highlighting those fingers where the difference is smaller to differentiate between HC, SSc, and PRP participants.
Although the accuracy of the classification performed on the IR imaging recorded during CCP was better than the accuracy achieved by classifying baseline IR images only, the differences were not statistically significant. This result highlights the importance of the baseline temperature as a stable physiological variable that might provide insight into the etiology of RP. Most importantly, it provides a valid, pioneering solution for differentiating PRP, SSc, and HC with performance comparable to those reported in literature but in a completely automated way and without requiring the administration of a cold challenge.
With respect to the machine learning algorithms used in this study, even though no significant difference was found between DCNN and SVC accuracy, DCNN provided better performance and was much more agile. Indeed, manually identifying and extracting features can be time consuming as well as being influenced by human errors. Moreover, the use of the DCNN model for baseline IR images classification would avoid the need for a standardized protocol, as it would only require the acquisition of a single IR image during rest condition.

4.3. Study’s Limitations and Future Directions

Finally, it is worth mentioning that despite the very promising results, the low sample size can be considered a limitation of the study. In fact, the classification outcome, might increase its performance with a larger study sample, relying it on a multivariate analysis approach. Although the sample size of the study could be considered rather small, the classification was performed implementing a leave-one-out cross-validation procedure, thus basically evaluating the out-of-sample performance. Hence, the results obtained are indeed generalizable. Increasing the sample numerosity may produce a further improvement of the classifier’s performance by decreasing a possible in-sample overfitting issue. Moreover, a larger sample size will allow analyzing the effect of gender and age on the classification performance. Indeed, such factors affect the skin vasoconstriction /vasodilation capacity. Therefore, a future purpose is to validate the technique on a larger sample of participants. Furthermore, the recent introduction of low-cost IR cameras can increase the availability of thermal IR imaging. Considerations on the use of such low-cost thermal technology for RP patients classification are already addressed in the literature [62,63]. In addition, the introduction of such an automated procedure based on the recording of a single IR image of the hands at rest, will possibly overcome the implementation difficulties referred to by Maverakis et al. [64]. Besides, it is likely that thermography may become more widely used given the increased accessibility of the equipment. Both these aspects could pave the way toward the application of the proposed model in everyday clinical practice. However, in this perspective, it is worth noticing that during thermal imaging measurements, the environmental conditions must be controlled and standardized as much as possible to minimize physiological variability.

5. Conclusions

In this study, an innovative automatic procedure to differentiate PRP from SSc and HC based on machine learning algorithms and IR images of the hands was presented. Different classification procedures were compared, involving the use or not of a cold challenge and the manual or automated features selection. The results revealed that the use of a cold challenge did not statistically improve the classification accuracy and that an automated feature selection approach performed better than the manual ones. Indeed, this study demonstrated that, by employing a DCNN model and IR images of the hands in basal condition, it is possible to achieve high level of accuracy and specificity in the differentiation among PRP, SSc, and HC. This approach allowed for overcoming issues related to the administration of a cold stimulus to the patients, as well as to avoid biases in the classification introduced by the operator, thus representing a great improvement with respect to the standard procedure. However, due to the limited sample size, this study is intended to provide evidence of the feasibility of such an automated approach. Further studies are needed to corroborate the results on a large-scale population. Although in literature it is reported that thermographic examinations are useful for differentiating secondary RP, such as SSc, from PRP, to the best of our knowledge this is the first study employing such an automated approach for this task. Finally, the implemented model, together with the recent introduction of low-cost thermal systems, can provide a new, quick, automated, and accurate classification method suitable for everyday clinical practice environment.

Author Contributions

Conceptualization, A.M., P.A., and C.F.; methodology, A.M., P.A., C.F., D.C., D.P., and A.M.C.; software, C.F.; validation, D.C., D.P., A.M.C., and G.G.; formal analysis, C.F., D.C., D.P., and A.M.C.; investigation, C.F., D.C., D.P., and A.M.C.; resources, A.M., P.A., and G.G.; writing—original draft preparation, C.F., D.C., and D.P.; writing—review and editing, A.M., P.A., G.G., and A.M.C.; supervision, A.M., P.A., and G.G.; project administration, A.M. All authors have read and agreed to the published version of the manuscript.

Funding

This research received no external funding.

Institutional Review Board Statement

The study was conducted according to the guidelines of the Declaration of Helsinki and approved by the Institutional Review Board and Local Ethical Committee of the School of Medicine of the University of Chieti-Pescara (protocol code AC052514 12/07/2016).

Informed Consent Statement

Informed consent was obtained from all participants involved in the study. Written informed consent has been obtained from the patients to publish this paper.

Data Availability Statement

The data presented in this study are available on request from the corresponding author. The data are not publicly available due to privacy issues.

Conflicts of Interest

The authors declare no conflict of interest. The funders had no role in the design of the study; in the collection, analyses, or interpretation of data; in the writing of the manuscript; or in the decision to publish the results.

References

  1. Prete, M.; Fatone, M.C.; Favoino, E.; Perosa, F. Raynaud’s Phenomenon: From Molecular Pathogenesis to Therapy. Autoimmun. Rev. 2014, 13, 655–667. [Google Scholar] [CrossRef]
  2. Mariotti, A.; Grossi, G.; Amerio, P.; Orlando, G.; Mattei, P.A.; Tulli, A.; Romani, G.L.; Merla, A. Finger Thermoregulatory Model Assessing Functional Impairment in Raynaud’s Phenomenon. Ann. Biomed. Eng. 2009, 37, 2631–2639. [Google Scholar] [CrossRef]
  3. Ruaro, B.; Smith, V.; Sulli, A.; Pizzorni, C.; Tardito, S.; Patané, M.; Paolino, S.; Cutolo, M. Innovations in the Assessment of Primary and Secondary Raynaud’s Phenomenon. Front. Pharmacol. 2019, 10. [Google Scholar] [CrossRef]
  4. Maricq, H.R.; Carpentier, P.H.; Weinrich, M.C.; Keil, J.E.; Palesch, Y.; Biro, C.; Vionnet-Fuasset, M.; Jiguet, M.; Valter, I. Geographic Variation in the Prevalence of Raynaud’s Phenomenon: A 5 Region Comparison. J. Rheumatol. 1997, 24, 879–889. [Google Scholar]
  5. Hughes, M.; Allanore, Y.; Chung, L.; Pauling, J.D.; Denton, C.P.; Matucci-Cerinic, M. Raynaud Phenomenon and Digital Ulcers in Systemic Sclerosis. Nat. Rev. Rheumatol. 2020, 16, 208–221. [Google Scholar] [CrossRef] [PubMed]
  6. Herrick, A.L. The Pathogenesis, Diagnosis and Treatment of Raynaud Phenomenon. Nat. Rev. Rheumatol. 2012, 8, 469–479. [Google Scholar] [CrossRef]
  7. Kahaleh, M.B. Raynaud Phenomenon and the Vascular Disease in Scleroderma. Curr. Opin. Rheumatol. 2004, 16, 718–722. [Google Scholar] [CrossRef]
  8. Abraham, D.J.; Varga, J. Scleroderma: From Cell and Molecular Mechanisms to Disease Models. Trends Immunol. 2005, 26, 587–595. [Google Scholar] [CrossRef]
  9. Pauling, J.D.; Domsic, R.T.; Saketkoo, L.A.; Almeida, C.; Withey, J.; Jay, H.; Frech, T.M.; Ingegnoli, F.; Dures, E.; Robson, J.; et al. Multinational Qualitative Research Study Exploring the Patient Experience of Raynaud’s Phenomenon in Systemic Sclerosis. Arthritis Care Res. 2018, 70, 1373–1384. [Google Scholar] [CrossRef] [PubMed]
  10. Walker, U.A.; Tyndall, A.; Czirják, L.; Denton, C.; Farge-Bancel, D.; Kowal-Bielecka, O.; Müller-Ladner, U.; Bocelli-Tyndall, C.; Matucci-Cerinic, M. Clinical Risk Assessment of Organ Manifestations in Systemic Sclerosis: A Report from the EULAR Scleroderma Trials and Research Group Database. Ann. Rheum. Dis. 2007, 66, 754–763. [Google Scholar] [CrossRef] [Green Version]
  11. Matucci-Cerinic, M.; Kahaleh, B.; Wigley, F.M. Evidence That Systemic Sclerosis Is a Vascular Disease. Arthritis Rheum. 2013, 65, 1953–1962. [Google Scholar] [CrossRef] [PubMed]
  12. McMahan, Z.H.; Wigley, F.M. Raynaud’s Phenomenon and Digital Ischemia: A Practical Approach to Risk Stratification, Diagnosis and Management. Int. J. Clin. Rheumtol. 2010, 5, 355–370. [Google Scholar] [CrossRef]
  13. Merla, A.; Donato, L.D.; Luzio, S.D.; Farina, G.; Pisarri, S.; Proietti, M.; Salsano, F.; Romani, G.L. Infrared Functional Imaging Applied to Raynaud’s Phenomenon. IEEE Eng. Med. Biol. Mag. 2002, 21, 73–79. [Google Scholar] [CrossRef]
  14. Sousa, E.; Vardasca, R.; Teixeira, S.; Seixas, A.; Mendes, J.; Costa-Ferreira, A. A Review on the Application of Medical Infrared Thermal Imaging in Hands. Infrared Phys. Technol. 2017, 85, 315–323. [Google Scholar] [CrossRef]
  15. Quesada, J.I.P. Application of Infrared Thermography in Sports Science; Springer: Berlin, Germany, 2017; ISBN 3-319-47409-X. [Google Scholar]
  16. Perpetuini, D.; Filippini, C.; Cardone, D.; Merla, A. An Overview of Thermal Infrared Imaging-Based Screenings during Pandemic Emergencies. Int. J. Environ. Res. Public Health 2021, 18, 3286. [Google Scholar] [CrossRef] [PubMed]
  17. Filippini, C.; Perpetuini, D.; Cardone, D.; Chiarelli, A.M.; Merla, A. Thermal Infrared Imaging-Based Affective Computing and Its Application to Facilitate Human Robot Interaction: A Review. Appl. Sci. 2020, 10, 2924. [Google Scholar] [CrossRef]
  18. Filippini, C.; Spadolini, E.; Cardone, D.; Bianchi, D.; Preziuso, M.; Sciarretta, C.; del Cimmuto, V.; Lisciani, D.; Merla, A. Facilitating the Child–Robot Interaction by Endowing the Robot with the Capability of Understanding the Child Engagement: The Case of Mio Amico Robot. Int. J. Soc. Robot. 2020, 1–13. [Google Scholar] [CrossRef]
  19. Ismail, E.; Orlando, G.; Corradini, M.L.; Amerio, P.; Romani, G.L.; Merla, A. Differential Diagnosis of Raynaud’s Phenomenon Based on Modeling of Finger Thermoregulation. Phys. Meas. 2014, 35, 703. [Google Scholar] [CrossRef]
  20. Chand, G.; Ali, M.; Barmada, B.; Liesaputra, V.; Ramirez-Prado, G. Tracking a Person’s Behaviour in a Smart House. In Proceedings of the International Conference on Service-Oriented Computing; Springer: Cham, Switzerland, 2018; pp. 241–252. [Google Scholar]
  21. Cardone, D.; Perpetuini, D.; Filippini, C.; Spadolini, E.; Mancini, L.; Chiarelli, A.M.; Merla, A. Driver Stress State Evaluation by Means of Thermal Imaging: A Supervised Machine Learning Approach Based on ECG Signal. Appl. Sci. 2020, 10, 5673. [Google Scholar] [CrossRef]
  22. Paszkiel, S. Using neural networks for classification of the changes in the EEG signal based on facial expressions. In Analysis and Classification of EEG Signals for Brain–Computer Interfaces; Springer: Cham, Switzerland, 2020; pp. 41–69. [Google Scholar]
  23. Paszkiel, S. Analysis and Classification of EEG Signals for Brain-Computer Interfaces; Springer: Berlin, Germany, 2020; ISBN 3-030-30580-5. [Google Scholar]
  24. Filippini, C.; Perpetuini, D.; Cardone, D.; Chiarelli, A.M.; Merla, A. Thermal Infrared Imaging and Artificial Intelligence Techniques Can Support Mild Alzheimer Disease Diagnosis; CEUR Workshop Proceedings: Aachen, Germany, 2020; Volume 2804, pp. 31–39. [Google Scholar]
  25. Perpetuini, D.; Chiarelli, A.M.; Filippini, C.; Cardone, D.; Croce, P.; Rotunno, L.; Anzoletti, N.; Zito, M.; Zappasodi, F.; Merla, A. Working Memory Decline in Alzheimer’s Disease Is Detected by Complexity Analysis of Multimodal EEG-FNIRS. Entropy 2020, 22, 1380. [Google Scholar] [CrossRef]
  26. Bikmukhametov, T.; Jäschke, J. Combining Machine Learning and Process Engineering Physics towards Enhanced Accuracy and Explainability of Data-Driven Models. Comput. Chem. Eng. 2020, 138, 106834. [Google Scholar] [CrossRef]
  27. Shang, C.; You, F. Data Analytics and Machine Learning for Smart Process Manufacturing: Recent Advances and Perspectives in the Big Data Era. Engineering 2019, 5, 1010–1016. [Google Scholar] [CrossRef]
  28. Rawat, W.; Wang, Z. Deep Convolutional Neural Networks for Image Classification: A Comprehensive Review. Neural Comput. 2017, 29, 2352–2449. [Google Scholar] [CrossRef] [PubMed]
  29. Khan, A.; Sohail, A.; Zahoora, U.; Qureshi, A.S. A Survey of the Recent Architectures of Deep Convolutional Neural Networks. Artif. Intell. Rev. 2020, 53, 5455–5516. [Google Scholar] [CrossRef] [Green Version]
  30. Hecht-Nielsen, R.I. 3-Theory of the Backpropagation Neural Network. In Neural Networks for Perception; Academic Press: Cambridge, MA, USA, 1992; pp. 65–93. [Google Scholar]
  31. Ronneberger, O.; Fischer, P.; Brox, T. U-Net: Convolutional Networks for Biomedical Image Segmentation. In Proceedings of the International Conference on Medical Image Computing and Computer-Assisted Intervention; Springer: Berlin, Germany, 2015; pp. 234–241. [Google Scholar]
  32. Li, Q.; Cai, W.; Wang, X.; Zhou, Y.; Feng, D.D.; Chen, M. Medical Image Classification with Convolutional Neural Network. In Proceedings of the 13th International Conference on Control Automation Robotics & Vision (ICARCV), Singapore, 10–12 December 2014; IEEE: Washington, DC, USA, 2014; pp. 844–848. [Google Scholar]
  33. World Medical Association Declaration of Helsinki. Recommendations Guiding Physicians in Biomedical Research Involving Human Subjects. JAMA 1997, 277, 925–926. [Google Scholar] [CrossRef]
  34. Van Den Hoogen, F.; Khanna, D.; Fransen, J.; Johnson, S.R.; Baron, M.; Tyndall, A.; Matucci-Cerinic, M.; Naden, R.P.; Medsger, T.A., Jr.; Carreira, P.E. 2013 Classification Criteria for Systemic Sclerosis: An American College of Rheumatology/European League against Rheumatism Collaborative Initiative. Arthritis Rheum. 2013, 65, 2737–2747. [Google Scholar] [CrossRef] [Green Version]
  35. Le Roy, E.C.; Medsger, T.A. Criteria for the Classification of Early Systemic Sclerosis. J. Rheum. 2001, 28, 1573–1576. [Google Scholar]
  36. Goundry, B.; Bell, L.; Langtree, M.; Moorthy, A. Diagnosis and Management of Raynaud’s Phenomenon. BMJ 2012, 344. [Google Scholar] [CrossRef]
  37. Cardone, D.; Merla, A. New Frontiers for Applications of Thermal Infrared Imaging Devices: Computational Psychopshysiology in the Neurosciences. Sensors 2017, 17, 1042. [Google Scholar] [CrossRef] [Green Version]
  38. Thermology Guidelines, Standards and Protocols in Clinical Thermography Imaging. Available online: https://www.researchgate.net/publication/273755657_Thermology_guidelines_standards_and_protocols_in_clinical_thermography_imaging (accessed on 22 September 2020).
  39. Bernard, V.; Staffa, E.; Mornstein, V.; Bourek, A. Infrared Camera Assessment of Skin Surface Temperature–Effect of Emissivity. Phys. Med. 2013, 29, 583–591. [Google Scholar] [CrossRef] [Green Version]
  40. Moreira, D.G.; Costello, J.T.; Brito, C.J.; Adamczyk, J.G.; Ammer, K.; Bach, A.J.; Costa, C.M.; Eglin, C.; Fernandes, A.A.; Fernández-Cuevas, I. Thermographic Imaging in Sports and Exercise Medicine: A Delphi Study and Consensus Statement on the Measurement of Human Skin Temperature. J. Therm. Biol. 2017, 69, 155–162. [Google Scholar] [CrossRef]
  41. Chiarelli, A.M.; Bianco, F.; Perpetuini, D.; Bucciarelli, V.; Filippini, C.; Cardone, D.; Zappasodi, F.; Gallina, S.; Merla, A. Data-Driven Assessment of Cardiovascular Ageing through Multisite Photoplethysmography and Electrocardiography. Med. Eng. Phys. 2019, 73, 39–50. [Google Scholar] [CrossRef]
  42. Murugan, P.; Durairaj, S. Regularization and Optimization Strategies in Deep Convolutional Neural Network. arXiv 2017, arXiv:1712.04711. [Google Scholar]
  43. Kohavi, R. A Study of Cross-Validation and Bootstrap for Accuracy Estimation and Model Selection. In Proceedings of the International Joint Conference on AI Palais de Congres, Montreal, QC, Canada, 20–25 August 1995; Volume 14, pp. 1137–1145. [Google Scholar]
  44. Shreffler, J.; Huecker, M.R. Diagnostic Testing Accuracy: Sensitivity, Specificity, Predictive Values and Likelihood Ratios. In StatPearls; StatPearls Publishing: Treasure Island, FL, USA, 2020. [Google Scholar]
  45. Ji, S.; Xu, W.; Yang, M.; Yu, K. 3D Convolutional Neural Networks for Human Action Recognition. IEEE Trans. Pattern Anal. Mach. Intell. 2012, 35, 221–231. [Google Scholar] [CrossRef] [Green Version]
  46. Jin, T.; Cui, H.; Zeng, S.; Wang, X. Learning Deep Spatial Lung Features by 3D Convolutional Neural Network for Early Cancer Detection. In Proceedings of the 2017 International Conference on Digital Image Computing: Techniques and Applications (DICTA); IEEE: Washington, DC, USA, 2017; pp. 1–6. [Google Scholar]
  47. Maturana, D.; Scherer, S. Voxnet: A 3d Convolutional Neural Network for Real-Time Object Recognition. In Proceedings of the 2015 IEEE/RSJ International Conference on Intelligent Robots and Systems (IROS); IEEE: Washington, DC, USA, 2015; pp. 922–928. [Google Scholar]
  48. Horikoshi, M.; Inokuma, S.; Kijima, Y.; Kobuna, M.; Miura, Y.; Okada, R.; Kobayashi, S. Thermal Disparity between Fingers after Cold-Water Immersion of Hands: A Useful Indicator of Disturbed Peripheral Circulation in Raynaud Phenomenon Patients. Intern Med. 2016, 55, 461–466. [Google Scholar] [CrossRef] [Green Version]
  49. Lachenbruch, P.A.; Lynch, C.J. Assessing Screening Tests: Extensions of McNemar’s Test. Stat. Med. 1998, 17, 2207–2217. [Google Scholar] [CrossRef]
  50. Kellogg, D.L., Jr. In Vivo Mechanisms of Cutaneous Vasodilation and Vasoconstriction in Humans during Thermoregulatory Challenges. J. Appl. Phys. 2006, 100, 1709–1718. [Google Scholar] [CrossRef] [PubMed]
  51. Wigley, F.M. Vascular Disease in Scleroderma. Clin. Rev. Allergy Immun. 2009, 36, 150–175. [Google Scholar] [CrossRef]
  52. Suter, L.G.; Murabito, J.M.; Felson, D.T.; Fraenkel, L. The Incidence and Natural History of Raynaud’s Phenomenon in the Community. Arthritis Rheum. 2005, 52, 1259–1263. [Google Scholar] [CrossRef]
  53. Carpentier, P.H.; Satger, B.; Poensin, D.; Maricq, H.R. Incidence and Natural History of Raynaud Phenomenon: A Long-Term Follow-up (14 Years) of a Random Sample from the General Population. J. Vasc. Surg. 2006, 44, 1023–1028. [Google Scholar] [CrossRef] [PubMed] [Green Version]
  54. Tiso, F.; Favaro, M.; Ciprian, L.; Cardarelli, S.; Rizzo, M.; Tonello, M.; Ruffatti, A.; Cozzi, F. Digital Ulcers in a Cohort of 333 Scleroderma Patients. Reumatismo 2007, 59, 215–220. [Google Scholar] [CrossRef] [PubMed] [Green Version]
  55. Nihtyanova, S.I.; Brough, G.M.; Black, C.M.; Denton, C.P. Clinical Burden of Digital Vasculopathy in Limited and Diffuse Cutaneous Systemic Sclerosis. Ann. Rheum. Dis. 2008, 67, 120–123. [Google Scholar] [CrossRef]
  56. Guiducci, S.; Giacomelli, R.; Cerinic, M.M. Vascular Complications of Scleroderma. Autoimmun. Rev. 2007, 6, 520–523. [Google Scholar] [CrossRef]
  57. Love, T.J. Thermography as an Indicator of Blood Perfusion. Ann. N. Y. Acad. Sci. 1980, 335, 429–437. [Google Scholar] [CrossRef]
  58. De Campos, M.F.; Ripka, W.L.; Campos, D.; Heimbecher, C.T.; Esmanhoto, E.; Ulbricht, L. Raynaud’s Phenomenon Differentiating After Cold Stress Using Thermal Parameters from Fingers. In Proceedings of the XXVI Brazilian Congress on Biomedical Engineering; Springer: Berlin/Heidelberg, Germany, 2019; pp. 869–874. [Google Scholar]
  59. Viana, J.R.; Campos, D.; Ulbricht, L.; Sato, G.Y.; Ripka, W.L. Thermography for the Detection of Secondary Raynaud’s Phenomenon by Means of the Distal-Dorsal Distance. In Proceedings of the 2020 42nd Annual International Conference of the IEEE Engineering in Medicine & Biology Society (EMBC); IEEE: Washington, DC, USA, 2020; pp. 1528–1531. [Google Scholar]
  60. Lim, M.J.; Kwon, S.R.; Jung, K.-H.; Joo, K.; Park, S.-G.; Park, W. Digital Thermography of the Fingers and Toes in Raynaud’s Phenomenon. J. Korean Med. Sci. 2014, 29, 502. [Google Scholar] [CrossRef] [Green Version]
  61. Martini, G.; Cappella, M.; Culpo, R.; Vittadello, F.; Sprocati, M.; Zulian, F. Infrared Thermography in Children: A Reliable Tool for Differential Diagnosis of Peripheral Microvascular Dysfunction and Raynaud’s Phenomenon? Pediatr. Rheum. 2019, 17, 1–9. [Google Scholar] [CrossRef]
  62. Herrick, A.L.; Murray, A. The Role of Capillaroscopy and Thermography in the Assessment and Management of Raynaud’s Phenomenon. Autoimmun. Rev. 2018, 17, 465–472. [Google Scholar] [CrossRef]
  63. Herrick, A.L.; Dinsdale, G.; Murray, A. New Perspectives in the Imaging of Raynaud’s Phenomenon. Eur. J. Rheum. 2020, 7, S212–S221. [Google Scholar] [CrossRef] [PubMed]
  64. Maverakis, E.; Patel, F.; Kronenberg, D.G.; Chung, L.; Fiorentino, D.; Allanore, Y.; Guiducci, S.; Hesselstrand, R.; Hummers, L.K.; Duong, C.; et al. International Consensus Criteria for the Diagnosis of Raynaud’s Phenomenon. J. Autoimmun. 2014, 48–49, 60–65. [Google Scholar] [CrossRef] [PubMed] [Green Version]
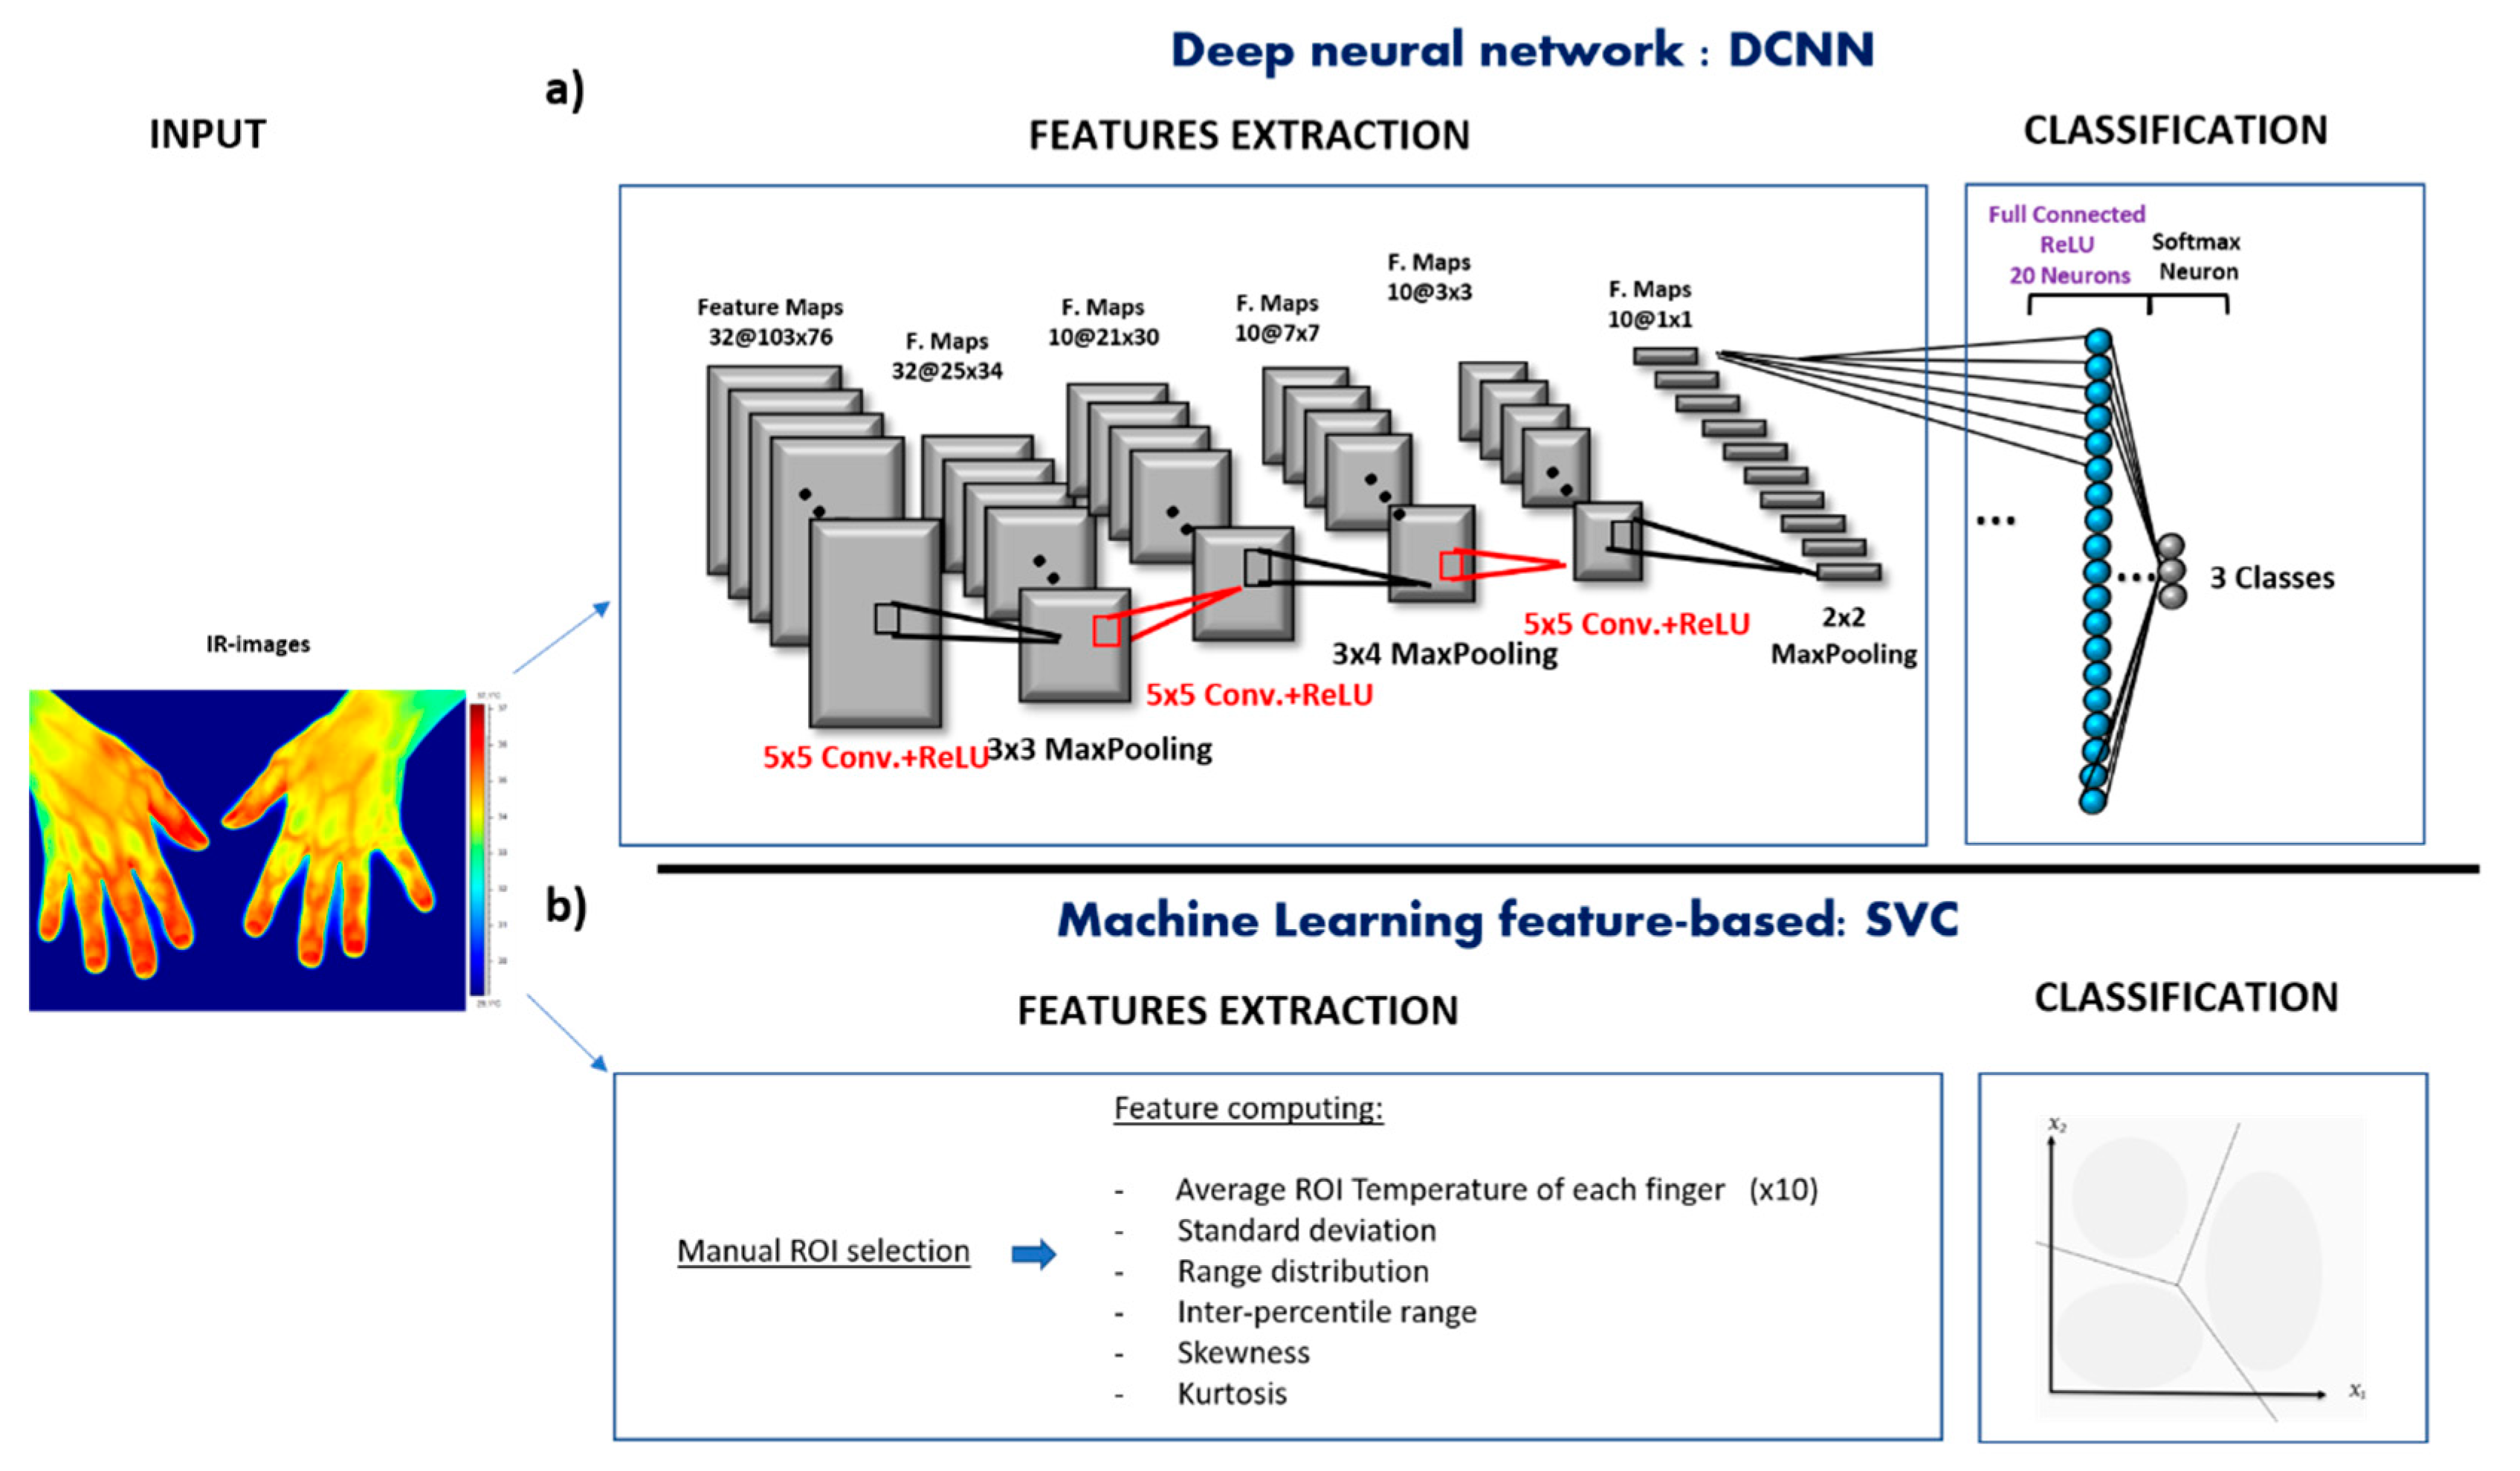
Figure 1. (a) Deep Convolutional Neural Network (DCNN) pipeline, which includes the structure of the convolution building block implemented. (b) Machine learning feature-based algorithm pipeline, which include the features extracted for the baseline analysis.
Applsci 11 03614 g001
Figure 2. Raw thermal IR image of a representative healthy participant within the dataset. Black circles represent the regions of interest manually selected.
Applsci 11 03614 g002
Figure 3. Deep Convolutional Neural Network (DCNN) feature maps. (a) Input image of a representative healthy participant within the dataset together with the features map resulting from the first two convolutional layers (s.u. = standardized units). (b) Input image of a representative systemic sclerosis (SSc) participant within the dataset and the features map resulting from the first two convolutional layers. (c) Input image of a representative primary Raynaud’s phenomenon (PRP) participant within the dataset and the features map resulting from the first two convolutional layers. The images’ axes units represent the images’ pixels number.
Applsci 11 03614 g003
Figure 4. Group average values and the related standard deviation of each feature z-score normalized. The measurement units reported on the y-axis are the standardize units since the features shown are z-score normalized.
Applsci 11 03614 g004
Figure 5. 3-Dimensional Deep Convolutional Neural Network (3D-DCNN) feature maps. (a) Batch of input images representative of the cold challenges procedure (CCP) data of a healthy participant randomly chosen, together with the features map resulting from the first two 3D-convolutional layers. (b) Batch of input images of a systemic sclerosis (SSc) participant randomly chosen, and the related features map resulting from the first two 3D-convolutional layers. (c) Batch of input images of a primary Raynaud’s phenomenon (PRP) participant randomly chosen, and the related features map resulting from the first two 3D-convolutional layers.
Applsci 11 03614 g005
Figure 6. Time courses of the 10 fingers’ thermal recovery after the cold challenge in healthy control (HC), systemic sclerosis (SSc), and primary Raynaud’s phenomenon (PRP) representative participants.
Applsci 11 03614 g006
Figure 7. Group average values and the related standard deviation of each feature (z-score normalized) employed for the cold challenge procedure (CCP) analysis. The measurement units are reported as standardized units since the features shown are z-score normalized.
Applsci 11 03614 g007
Figure 8. DCNN average (and related standard error) cross-validated accuracy as a function of the training epoch for the training and the testing set, respectively.
Applsci 11 03614 g008
Figure 9. 3D-DCNN average (and related standard error) cross-validated accuracy as a function of the training epoch for the training and the testing set, respectively.
Applsci 11 03614 g009
Table 1. Physical characteristics of the participants.
GroupSex (Female/Male)Age (Avg ± std, Years)Body Mass (Avg ± std, Kg)Physically Active (%)
HC7/648.5 ± 11.161.8 ± 5.942%
PRP5/652.2 ± 10.364.5 ± 5.538%
SSc5/750.8 ± 11.662.3 ± 6.235%
Table 2. Sensitivity and specificity of DCNN and SVC models on HC, SSc, and PRP participants’ classification.
DCNNSVC
ClassesSensitivity Specificity Sensitivity Specificity
HC 0.840.910.840.83
SSc0.750.870.670.90
PRP0.900.960.810.92
Table 3. Sensitivity and specificity of 3D-DCNN and SVC models on HC, SSc, and PRP participants’ classification.
3D-DCNNSVC
ClassesSensitivity Specificity Sensitivity Specificity
HC 0.920.9110.95
SSc0.830.920.580.91
PRP0.9010.810.84
Table 4. Overall accuracy, sensitivity, and specificity of DCNN and SVC models on baseline images classification, and of 3D-DCNN and SVC model in classification of the CCP images. Best performances are shown in bold.
Baseline CCP
MetricsDCNNSVC3D-DCNNSVC
Accuracy0.840.770.880.83
Sensitivity 0.83 + 0.080.77 + 0,090.88 + 0.040.80 + 0.20
Specificity 0.91 + 0.040.88 + 0.050.94 + 0.050.90 + 0.06
Publisher’s Note: MDPI stays neutral with regard to jurisdictional claims in published maps and institutional affiliations.