Article

Engine Malfunctioning Conditions Identification through Instantaneous Crankshaft Torque Measurement Analysis

by
Konstantinos-Marios Tsitsilonis
1,2,* and
Gerasimos Theotokatos
2
1
Datum Electronics Ltd., 37 Castle St, East Cowes PO32 6EZ, UK
2
Department of Naval Architecture, Ocean and Marine Engineering, University of Strathclyde, 100 Montrose St, Glasgow G4 0LZ, UK
*
Author to whom correspondence should be addressed.
Appl. Sci. 2021, 11(8), 3522; https://doi.org/10.3390/app11083522
Submission received: 30 March 2021 / Revised: 12 April 2021 / Accepted: 13 April 2021 / Published: 14 April 2021
(This article belongs to the Special Issue Sensors and Measurement Systems for Marine Engineering Applications)

Abstract

:
In this study a coupled thermodynamics and crankshaft dynamics model of a large two-stroke diesel engine was utilised, to map the relationship of the engine Instantaneous Crankshaft Torque (ICT) with the following frequently occurring malfunctioning conditions: (a) change in Start of Injection (SOI), (b) change in Rate of Heat Release (RHR), (c) change in scavenge air pressure, and (d) blowby. This was performed using frequency analysis on the engine ICT, which was obtained through a series of parametric runs of the coupled engine model, under the various malfunctioning and healthy operating conditions. This process demonstrated that engine ICT can be successfully utilised to identify the distinct effects of malfunctions (c) or (d), as they occur individually in any cylinder. Furthermore by using the same process, malfunctions (a) and (b) can be identified as they occur individually for any cylinder, however there is no distinct effect on the engine ICT among these malfunctions, since their effect on the in-cylinder pressure is similar. As a result, this study demonstrates the usefulness of the engine ICT as a non-intrusive diagnostic measurement, as well as the benefits of malfunctioning conditions mapping, which allows for quick and less resource intensive identification of engine malfunctions.

1. Introduction

Large two-stroke diesel engines are highly efficient and robust internal combustion engines, and as a result they are utilised as main engines in the majority of the world ocean-going fleet, operating under a wide range of conditions [1]. However, main engine breakdown and engine components degradation still present major challenges, leading to significant costs due to vessel down time and engine inefficiencies [2,3], as well as compromising crew safety [4]. Consequently, early diagnosis of engine abnormalities, degradation and faults is essential in maintaining the vessel’s safety, as well as avoiding higher operational expenditure associated with fuel, maintenance, costly downtime and increased repair costs.
In order to diagnose the engine’s condition, measurement and monitoring of vital performance parameters are required. Amongst the most important parameters indicating the engine health status is the in-cylinder pressure [5,6], which can effectively be used to analyse combustion quality [7], diagnose cylinder blowby and compression faults [8], and diagnose the fuel injector’s condition [9]. However, obtaining the in-cylinder pressure measurement can be intrusive [10] and requires the deployment of large networks of expensive sensors to perform continuous measurement [11], thus increasing costs, creating data synchronisation issues and introducing multiple failure points.
To overcome the above shortcomings, other peripheral engine measurements are used to accurately determine the cylinders condition. In specific, a combination engine working media pressures and temperatures are used, however these are not as revealing of the engine cylinders’ health status as the in-cylinder pressure [6]. Thus, the Instantaneous Crankshaft Speed (ICS) measurement has been utilised in automotive applications to obtain combustion phasing information [12], identify imbalanced cylinders [13], and cylinders with a decreased mean effective pressure [14]. Regarding larger engines, the ICS signal has been utilised to detect misfiring for medium [15] and slow-speed engines [16], in addition to cylinder imbalances [17]. Thus, the ICS measurement can be utilised due to the low cost of speed sensors, however the raw ICS signal from the angle encoder requires significant processing and high sample rates to provide sufficient detail, which is often not achieved in practice [18]. Hence, by using ICS measurements faults in the engine cylinders are identified, but their specific causes are often not revealed.
The Instantaneous Crankshaft Torque (ICT) can be used to acquire detailed information of the cylinders’ condition, which can be obtained at sufficiently high sample rates and accuracy [19]. In specific, for automotive applications the peak pressure position [20], and properties such as combustion phasing and the burned mass fraction were estimated for each cylinder [21], by utilising measurements from an ICT sensor. Furthermore, progress was made in reconstructing the in-cylinder pressure diagram, however singularities were encountered during the torque signal inversion [11]. Regarding larger engines the ICT measurement was utilised for a two-stroke diesel engine of a land-based power plant, to determine the indicated power for each cylinder using an Artificial Neural Network (ANN) [18]. The ICT measurement is thus able to provide greater insight into the cylinders condition using just a single sensor, however its utilisation in the marine industry remains a novel concept as more traditional means of monitoring and diagnostics employed [22,23].
In the shipping industry, the most common form of diagnostics relies on human judgement combined with information on acceptable degradation tolerances of engine parts and performance parameters, which is provided by the manufacturer [24]. However, this is a manual approach which is error-prone due to the involvement of the human factor. As a result, statistical techniques such as regression [25], Support Vector Machines (SVMs) [26], Bayesian networks [27], and ANNs [28] have been implemented which utilise data from a multitude of engine parameters to perform diagnostics on the main engine holistically or its individual components. These techniques rely on the collection of training and validation data sets from large sensor networks in both healthy and faulty conditions, which are hard to obtain. This is due to the lack of such sensor networks and high quality data for the majority of the world fleet [29], as well as data sharing issues [30]. As a result, first-principles modelling is employed to reduce the required number of measured parameters and identify the cylinders condition. Specifically, thermodynamics modelling has been used in conjunction with some measured parameters in order to identify engine faults such as excessive peak combustion pressure [31], fuel injectors condition [32,33] and cylinder compression as well as blowby [34]. These techniques also demonstrated their usefulness by using engine models to derive baseline conditions, which facilitate comparisons with the current engine operation, making it easier to reveal faults and degradation effects.
From the above literature review, the following research gaps were identified: Despite the usefulness of the ICT measurement, there is no study for large two-stroke diesel engines that utilises said measurement to identify specific types of engine faults. Subsequently, the aim of this study is to provide a framework for assessing the performance large two-stroke diesel engines, by mapping the relationship of specific malfunctioning conditions with the engine ICT, through the comparison with engine healthy (baseline) conditions. This is accomplished by utilising a novel combination of less data-intensive first-principles models, which implies coupling a thermodynamics and crankshaft dynamics model to predict the engine’s ICT at various malfunctioning conditions. The following four most frequently encountered malfunctioning conditions are considered:
  • Change in the Start of Injection (SOI); occurs due to fuel injector wear and engine detuning [32].
  • Change in the Rate of Heat Release (RHR); occurs due to poor fuel quality, and fuel injector or fuel pump wear [33,35].
  • Change in the scavenge air pressure; occurs due to turbocharger compressor or scavenge air cooler fouling [34].
  • Cylinder blowby; occurs due to wear in the cylinder liner or piston rings [34,36].
An initial study on a modelling approach for predicting a marine engine’s shaft dynamics was presented by the authors [37]. The present study is an extension of that, and includes improved thermodynamics model formulations, and additional analysis on the modulus and phase angle of the most affected frequency components of the engine ICT signal.

2. Methods and Tools

2.1. Reference System & Methodology

The reference system considered in this study is a 10-cylinder two-stroke diesel engine, driving a generator operating at a constant speed of 125 rev/min. This engine was utilised for the development of a coupled thermodynamics and crankshaft dynamics model, which provides the in-cylinders pressure and flywheel ICT as output. The technical characteristics and measured data used to develop and calibrate the coupled model were obtained from [18,38]. In specific, the measured data include the in-cylinder pressure for a single cylinder and the flywheel ICT for four loads as shown in Figure 1, whilst a summary of the engine technical details is listed in Table 1.
Initially, the engine thermodynamic model and the engine crankshaft dynamics model were developed and coupled with each other. These models and their coupling are described in Section 2.2 and Section 2.3. Subsequently, the thermodynamic model parameters calibration was carried out by employing a nonlinear data-fitting Levenberg-Marquardt algorithm from MATLAB [39]. The objective employed was to minimise the least-squares difference between the measured and simulated in-cylinder pressure from the coupled model, by assuming that all cylinders have identical in-cylinder pressure. The state of the calibrated model was considered to represent the engine healthy conditions.
Following the calibration process, four different engine malfunctioning conditions were examined at 100% load as listed in Section 1, and four corresponding parameters within the coupled model were used to simulate the engine malfunctioning operation. To test individually all malfunctioning conditions, one parameter was varied 6 times in equal steps from its minimum to its maximum values (defined in Section 2.4), while the rest of the parameters were assigned a constant value corresponding to the healthy engine conditions. The above procedure was performed for each cylinder for three model parameters that correspond to each of the following malfunctioning conditions; change in SOI, change of RHR, and blowby. The remaining parameter corresponding to the change in scavenge air pressure malfunction, was varied for the entire engine and not for each individual cylinder, as a drop in the scavenge air pressure affects all cylinders simultaneously. Therefore, a total of six parametric runs were performed for the three malfunctioning conditions of each cylinder, providing a total of 180 ( 3 × 6 × 10 ) parametric runs. In addition to these parametric runs, six parametric runs were performed for the scavenge air pressure malfunction, which affects all cylinders uniformly, raising the total to 186 runs.
For each parametric run, a frequency analysis by using a Fast Fourier Transform (FFT) was performed to the output of the engine ICT, and the top three most affected signal frequencies and phase angles where identified. These were utilised to map the relationship between the engine ICT and the specific malfunctioning conditions considered in this study.

2.2. Thermodynamic Model Description

An in-house thermodynamics model was developed to predict the engine in-cylinder pressure under the various operating conditions examined. The engine scavenging process was modelled using a two-zone approach, which is considered necessary in order to capture the complexities during the fresh air and exhaust gas mixing [40]. The remaining part of the engine cycle from Exhaust Valve Close (EVC) to Scavenge Port Open (SPO) was modelled using a one-zone approach which is able to provide sufficient accuracy for the in-cylinder pressure diagram prediction [41].
The formulation of each approach is developed using the energy the working medium as homogeneous. In specific, it involves a system of non-linear differential equations that is solved for the pressure, temperature and burnt fuel fraction state variables for each zone. For the one-zone approach the following system of ordinary differential equations (ODE) is obtained:
p ˙ u ϕ T ˙ u ϕ ξ ˙ ( = m u p m u T 0 V m T R p m R + T R T 0 0 0 1 ( 1 Q ˙ p V ˙ + H ˙ u m ˙ u ϕ m ϕ ˙ T R ϕ m ϕ ˙ + R m ˙ p V ˙ F s ϕ ˙ ( 1 ξ ) 2 (
where p, T and ξ are the pressure, temperature and burnt fuel fraction respectively; u, R, F s and ϕ denote the internal energy, gas constant, stoichiometric fuel-air ratio, and equivalence ratio respectively; and finally, V, m and Q ˙ are the volume, mass, sum of heat release and heat transfer rates respectively, whereas H ˙ denotes the sum of enthalpy flow rates entering and exiting the cylinder.
The internal energy u and gas constant R, along with their corresponding partial derivatives with respect to p, T and ϕ are calculated through combustion gas properties [42]. The stoichiometric fuel-air ratio F s is set to 0.0694 for marine diesel fuel [43], whilst the equivalence ratio ϕ is calculated considering the burnt fuel fraction ξ in accordance to the following equation [5]:
ϕ = ξ F s ( 1 ξ )
Furthermore, the mass conservation applied for the one-zone approach provides the following equation:
m ˙ = m ˙ i m ˙ o + m ˙ f b
where the subscripts i and o denote inlet and outlet mass flowrates respectively, which are calculated by utilising the valve isentropic flow equations [5]. The burnt mass rate is denoted by m ˙ f b and is calculated using the single-Wiebe combustion model according to the following equation [7]:
m ˙ f b = m f θ ˙ a ( w + 1 ) Δ θ θ θ S O C Δ θ w exp a θ θ S O C Δ θ w + 1
where m f is the total fuel injected in the cylinder, θ denotes the crank angle, Δ θ is the duration of combustion, w is the Wiebe shape parameter, whereas a is set to 6.9078 to maintain a combustion efficiency of 99.9% [44]. In addition, θ S O C denotes the start of combustion crank angle, which is calculated in accordance to the following equation:
θ S O C = θ S O I + Δ θ I G D
where θ S O I is the start of injection crank angle which is provided as input, and Δ θ I G D is the ignition delay calculated in accordance to the Sitkey equation [7].
The sum of heat transfer and heat release rates is calculated by considering the burnt mass rate from Equation (4) above, and the sum of enthalpy flowrates is calculated by considering the valve inlet and outlet mass flowrates, in accordance to the Equations (6) and (7) respectively:
Q ˙ = m ˙ f b h f o r m C w j A j ( T T j )
H ˙ = m ˙ i h i m ˙ o h o
where h f o r m is the fuel enthalpy of formation, C w is the Woschni heat transfer coefficient [7], and A j , T j are the heat transfer areas and surface temperatures respectively for the j t h cylinder part. The subscript j denotes the piston, cylinder head, liner and exhaust valve.
The scavenging period (from the SPO to EVC) is modelled by employing the two-zone approach [41], which considers that the cylinder is divided into two zones, namely, the charge air zone, and the exhaust gas zone (the latter contains a mixture of the exhaust gas and charge air). By applying the energy and mass conservation equations as well as the ideal gas law and considering the homogeneous mixture, the following system of ODE is obtained:
p ˙ V ˙ 1 T ˙ 1 u 2 ϕ 2 V ˙ 2 u 2 ϕ 2 T ˙ 2 u 2 ϕ 2 ξ ˙ 2 = 0 1 0 1 0 0 V 1 p m 1 R 1 0 0 0 0 p m 1 u 1 T 1 0 0 0 V 2 0 0 p m 2 R 2 0 u 2 ϕ 2 0 0 0 p m 2 u 2 T 2 0 0 0 0 0 0 1 1 V ˙ m ˙ 1 R 1 T 1 Q ˙ 1 + m ˙ i h i m ˙ 1 , 2 h 1 m ˙ 1 u 1 u 2 ϕ 2 T 2 m ˙ 2 R 2 + R 2 ϕ 2 m 2 ϕ ˙ 2 u 2 ϕ 2 Q ˙ 2 + m ˙ 1 , 2 h 1 m ˙ o h o m ˙ 2 u 2 u 2 ϕ 2 m 2 ϕ ˙ 2 F s ϕ ˙ 2 ( 1 ξ 2 ) 2
where the subscripts 1 and 2 denote the charge air and mixture zones respectively, and the subscript 1 , 2 denotes the charge air flow from zone 1 to zone 2. Furthermore, Q ˙ 1 and Q ˙ 2 denote the heat transfer rates for each zone respectively, which are calculated using the Woschni heat transfer coefficient C w in accordance to the following equations:
Q ˙ 1 = C w A p ( T T p ) + A l V 1 V ( T T l )
Q ˙ 2 = C w q A q ( T T q ) + A l V 2 V ( T T l )
where the subscripts p and l denote the piston and cylinder liner respectively, and the subscript q denotes the valve and cylinder head.
The mass flow rate from zone 1 to zone 2 is calculated according to the following equation:
m ˙ 1 , 2 = c s m ˙ i
where c s is the scavenging mixing factor calibrated at every load point [41].
The application of the mass and volume conservation provide the following equations:
m ˙ 1 = ( 1 c s ) m ˙ i
m ˙ 2 = c s m ˙ i m ˙ o
V ˙ = V ˙ 1 + V ˙ 1
The switch between the one-zone and two-zone approaches takes place after the scavenge ports open, when the charge air zone volume V 1 is sufficiently large, such that singularities during the matrix inversion in Equation (8) are avoided [45]. In specific, when the scavenge ports open, the one-zone approach equations from Equation (1) continue to be integrated, along with the following additional differential equation:
V ˙ 1 = m ˙ 1 R 1 T 1 p 1
Subsequently, the zone volume fraction is utilised as the criterion which performs the switch from the one-zone to the two-zone approach, according to whether the following inequality is satisfied:
V 1 V c
where c is set to 10 3 .

2.3. Crankshaft Dynamics Model

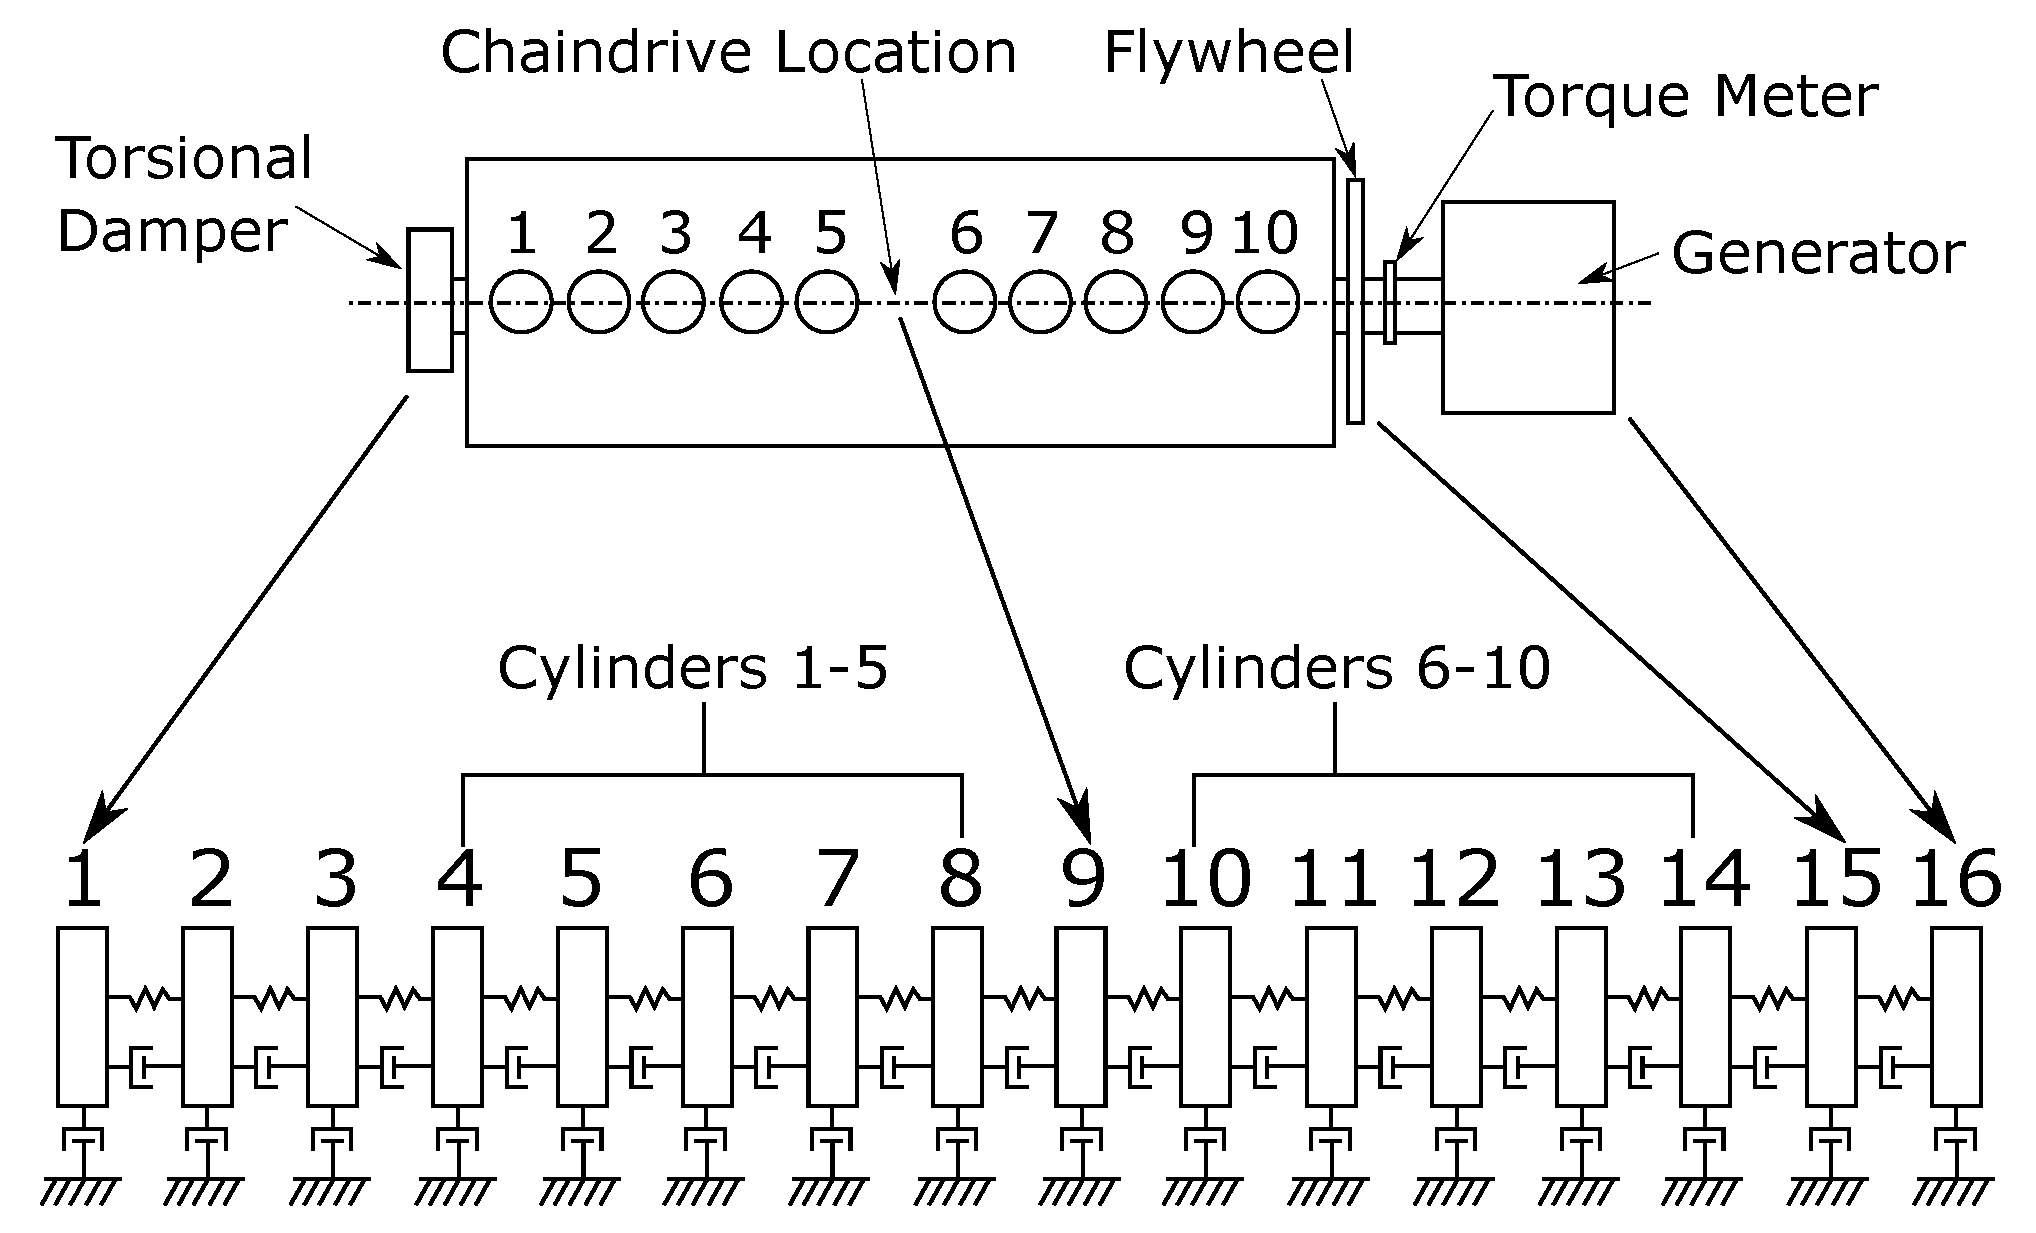
The thermodynamics model was coupled to the crankshaft dynamics model, which is configurable to predict the ICT for either stationary generators or propulsion applications. The engine crankshaft dynamics was modelled using a lumped parameter model, the detailed development of which is described in [37]. The lumped parameter model represents the entire engine crankshaft in a series of 16 discrete inertia disks or Degrees of Freedom (DOFs), as shown for the reference system in Figure 2. The DOFs 4–8 and 10–14 correspond to each of the 10 cylinders, whilst DOFs 1–3, 9, 15, and 16 correspond to the engine vibration dampers, chaindrive, flywheel and generator armature respectively. Each DOF is connected to its neighbouring DOF(s) using a spring and a damper element, that simulate the shaft’s rigidity and structural damping. Furthermore, each DOF is connected with a damper element to a non-rotating frame of reference, simulating the friction in the shafting system’s bearings.
The following crankshaft dynamics model governing equation was derived by applying the angular momentum conservation on the engine shafting system:
J Θ ¨ + C Θ ˙ + K Θ = T J + T C + T F + T L
where Θ , Θ ˙ and Θ ¨ are 16 × 1 vectors of the angular displacement and its respective first and second derivatives; J is a 16 × 16 diagonal inertia matrix; C and K are 16 × 16 tridiagonal damping and stiffness matrices respectively; and T J , T C , T F and T L are 16 × 1 vectors of the variable inertia, cylinder combustion, engine friction, and engine load torques respectively.
The inertia variation throughout the engine rotation is a result of the rotating and reciprocating motion of the engine pistons and the connecting rods [20]. As a result, the variable inertia vector elements corresponding to the engine cylinders (DOFs 4–8 and 10–14) are calculated using Equation (18) below, whilst all other elements corresponding to DOFs 1–3, 9, and 15–16 are set to zero [46]. Thus, the variable inertia torque is calculated according to the following equation:
T J , n = M r e c r 2 d s n d θ n 2 θ ¨ n + M r e c d 2 s n d θ n 2 d s n d θ n θ ˙ n 2
where M r e c and r are the reciprocating piston mass and crank radius respectively, s is the instantaneous piston displacement with respect to the Top Dead Center (TDC), and the subscript n refers to the DOFs corresponding to each cylinder.
The cylinder combustion torque vector is arranged in a similar way as the variable inertia torque vector, where its elements corresponding to the engine cylinders are calculated using Equation (19), and all other elements are set to zero. The combustion torque for individual cylinders is therefore calculated according to the following equation:
T C , n = d s n d θ n p n A p
where by using the same notation as in the thermodynamics model, p n is the in-cylinder pressure for the nth DOF corresponding to each cylinder, and A p corresponds to the piston area.
The engine friction torque is calculated as a function of the engine rotational speed, utilising the friction coefficients in accordance to the following equation [18]:
T F = F Θ ˙
where F is a 16 × 16 diagonal matrix containing the friction coefficients.
The engine load torque is calculated as a constant for the case where the engine is configured for a stationary generator [18], or as a function of the engine speed for the case where the engine is configured for propulsion applications [47]. In specific, the load torque is implemented at the last element of the engine load vector, such that T L = [ 0 , 0 , , τ L ] T , and for both of the above configurations the following equations are used respectively:
τ L , g e n = k g P M C R θ ˙ M C R
τ L , p r o p = k d θ ˙ N where k d = P M C R θ ˙ M C R N + 1
where P M C R and θ ˙ M C R is the engine power and rotational speed at MCR respectively, k g is the generator load constant, which is obtained from on-site bus voltage measurements [18], and N 2 is the propeller law exponent [47].
The torque at the flywheel is calculated considering the shaft stiffness at the flywheel location, and angle of twist between the flywheel and the generator armature according to the following equation:
τ f l y = k 15 θ 16 θ 15
where k 15 is the shaft stiffness at the 15th DOF, and θ 16 , θ 15 are the angular displacements of DOFs 15 and 16, corresponding to the flywheel and generator armature, respectively.

2.4. Malfunctioning Conditions Modelling

In total, 4 malfunctioning conditions are investigated in this study, as listed in Section 1. The first one is the change in SOI, which can be caused due to the fuel injector wear and tear or engine detuning. In specific, engine detuning can occur after a large number of operating hours, as the Variable Injection Timing (VIT) of individual cylinders may require retuning [33]. In addition, detuning occurs due to the wear and tear of the injector pump or the camshaft lobe, the latter occurs to a large percentage of the world fleet, which still operates using camshaft-driven engines. The SOI angle variation for each cylinder are taken into account by using the θ S O I term in Equation (5), which is expected to vary by ± 2 . 5 with respect to the healthy engine condition SOI [48].
The second malfunctioning condition considered is the change in RHR. In specific, this can occur due to a number of reasons including poor fuel quality, and worn or clogged fuel injectors [33,34]. To change the RHR, this study considers the variation of the Weibe shape parameter w emplyed in Equation (4). This impacts the fuel burn rate, and as a results the combustion rate. Since the model is very sensitive to changes of the Weibe shape parameter, its range was considered ± 0.5 with respect to the healthy engine’s parameter value.
The third malfunctioning condition is a change in the scavenge air pressure. A decrease in the scavenge air pressure can occur due to scavenge air cooler fouling, turbocharger compressor fouling, air filter fouling, turbine wear or a combination of those. On the contrary, an increase in the scavenge air pressure can occur due to fouling in the turbine nozzle, or due to higher exhaust gas temperatures resulting from the incomplete combustion, late combustion of poor quality fuel [29]. This malfunction is implemented to the thermodynamic model as a change in the scavenge air pressure, which is an input parameter affecting the air flow rate though the scavenging ports that are utilised to calculate the cylinder inlet mass m i . Ths study considers changes in the scavenge air receiver pressure by ± 0.2 bar with respect value for the healthy engine condition [32].
The fourth malfunctioning condition is the engine blowby, which occurs due to wear in the cylinder liner or piston rings [34,36]. This was modelled by simulating an additional isentropic orifice, namely the blowby orifice, which connects the scavenge air receiver with the cylinder. The effective area profile of the blowby orifice was set as constant throughout the entire engine revolution, and its value was adjusted manually such that a range of typical blowby mass flowrates can be obtained [36,49].
The modelled malfunctioning conditions and their respective parameter changes are summarised in Table 2.

3. Results & Discussion

3.1. Healthy Engine Conditions

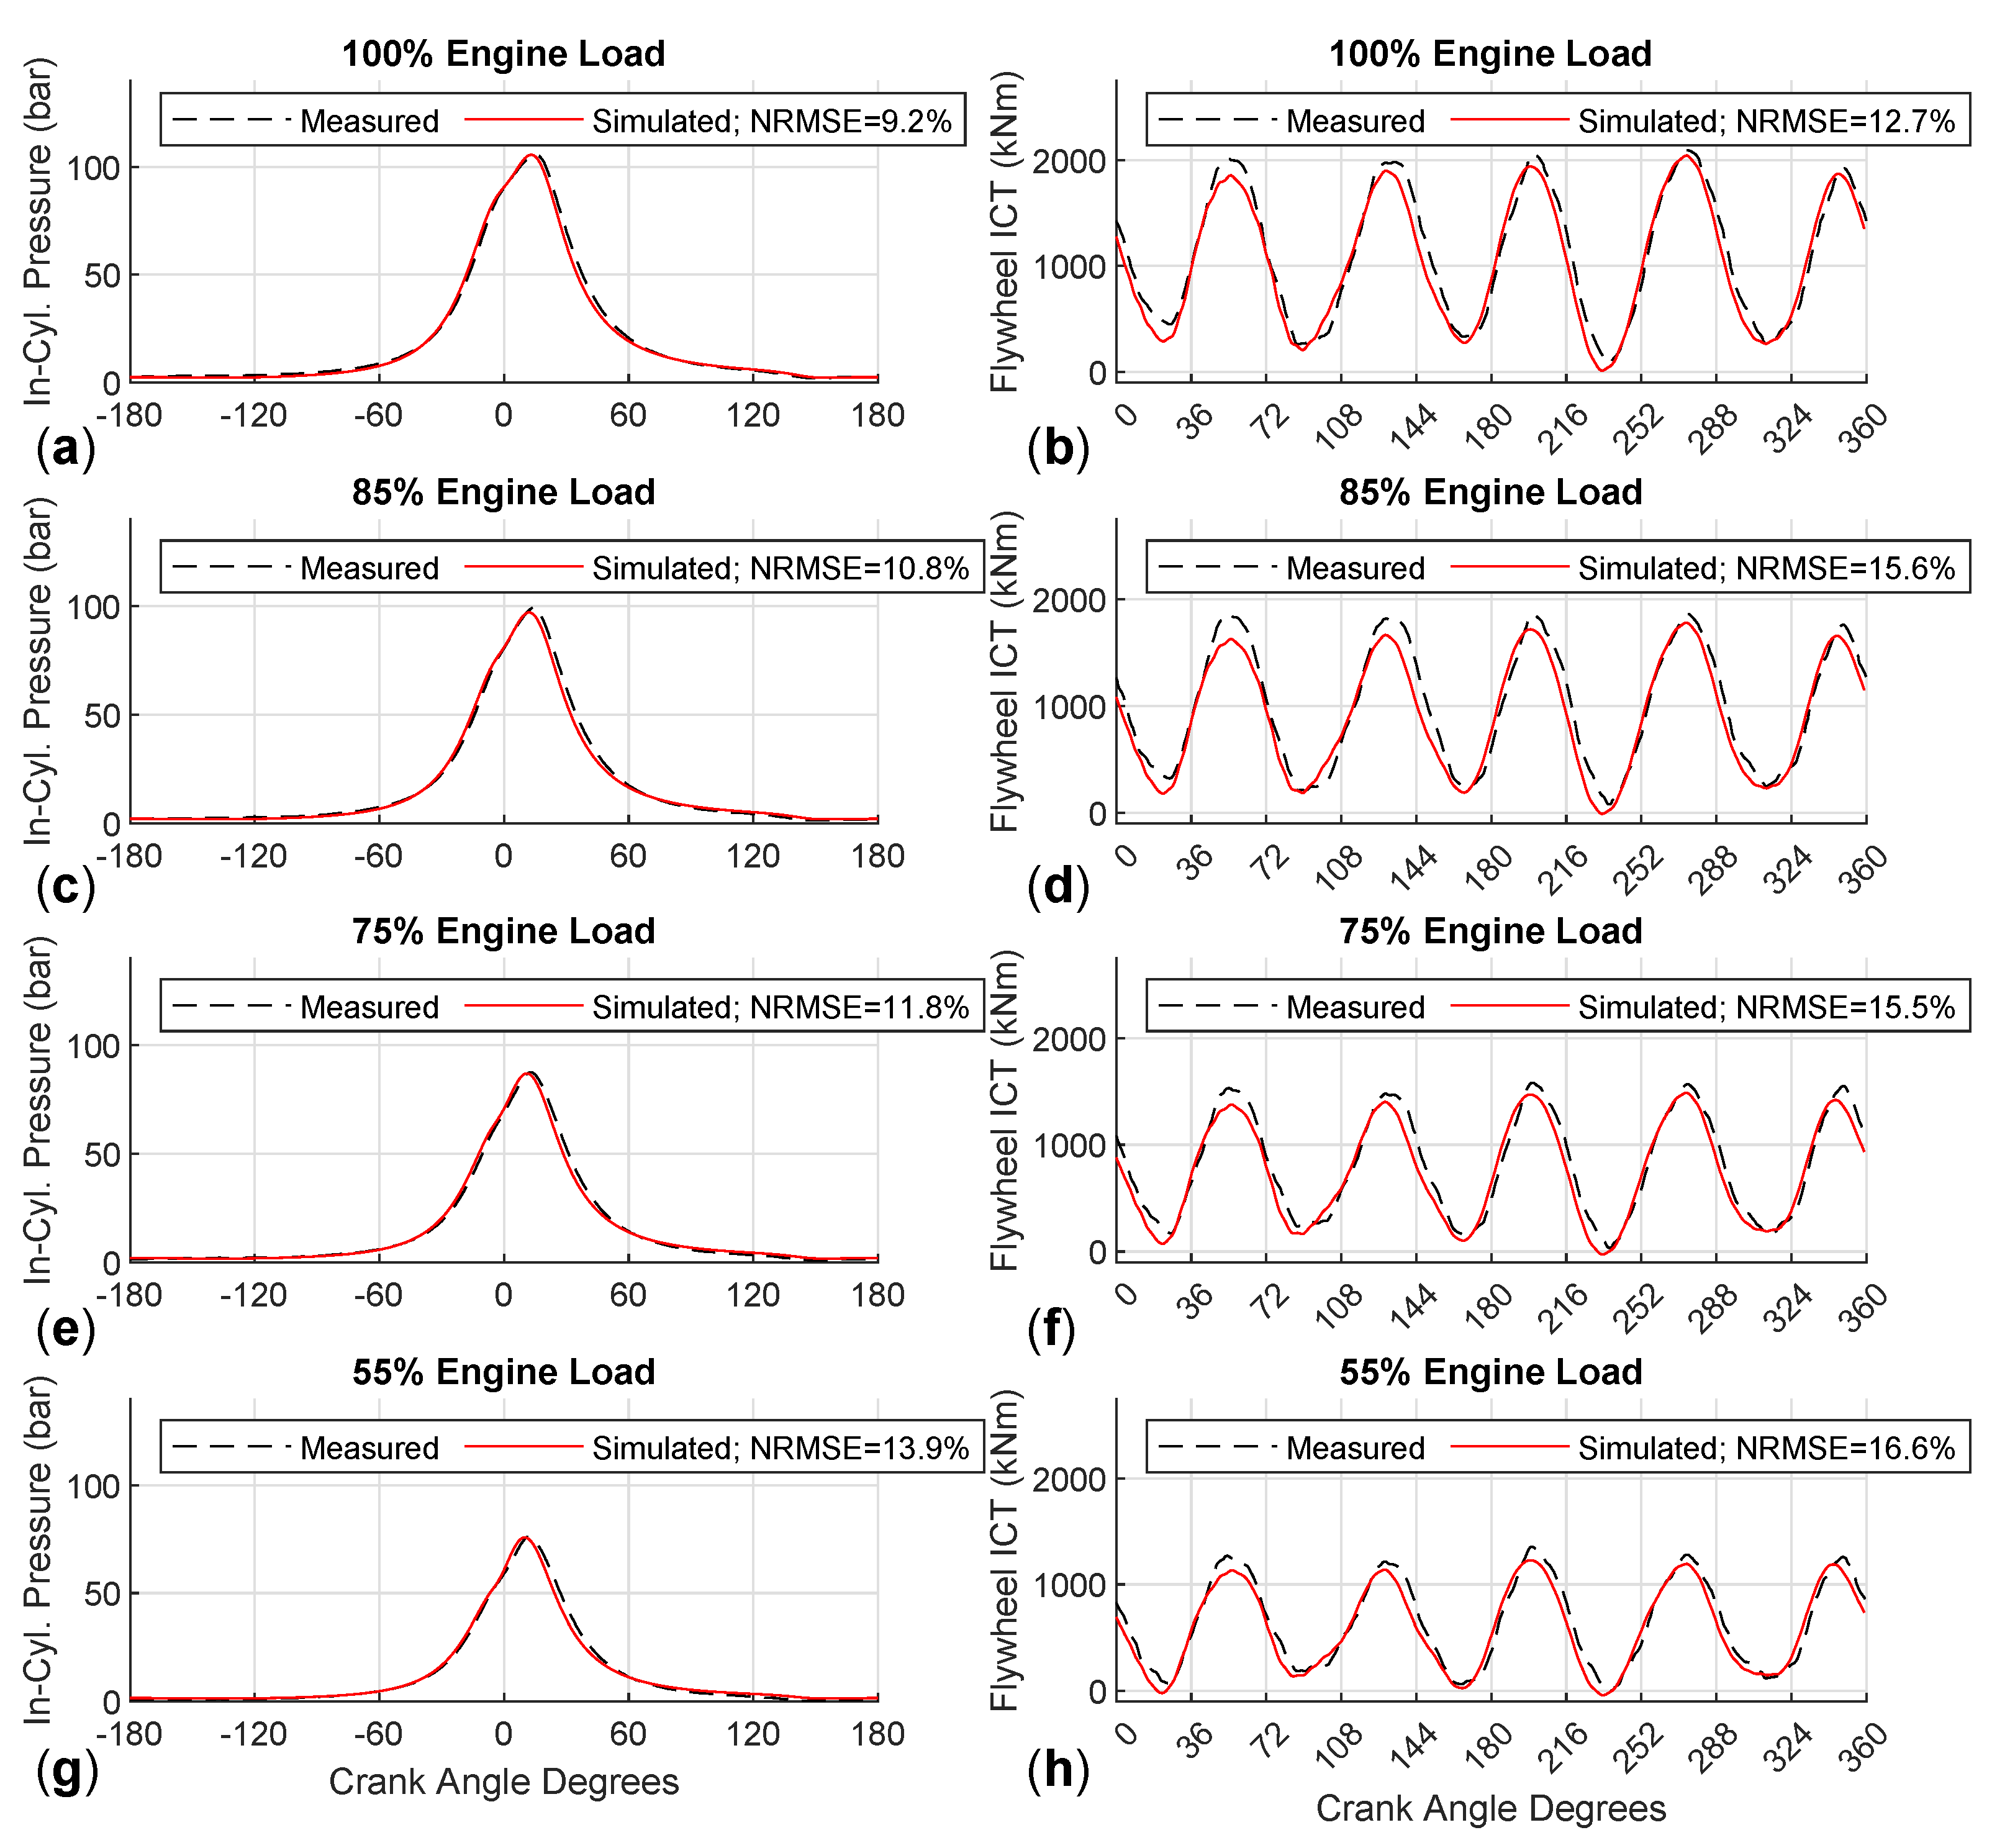
To simulate the engine performance for the baseline conditions, the coupled thermodynamic and crankshaft dynamics model was calibrated at 100% engine load using the measured in-cylinder pressure as described in Section 2.1. In specific, the calibration parameters employed were the start of injection (Equation (5)), duration of combustion and Weibe shape parameter (Equation (4)), as well as the scavenging mixing factor (Equations (11) and (12)). Subsequently, by comparing to the measured data, the coupled model was validated at 100%, 85%, 75%, and 55% engine loads as shown in Figure 3.
The calibration process resulted to the simulated in-cylinder pressure having a Normalised Root Mean Square Error (NRMSE) of 9.2% at 100% engine load, as shown in Figure 3a. Through the validation of the in-cylinder pressure for the remaining three engine loads in Figurs Figure 3c,e,g, it is observed that the NRMSE is increasing to 10.8%, 11.8% and 13.9% respectively. This error increase occurs as these loads are further away from the calibration load of 100%. In addition, the simulated peak combustion pressure is close to the measurements, with a maximum difference of 2.3 bar which occurs at 85% engine load. Also, the crank angle corresponding to the simulated peak combustion pressure is always within 2 crank angle degrees from the measurements, with the exception at 85% engine load where the simulated peak pressure is at 3.5 crank angle degrees less than the measurements. Finally, it is observed that the compression part of the cycle is captured accurately by the simulated pressure. However the expansion from the peak pressure to approximately 60 CA, appears to occur quicker in the case of the simulated in-cylinder pressure as compared to the measurements, for all engine loads.
The NRMSE error in the simulated flywheel ICT in Figure 3b,d,f,h is observed to follow the same pattern as the error for the in-cylinder pressure, since it steadily increases at the engine loads further way from the calibration load. Furthermore, the error in the simulated flywheel ICT is observed to be greater than that of the in-cylinder pressure for all loads, which is due to the assumptions made in the crankshaft dynamics model. In specific, since the in-cylinder pressure from only one cylinder was available, all the cylinders in the crankshaft dynamics model were set to have identical in-cylinder pressures, which would also represent best the healthy engine conditions. As a result, the flywheel ICT was simulated using identical in-cylinder pressures, whilst in the physical engine the in-cylinder pressures were most likely to be different [38], which would result to a larger error in the flywheel ICT. Further analysis on the errors induced in the simulated flywheel ICT can be found in [46].

3.2. Malfunctioning Engine Conditions

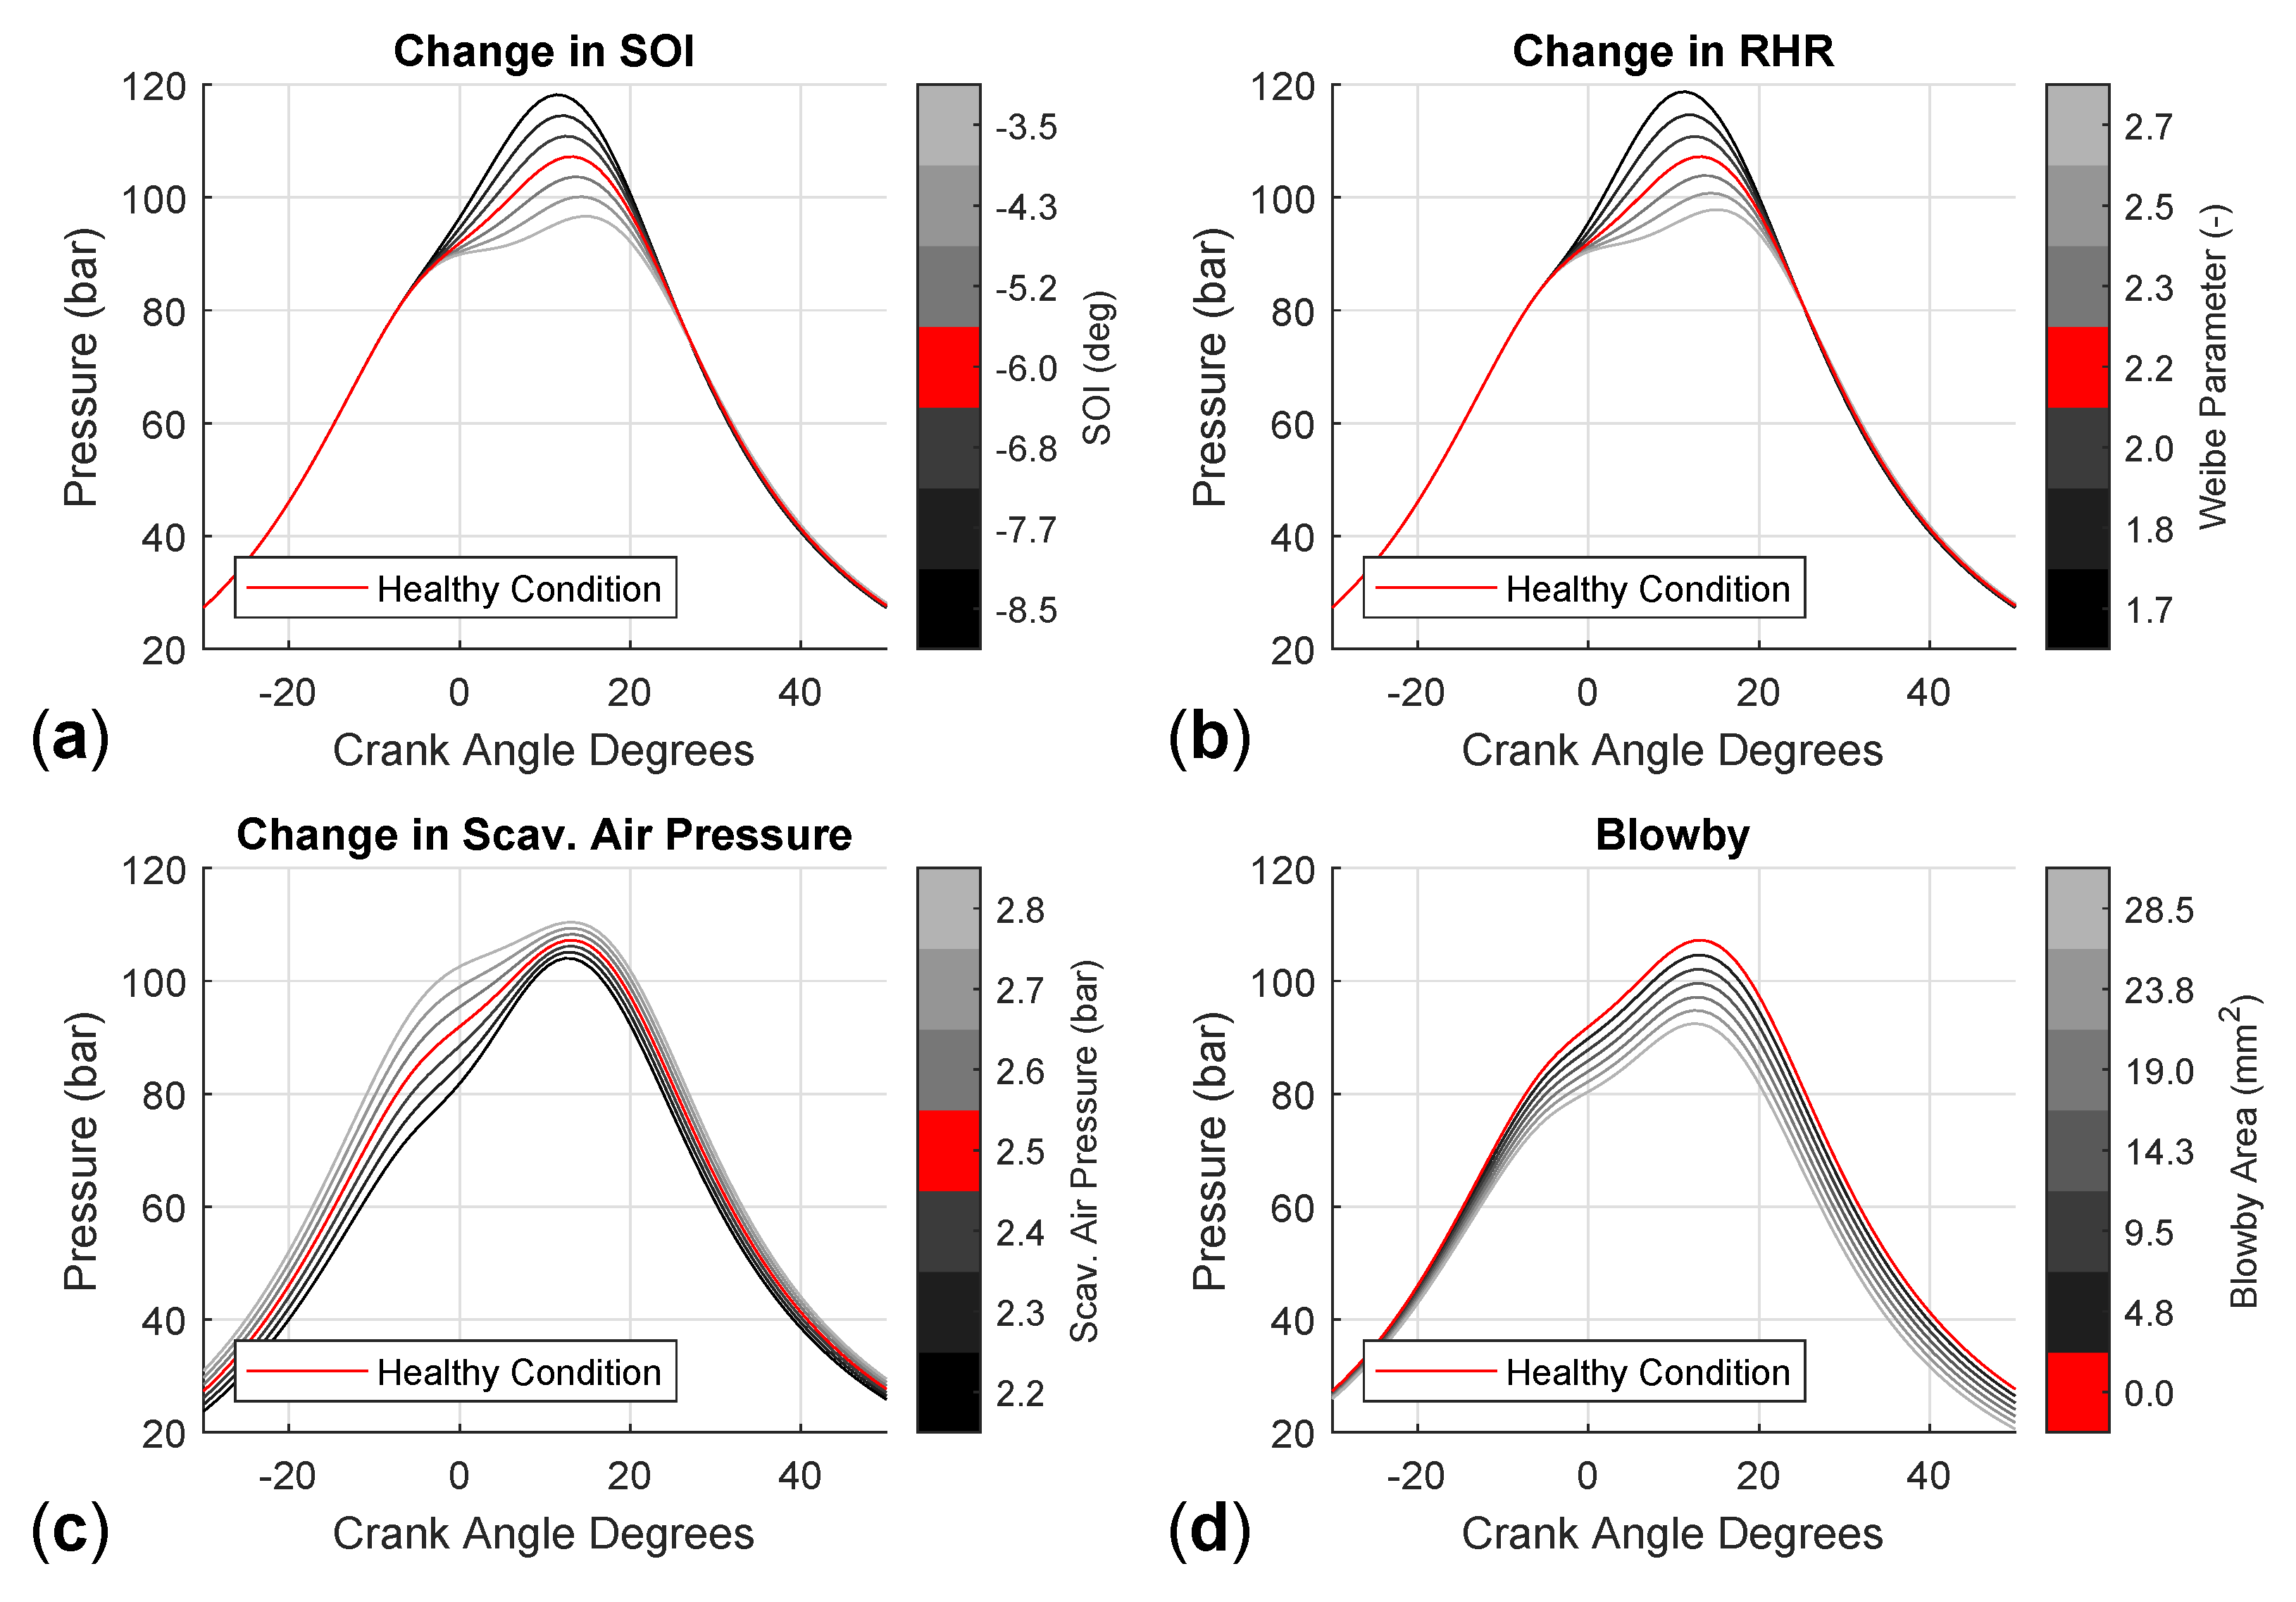
The malfunctioning conditions were simulated using the coupled thermodynamics and crankshaft dynamics model, in accordance to the procedure mentioned in Section 2.1. The change of the in-cylinder pressure for a malfunctioning cylinder is shown in Figure 4, whereas the change in the flywheel ICT for the representative case of cylinder 2 malfunctioning is shown in Figure 5. The flywheel ICT change was normalised with respect to the average torque of the healthy engine conditions.
Regarding the change in SOI, it is observed from Figure 4a that as the start of injection is retarded relative to the healthy conditions, the peak in-cylinder pressure decreases. This occurs since combustion takes place later in the cylinder expansion process compared to the healthy conditions, which can have adverse effects on engine efficiency. Conversely, as the injection timing is advanced the pear in-cylinder pressure increases as combustion takes place closer to the TDC. Furthermore, as shown in Figure 5a, the flywheel ICT is observed to achieve its maximum difference compared to the healthy condition at approximately 35 CA after the TDC of cylinder 2, which is followed by an oscillatory behaviour that attenuates throughout the engine revolution. This delay in the torque response after the malfunctioning cylinder is attributed to the crankshaft’s flexibility, hence the malfunction of cylinder 2 on the flywheel torsional stresses do not appear instantly. Moreover, depending on whether the peak in-cylinder pressure is greater or less than the respective one of the engine healthy conditions, the amplitude of the flywheel ICT difference varies accordingly.
Regarding the change in RHR, as shown in Figure 4b and Figure 5b, it appears to have a very similar effect in both the in-cylinder pressure and the flywheel ICT as compared to the change in SOI malfunctioning condition. In specific, as the Weibe shape parameter increases the RHR becomes faster causing the in-cylinder pressure to peak higher as compared to the healthy condition.
The change in the scavenge air pressure effects the entire in-cylinder pressure curve, but has the greater impact in the compression part of the cycle as observed from Figure 4c. In specific, a decrease of 0.3 bar in the scavenge air pressure from the healthy conditions, can result in a decrease of up to 10 bar in the in-cylinder pressure at TDC, and decrease of 5 bar in the peak combustion pressure. Moreover, since all cylinders are affected with this malfunctioning condition, a decrease of 0.3 bar with respect to the healthy conditions, results to a 0.5% decrease in the flywheel ICT. As a result, small changes in the scavenge air pressure can result to significant changes in the maximum compression and peak combustion pressure of all cylinders, which subsequently affects significantly the engine torque. Hence, this underpins the importance of maintenance in the scavenge air system. Furthermore, after cylinder 2 fires there is no significant change in the flywheel ICT oscillations as shown in Figure 5c, since all cylinders are affected.
Finally, when the engine cylinder experiences blowby, this decreases the combustion and expansion part of the in-cylinder pressure diagram, as shown in Figure 4d. As compared to the SOI and RHR malfunctioning conditions, the change in the peak combustion pressure although significant, may not be as large, however the expansion of the in-cylinder pressure diagram is affected, thus reducing the individual piston torque significantly. As a result the normalised difference in the flywheel ICT experiences the largest oscillations compared to all other malfunctioning conditions reaching a minimum of 39% and a maximum of 23%, as shown in Figure 5d. Therefore, this malfunctioning condition can potentially introduce large torsional strain on the engine shaft. Similarly to the SOI and RHR malfunctioning conditions, a delay of 54 CA between the TDC of the malfunctioning cylinder 2 and the maximum flywheel ICT oscillation is observed from Figure 5d, which occurs as a result of the shafting system’s flexibility. However, in contrast to the SOI and RHR malfunctioning conditions, the phase in the difference of the flywheel ICT does not change, as during blowby the in-cylinder pressure diagram remains always lower compared with the respective one of the healthy engine conditions.

3.3. Frequency Analysis and Malfunctioning Conditions Mapping

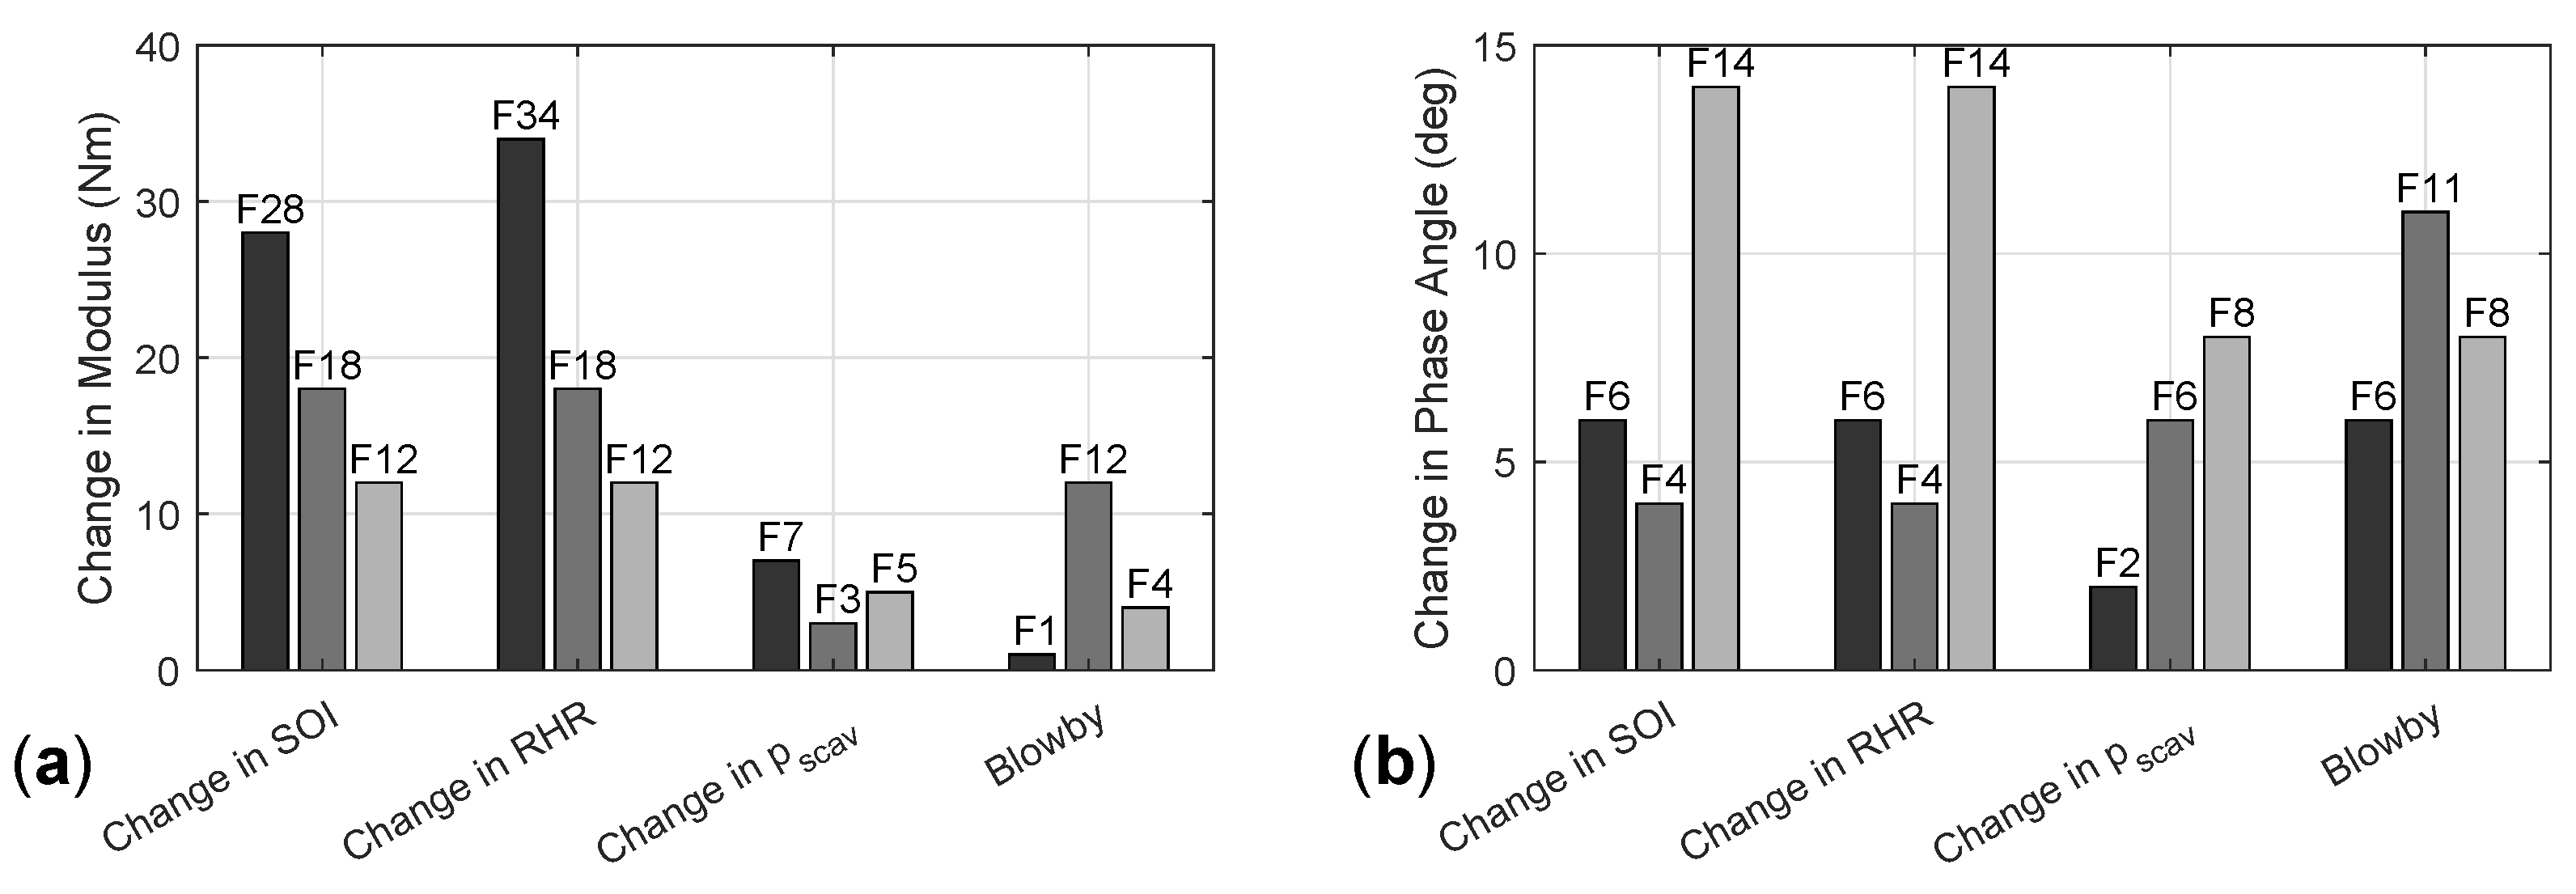
In accordance to the methodology in Section 2.1, by performing a frequency analysis on the flywheel ICT, the engine harmonic frequencies with the most affected modulus and phase angle are determined as a result of the malfunctioning conditions. In specific, according to Figure 6, it is deduced that the change in SOI and RHR for the malfunctioning cylinder no. 2, affects mostly the modulus of the 28th and the 34th harmonic frequencies, and the phase angle of the 14th harmonic frequency. The rest harmonic frequencies affected are observed to be identical for both malfunctioning conditions, which as mentioned in Section 3.2 confirms that both the change in SOI and RHR have a similar effect on the flywheel ICT. Furthermore, the change in scavenge air pressure and blowby modulus is on average 14.3 Nm less for their respective harmonic frequencies, compared to the change in SOI and RHR malfunctioning conditions. However, the harmonic frequencies with the most affected modulus for the change in scavenge air pressure and blowby, are lower by an average of 12 harmonics as compared to the change in SOI and RHR. Therefore, it can be distinguished from noise, and thus it can readily measure their modulus with adequate accuracy.
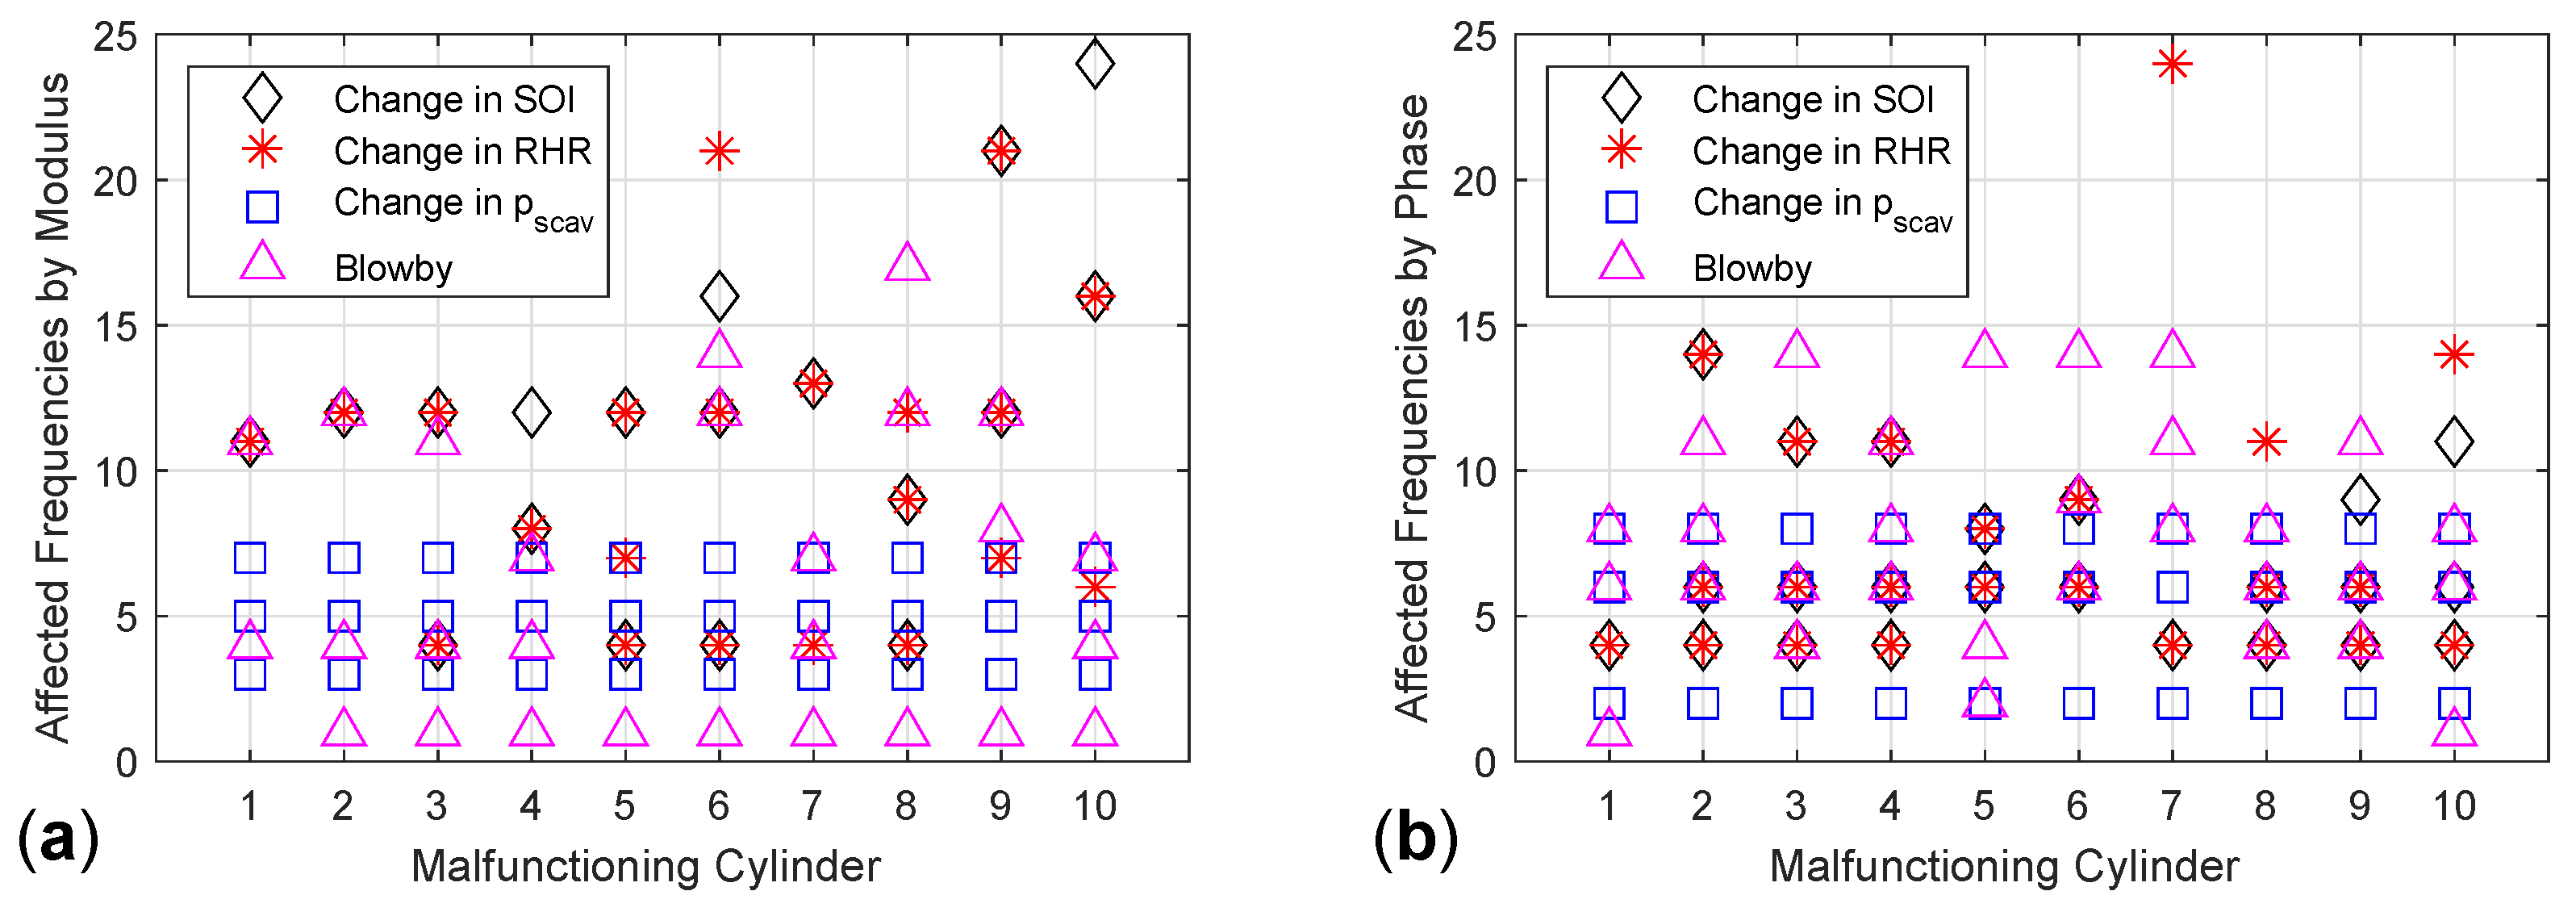
The results shown in Figure 6 can be condensed to perform the malfunctioning conditions mapping, which includes the harmonic frequencies of the top three most affected frequency moduli and phase angles for every malfunctioning cylinder, as shown in Figure 7a,b respectively. It is visible in Figure 7, that specific malfunctioning conditions have a distinct effect on the flywheel ICT harmonic frequencies for all cylinders, which makes them easily identifiable by employing this mapping process. In specific, as shown in Figure 7a, the modulus of distinct harmonic frequencies is affected for the case of blowby. Hence, the modulus of the 1st harmonic frequency for malfunctioning cylinders 2–10, and the modulus of the 4th harmonic frequency for malfunctioning cylinders 1, 2, 4, and 10 are affected. Similarly, for the change in scavenge air pressure the modulus of the 3rd and 5th harmonic frequencies is affected distinctly, for all engine cylinders malfunctioning. As a result, the above suffices to diagnose blowby or a change in scavenge air pressure if they occur individually, to all 10 cylinders respectively.
However, the change in SOI and RHR have a very similar impact on the flywheel ICT, hence the modulus of the nearly identical harmonic frequencies is affected, as shown in Figure 7a. This makes it difficult to distinguish weather a change in SOI or RHR is responsible when a specific cylinder is malfunctioning. In specific both malfunctioning conditions affect the modulus of the 4th harmonic frequency for malfunctioning cylinders 3, 5, 6, and 8, as well as the 8th and 9th harmonic frequencies for malfunctioning cylinders 4 and 8 respectively. For the remaining cylinders, the affected moduli are exceeding the 10th harmonic frequency which can make them difficult to distinguish from noise in the flywheel ICT signal. However, as shown in Figure 7b, the most affected phase angle of the 4th harmonic frequency corresponds to both malfunctioning conditions, for cylinders 1, 2, 7, 9 and 10. As a result, since phase angle of a lower harmonic frequency is affected as compared to the effected modulus harmonic frequencies, the effect of both malfunctioning conditions is easier to identify for all 10 cylinders respectively.

4. Conclusions

In this study, the mapping of four frequently occurring malfunctioning conditions was performed for a large two-stroke diesel engine, by simulating and identifying their effect on the engine’s flywheel ICT. The malfunctioning conditions examined were (a) change in SOI, (b) change in RHR, (c) change in scavenge air pressure and (d) blowby, which were simulated using a validated thermodynamics and crankshaft dynamics coupled engine model.
In specific, changes in SOI and RHR have a nearly identical impact on the engine’s in-cylinder pressure diagram, which primarily affects the maximum combustion pressure and its location. Conversely, changes in the scavenge air pressure primarily affect the compression part of the cycle, with smaller effects observed in the peak combustion pressure and its location. Most importantly changes in the scavenge air pressure affect all cylinders uniformly rather than individually, hence the impact of this malfunctioning condition on the engine performance is greater. This also differs from the effect that blowby has on the in-cylinder pressure diagram, where the combustion and expansion part of the cycle are primarily effected.
As a result, the changes in SOI and RHR appear to have similar effects in the flywheel ICT, where as compared to the healthy engine conditions, a sudden change in the torque fluctuations is observed at approximately 35 CA after the malfunctioning cylinder reaches TDC. The delay in the change of the ICT fluctuations measured at the flywheel is a result of the crankshaft flexibility, demonstrating the importance in considering this phenomenon when considering engine dynamics to identify malfunctions in specific cylinders. The change in scavenge air pressure does not cause similar fluctuations in the flywheel ICT as all cylinders are affected uniformly, thus the crankshaft torsional stresses do not change drastically. However, when blowby occurs the flywheel ICT fluctuations are observed to change significantly at 54 CA after the faulty cylinder reaches TDC, and they attenuate for the rest of the engine’s rotation.
Subsequently, using the flywheel ICT of the malfunctioning engine conditions, a frequency analysis was performed to identify and map the harmonic frequencies with the most affected modulus and phase angle, with their corresponding malfunctioning cylinder. From this mapping process it was determined that the change in scavenge air pressure, and blowby for any malfunctioning cylinder, have a distinct effect on the flywheel ICT harmonic frequencies, and can thus be identified easily using the malfunctioning conditions map. However, the change in SOI and RHR display mostly similar effects on the flywheel ICT. Thus according to the malfunctioning conditions map it is possible to detect weather a cylinder is experiencing a change in SOI or RHR, but cannot distinguish between the two.
The benefit of the malfunctions mapping approach developed in this study is that the engine model is employed only once to develop the malfunctions map, and simulate the flywheel ICT under healthy engine conditions. Subsequently, a computationally cheap and simple algorithm can be deployed in-situ which performs a frequency analysis on the flywheel ICT signal, and determines the harmonic frequencies of the most effected modulus and phase angle. As a result, in a future study the results of this process can then be readily compared with the malfunctions map to diagnose the engine’s condition. Furthermore, malfunctioning conditions occurring in a combination of different cylinders can be examined and mapped in a more extensive database, that includes a larger range of malfunctioning and encompasses better the engine’s realistic operating conditions.

Author Contributions

Conceptualization, K.-M.T. and G.T.; methodology, K.-M.T. and G.T.; software, K.-M.T.; validation, K.-M.T.; formal analysis, K.-M.T.; investigation, K.-M.T.; resources, G.T.; data curation, K.-M.T. and G.T.; writing—original draft preparation, K.-M.T.; writing—review and editing, G.T.; visualization, K.-M.T.; supervision, G.T.; project administration, G.T.; funding acquisition, G.T. All authors have read and agreed to the published version of the manuscript.

Funding

The authors gratefully acknowledge the financial support of Innovate UK, through the Knowledge Transfer Partnership project (project number 11577), for the work reported in this article.

Acknowledgments

The authors from MSRC greatly acknowledge the funding from DNV AS and RCCL for the MSRC establishment and operation. The opinions expressed herein are those of the authors and should not be construed to reflect the views of Innovate UK, DNV AS and RCCL.

Conflicts of Interest

The funders had no role in the design of the study; in the collection, analyses, or interpretation of data; in the writing of the manuscript, or in the decision to publish the results.

Abbreviations

The following abbreviations are used in this manuscript:
ANNArtificial Neural Network
DOFDegree of Freedom
EVCExhaust Valve Close
FFTFast Fourier Transform
ICSInstantaneous Crankshaft Speed
ICTInstantaneous Crankshaft Torque
MCRMaximum Continuous Rating
NRMSENormalised Root Mean Squared Error
RHRRate of Heat Release
SOIStart of Injection
SPOScavenge Port Open
SVMSupport Vector Machine
TDCTop Dead Center
VITVariable Injection Timing

References

  1. Kyrtatos, N.P. From Hercules A-B-C to Hercules-2: Cutting Edge R&D in Ship Engines. Transp. Res. Procedia 2016, 14, 1581–1590. [Google Scholar] [CrossRef] [Green Version]
  2. The Sweedish Club. Main Engine Damage; The Sweedish Club: Göteborg, Sweden, 2018. [Google Scholar]
  3. Legović, D.; Dejhalla, R. An Overview of Measures for Ship’s Energy Efficiency Improvement. In Zbornik Radova 22. Simpozija Teorija i Praksa Brodogradnje, in Memoriam Prof. Leopold Sorta (Sorta 2016); Sveučilište u Zagrebu: Zagreb, Croatia, 2016. [Google Scholar]
  4. Matulić, N.; Radica, G.; Nižetić, S. Engine model for onboard marine engine failure simulation. J. Therm. Anal. Calorim. 2020, 141, 119–130. [Google Scholar] [CrossRef]
  5. Heywood, J.B. Internal Combustion Engine Fundamentals; McGraw-Hill: New York, NY, USA, 1988. [Google Scholar]
  6. Martyr, A.J.; Plint, M.A. Engine Testing: The Design, Building, Modification and Use of Powertrain Test Facilities; Elsevier: Amsterdam, The Netherlands, 2012. [Google Scholar]
  7. Merker, G.P.; Schwarz, C.; Stiesch, G.; Otto, F. Simulating Combustion: Simulation of Combustion and Pollutant Formation for Engine-Development; Springer Science & Business Media: Berlin/Heidelberg, Germany, 2005. [Google Scholar]
  8. Polanowski, S.; Pawletko, R. Acquisition of diagnostic information from the indicator diagrams of marine engines using the electronic indicators. J. KONES 2011, 18, 359–366. [Google Scholar]
  9. Lin, T.R.; Tan, A.C.; Mathew, J. Condition monitoring and diagnosis of injector faults in a diesel engine using in-cylinder pressure and acoustic emission techniques. Dyanmics Sustain. Eng. 2011, 1, 454–463. [Google Scholar]
  10. Woodyard, D. Pounder’s Marine Diesel Engines and Gas Turbines; Butterworth-Heinemann: Oxford, UK, 2009. [Google Scholar]
  11. Aulin, H.; Tunestal, P.; Johansson, T.; Johansson, B. Extracting cylinder individual combustion data from a high precision torque sensor. In Proceedings of the ASME 2010 Internal Combustion Engine Division Fall Technical Conference, San Antonio, TX, USA, 12–15 September 2010; pp. 619–625. [Google Scholar]
  12. Gao, J.; Shen, T. Cylinder pressure sensor-based real-time combustion phase control approach for SI engines. IEEJ Trans. Electr. Electron. Eng. 2017, 12, 244–250. [Google Scholar] [CrossRef]
  13. Geveci, M.; Osburn, A.W.; Franchek, M.A. An investigation of crankshaft oscillations for cylinder health diagnostics. Mech. Syst. Signal Process. 2005, 19, 1107–1134. [Google Scholar] [CrossRef]
  14. Taraza, D.; Henein, N.; Bryzik, W. The frequency analysis of the crankshaft’s speed variation: A reliable tool for diesel engine diagnosis. J. Eng. Gas Turbines Power 2001, 123, 428–432. [Google Scholar] [CrossRef]
  15. Charles, P.; Sinha, J.K.; Gu, F.; Lidstone, L.; Ball, A. Detecting the crankshaft torsional vibration of diesel engines for combustion related diagnosis. J. Sound Vib. 2009, 321, 1171–1185. [Google Scholar] [CrossRef]
  16. Dereszewski, M.; Charchalis, A.; Polanowski, S. Analysis of diagnostic utility of instantaneous angular speed fluctuation of diesel engine crankshaft. J. KONES 2011, 18, 123–128. [Google Scholar]
  17. Desbazeille, M.; Randall, R.; Guillet, F.; El Badaoui, M.; Hoisnard, C. Model-based diagnosis of large diesel engines based on angular speed variations of the crankshaft. Mech. Syst. Signal Process. 2010, 24, 1529–1541. [Google Scholar] [CrossRef]
  18. Guerrero, D.P.; Jiménez-Espadafor, F.J. Torsional system dynamics of low speed diesel engines based on instantaneous torque: Application to engine diagnosis. Mech. Syst. Signal Process. 2019, 116, 858–878. [Google Scholar] [CrossRef]
  19. Espadafor, F.J.J.; Villanueva, J.A.B.; Guerrero, D.P.; García, M.T.; Trujillo, E.C.; Vacas, F.F. Measurement and analysis of instantaneous torque and angular velocity variations of a low speed two stroke diesel engine. Mech. Syst. Signal Process. 2014, 49, 135–153. [Google Scholar] [CrossRef]
  20. Schagerberg, S.; McKelvey, T. Instantaneous Crankshaft Torque Measurements-Modeling and Validation; Technical Report; SAE: Warrendale, PA, USA, 2003. [Google Scholar]
  21. Thor, M.; Egardt, B.; McKelvey, T.; Andersson, I. Using combustion net torque for estimation of combustion properties from measurements of crankshaft torque. Control Eng. Pract. 2014, 26, 233–244. [Google Scholar] [CrossRef]
  22. Acciaro, M.; Hoffmann, P.N.; Eide, M.S. The energy efficiency gap in maritime transport. J. Shipp. Ocean Eng. 2013, 3, 1. [Google Scholar]
  23. Kitada, M.; Ölçer, A. Managing people and technology: The challenges in CSR and energy efficient shipping. Res. Transp. Bus. Manag. 2015, 17, 36–40. [Google Scholar] [CrossRef]
  24. MAN B&W. Instruction Book ‘Operation’ for 46-108MC/MC-C Engines. Hyundai-MAN B&W. Available online: https://seatracker.ru/viewtopic.php?t=1516 (accessed on 13 April 2021).
  25. Capezza, C.; Coleman, S.; Lepore, A.; Palumbo, B.; Vitiello, L. Ship fuel consumption monitoring and fault detection via partial least squares and control charts of navigation data. Transp. Res. Part D Transp. Environ. 2019, 67, 375–387. [Google Scholar] [CrossRef]
  26. Lazakis, I.; Gkerekos, C.; Theotokatos, G. Investigating an SVM-driven, one-class approach to estimating ship systems condition. Ships Offshore Struct. 2019, 14, 432–441. [Google Scholar] [CrossRef]
  27. Dikis, K.; Lazakis, I.; Turan, O. Probabilistic risk assessment of condition monitoring of marine diesel engines. In Proceedings of the ICMT 2014, York, UK, 21–22 July 2014. [Google Scholar]
  28. Cheliotis, M.; Lazakis, I.; Theotokatos, G. Machine learning and data-driven fault detection for ship systems operations. Ocean Eng. 2020, 216, 107968. [Google Scholar] [CrossRef]
  29. Tsitsilonis, K.M.; Theotokatos, G. A novel systematic methodology for ship propulsion engines energy management. J. Clean. Prod. 2018, 204, 212–236. [Google Scholar] [CrossRef] [Green Version]
  30. Lind, M.; Michaelides, M.; Ward, R.; Herodotou, H.; Watson, R. Boosting Data-Sharing to Improve Short Sea Shipping Performance: Evidence from Limassol Port Calls Analysis; Technical Report; Cyprus University of Technology: Limassol, Cyprus, 2019. [Google Scholar]
  31. Kouremenos, D.; Hountalas, D. Diagnosis and condition monitoring of medium-speed marine diesel engines. Tribotest 1997, 4, 63–91. [Google Scholar] [CrossRef]
  32. Hountalas, D.; Kouremenos, D.; Sideris, M. A diagnostic method for heavy-duty diesel engines used in stationary applications. J. Eng. Gas Turbines Power 2004, 126, 886–898. [Google Scholar] [CrossRef]
  33. Lamaris, V.; Hountalas, D. A general purpose diagnostic technique for marine diesel engines—Application on the main propulsion and auxiliary diesel units of a marine vessel. Energy Convers. Manag. 2010, 51, 740–753. [Google Scholar] [CrossRef]
  34. Watzenig, D.; Sommer, M.; Steiner, G. Engine state monitoring and fault diagnosis of large marine diesel engines. E I Elektrotechnik Inf. 2009, 126, 173–179. [Google Scholar] [CrossRef]
  35. Benvenuto, G.; Campora, U. Performance prediction of a faulty marine diesel engine under different governor settings. In Proceedings of the International Conference on Marine Research And Transportation, Naples, Italy, 28–30 June 2007; pp. 35–44. [Google Scholar]
  36. Kouremenos, D.; Rakopoulos, C.; Hountalas, D.; Kouremenos, A. The maximum compression pressure position relative to top dead centre as an indication of engine cylinder condition and blowby. Energy Convers. Manag. 1994, 35, 857–870. [Google Scholar] [CrossRef]
  37. Tsitsilonis, K.; Theotokatos, G.; Habens, M. A modelling approach for predicting marine engines shaft dynamics. In Proceedings of the International Naval Engineering Conference & Exhibition 2020, London, UK, 5–9 October 2020. [Google Scholar] [CrossRef]
  38. Guerrero, D.P. Aportaciones al Mantenimiento Predictivo de Plantas de Potencia: Aplicación a Motores Diesel Lentos de 2 Tiempos. Ph.D. Thesis, University of Seville, Sevilla, Spain, 2017. [Google Scholar]
  39. MATLAB. 9.10.0.1602886 (R2021a); The MathWorks Inc.: Natick, MA, USA, 2021. [Google Scholar]
  40. Foteinos, M.I.; Papazoglou, A.; Kyrtatos, N.P.; Stamatelos, A.; Zogou, O.; Stamatellou, A.M. A three-zone scavenging model for large two-stroke uniflow marine engines using results from CFD scavenging simulations. Energies 2019, 12, 1719. [Google Scholar] [CrossRef] [Green Version]
  41. Guan, C.; Theotokatos, G.; Chen, H. Analysis of two stroke marine diesel engine operation including turbocharger cut-out by using a zero-dimensional model. Energies 2015, 8, 5738–5764. [Google Scholar] [CrossRef] [Green Version]
  42. Gardiner, W.C.; Burcat, A. Combustion Chemistry; Springer: Berlin/Heidelberg, Germany, 1984. [Google Scholar]
  43. CIMAC HFO Working Group. Recommendations Regarding Fuel Quality for Diesel Engines. 2003. Available online: https://www.cimac.com/cms/upload/Publication_Press/Recommendations/Recommendation_21_rev1.pdf (accessed on 13 April 2021).
  44. Xiang, L.; Theotokatos, G.; Cui, H.; Xu, K.; Ben, H.; Ding, Y. Parametric knocking performance investigation of spark ignition natural gas engines and dual fuel engines. J. Mar. Sci. Eng. 2020, 8, 459. [Google Scholar] [CrossRef]
  45. Öberg, P. A Dae Formulation for Multi-Zone Thermodynamic Models and Its Application to Cvcp Engines. Ph.D. Thesis, Linköping University, Linköping, Sweden, 2009. [Google Scholar]
  46. Tsitsilonis, K.M.; Theotokatos, G.; Xiros, N.; Habens, M. Systematic investigation of a large two-stroke engine crankshaft dynamics model. Energies 2020, 13, 2486. [Google Scholar] [CrossRef]
  47. MAN Diesel & Turbo. Basic Principles of Ship Propulsion. 2011. Available online: https://spain.mandieselturbo.com/docs/librariesprovider10/sistemas-propulsivos-marinos/basic-principles-of-ship-propulsion.pdf?sfvrsn=2 (accessed on 6 February 2021).
  48. Hountalas, D.T. Prediction of marine diesel engine performance under fault conditions. Appl. Therm. Eng. 2000, 20, 1753–1783. [Google Scholar] [CrossRef]
  49. Wolff, A. Influence of piston ring pack configuration on blowby and friction losses in a marine two-stroke engine. Combust. Engines 2017, 56. [Google Scholar] [CrossRef]
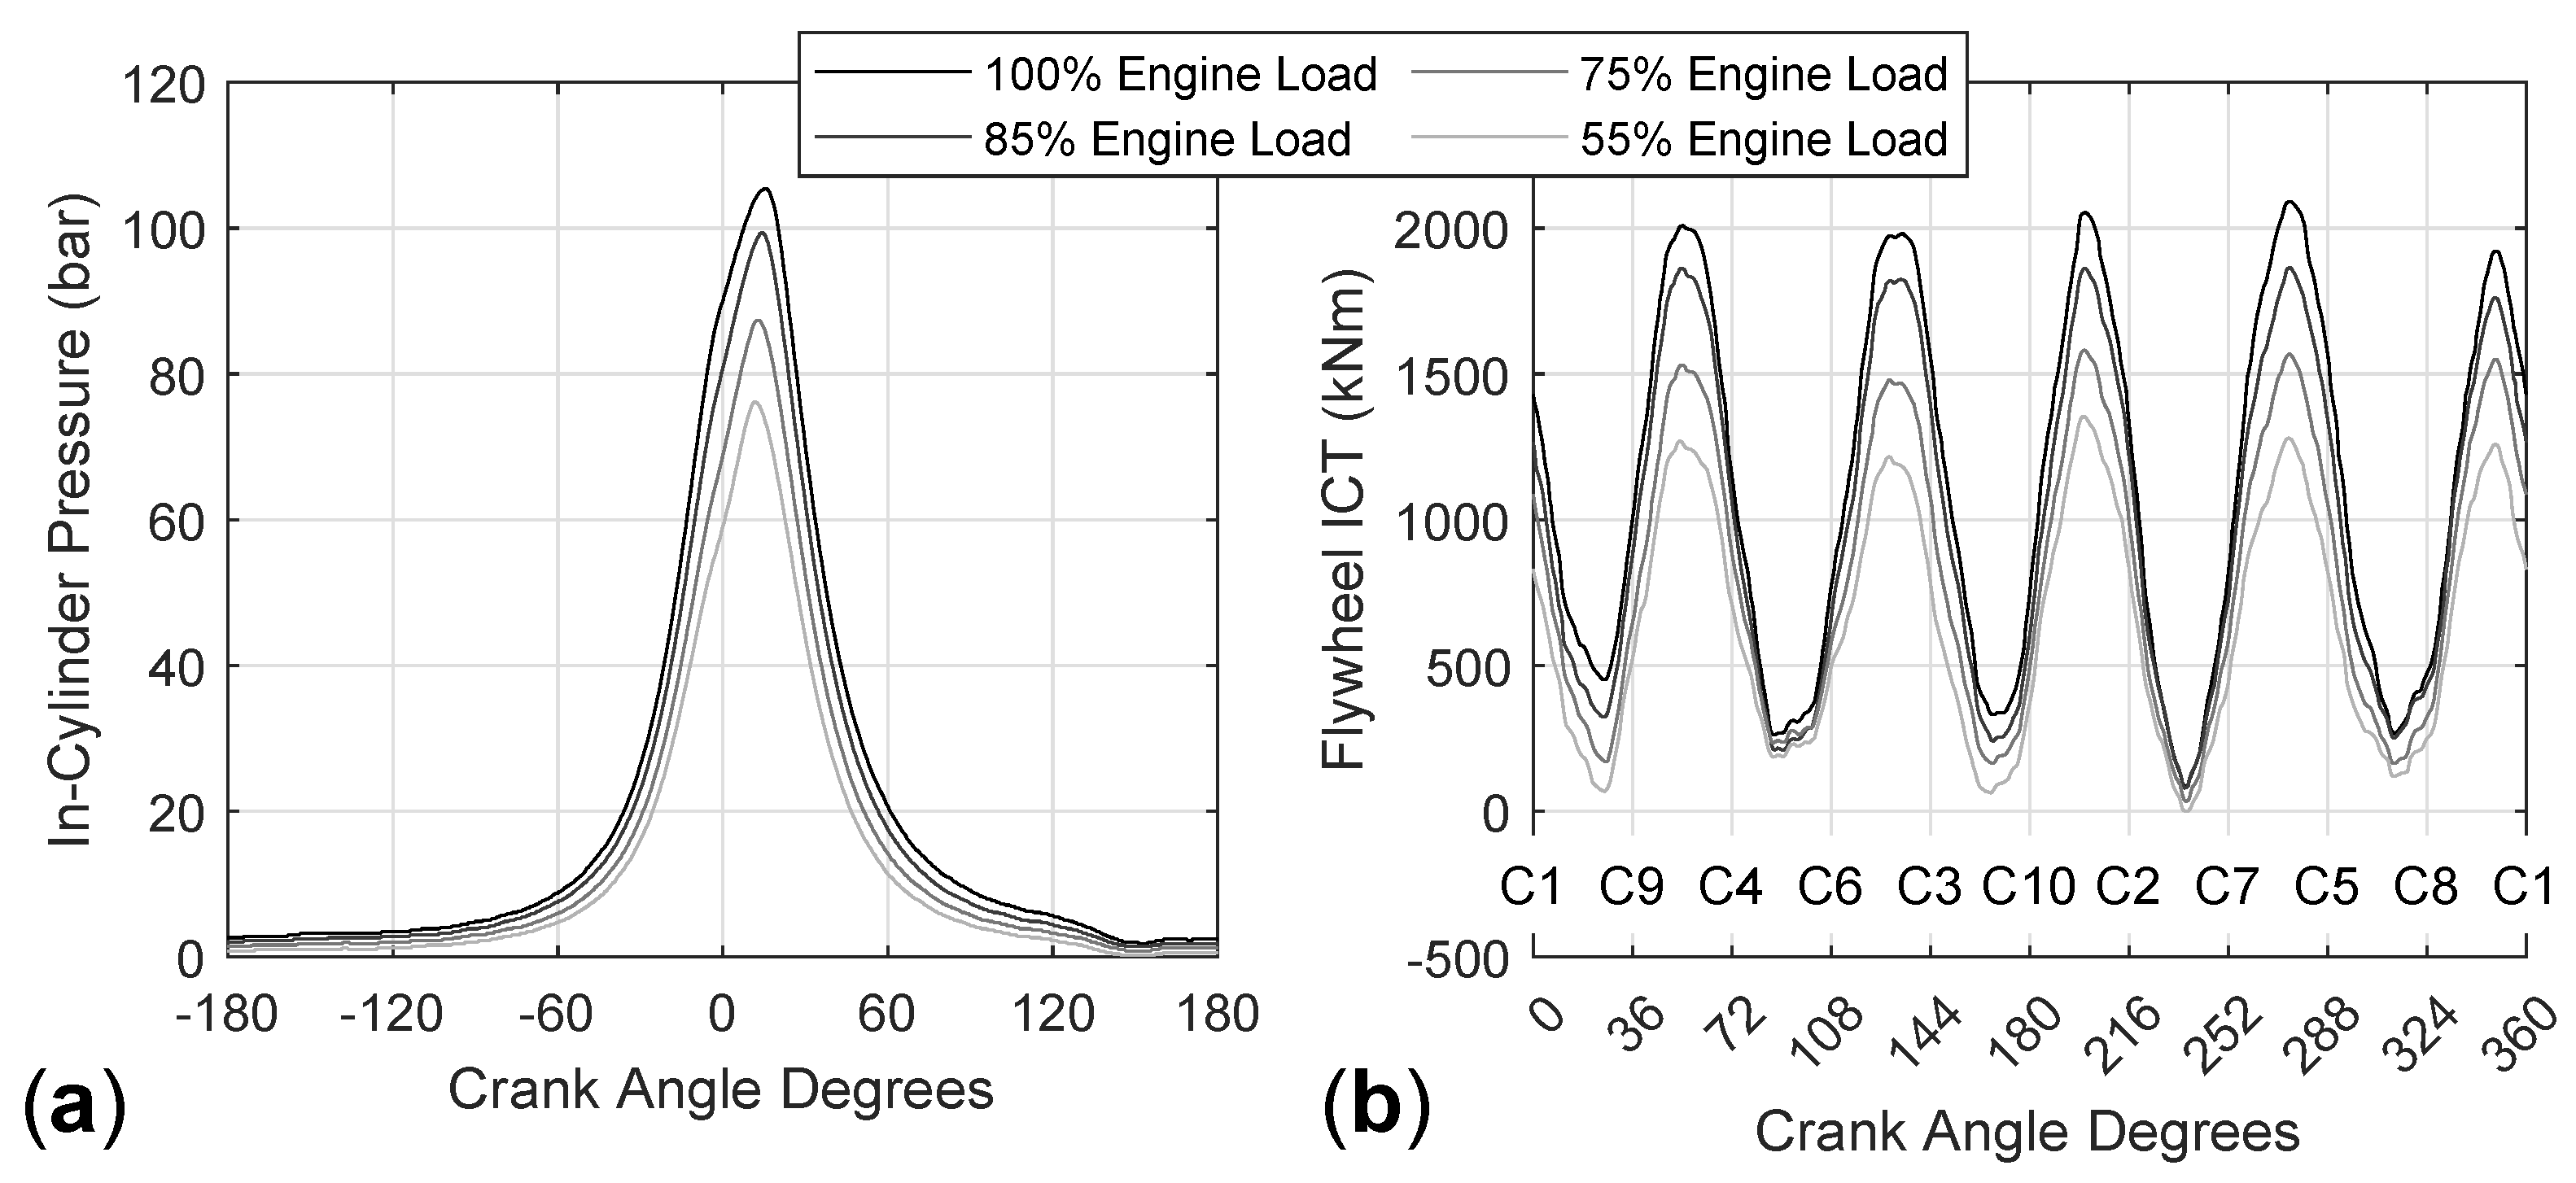
Figure 1. Measured (a) in-cylinder pressure and (b) flywheel ICT, at four engine loads of 100%, 85%, 75% and 55%. Firing cylinders are marked as C1, C2, … C10.
Applsci 11 03522 g001
Figure 2. Crankshaft dynamics lumped mass model schematic [46].
Applsci 11 03522 g002
Figure 3. In-cylinder pressure at (a) 100%, (c) 85%, (e) 75% and (g) 55% engine load. Flywheel ICT at (b) 100%, (d) 85%, (f) 75% and (h) 55% engine load.
Applsci 11 03522 g003
Figure 4. In-cylinder pressure for the healthy and malfunctioning conditions of (a) change in SOI, (b) change in RHR, (c) change in scavenge air pressure, and (d) blowby.
Applsci 11 03522 g004
Figure 5. Normalised difference in flywheel ICT of the healthy engine conditions and the cylinder 2 malfunctioning conditions of (a) change in SOI, (b) change in RHR, (c) change in scavenge air pressure, and (d) blowby.
Applsci 11 03522 g005
Figure 6. Change in the (a) modulus and (b) phase angle of the top three most affected engine harmonic frequencies from a malfunction of cylinder 2, at 100% load. Most affected frequencies are denoted with the letter F at the top of each bar.
Applsci 11 03522 g006
Figure 7. Mapping of individually occurring malfunctioning conditions for each cylinder showing the harmonic frequencies with the most affected (a) modulus and (b) phase angle, at 100% load.
Applsci 11 03522 g007
Table 1. Reference system basic technical specifications [18].
Maximum Continuous Rating15.50 MW
Number of cylinders10
Nominal rotational speed125 rev/min
Piston bore0.67 m
Stroke1.70 m
Firing order1-9-4-6-3-10-2-7-5-8
Table 2. Malfunctioning condition parameters variation.
Malfunctioning ConditionChanged ParameterParameter RangeParameter Step
Change in SOIStart of Combustion ( θ S O I ) ± 2.5 1.25
Change in RHRWeibe shape parameter (w) ± 0.5 0.25
Change in scavenge air pressureScavenge air pressure ± 0.3  bar 0.15  bar
BlowbyBlowby effective area 0 28.5 mm 2 7.12 mm 2
Publisher’s Note: MDPI stays neutral with regard to jurisdictional claims in published maps and institutional affiliations.