Article

Can Body Fat Percentage, Body Mass Index, and Specific Field Tests Explain Throwing Ball Velocity in Team Handball Players?

1
Physical Education Department, College of Education, Qatar University, Doha 2713, Qatar
2
School of Health and Life Sciences, University of the West of Scotland, Glasgow G72 0LH, UK
3
Department of Orthopaedic and Trauma Surgery, Martin-Luther-University Halle-Wittenberg, 06120 Halle, Germany
*
Author to whom correspondence should be addressed.
Appl. Sci. 2021, 11(8), 3492; https://doi.org/10.3390/app11083492
Submission received: 5 March 2021 / Revised: 23 March 2021 / Accepted: 12 April 2021 / Published: 13 April 2021
(This article belongs to the Special Issue Diagnostic and Interventions in Team Sports)

Abstract

:

Featured Application

This article reports the anthropometry, physical fitness, and ball-throwing velocity of first-division normal weight and overweight male team handball players. These results may be useful for sports clubs and institutions with an emphasis on developing training and conditioning programs that are specifically aimed at controlling body fat. One strength of this study is the laboratory setting, differentiating itself from the existing literature, which primarily employed field methods to assess physical fitness and performance.

Abstract

This study examined the physical fitness, anthropometry, and throwing velocity of normal weight and overweight male team handball players. Twenty-five players from the Qatar handball first professional league participated. The anthropometry and physical performance—yo-yo intermittent recovery test, jumping ability (squat and countermovement jumps (SJ and CMJ)), T-half test for change-of-direction (COD) ability, sprint tests (15 and 30 m), and 3 kg medicine ball overhead throw—was measured. The handball-throwing velocity was measured using a three-step running shot and a jump shot. Only the CMJ (p = 0.016, ηp2 = 0.227) was different between the normal and overweight subjects. Two-step linear regression analysis using body height and body mass (step 1) and percentage body fat (%BF) (step 2) predictors showed an increase in the explained variance by adding %BF. The largest r2 change was calculated for COD (0.53). The predictive ability was observed for CMJ (step 1: r2 = 0.18, step 2: r2 = 0.22) and SJ (step 1: r2 = 0.05, step 2: r2 = 0.09). With the exception of the sprint parameters (β-coefficient 15 m sprint: −0.07; β-coefficient 30 m sprint: −0.06) and COD (β-coefficient: −0.09), a lower %BF was associated with greater performance in all parameters. %BF seems to be important for predicting sprint and agility performance.

1. Introduction

Team handball is a contact sport with short epochs of high-intensity movement, challenging anaerobic and aerobic metabolism, and changes of direction [1,2,3]. During matches, rapid change of direction (COD) actions are among the activities that are most frequently performed [4]. Past handball studies have reported that anthropometric characteristics, body composition, maximal strength, muscle power, and ball-throwing velocity constitute the determining factors for competitive success in professional team handball [1,2,3,4,5,6,7].
Throwing is a fundamental skill and handball coaches and scientists concur that the main determinants of throwing velocity are the strength and power of both the upper and lower limbs, technique, and timing of movement in consecutive body segments [7,8]. With regard to body composition, team handball players have recently been described in terms of body mass, stature, body fat percentage (%BF), and body mass index (BMI) [2,9]. These authors propose that anthropometry may be related to physical fitness in team sports [1,2,3,4,5,6,7]. For example, high body mass and %BF measurements were related to poor muscle power in soccer [10], basketball [11], and handball [9,12,13] players.
A specific performance characteristic of team handball and a training and nutrition concern is the optimization of body composition [14]. Fitness profiles are of utmost importance for optimal training programming to enhance the handball performance and orthopedic care of such players. Yet, assessment methods to monitor body composition have historically centered around body mass index (BMI), categorizing individuals as underweight, normal weight, overweight, or obese for disease risk stratification [9,13]. As such, BMI is included in physical fitness testing batteries that are conducted with team handball players [2,15,16]. Although BMI significantly influences individual fitness in youth handball players [13,17], this indicator is less often utilized in athletic populations [9]. The association between BMI and the risk of injury has rarely been reported. However, the previous studies analyzing the association between BMI and the risk of bodily injury are occupational sport-related trauma studies (e.g., in dancers and jockeys) [18,19]. However, BMI was not associated with the overall risk of bodily injury.
Given that the body mass status might vary by age, playing position, and competition level in team handball [20], it becomes important to consider %BF, rather than BMI, when investigating the relationship to physical fitness [9,13,21]. Previous reports have examined associations between body composition and physical fitness in professional handball players [2], generally observing a negative correlation between %BF and performance in fitness tests, particularly cardiorespiratory fitness tests [9,13,21]. However, most studies investigating this relationship have focused on nonathletic populations, with an emphasis on health rather than performance characteristics.
The popularity of handball is unquestioned, as it is the second most popular sport in the world in terms of popularity. Therefore, information concerning performance optimization as a result of body composition alterations would have far-reaching practical applications in handball, especially within the professional environment. In this context, physical fitness tests that measure, for example, aerobic capacity and sprints, are capable of discriminating between different competitive levels in handball players [21]. Furthermore, it is necessary to clarify associations between anthropometric characteristics (i.e., body height, mass, and %BF) and physical fitness in professional handball players, and establish whether these are deterministic of performance parameters.
The rationale for this study arose from the paucity of knowledge concerning the determinants of performance-level fitness differences in professional team handball players. Although previous studies provided insights into physiological and anthropometric characteristics of handball players of different competitive levels, it is apparent that most investigations evidenced differences between diverse performance levels and heterogeneous populations [1,2,3,4,5,6]. Moreover, this research area scarcely concerns countries from the Gulf region, yet this geographical area has unique features, which means that research from other parts of the world may not be applicable to the Gulf. Furthermore, there is a need to clarify associations between %BF and fitness in team handball. Therefore, the aims of this study were to (a) describe and compare the anthropometric and physical performance stratification based on BMI and (b) evaluate the association between BMI and %BF with physical fitness and ball-throwing velocity. We hypothesized that anthropometry, sprinting, muscle power, jumping, and aerobic performance would be different between normal weight and overweight team handball players. In addition, we hypothesized that %BF would be negatively associated with sprinting, jumping, ball-throwing velocity, and running test performance, even after accounting for body mass and stature.

2. Materials and Methods

2.1. Subjects

The investigation was completed in an in-season period, from January to February 2021. The procedures were approved by the national university institutional review board (approval number: QU-IRB 1303-EA/20) for human subjects and complied with the requirements of the Declaration of Helsinki. Participants provided informed written consent after a verbal and a written explanation of the experiment. A questionnaire covering medical history, age, height, body mass, training characteristics, injury history, handball experience, and competitive performance level was completed prior to participation. An examination by the team physician focused on orthopedic and other conditions that may prohibit resistance training. In this context, all participants were found to be in good health.
Participants (n = 25) were from the First National League, competing at the highest level in Qatar (including the national champions for the preceding season), with playing positions as follows: pivots, n = 2; backs, n = 9; wings, n = 5; playmaker, n = 2; goalkeeper, n = 7. Five players were left-handed. Two groups were devised based upon BMI age-adjusted group characteristics (normal weight: 18.5–25.0 kg/m2, age: 25.6 ± 5.8 years, body mass: 88.4 ± 6.2 kg, height: 1.91 ± 0.06 m, body fat: 18.0 ± 3.4%; overweight: 25.1–29.9 kg/m2, age: 25.3 ± 6.4 years, body mass: 97.8 ± 14.4 kg, height: 1.84 ± 0.13 m, body fat 20.6 ± 5.4%).
The inclusion criteria were as follows: minimum of 7 years of handball-playing experience, ≥18 years of age, free from injury or illness, and regular performance at standard training for at least 3 weeks prior to testing. Participants avoided any physical training other than that associated with handball practice throughout the study. All subjects engaged in the same training sessions, supervised by the two team coaches, from the beginning of the competitive season (September 2020) until the end of the current study (March 2021). Players continued their regular training routines that were associated with handball practice throughout tests. During the standard routine, participants trained 10–12 h per week (5–6 × ≈2 h) on the handball court to improve tactical and technical skills and 3 h (2 × ≈1.5 h) in the gym to improve their speed, strength, and power. Training sessions dedicated 60% of the time to the development of technical and tactical skills, and 40% to strength and conditioning procedures. Physical conditioning aimed at strength development was performed three times per week. Anaerobic training sessions consisted of plyometric sprint training drills and half squats, overhead lunges, countermovement and squat jumps, push-ups, and pull-ups, accompanied by strength exercises for the lower and upper limbs (40–60% one-repetition maximum (1RM) exercises, such as bench presses, pull-overs, and half-back squats). Aerobic fitness was trained through high-intensity interval training and small-sided games.

2.2. Experimental Design

Subjects were familiarized with the testing protocol, as they had been previously tested on numerous occasions in season for the purpose of training prescriptions. Assessments were conducted on the same day in the same order. Tests were conducted pre-season. To reduce the effect of confounding variables, participants maintained habitual lifestyles and diet during the study according to self-reporting. Players maintained habitual intakes of food and fluids and abstained from physical exercise for 1 day before testing. They also drank no caffeine-containing beverages for 4 h before testing and arrived for testing ≥2 h postprandial. Strong verbal encouragement was provided to all subjects to promote maximal effort throughout testing.
The testing sessions occurred on a standard indoor handball court from 18:00 to 20:00 under similar environmental conditions (temperature: 22.5 ± 0.5 °C, relative humidity: 60 ± 5%) and a minimum of three days after a competitive match. The tests were performed over four days in a fixed order. On the first day, the anthropometric measurements were followed by a recovery day. The second day was devoted to sprint performance. On the third day, the vertical jump tests (squat and countermovement jumps (SJ and CMJ)), followed by the yo-yo intermittent recovery test level 1 (Yo-Yo IR1) and ball-throwing velocity were measured. On the fourth day, the COD test and medicine ball throw were tested. Two weeks later, the fitness tests from days 1 to 3 were repeated to allow for the evaluation of test–retest reliability. The scores of the second set of tests were considered for the analyses. Anthropometric assessments and the Yo-Yo IR1 test were only completed once for convenience related to the players’ schedules.
Before testing, participants underwent three to four supervised familiarization sessions to perform the movement safely and in a technically sound manner. Tests and familiarization sessions started with a standardized warm-up routine, which included a 5-min self-paced jog, followed by 5 min of dynamic stretching and 5 min of handball-specific high-intensity exercises. The rests between tests performed on the same day were 5–6 min in all instances.

2.3. Testing Schedule

2.3.1. Day 1

Anthropometry

Body mass (model TBF 105; Tanita Corporation of America, Inc., Arlington Heights, IL, USA) and height (Holtain stadiometer, Crosswell, Crymych, Pembrokeshire, United Kingdom, accuracy of 1 mm) were measured to the nearest 0.1 kg and 0.1 cm, respectively. BMI was calculated as the ratio between body mass in kilograms and height in square meters. %BF was assessed using Harpenden calipers (Baty International, Burgess Hill, Sussex, United Kingdom) to the nearest 0.1 mm. Duplicate readings were taken at each site, and the average was recorded. If the two readings differed by more than 2 mm, a third was taken, and the closest two were averaged. The sum of the four skinfold measurements (biceps, triceps, subscapular, and suprailiac) was used to estimate the body fat according to the sex- and age-specific Durnin–Womersley equation [22].

2.3.2. Day 2

Sprint Tests

After the general standardized warm-up, participants performed three 15 m strides at 85–90% of maximal effort. Then, participants performed three maximal 15 m sprints with a 3 min rest between each trial. The sprint times were measured using single-beam electronic photocells (Racetime 2 SF, Microgate, Bolzano, Italy) mounted to the floor and walls. The starting photocell was placed 20 cm above the ground, while the 5-, 10-, and 15 m photocells were placed 100 cm above the ground. Players started the sprint from a static position, with their front foot 30 cm behind the starting line. The fastest 15 m and 30 m split times from each participant were analyzed.

2.3.3. Day 3

Squat and Counter Movement Jump Tests

Participants followed a general warm-up preceding 2 min of jumping exercises. SJ and CMJ heights were assessed using photoelectronic cells (Optojump, Microgate, Italy) [23]. The jump heights were measured using the flight time and contact time, utilizing a sampling frequency of 1 kHz. The SJ began at a knee angle of 90°, avoiding downward movement, whilst the CMJ began from an upright position, with participants making a downward movement to a knee angle of approximately 90°, arms akimbo. Both tests were performed without arm swing by maintaining hands fixed at the level of the pelvis with the knees and ankles extended at take-off and landing. The best of four jumps from each participant was recorded for each test, and a 30 s recovery was allotted between each trial.

The Yo-Yo Intermittent Recovery Test Level 1

The Yo-Yo IR1 was conducted as described by Krustrup et al. [24]. The coefficient of variation was established as 3.6% with an intraclass correlation (ICC) coefficient of 0.94 [24]. A 5 min warm-up of low-intensity running preceded the test. Participants completed 20 m shuttle runs at increasing velocity until exhaustion, with 10 s of active recovery (2 × 5 m of jogging) between runs. If participants failed twice to reach the front line in time (objective criterion) and/or felt unable to complete another shuttle at the required speed (subjective criterion) the test was terminated. The test score is reported as the total distance covered.

Medicine Ball Overhead Throw

A standardized warm-up preceded medicine ball throws using a 3 kg rubber ball with a diameter of 21.5 cm (Tigar, Pirot, Serbia). After familiarization and a brief description of the optimal technique [25], seated players held the ball with both hands, then forcefully pushed the ball from the chest. Distance from the sitting line to the ball’s landing spot is reported as the test score to the nearest 1 cm. Three trials were performed, separated by 60 s of rest, and the best score from each participant was retained for the analysis.

2.3.4. Day 3

T-Half Test for Change-of-Direction Ability

A 10 min warm-up including jogging, lateral displacements, dynamic stretching, and jumping preceded the T-half test for COD ability [26], whereafter data were recorded using electronic timing sensors (photocells, Kit Racetime 2 SF, Microgate, Bolzano, Italy) 75 cm above the floor, 3 m apart, and facing each other at the starting line (A). Participants started with the front foot 20 cm behind line A. At their discretion, each participant sprinted forward to cone B and touched its base with their right hand. Facing forward and with no crossing of feet, they shuffled left to cone C and touched its base with their left hands. They then shuffled to the right to cone D and touched its base with their right hands, subsequently running back to the left to cone B and touching its base. Finally, they ran backward as quickly as possible, returning to line A. Anyone who crossed one foot in front of the other, failed to touch the cone base, and/or failed to face forward throughout had to repeat the trial. Participants repeated the test until two successful trials were completed, with a 3 min rest between trials, and the best trial from each participant was considered in the analyses.

Throwing Ball Velocity

Ball-throwing velocity was determined during a three-step running throw and a jump throw. After 10 min of standardized warm-up, participants threw a standard handball (mass 480 g, circumference 58 cm) with maximal velocity toward the upper right corner of the goal. They were permitted to use resin on their hands. Participants continued until three correct throws had been recorded, completing a maximum of three sets of three consecutive throws. A 1–2 min rest was allotted between sets and 10–15 s between two throws in the same set. The throwing time was recorded with an accuracy of 1 ms using a digital video camera (HVR to A1U DV Camcorder; Sony, Tokyo, Japan) positioned on a tripod 2 m above and perpendicular to the plane of the ball’s release. Data processing software (Regavi & Regressi, Micrelec, Coulommiers, France) converted the handball displacement to velocity. The validity of camera and data processing software under working conditions was verified [27] by measuring the velocity of rolling balls (2–14 m/s) with the camera (Vc) and checking the data over a given distance (3 m) against photoelectric cells (Vpc) (GLOBUSREHAB and Sports High Tech, Articolo ERGO TIMER, Codognè, Italy). The two values of velocity were well correlated with each other (Vc = 0.9936Vpc + 0.65, r = 0.99, p < 0.001) [27]. Each participant’s throw with the greatest average velocity was retained for the analysis.

2.4. Statistical Analyses

All variables are expressed as means, standard deviations (SDs), minimum and maximum values (range), and 95% confidence intervals (95% CI). Mean differences between normal weight and overweight participants were tested using a one-factor univariate general linear model [28]. Differences between means were considered statistically significant if p < 0.05 and partial eta-squared (ηp2) > 0.15 [29]. A power calculation (nQuery Advisor 4.0; Statistical Solutions, Saugus, MA, USA) was performed using previous data [13], which suggested a sample size of 13 participants in each group, where the study would have 80% power to detect a mean difference of 2.90 cm in CMJ performance using a two-sided t-test with a significance level of p < 0.05 under the assumption of a pooled standard deviation of 2.50 cm [28].
A two-step linear regression analysis (with “inclusion” as the method) was conducted to test for relationships between the anthropometric parameters (%BF, body weight, and body height) and performance parameters (e.g., sprinting, jumping, and throwing). In the first step, body weight and body height were used as predictors with the regression model. In order to evaluate the influence of %BF and the additional explained variance, %BF was included in the second step in the analysis as a third predictor. R2 and the change of r2 between steps 1 and 2 and the nonstandardized regression coefficient β for all predictors and steps are reported. Pearson product–moment correlation coefficients (r) were interpreted as follows: <0.1, trivial; 0.1–0.3, small; 0.3–05, moderate; 0.5–0.7, large; 0.7–0.9, very large; 0.9–1.0, almost perfect [30]. Therefore, r2 > 0.5 (explained variance > 50%) was defined as meaningful and is marked in bold. Regarding the sample size of N = 25, the critical value for the product–moment correlation based on a two-sided t-test and α = 5% is r = 0.381 [31].
The intraclass correlation coefficient (ICC) and the coefficient of variation (CV) were calculated to quantitatively assess the intrarater reliability [32]. The interpretation of the reliability values was based upon Shrout and Fleiss [33], Cohen [30], Hopkins [34], and Portney and Watkins [35]. The ICC was considered to show excellent relative reliability (intersubject variability) if it was >0.75, 0.40–0.75 was considered fair to good, and <0.40 was considered poor. The CV (the indicator of measurement variability and random error, i.e., absolute reliability) was determined after log-transforming the raw data [36]. The CV can be defined as good with values <10% [37,38]. All statistical analyses were performed using SPSS version 25.0 for Windows (SPSS Inc., IBM, Armonk, NY, USA).

3. Results

3.1. Intrarater Reliability

The eight performance parameters showed excellent relative reliabilities (ICC ≥ 0.75; Table 1). The ICCs ranged from 0.97 (medicine ball throw) to 0.99 (e.g., 15 m sprint and 30 m sprint). Furthermore, all investigated performance parameters also displayed excellent absolute reliabilities (CV < 10%). All CVs were even below 5%. The values ranged from 0.6% (30 m sprint) to 3.6% (medicine ball throw).

3.2. BMI Based Comparisons

Based on the category of normal BMI (cut off: 25.0 kg/m2), 56% (14/25) of the subjects were overweight (Table 2). The BMI varied from 22.4 to 41.9 kg/m2. Three handball players (12%) showed a BMI above 30 kg/m2. The body fat values ranged from 13.3 to 30.1% and only one athlete showed a body fat above 30%.
Only for the bicep skinfold were significant differences observed (p = 0.027, ηp2 = 0.196). Of course, the distinguishing criterion BMI was significantly different between both groups (24.1 ± 0.84 vs. 29.0 ± 4.57 kg/m2; ηp2 = 0.339).
Similar results were observed for the performance parameters (Table 2). Only for CMJ was a significant mean difference detected (p = 0.016, ηp2 = 0.227). The smallest difference was calculated for the 15 m sprint (ηp2 = 0.001) and medicine ball throw (ηp2 = 0.003). For the 15 m sprint (2.51 ± 0.44 vs. 2.48 ± 0.46 s) and agility T-half test (6.28 ± 0.47 vs. 6.22 ± 0.47 s), the performance level in the overweight group was slightly higher than in the normal-weight group (Figure 1).

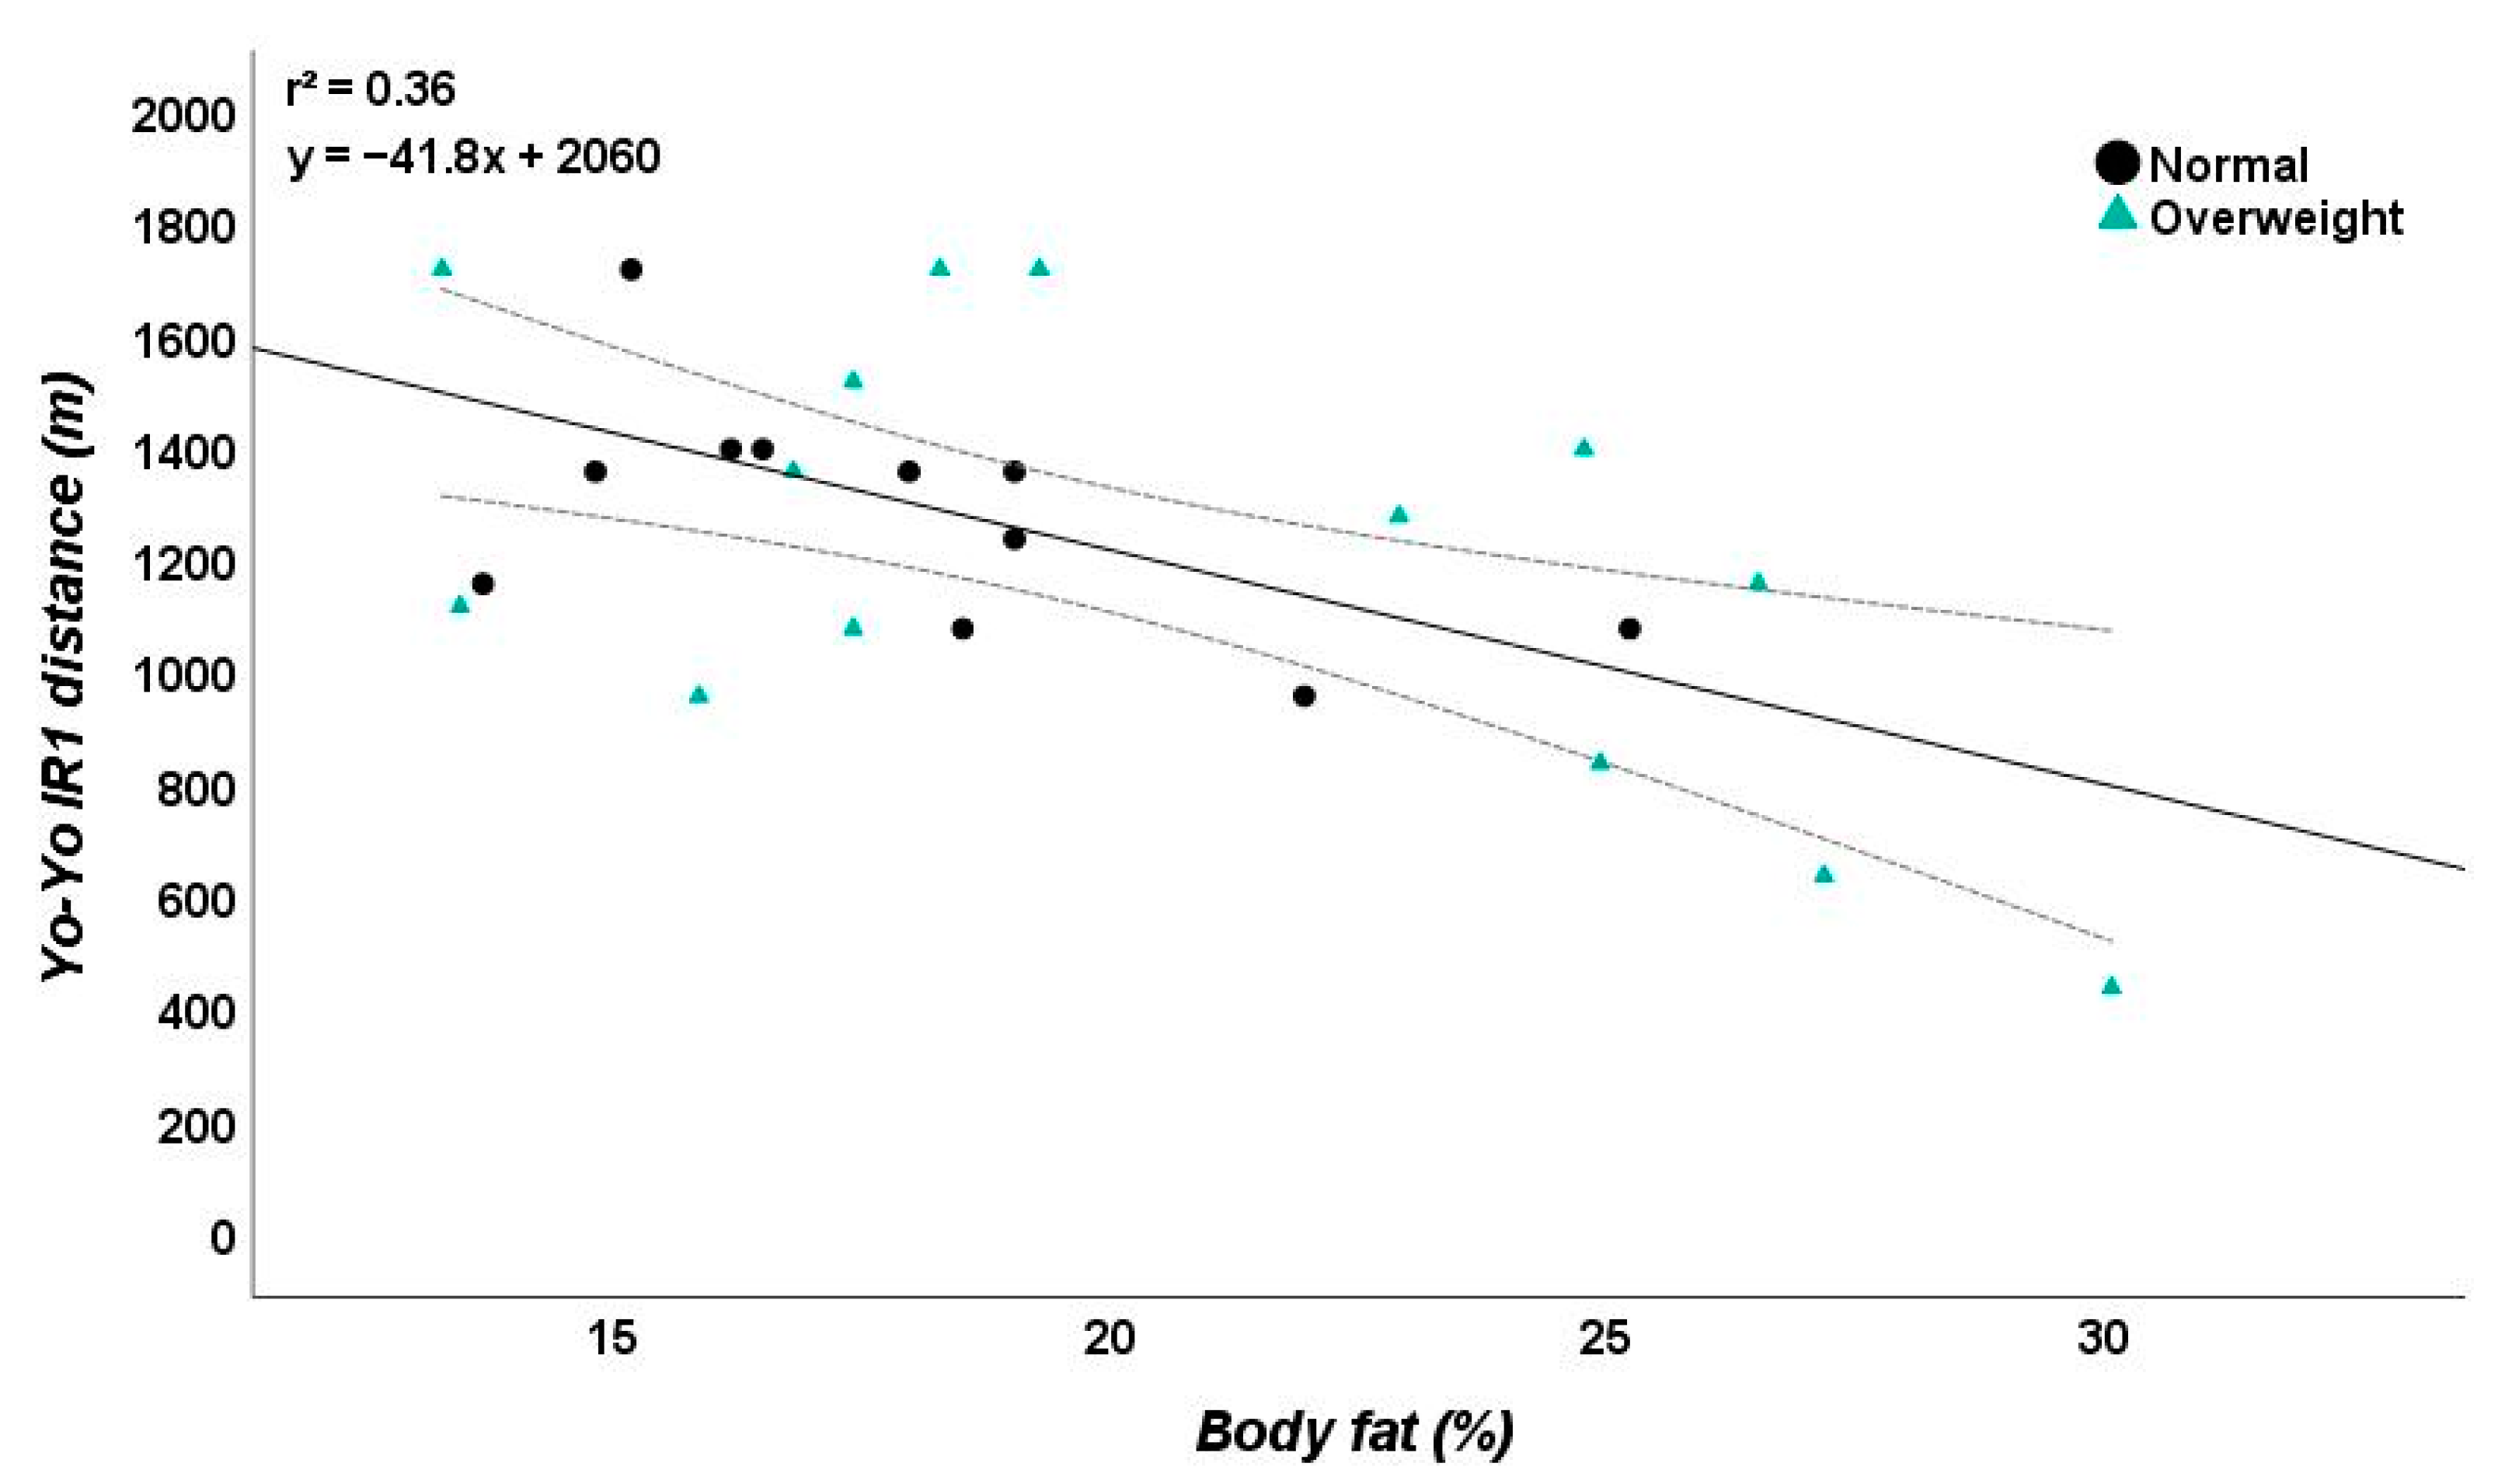
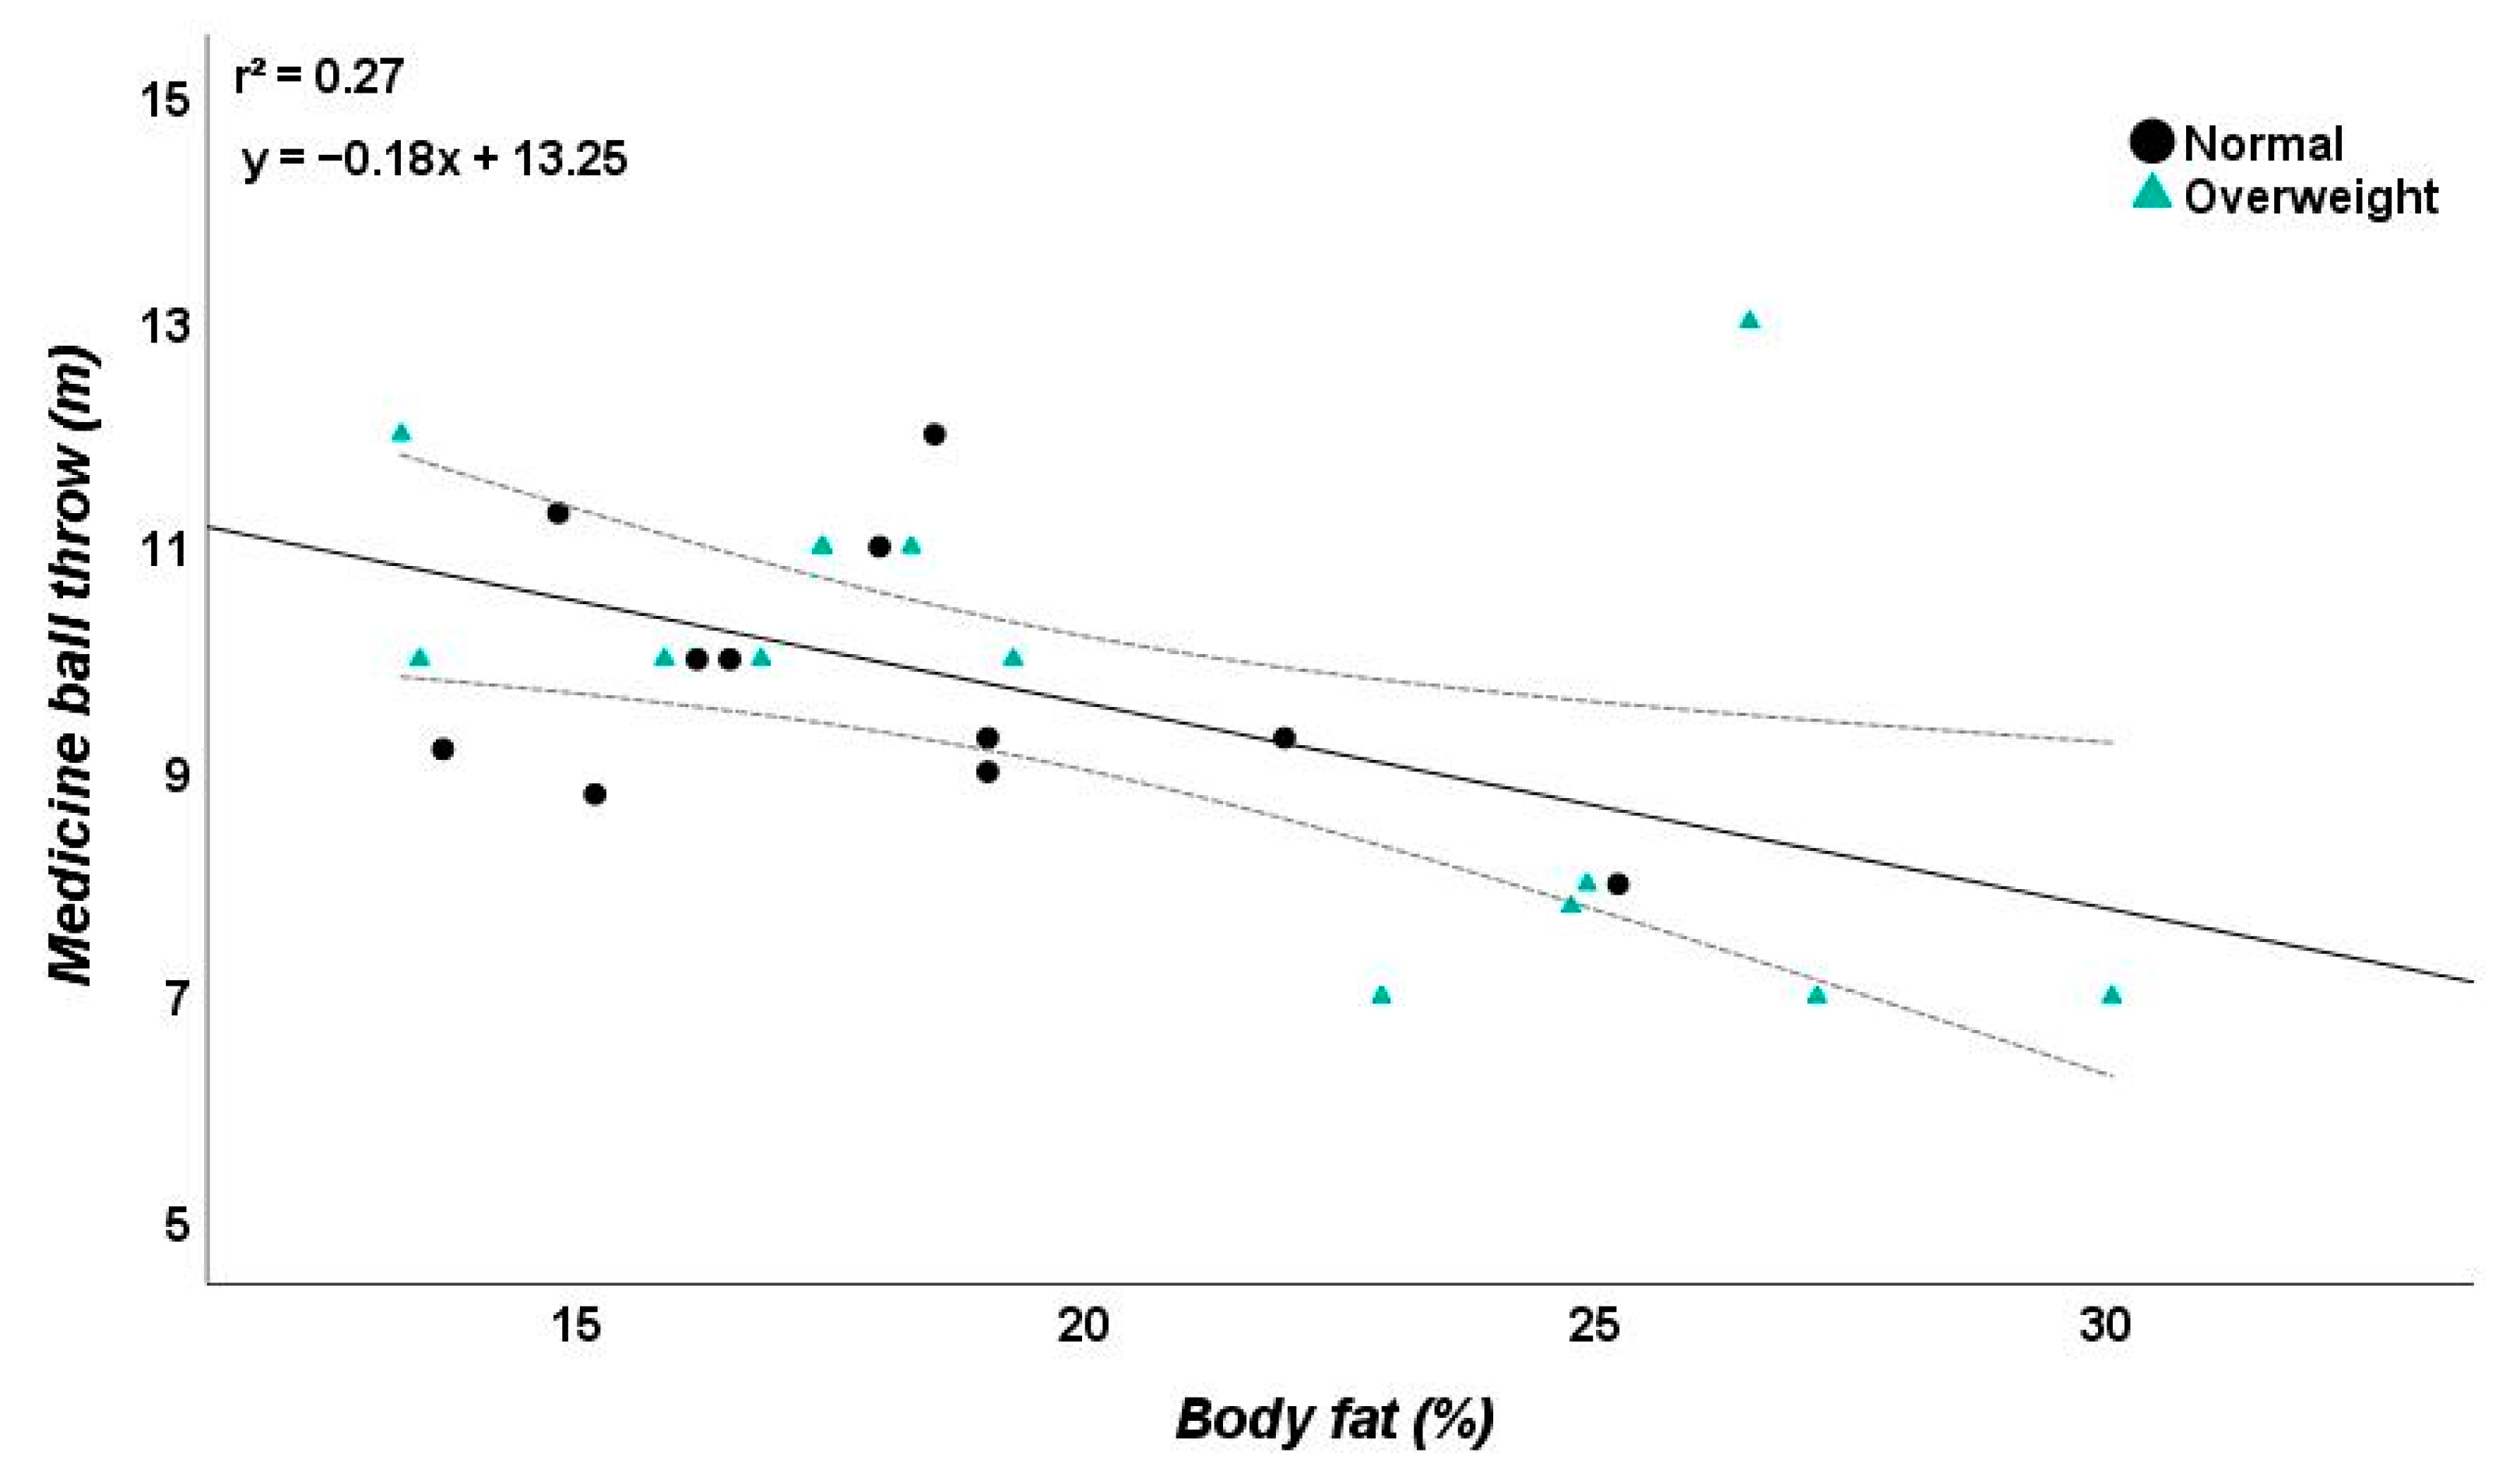
3.3. Relationships between Anthropometric and Physical Performance Parameters

Before the two-step linear regression analysis, the collinearity of anthropometric data (body height, body weight, and body fat) was checked using by bivariate Pearson’s product–moment correlation (r) calculation:
  • Body weight/body height: r = 0.320;
  • Body weight/body fat: r = 0.343;
  • Body height/body fat: r = −0.317.
Regarding the BMI, markedly higher relationships were found (body height: r = −0.521, body weight: r = 0.633, and %BF: r = 0.578). The two-step linear regression analysis with the predictors body height and body weight (step 1) and %BF (step 2) displayed an increase in the explained variance by adding %BF in the second step (Table 3). The r2 changes between the first and second steps ranged from 0.04 (CMJ and SJ) and 0.53 (agility T-half test).
The largest additional explained variances were calculated for the agility T-half test (0.53), 15 m sprint (0.38), and jump shot (0.31). Regarding CMJ (step 1: r2 = 0.18, step 2: r2 = 0.22) and SJ (step 1: r2 = 0.05, step 2: r2 = 0.09), no relevant influence of any predictor was observed. With the exception of sprint performance (β-coefficient for 15 m sprint: −0.07; β-coefficient for 30 m sprint: −0.06), a decreased %BF led to higher performance. For example, a reduction of 1% body fat induced a decrease in time in the agility T-half test of 0.09 s (Figure 1), an extension of the Yo-Yo IR1 distance by 32.3 m (Figure 2), and increased medicine ball throw by 23 cm (Figure 3).
The same reduction in %BF was related to decreased sprint performance (15 m sprint: 0.07 s, 30 m sprint: 0.06 s). This result corresponded to the results of the variance analysis (Table 2) for the parameter 15 m sprint. %BF had no effect on the sprint performances, and neither did the BMI categorization.

3.4. Relationships between the Anthropometric and Throwing Ball Velocity Parameters

Normal weight and overweight handball players did not show significant differences regarding their throwing performance parameters (Table 2). The largest difference was detected for jump shot (p = 0.083, ηp2 = 0.125). Normal weight subjects showed a higher throwing velocity (29.8 ± 4.30 m/s) than overweight athletes (26.4 ± 4.83 m/s).
All throwing parameters displayed the strongest relationships to body height, body mass, and body fat (step 2; Table 3). In sum, these anthropometric parameters showed the highest predictive potential for running shot (r2 = 0.65), jump shot (r2 = 0.61), and medicine ball throw (r2 = 0.57). The additional benefit of adding the parameter %BF was the smallest for running shot (r2 change: 0.13).

4. Discussion

The aim of this study was to examine anthropometry, physical fitness, and ball throwing velocity in normal weight and overweight male team handball players. In addition, we examined how %BF explained variations in fundamental field measures of physical fitness and ball throwing velocity. The primary finding of this study was that the anthropometry was different between the BMI groups (except for %BF). In this context, large anthropometric dimensions are ostensibly advantageous in handball [1,2,3,4]. Second, jumping, sprinting, and aerobic capacity were not different between the BMI groups, but we did observe BMI-related differences in the medicine ball throw. The findings confirmed previous observations about the negative effect of high %BF on both aerobic and anaerobic fitness [13,17], thereby corroborating our first hypothesis. After accounting for height and mass, %BF was able to explain a considerable amount of the performance differences. Indeed, height and mass played an important role regarding the throwing velocity (jump shot, running shot, and medicine ball throw) and aerobic capacity (Yo-Yo IR1 test). The addition of %BF generated the largest increase in the predictive ability of the regression model for the agility T-half test. The 15 m and 30 m sprints, jump shot, and medicine ball throw predictions also benefited significantly from adding %BF to the model (Table 3). The latter partially supported our second hypothesis stating that a relationship between %BF and physical performance would exist. In this study, we were able to quantify the unique contribution of %BF to performance and ball throwing velocity in professional handball players, which we propose is a strength of the present investigation.
Several studies have assessed adult male handball players’ anthropometry [1,2,3,4,5,6,7]. Yet, comparisons are complicated due to the divergent ages, playing positions, competition levels, and test procedures utilized. In terms of height and body mass, handball players appear to be between volleyball players, and soccer and field hockey players [9,17]. An unexpected yet pertinent finding of the present study was the incidence of overweightness given the average BMI of elite adult handball players. Consequently, the BMIs observed in our participants should not be attributed to sport-specific physiological adaptations. It is improbable that the high BMI reported here was solely due to an advantageous large lean mass alone, and this increased mass will not come without health consequences. The prevalence of overweightness in our sample warrants further investigation to determine causes of excessive body mass in team handball players and to develop interventions targeting body mass management [9]. A constant concern of coaches is to ensure that decreases in body mass and %BF occur with the preservation of lean mass.
In terms of performance parameters, a significant difference was detected between groups only for the CMJ (ηp2 = 0.227). The smallest differences were observed for the 15 m sprint (ηp2 = 0.001) and medicine ball throw (ηp2 = 0.003). For the 15 m sprint and agility T-half test, the performance of the overweight group was slightly higher than in the normal-weight group. These results may be useful for coaches and trainers, as they were based on tests that reflected specific characteristics of handball playing positions. The findings from the current study may aid in identifying performance potential and player development based on players’ anthropometry and fitness.

4.1. Anthropometrics and Aerobic Capacity

Overweightness impacted jumping performance to a large extent (p = 0.016, ηp2 = 0.227; normal weight vs. overweight). Stepwise regressions were used to quantify the contribution of %BF to physical performance, providing information regarding the specific role of %BF after adjusting for height and body mass. Body height and body mass alone (step 1) were only deterministic for throwing parameters, especially for the running shot (r2max = 0.52) and aerobic capacity. Together with %BF (step 2), we calculated the largest r2 for the running shot (0.65), jump shot (0.61), medicine ball throw (0.57), and agility T-half test (0.54). The agility T-half test was also the test with the largest increase in r2 (0.53). Even though the results are in line with the previous literature, it was necessary to consider the broader impact of %BF as a continuous variable on performance characteristics. This result is in accordance with studies indicating that a greater %BF is associated with lower aerobic fitness in children and adolescents [39,40]. This correlation has been relatively well explored in the general youth population [39,41] but the negative correlation between %BF and VO2max does not ubiquitously reach the a priori level of significance [42]. In adult male soccer players and youth basketball players, a negative effect of fatness has been reported on parameters of physical fitness, including both anaerobic and aerobic components [10,11]. In addition, Hermassi et al. [13] indicated that obesity impacted aerobic performance to a greater extent than anaerobic performance in obese and non-obese school-aged handball players. Accordingly, Mak et al. [43] revealed greater cardiorespiratory fitness and muscle endurance in normal-weight males compared to overweight males aged 12–18 years of age. In a corresponding age group of male adolescents (age range: 13–19 years), Artero et al. [44] demonstrated that overweight participants had lower aerobic fitness in most of the tests assessed. The findings of this investigation corroborate those of Duvigneaud et al. [45] and Bovet et al. [46] in a sample of male adolescents that were 12–15 years of age.
The possible differences in playing experience might have influenced the body compositions since some positions tended to have a higher %BF than the other players (pivots vs. wings). However, we did not have a large enough sample size to conduct statistical analysis to confirm this observation. However, it has been previously reported that playing position can influence %BF, as players of different positions are different in terms of body mass, BMI, arm span, and palm length. Fieseler et al. [2] reported that backs, pivots, and goalkeepers present greater body mass segments than wings, which are the shortest players with the least body mass in German professional male team handball. Due to the low negative associations between %BF and the sprint (15 and 30 m) and agility parameters, these measures need special interpretations concerning the effect of %BF.

4.2. Anthropometrics and Anaerobic Capacity

Based on the results presented here, the combination of body height and body mass is a sufficient predictor for the medicine ball throw (r2 = 0.29), Yo-Yo IR 1 distance (r2 = 0.29), jump shot (r2 = 0.30), and running shot (r2 = 0.52). The additional benefit of adding step 2 was greatest for the agility T-half test (r2 change: 0.53). The lowest predictive power for all anthropometric parameters was for SJ (r2 step 1: 0.05, step 2: 0.09). The largest additional explained variance was for the agility T-half test (0.53), 15 m sprint (0.38), and jump shot (0.31). A lower %BF resulted in greater performance in almost all parameters (except for sprinting and agility parameters). For example, a reduction of 1% body fat induced a 0.69 m/s increase in jump shot velocity, a 32 m extension of the Yo-Yo IR1 distance, and a 23 cm improved medicine ball throw.
When examining the effect of %BF on performance, participants with the highest %BF scored worse in the majority of tests. We propose that a threshold %BF may exist, above which, physical fitness is negatively affected [13,17]. Regression analyses indicated that, regardless of thresholds, increased %BF would negatively impact performance, including throwing and running, both of which are indispensable attributes in team handball.

4.3. Practical Applications and Limitations

The results of this study emphasize the importance of controlling body composition, primarily %BF, to optimize sporting performance. Thus, handball clubs should value the development of conditioning programs that are specifically aimed at controlling %BF. These results may be useful for coaches and trainers to develop position-specific training concepts as they are based on tests that reflect specific characteristics of individual playing categories. One limitation of the present study is the relatively small sample size and the single sex studied. However, it was our intention to examine only the highest level of performers, who are innately limited in number. To rectify this limitation, an increased sample size may add additional insight in future investigations but could reduce the specificity of the implications. Specifically, for comparisons between different field positions, the sample size of N = 25 is low.
Future studies may also wish to include the assessment of differences between sexes and position-specific somatotypes when considering relationships between anthropometry and physical performance in handball. Since this study was cross-sectional, it was impossible to investigate causality in the studied relationships, and temporal changes throughout the season could be of interest in future investigations. Finally, it may be advantageous for future investigations to include laboratory tests of fitness rather than field tests, as these allow for greater internal validity (although at the expense of ecological validity).

5. Conclusions

Professional team handball players from Qatar presented a %BF of 19.5 ± 4.7%, which is high for athletic populations. Players with a greater %BF showed inferior physical fitness. BMI was unable to differentiate between the fat and lean masses and players categorized by %BF, and therefore, is a poor predictor of physical performance. Major attention should be paid to multifactorial parameters to further expand the investigation of intra- and interrelationships between physiological and anthropometric characteristics, including %BF and the performance of handball players.

Author Contributions

Conceptualization, R.S. and S.H.; methodology, S.H.; software, S.H.; validation, S.H.; formal analysis, L.D.H. and S.H.; investigation, S.H.; resources, S.H.; data curation, R.S. and S.H.; writing—original draft preparation, S.H., R.S., and L.D.H.; writing—review and editing, S.H., L.D.H., and R.S.; visualization, R.S.; supervision, L.D.H. and S.H.; project administration, S.H.; funding acquisition, R.S. and S.H. All authors have read and agreed to the published version of the manuscript.

Funding

This publication was supported by Qatar University Student Grant QUST-1-CAS-2021-7. The findings achieved herein are solely the responsibility of the authors.

Institutional Review Board Statement

The study was conducted according to the guidelines of the Declaration of Helsinki, and approved by the Institutional Review Board of Qatar University (protocol code QU-IRB 1303-EA/20 and date of approval 6 May 2020).

Informed Consent Statement

Informed consent was obtained from all subjects involved in the study.

Data Availability Statement

The raw data supporting the conclusions of this article can be made available by the authors without undue reservation.

Acknowledgments

The authors would like to thank the coaches and handball players who participated in this study during the 2020/2021 season.

Conflicts of Interest

The authors declare no conflict of interest.

References

  1. Hermassi, S.; Laudner, K.; Schwesig, R. Playing level and position differences in body characteristics and physical fitness performance among male team handball players. Front. Bioeng. Biotechnol. 2019, 7, 149. [Google Scholar] [CrossRef] [PubMed]
  2. Fieseler, G.; Hermassi, S.; Hoffmeyer, B.; Schulze, S.; Irlenbusch, L.; Bartels, T.; Delank, K.S.; Laudner, K.G.; Schwesig, R. Differences in anthropometric characteristics in relation to throwing velocity and competitive level in professional male team handball: A tool for talent profiling. J. Sports Med. Phys. Fit. 2017, 57, 985–992. [Google Scholar] [CrossRef]
  3. Hermassi, S.; Laudner, K.G.; Schwesig, R. The effects of circuit strength training on the development of physical fitness and performance-related variables in handball players. J. Hum. Kinet. 2020, 71, 191–203. [Google Scholar] [CrossRef] [PubMed] [Green Version]
  4. Aloui, G.; Hermassi, S.; Hammami, M.; Cherni, Y.; Gaamouri, N.; Shephard, R.J.; van den Tillaar, R.; Chelly, M.S. Effects of elastic band based plyometric exercise on explosive muscular performance and change of direction abilities of male team handball players. Front. Physiol. 2020, 11, 604983. [Google Scholar] [CrossRef]
  5. Michalsik, L.B.; Madsen, K.; Aagaard, P. Physiological capacity and physical testing in male elite team handball. J. Sports Med. Phys. Fit. 2015, 55, 415–429. [Google Scholar]
  6. Karcher, C.; Buchheit, M. On-court demands of elite handball, with special reference to playing positions. Sports Med. 2014, 44, 797–814. [Google Scholar] [CrossRef]
  7. van den Tillaar, R. Effect of different training programs on the velocity of overarm throwing: A brief review. J. Strength Cond. Res. 2004, 18, 388–396. [Google Scholar] [CrossRef]
  8. Hermassi, S.; Chelly, M.S.; Bragazzi, N.L.; Shephard, R.J.; Schwesig, R. In-season weightlifting training exercise in healthy male handball players: Effects on body composition, muscle volume, maximal strength, and ball-throwing velocity. Int. J. Environ. Res. Public Health 2019, 16, 4520. [Google Scholar] [CrossRef] [Green Version]
  9. Hermassi, S.; Bragazzi, N.L.; Majed, L. Body fat is a predictor of physical fitness in obese adolescent handball athletes. Int. J. Environ. Res. Public Health 2020, 17, 8428. [Google Scholar] [CrossRef]
  10. Nikolaidis, P.T. Physical fitness is inversely related with body mass index and body fat percentage in soccer players aged 16–18 years. Med. Pregl. 2012, 65, 470–475. [Google Scholar] [CrossRef] [Green Version]
  11. Nikolaidis, P.T.; Asadi, A.; Santos, E.J.; Calleja-Gonzalez, J.; Padulo, J.; Chtourou, H.; Zemkova, E. Relationship of body mass status with running and jumping performances in young basketball players. Muscles Ligaments Tendons J. 2015, 5, 187–194. [Google Scholar] [CrossRef]
  12. Nikolaidis, P.T.; Ingebrigtsen, J. The relationship between body mass index and physical fitness in adolescent and adult male team handball players. Indian J. Physiol Pharm. 2013, 57, 361–371. [Google Scholar]
  13. Hermassi, S.; van den Tillaar, R.; Bragazzi, N.L.; Schwesig, R. The associations between physical performance and anthropometric characteristics in obese and non-obese schoolchild handball players. Front. Physiol. 2021, 11, 580991. [Google Scholar] [CrossRef] [PubMed]
  14. Michalsik, L.B.; Aagaard, P.; Madsen, K. Locomotion characteristics and match-induced impairments in physical performance in male elite team handball players. Int. J. Sports Med. 2013, 34, 590–599. [Google Scholar] [CrossRef]
  15. Zapartidis, I.; Koroasos, P.; Christodoulidis, T.; Skoufas, D.; Bayios, I. Profile of young handball players by playing position and determinants of ball throwing velocity. J. Hum. Kinet. 2011, 27, 17–30. [Google Scholar] [CrossRef]
  16. Hammami, M.; Hermassi, S.; Gaamouri, N.; Aloui, G.; Comfort, P.; Shephard, R.J.; Chelly, M.S. Field tests of performance and their relationship to age and anthropometric parameters in adolescent handball players. Front. Physiol. 2019, 10, 1124. [Google Scholar] [CrossRef] [PubMed] [Green Version]
  17. Hermassi, S.; Sellami, M.; Fieseler, G.; Bouhafs, E.G.; Hayes, L.D.; Schwesig, R. Differences in body fat, body mass index, and physical performance of specific field tests in 10-to-12-year-old school-aged team handball players. Appl. Sci. 2020, 10, 9022. [Google Scholar] [CrossRef]
  18. Fortina, M.; Maniscalco, P.; Carulli, C.; Meccariello, L.; Colasanti, G.B.; Carta, S. Jockey injuries during the Siena "Palio". A 72-year analysis of the oldest horse race in Italy. Injury 2019, 50 (Suppl. 4), S56–S59. [Google Scholar] [CrossRef]
  19. Rinonapoli, G.; Graziani, M.; Ceccarini, P.; Razzano, C.; Manfreda, F.; Caraffa, A. Epidemiology of injuries connected with dance: A critical review on epidemiology. Med. Glas 2020, 17, 256–264. [Google Scholar] [CrossRef]
  20. Szmodis, M.; Szmodis, I.; Farkas, A.; Mészáros, Z.; Mészáros, J.; Kemper, H.C. The relationship between body fat percentage and some anthropometric and physical fitness characteristics in pre- and peripubertal boys. Int. J. Environ. Res. Public Health 2019, 1, 1170. [Google Scholar] [CrossRef] [Green Version]
  21. Wagner, H.; Fuchs, P.X.; Von Duvillard, S.P. Specific physiological and biomechanical performance in elite, sub-elite and in non-elite male team handball players. J. Sports Med. Phys. Fit. 2018, 58, 73–81. [Google Scholar] [CrossRef]
  22. Womersley, J.; Durnin, J.V. An experimental study on variability of measurements of skinfold thickness on young adults. Hum. Biol 1973, 45, 281–292. [Google Scholar]
  23. Glatthorn, J.F.; Gouge, S.; Nussbaumer, S.; Stauffacher, S.; Impellizzeri, F.M.; Maffiuletti, N.A. Validity and reliability of Optojump photoelectric cells for estimating vertical jump height. J. Strength Cond. Res. 2011, 25, 556–560. [Google Scholar] [CrossRef]
  24. Krustrup, P.; Mohr, M.; Amstrup, T.; Rysgaard, T.; Johansen, J.; Steensberg, A.; Pedersen, P.K.; Bangsbo, J. The yo-yo intermittent recovery test: Physiological response, reliability, and validity. Med. Sci. Sports Exerc. 2003, 35, 697–705. [Google Scholar] [CrossRef] [PubMed]
  25. Chelly, M.S.; Fathloun, M.; Cherif, N.; Ben Amar, M.; Tabka, Z.; Van Praagh, E. Effects of a back squat training program on leg power, jump, and sprInt. performances in junior soccer players. J. Strength Cond. Res. 2009, 23, 2241–2249. [Google Scholar] [CrossRef] [PubMed] [Green Version]
  26. Sassi, R.H.; Dardouri, W.; Yahmed, M.H.; Gmada, N.; Mahfoudhi, M.E.; Gharbi, Z. Relative and absolute reliability of a modified agility t-test and its relationship with vertical jump and straight sprint. J. Strength Cond. Res. 2009, 23, 1644–1651. [Google Scholar] [CrossRef]
  27. Negrete, R.J.; Hanney, W.J.; Kolber, M.J.; Davies, G.J.; Ansley, M.K.; McBride, A.B.; Overstreet, A.L. Reliability, minimal detectable change, and normative values for tests of upper extremity function and power. J. Strength Cond. Res. 2010, 24, 3318–3325. [Google Scholar] [CrossRef] [PubMed]
  28. Bortz, J. Basic Principle of One-Factorial Analysis of Variance. In Statistics for Social Scientists; Springer: Berlin/Heidelberg, Germany; New York, NY, USA, 1999; pp. 237–249. [Google Scholar]
  29. Richardson, J.T.E. Eta squared and partial eta squared as measures of effect size in educational research. Educ. Res. Rev. 2011, 6, 135–147. [Google Scholar] [CrossRef]
  30. Cohen, J. Statistical Power Analysis for the Behavioural Sciences; Lawrence Earlbaum Associates: Hillside, NJ, USA, 1988; pp. 278–280. [Google Scholar] [CrossRef]
  31. Willimczik, K. Statistik im Sport: Grundlagen, Verfahren, Anwendungen, 3rd ed.; Czwalina: Hamburg, Germany, 1997; p. 259. [Google Scholar]
  32. Schrama, P.P.; Stenneberg, M.S.; Lucas, C.; van Trijffel, E. Intraexaminer reliability of hand-held dynamometry in the upper extremity: A systematic review. Arch. Phys. Med. Rehabil. 2014, 95, 2444–2469. [Google Scholar] [CrossRef]
  33. Shrout, P.E.; Fleiss, J.L. Intraclass correlations: Uses in assessing rater reliability. Psychol Bull. 1979, 86, 420–428. [Google Scholar] [CrossRef]
  34. Hopkins, W. Measures of reliability in sports medicine and science. Sports Med. 2000, 30, 1–15. [Google Scholar] [CrossRef] [Green Version]
  35. Portney, L.G.; Watkins, M.P. Foundations of Clinical Research: Applications to Practice, 3rd ed.; Pearson Prentice Hall: Upper Saddle River, NJ, USA, 2009. [Google Scholar]
  36. Hopker, J.; Myers, S.; Jobson, S.A.; Bruce, W.; Passfield, L. Validity and reliability of the Wattbike cycle ergometer. Int. J. Sports Med. 2010, 31, 731–736. [Google Scholar] [CrossRef] [Green Version]
  37. Cormack, S.J.; Newton, R.U.; McGuigan, M.R.; Doyle, T.L. Reliability of measures obtained during single and repeated countermovement jumps. Int. J. Sports Physiol Perform. 2008, 3, 131–144. [Google Scholar] [CrossRef] [Green Version]
  38. Brughelli, M.; Van Leemputte, M. Reliability of power output during eccentric sprInt. cycling. J. Strength Cond. Res. 2013, 27, 76–82. [Google Scholar] [CrossRef] [PubMed]
  39. Georgeson, A.; Lebenthal, M.; Catania, R.; Georgeson, S. Obesity and elevated blood pressure in suburban student athletes. BMJ Open Sport Exerc. Med. 2017, 3, e000276. [Google Scholar] [CrossRef] [PubMed]
  40. Liao, Y.; Chang, S.H.; Miyashita, M.; Stensel, D.; Chen, J.F.; Wen, L.T.; Nakamura, Y. Associations between health-related physical fitness and obesity in Taiwanese youth. J. Sports Sci. 2013, 31, 1797–1804. [Google Scholar] [CrossRef] [PubMed]
  41. Burns, R.; Hannon, J.C.; Brusseau, T.A.; Shultz, B.; Eisenman, P. Indices of abdominal adiposity and cardiorespiratory fitness test performance in middle-school students. J. Obes. 2013, 2013, 912460. [Google Scholar] [CrossRef] [PubMed] [Green Version]
  42. Shete, A.N.; Bute, S.S.; Deshmukh, P.R. A study of VO2max and body fat percentage in female athletes. J. Clin. Diagn Res. 2014, 8, BC01–BC03. [Google Scholar] [CrossRef] [PubMed]
  43. Mak, K.K.; Ho, S.Y.; Lo, W.S.; Thomas, G.N.; McManus, A.M.; Day, J.R.; Lam, T.H. Health-related physical fitness and weight status in Hong Kong adolescents. BMC Public Health 2010, 10, 88. [Google Scholar] [CrossRef] [Green Version]
  44. Artero, E.G.; Espana-Romero, V.; Ortega, F.B.; Jimenez-Pavon, D.; Ruiz, J.R.; Vicente-Rodriguez, G.; Bueno, M.; Marcos, A.; Gomez-Martinez, S.; Urzanqui, A.; et al. Health-related fitness in adolescents: Underweight, and not only overweight, as an influencing factor. the AVENA study. Scand. J. Med. Sci Sports 2010, 20, 418–427. [Google Scholar] [CrossRef]
  45. Duvigneaud, N.; Matton, L.; Wijndaele, K.; Deriemaeker, P.; Lefevre, J.; Philippaerts, R.; Thomis, M.; Deleclus, C.; Duquet, W. Relationship of obesity with physical activity, aerobic fitness and muscle strength in Flemish adults. J. Sports Med. Phys. Fit. 2008, 48, 201–210. [Google Scholar]
  46. Bovet, P.; Auguste, R.; Burdette, H. Strong inverse association between physical fitness and overweight in adolescents: A large school-based survey. Int. J. Behav. Nutr. Phys. Act. 2007, 4, 24. [Google Scholar] [CrossRef] [PubMed] [Green Version]
Figure 1. Relationship between body fat and agility depending on the group. Please note that one dot can represent several subjects.
Applsci 11 03492 g001
Figure 2. Relationship between body fat and aerobic capacity depending on the group. Please note that one dot can represent several subjects.
Applsci 11 03492 g002
Figure 3. Relationship between body fat and medicine ball throw distance depending on the group. Please note that one dot can represent several subjects.
Applsci 11 03492 g003
Table 1. Comparison of the test measurements obtained from the two testing sessions prior to the intervention (N = 25). The descriptive statistics (mean ± SD) and intrarater reliability analysis that were calculated for each test are presented. ICC ≥ 0.75 and CV ≤ 10% are marked in bold. SJ: squat jump, CMJ: countermovement jump.
TestSession One
Mean ± SD
Session Two
Mean ± SD
ICC
(95% CI)
CV (%)
(95% CI)
15 m sprint (s)2.49 ± 0.442.55 ± 0.450.99 (0.89–1.00)1.5 (1.1–2.3)
30 m sprint (s)4.44 ± 0.404.49 ± 0.410.99 (0.91–1.00)0.6 (0.4–0.9)
Agility T-half (s)6.25 ± 0.466.33 ± 0.440.98 (0.89–0.99)1.3 (1.0–2.1)
SJ (cm)39.3 ± 6.7138.5 ± 6.570.99 (0.84–1.00)1.1 (0.8–1.8)
CMJ (cm)45.7 ± 5.8644.8 ± 5.480.99 (0.87–1.00)1.3 (1.0–2.2)
Medicine ball overhead throw (m)9.71 ± 1.649.32 ± 1.490.97 (0.79–1.00)3.6 (2.7–5.6)
Jump shot (m/s)27.9 ± 4.8227.2 ± 4.710.99 (0.78–1.00)1.4 (1.0–2.1)
Running shot (m/s)31.4 ± 4.4130.9 ± 4.320.99 (0.88–1.00)1.1 (0.8–1.7)
Table 2. Participants’ physical characteristics by BMI category (normal weight vs. overweight) and a comparison of the parameters between both groups based on the first testing set. Data are presented as means ± standard deviation. Significant differences (p < 0.05 and ηp2 > 0.15) are marked in bold. SJ: squat jump, CMJ: countermovement jump, Yo-Yo IR1: yo-yo intermittent recovery test 1.
ParametersNormal Weight
(n = 11)
Overweight
(n = 14)
Total
(n = 25)
ANOVA
pηp2
Age (years)25.6 ± 5.825.3 ± 6.425.5 ± 6.00.9180.000
Anthropometric parameters
Body height (m)1.91 ± 0.061.84 ± 0.131.87 ± 0.110.0980.114
Body mass (kg)88.4 ± 6.297.8 ± 14.493.6 ± 12.30.0560.150
BMI (kg/m2)24.1 ± 0.829.0 ± 4.626.8 ± 4.20.0020.339
Body fat (%)18.0 ± 3.420.6 ± 5.419.5 ± 4.70.1800.077
Bicipital skinfold (mm)5.00 ± 1.909.25 ± 5.687.38 ± 4.860.0270.196
Tricipital skinfold (mm)11.4 ± 3.613.4 ± 6.812.5 ± 5.60.3800.034
Subscapular (mm)15.5 ± 6.618.4 ± 10.017.1 ± 8.70.4100.030
Suprailiac (mm)13.0 ± 6.318.2 ± 8.115.9 ± 7.70.0960.116
Performance parameters
15 m sprint (s)2.51 ± 0.442.48 ± 0.462.49 ± 0.440.8740.001
30 m sprint (s)4.38 ± 0.384.49 ± 0.434.44 ± 0.400.4890.021
Agility T-half (s)6.28 ± 0.476.22 ± 0.476.25 ± 0.460.7720.004
CMJ (cm)48.8 ± 4.743.3 ± 5.645.7 ± 5.90.0160.227
SJ (cm)40.8 ± 6.938.2 ± 6.639.3 ± 6.70.3610.036
Yo-Yo IR1 distance (m)1284 ± 2101211 ± 4001243 ± 3260.5940.013
Medicine ball over-head throw (m)9.81 ± 1.209.63 ± 1.969.71 ± 1.840.7910.003
Jump shot (m/s)29.8 ± 4.326.4 ± 4.827.9 ± 4.80.0830.125
Running shot (m/s)33.0 ± 2.130.1 ± 5.331.4 ± 4.40.1010.113
Table 3. Summary of the linear regression analyses for the anthropometric variables predicting the performance parameters. Body height and body mass were entered as predictors in step 1, while the percentage of body fat (%) was added in step 2. Nonstandardized regression coefficients (β) are given for each predictor. r2 > 0.5 marked in bold. SJ: squat jump, CMJ: countermovement jump, Yo-Yo IR1: yo-yo intermittent recovery test 1.
Parameters Nonstandardized
Regression Coefficient β
r2ChangeBody Height
(cm)
Body Mass
(kg)
Body Fat
(%)
CMJ (cm)Step 10.18 0.22−0.15
Step 20.220.040.16−0.10−0.28
SJ (cm)Step 10.05 0.14−0.02
Step 20.090.040.070.05−0.35
Medicine ball overhead throw (m)Step 10.29 0.070.02
Step 20.570.280.020.07−0.23
Yo-Yo IR1 distance (m)Step 10.29 16.9−8.64
Step 20.440.1510.1−2.53−32.3
15 m sprint (s)Step 10.01 0.010.01
Step 20.390.38−0.010.01−0.07
30 m sprint (s)Step 10.02 0.01−0.01
Step 20.300.28−0.010.01−0.06
Agility T-half (s)Step 10.01 0−0.01
Step 20.540.53−0.020.01−0.09
Jump shot (m/s)Step 10.30 0.18−0.21
Step 20.610.310.03−0.08−0.69
Running shot (m/s)Step 10.52 0.03−0.17
Step 20.650.130.02−0.09−0.41
Publisher’s Note: MDPI stays neutral with regard to jurisdictional claims in published maps and institutional affiliations.

