Article

Differences in Fitness and Academic Attainment between Obese, and Non Obese School-Age Adolescent Handball Players: An Explorative, Cross-Sectional Study

1
Physical Education Department, College of Education, Qatar University, Doha 2713, Qatar
2
School of Health and Life Sciences, University of the West of Scotland, Glasgow G72 0LH, UK
3
Department of Orthopaedic and Trauma Surgery, Martin-Luther-University Halle-Wittenberg, 06120 Halle, Germany
*
Author to whom correspondence should be addressed.
Appl. Sci. 2021, 11(9), 4185; https://doi.org/10.3390/app11094185
Submission received: 17 March 2021 / Revised: 21 April 2021 / Accepted: 29 April 2021 / Published: 4 May 2021
(This article belongs to the Special Issue Diagnostic and Interventions in Team Sports)

Abstract

:

Featured Application

This investigation observed differences in physical fitness and academic attainment between body fat-stratified adolescent team handball players. The findings suggest that physical fitness and obesity status in school-age adolescent handball players are important for health, but also for academic achievement. Physical educators, teaching staff, and school administrators should be aware that promoting a healthier lifestyle and reducing adiposity may improve dimensions of academic performance.

Abstract

This study investigated differences in physical fitness and academic attainment in obese and non-obese adolescent handball players. A total of 31 males (age: 15.5 ± 1.2 years; body mass: 77.8 ± 17.7 kg; height: 1.71 ± 0.10 m; body mass index (BMI): 26.8 ± 6.9 kg/m2; body fat: 26.4 ± 6.34%) from the Qatar handball first division participated and were divided into two body fat percentage (%BF) groups (i.e., obese or non-obese). Anthropometrics (height, mass, BMI, and %BF) and physical performance testing ability (T-half test for change-of-direction (COD); squat jump (SJ), countermovement jump (CMJ), and 10 and 15 m sprints; medicine ball throw (MBT), and aerobic capacity (Yo-Yo Intermittent Recovery Test level 1 (Yo-Yo IR1)) were determined. Academic attainment was determined through grade point averages (GPA). Non-obese participants had superior performances in mathematics (p < 0.001) and science (p = 0.013), agility T-half test (p = 0.001), CMJ (p < 0.001), and 15 m sprint (p = 0.019). Correlations were found between T-half test and mathematics (r = 0.500) and science (r = 0.484). To conclude, obese school-age handball players have poorer fitness and academic performances than normal body weight adolescents.

1. Introduction

Adolescent obesity and low physical fitness remain public health challenges in developed countries because they increase cardiovascular disease risk and premature mortality [1,2,3,4]. Adolescence is a period of substantial physical and cognitive development [2,3]. In this context, academic achievement is declining year-over-year, with a concomitant decrease in physical health [5,6]. Academic achievement and physical health are often discussed separately, yet obesity is associated with negative neurocognitive outcomes [7]. Positive relationships between physical activity levels and cognitive abilities, including memory, executive function, attention, processing speed, and language processing are reported in adolescents [8,9,10]. These findings are important since appropriate cognitive functioning enables adaptation to the environment and contributes to appropriate psychosocial development and mental health [11,12,13,14]. These cognitive outcomes are clearly mailable, as a recent meta-analysis of 20 studies reported weight loss improved performance across several cognitive domains [15].
Excess body fat, typically determined using body mass index (BMI) as a surrogate for fatness, is a major public health challenge [16]. Being overweight (BMI: 25–29 kg/m2) or obese (BMI: >30 kg/m2) is associated with poorer academic performance [17], and obese adolescents exhibit poorer attention, memory, executive function, and motor skills than non-obese peers and have a lower intelligence quotient (IQ) [18]. Physical fitness is conceivably an indicator of children’s and adolescents’ health, with cardiorespiratory fitness, muscular strength, and speed–agility being the primary outcomes [18]. Obesity exerts a negative effect on physical fitness, influencing several fitness variables when normalized to body mass (e.g., relative maximal oxygen uptake or power-to-mass) [18].
Considerable research has focused on the positive relationship between cardiorespiratory fitness and academic attainment [13,19,20]. Less investigated is the association of other fitness components such as agility, strength, and power with academic achievement [13]. Kao et al. [21] emphasized the value of exploring associations between cognitive health and muscular fitness.
Substantial evidence exists for the association between academic attainment and physical fitness [22,23,24], evidencing justification for increased physical fitness in adolescents to improve academic performance. Yet, few investigations concerned the association between obesity classification, academic achievement, and standardized fitness assessment test performance [17,22,25]. Many studies indicated more physically active children achieve superior academic attainment than less physically active children [26]. However, direct measures of fitness like muscle strength or speed were investigated less, with calls for additional research in this field [21]. A difficulty in this research area is with conflating physical activity and fitness. One risk mitigation strategy is to use one sports team, as physical activity patterns would be similar due to ubiquitous training volumes and closely matched intensities.
In 11–19-year-old athletes, 13% were obese when stratified by BMI vs. 6% based on percentage body fat (%BF) [27]. This means 62% were classified as false positives when using BMI as diagnostic criteria [27]. Moreover, 10% of rugby-playing boys were deemed overweight according to %BF percentiles [28]. These investigations showed a significant proportion of youth athletes categorized as overweight or obese utilizing %BF as criteria. Despite handball being a popular sport in European countries [29], no investigation has concerned the prevalence of excess body weight in adolescent male handball players and the effect on academic achievement and physical fitness in a sample of adolescent Qatari handball players.
Taken together, an examination of fitness components and the relationship with academic performance within one study is needed, as this could have implications for long-term athletic development (LTAD) [30,31]. Therefore, this investigation examined academic attainment (e.g., science and mathematics) and physical fitness in obese and non-obese adolescent handball players in Qatar. The primary aim was to identify physical fitness and academic attainment in young handball players stratified based on %BF-determined obesity. A secondary aim was to examine interactions between physical fitness, %BF, and academic attainment. We hypothesized a priori that differences in physical fitness and academic achievement would be apparent between obese and non-obese adolescent handball players. In addition, we hypothesized an association between fitness and academic performance would be present.

2. Materials and Methods

2.1. Experimental Approach to the Problem

The investigation was conducted from January to February 2021 during an in-season period. Testing was performed at the time on a standard indoor handball court (from 6:00 p.m. to 8:00 p.m.), under comparable environmental conditions (temperature: 22.5 ± 0.5 °C; relative humidity: 60 ± 5%), ≥3 days after a competitive match to allow for recovery. Participants were advised to maintain habitual dietary intake and avoid caffeine-containing beverages for 4 h prior to testing. Participants arrived for testing >2 h prandial. Participants abstained from vigorous physical activity for 24 h before testing. Assessments were performed over four days in the same sequence to cause similar order effects. On the first day, anthropometric measurements and jump tests (squat jump (SJ) and countermovement jump (CMJ)) were completed. On the second day, sprint tests were completed; on the third day, agility T-Half test and medicine ball throw (MBT) were completed, and on the fourth and final day, the Yo-Yo IR1 test was conducted. Approximately two weeks later, assessments from day 1 to day 3 were repeated for test-retest reliability determination, with the second data set considered for analysis. Body composition measurements and Yo-Yo IR1 were conducted once due to time constraints and participant availability.

2.2. Subjects

We work continuously with youth handball players to provide scientific support to inform training methods. Therefore, nonprobabilistic convenience sampling was utilized within this study [32]. A total of 31 male adolescent handball players (age: 15.5 ± 1.2 years; body mass: 77.8 ± 17.7 kg; height: 1.71 ± 0.10 m; BMI: 26.8 ± 6.9 kg/m2; body fat: 26.4 ± 6.34%; non-obese: n = 17, obese: n = 14) from the Qatar first division with a playing experience of 5.05 ± 0.94 years participated. Backs or wings composed 77% (n = 24) of all players (1 playmaker, 3 goalkeepers; 3 pivots; 17 backs; 7 wings). There were six left-handed (non-obese: n = 3) players and 23 right-handed players (non-obese: n = 14). Regarding playing positions (Chi-Squared: 2.747, p = 0.601) and being left or right-handed (Chi-Squared: 0.070, p = 0.791), no significant group difference was detected. Participants did not exhibit any injuries for four weeks before the study, and players trained 5.1 ± 0.05 h·week−1 and routinely competed in one competitive match per week. Prior to the study, participants and/or guardians gave written informed consent or assent in accordance with the Declaration of Helsinki. This investigation was granted ethical approval by the university’s review board (QU-IRB 1163-EA/19).

2.3. Testing Schedule

2.3.1. Anthropometry

All anthropometry was previously described [33,34] and published open access. Briefly, mass, status, and BMI were determined sing standard techniques. %BF was determined by the four-site skinfold method with Harpenden calipers and age-specific Durnin–Womersley equations [35]. Cutoff values specific to those aged ≤17 years (i.e., 31% %BF for obesity) were used to define obese and non-obese [36].

2.3.2. Physical Performance

All physical performance was previously described [33] and published open access, so methods are described briefly to avoid replication.
  • Squat (SJ) and Counter Movement Jump (CMJ) Tests
SJ and CMJ were assessed with photoelectronic cells from contact time and flight time with an accuracy of 1 kHz.
  • Sprint Tests
From standing, participants sprinted 15 m. Paired photocells recorded times at 15 m and 30 m.
  • Ability to Change Direction (T-Half Tests)
T-Half test [37] data were determined using electronic timing sensors.
  • Medicine Ball Overhead Throw
MBTs [38] were completed with a 3 kg medicine ball with a diameter of 21.5 cm.
  • The Yo-Yo Intermittent Recovery Test Level 1 (Yo-Yo IR1)
The Yo-Yo IR1 test was completed as previously described [39]. Participants completed 20 min shuttle runs at increasing velocities until exhaustion, interspersed by 10 s active recovery. Trials were stopped if subjects did not reach the front line in time twice or felt unable to maintain required speed.

2.3.3. Academic Attainment

Academic attainment was obtained via internal records from the school. Grade Point Average (GPA) and percentage scores in science and mathematics were acquired from the first semester of the 2020–2021 academic year. Two academic subjects were incorporated as a result of our interest in science-related disciplines as fitness is particularly important for subjects with a reliance on executive cognition [40].

2.4. Statistical Analysis

All analysis was performed on a Statistical Package for the Social Sciences (SPSS) version 25.0 (IBM, Armonk, NY, USA). The intraclass correlation coefficient (ICC) and the coefficient of variation (CV) described test-retest reliability [41]. Reliability was based on previously reported guidelines [42,43,44,45].
A power calculation (nQuery Advisor 4.0; Statistical Solutions, Saugus, MA, USA) showed n = 7 in each group; we detected a mean difference of 3.0 cm in CMJ height using a two-sided t-test with α level of 0.05 and a pooled standard deviation (SD) of 2.0 cm, with a statistical power of 0.8 [46].
Data were tested for normal distribution (Shapiro–Wilk Test) and homogeneity of variance (Levene’s Test). Anthropometric and performance differences between %BF groups were examined by one-way analysis of variance (ANOVA). We considered differences meaningful if p < 0.05, partial eta-squared (ηp2) > 0.15, and observed power >0.60 [46,47] to avoid overestimation of differences. Pairwise comparisons were conducted using T-tests with Bonferroni correction (0.05/17, or p = 0.003) to protect against Type I error [46].
To determine relationships between academic, anthropometric, and fitness variables, we used Pearson’s product moment correlation coefficients (r), which were interpreted using Cohen’s thresholds [48].

3. Results

3.1. Intrarater Reliability

All six fitness tests had excellent relative reliability (ICC ≥ 0.75). ICC ranged from 0.94 (30 m sprint) to 1.00 (agility T-half test). All variables had excellent absolute reliability, with CV < 10% (as illustrated in Table 1).

3.2. Normal Distribution and Variance Homogeneity

Only six variables (age: p = 0.002; bicipital skinfold: p = 0.020; suprailiac: p = 0.025; Yo-Yo IR1: p = 0.010; mathematics: p = 0.003; science: p = 0.028) were not normally distributed. Four parameters (mass: p = 0.036; %BF: p = 0.033; mathematics: p = 0.026, SJ: p < 0.001) were heterogenous in variance. Otherwise, all p-values were > 0.053 (BMI), indicating variance of other variables was heterogenous.

3.3. Age and Anthropometric Data

Except for height (p = 0.382, ηp2 = 0.027) and age (p = 0.836, ηp2 = 0.002), all variables were significant different between groups (as illustrated in Table 2). The greatest difference was observed for subscapular skinfold (p < 0.001, ηp2 = 0.770), suprailiac skinfold (p < 0.001, ηp2 = 0.770), body fat (p < 0.001, ηp2 = 0.766), and tricipital skinfold (p < 0.001, ηp2 = 0.697).

3.4. Physical Fitness

Except MBT (non-obese vs. obese: 7.75 ± 0.93 m vs. 8.12 ± 0.86), non-obese participants showed the greatest performance (as illustrated in Table 3). Significant group differences only existed for CMJ (p < 0.001, ηp2 = 0.425), the agility T-half test (p = 0.001, ηp2 = 0.305), and 15 m sprint (p = 0.019, ηp2 = 0.175). The Yo-Yo IR1 distance was not significantly different (p = 0.160, ηp2 = 0.067) between non-obese (824 ± 293 m) and obese athletes (686 ± 225 m).

3.5. Academic Performance

For both academic parameters, significant differences between groups were observed, and the non-obese athletes showed superior performance than obese subjects (as illustrated in Table 3). The largest group difference was observed in mathematics (p < 0.001; ηp2 = 0.367), comparable with science (p = 0.013; ηp2 = 0.195). The association between mathematics and science was r = 0.547.

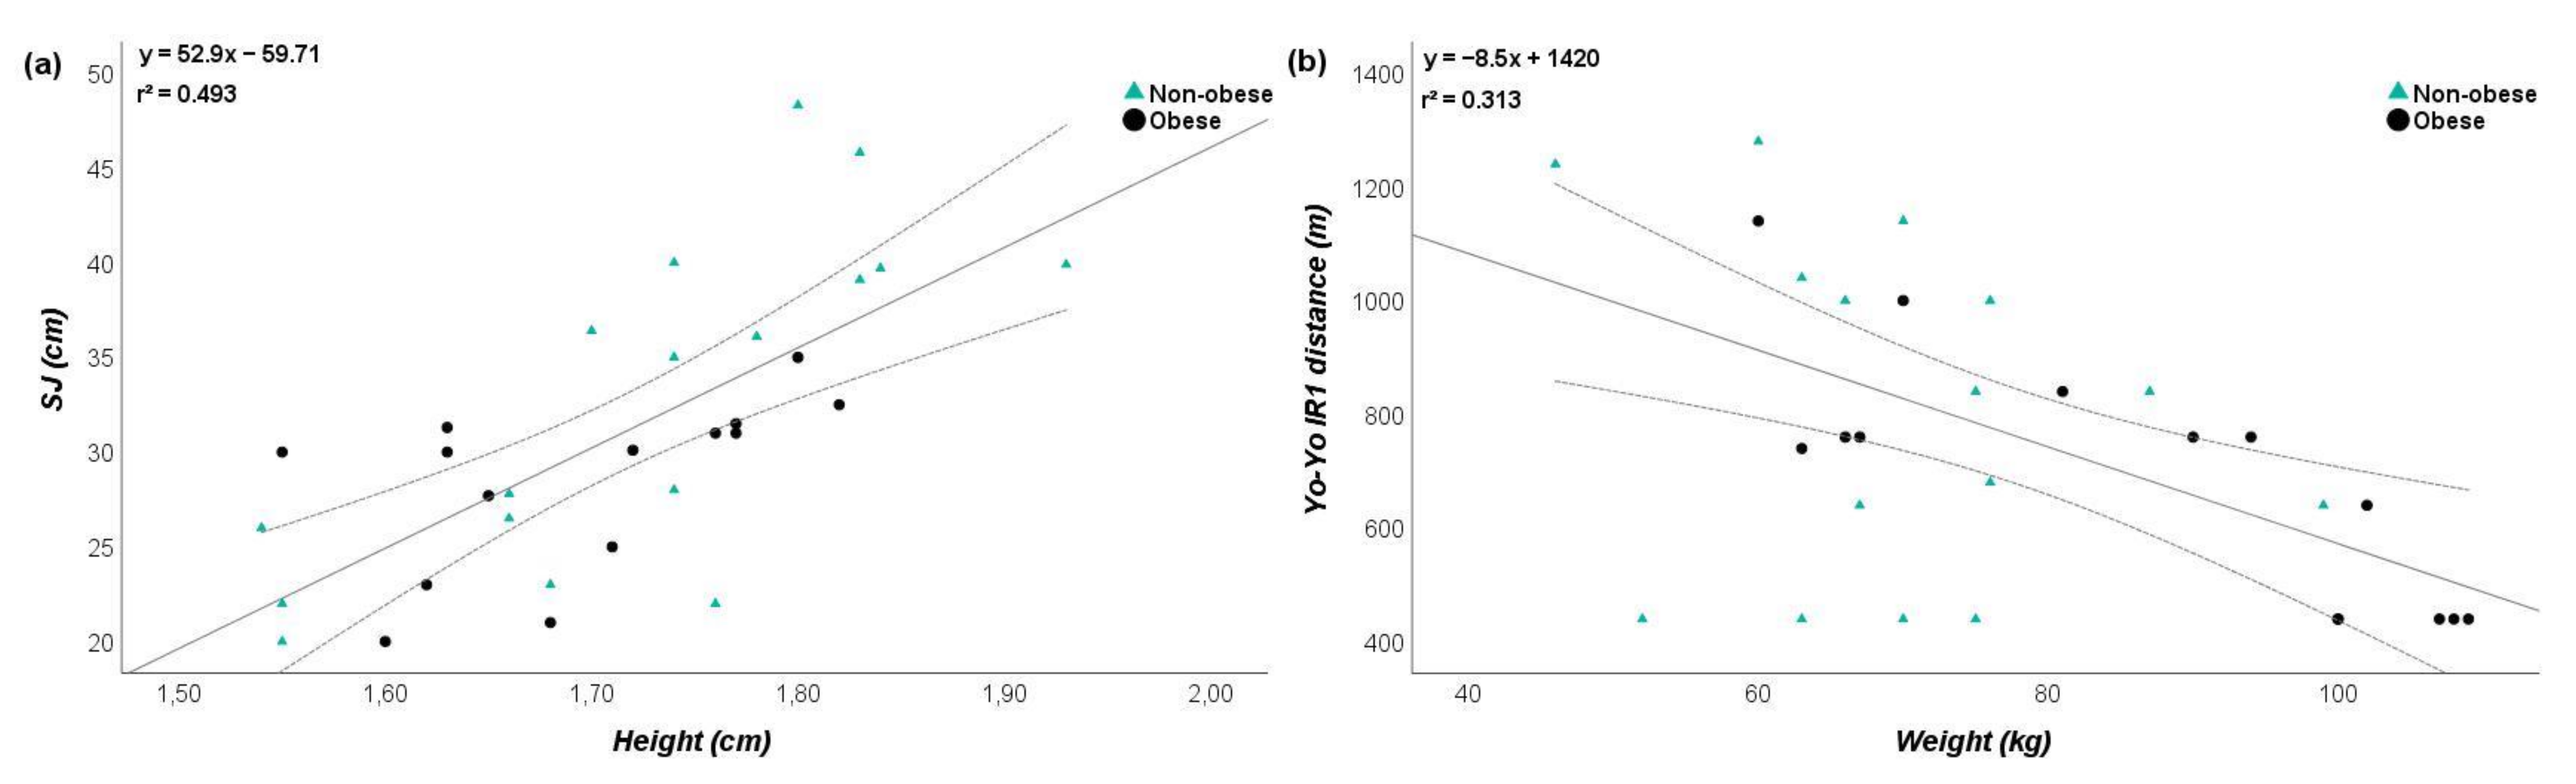
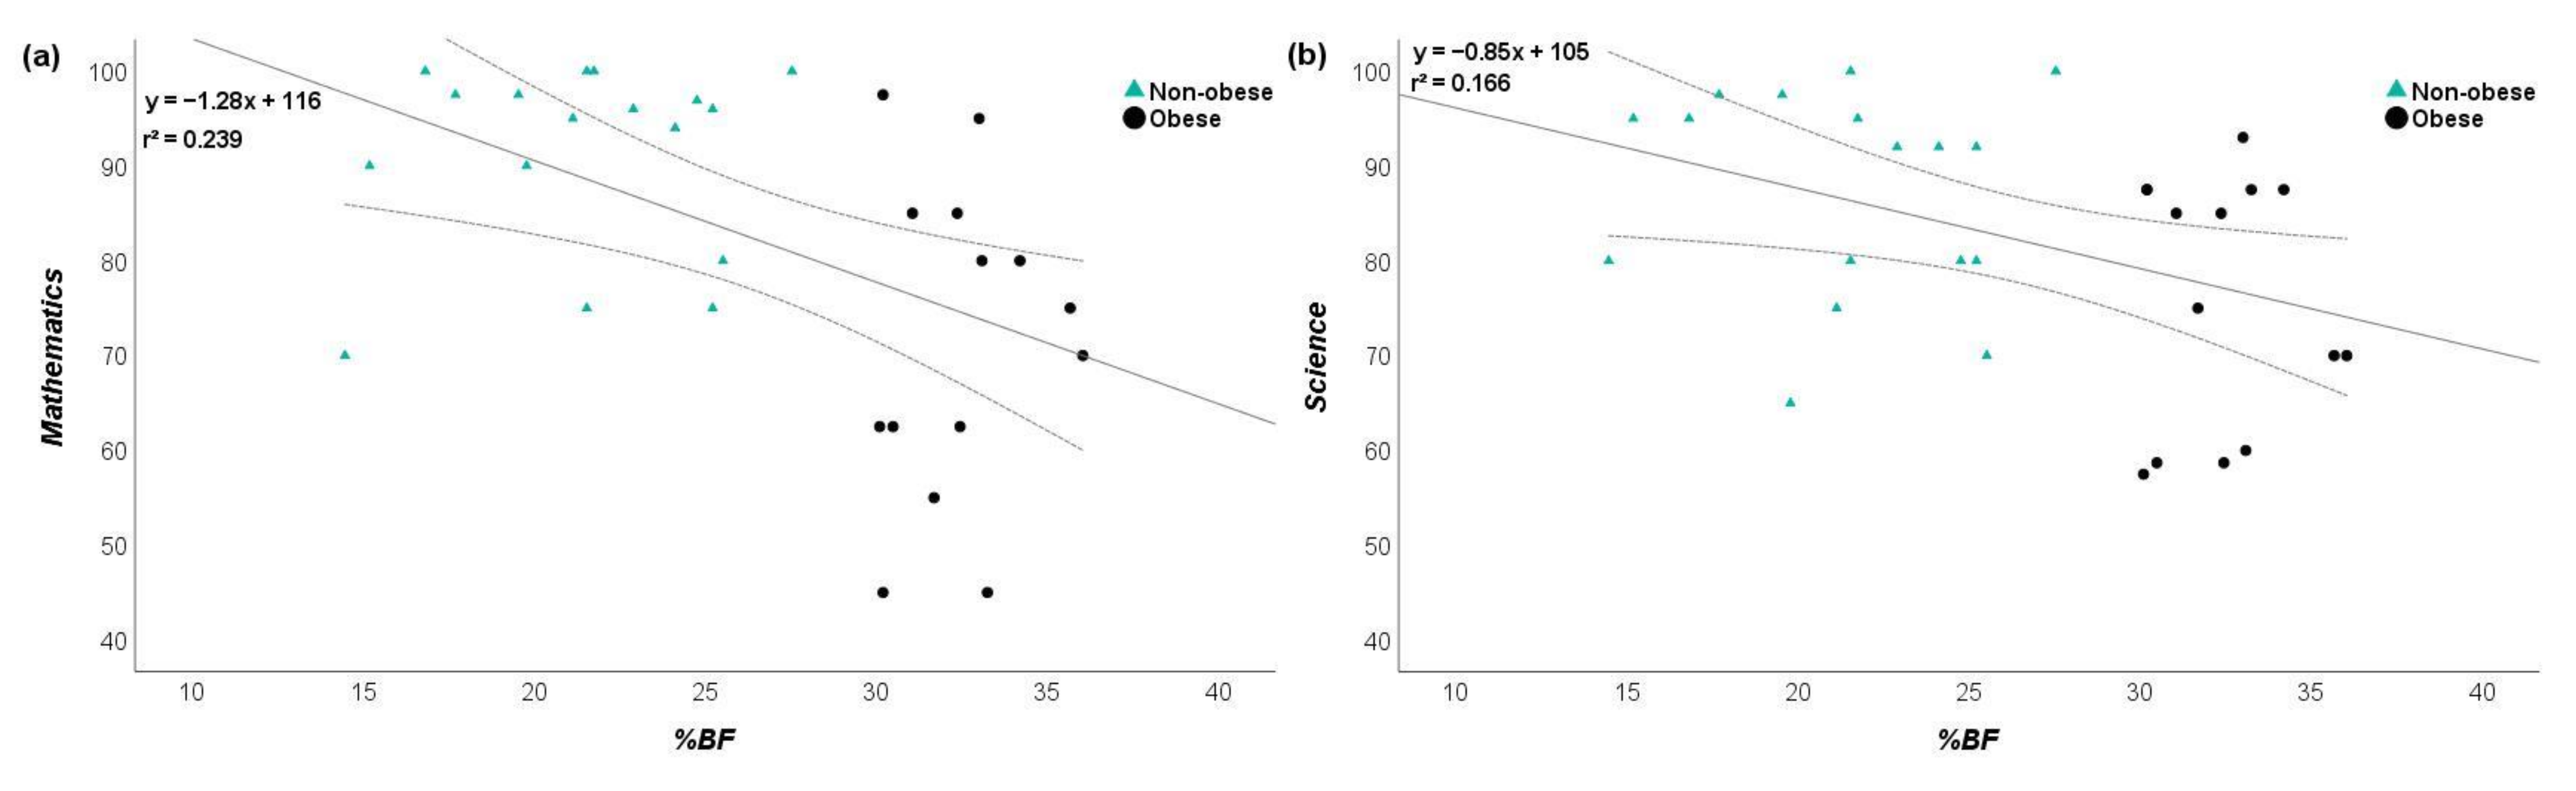
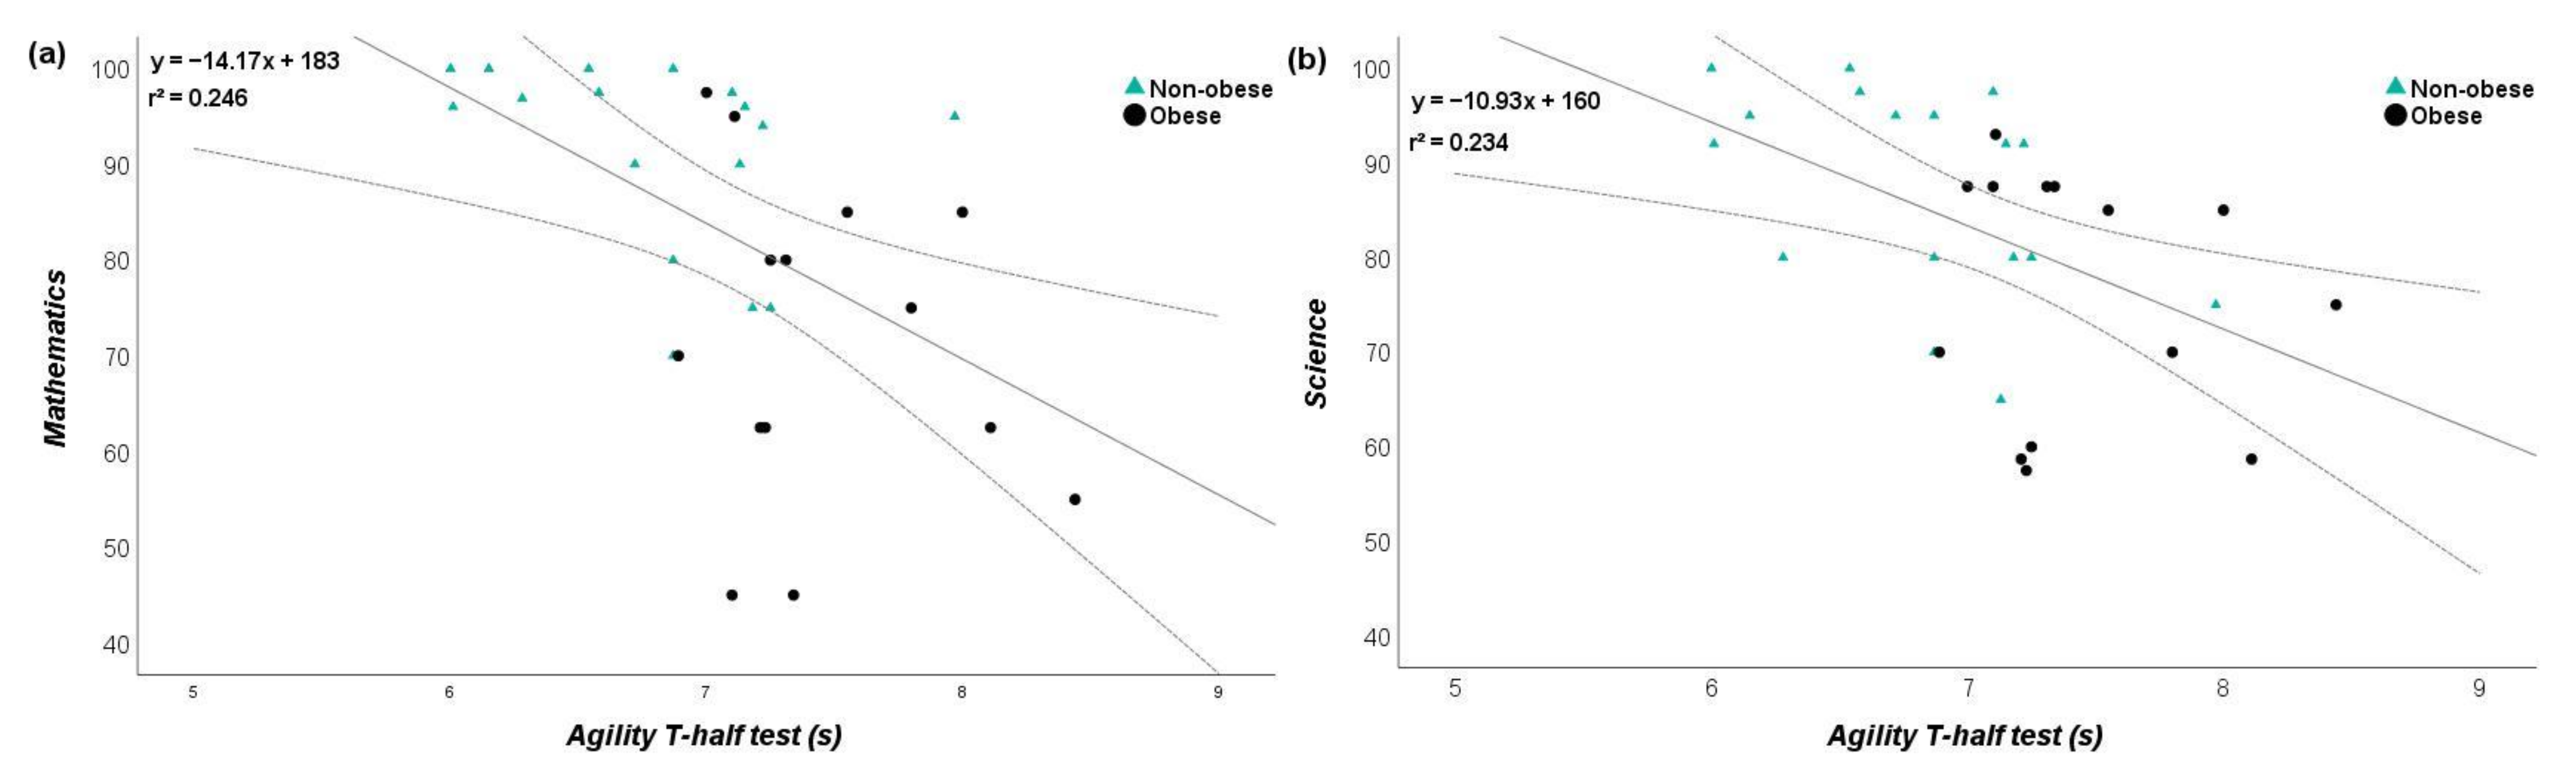
3.6. Relationships between Parameters

The following relevant (r > 0.5) correlations were observed:
  • Height vs. SJ: r = 0.702 (as illustrated in Figure 1a)
  • Weight vs. Yo-Yo IR1: r = −0.559 (as illustrated in Figure 1b)
  • BMI vs. 15 m sprint: r = 0.533
  • Suprailiac skinfold vs. CMJ: r = −0.527
  • Subscapular skinfold vs. CMJ: r = −0.509
  • Weight vs. CMJ: r = −0.505
From the anthropometric variables, only %BF showed a notable correlation with mathematics (r = −0.488; as illustrated in Figure 2a) and science (r = −0.408; as illustrated in Figure 2b). The agility T-half test was the only physical performance parameter with a relevant correlation with mathematics (r = −0.496; as illustrated in Figure 3a) and science (r = −0.484; as illustrated in Figure 3b).

4. Discussions

Our primary finding was that, in general, non-obese participants exhibited the greatest performance. Significant group differences existed for CMJ, COD ability, and 15 m sprint, consistent with observations of poorer health-related fitness in overweight and obese youth and adolescents [18]. Furthermore, academic achievement (e.g., mathematics and science) was lower in the overweight/obese students. The greatest difference between groups in academic performance was observed in mathematics. Anaerobic fitness (e.g., jumping, sprinting, and throwing) were unrelated to academic performance. These data suggest physical fitness and obesity may be important determinants of health and academic attainment, even in a homogenous group of handball players with similar training behavior.

4.1. Physical Performance

As hypothesized, obesity influenced physical fitness in young handball players. School-age handball players were stratified based on age-specific values of %BF as obese or non-obese. Between groups, BMI (ηp2 = 0.243) was less different than %BF (ηp2 = 0.766). Such a finding implies BMI is a poor surrogate for obesity (which is purportedly a disease of excessive fatness, although not if measured by BMI) in adolescent athletes [49,50].
The difference in sprint times between groups ranged from 8% (30 m sprint) to 9% (15 m sprint). This has implications for player success as players sprint for ~10–30 m in game-defining epochs [51]. Recently, it was reported that normal weight schoolchildren players showed greater performance in jumping, but not for sprinting [33], and our data corroborate these conclusions.
Concerning MBT, the difference between groups was 5%. Since muscle strength and power are imperative for ball throwing velocity, the MBT is an ecologically valid test to measure upper limb power in team handball players [51]. Greater upper limb power and strength ae advantageous for obese players in this regard [33]. However, we postulate that the greater upper limb strength and power in the obese players does not compensate for the disadvantages in other physical tests observed herein.
For CMJ, differences between obese and non-obese groups existed at the p < 0.01 level within this study. The difference in jumping between groups ranged from 13% (SJ) to 18% (CMJ). These effects likely occurred because of having less body mass to accelerate against gravity, and we therefore suggest relative power is imperative in team handball. As handball is a contact sport, whereby hitting, blocking, jumping, and pushing are commonplace, muscle strength and power are needed to compete [49,50].
Agility is well-described as an important attribute in most invasion games, and handball requires the same [49,50]. COD differences were present between groups herein, but differences in agility may become amplified on further growth in our participants as peak rate of agility development often occurs after 15 years of age [52,53,54,55,56].
In terms of Yo-Yo IR 1 performance, the obese group were 17% worse than the non-obese group. Recently, it was reported that the difference between normal weight and overweight schoolchildren athletes in Yo-Yo IR 1 was 27% [49]. In our study, surreally, Yo-Yo IR1 distance was not different between non-obese (824 ± 293 m) and obese athletes (686 ± 225 m) at the p < 0.05 level. Aerobic fitness is an important constituent in handball [35].

4.2. Academic Performance

The present data corroborate previous cross-sectional studies that observed that fitter students exhibited greater academic attainment [17,57]. Multiple psychosocial components purportedly expound the role of physical fitness in academic attainment [58]. In academic parameters, the non-obese group had a significantly higher mean performance than the obese group. The observed difference between groups was greater for mathematics (ηp2 = 0.367) than for science (ηp2 = 0.195). In addition, the COD ability was the only fitness parameter with a relevant correlation with mathematics and science. Regarding relationships between %BF and academic performance (science and mathematics), two relevant correlations were detected supporting a substantial body of literature demonstrating that obesity and lower academic attainment are related early in life [59].
Academic performance and %BF are reportedly negatively correlated in children [60], supporting our data. A recent systematic review noted a relationship between obesity, cognitive function, and academic attainment in adolescents [61]. In the present study, obese participants had poorer academic achievement, suggesting that being obese during adolescence has profound academic consequences. Conversely, others reported obesity did not affect academic achievement in children [23,62]. Although the reasons for this divergence are unclear, differences in methods for diagnosing obesity, participant characteristics, growth stages, or analysis procedures for academic attainment [18,23] may explain the ambiguity. Few previous studies demonstrated meaningful effect sizes for the influence of obesity on academic attainment, and based on Cohen’s thresholds [48], the present magnitudes were also classified as “small”.
The agility T-half test had the strongest correlations with mathematics and science. This is interesting as there is a dearth of research examining associations with change-of-direction ability or speed and academic attainment. Here, no relationship between sprint speed and academic performance was observed, but the meaningful correlation between change-of-direction ability and academic achievement corroborates some previous literature [63]. Mechanisms to explain this phenomenon remain unelucidated, and further investigation is required to elaborate on the association between agility and academic attainment.
We observed no relationship between strength, jumping, and aerobic capacity and academic performance, in line with several previous studies which did not report a relationship between muscular strength and academic attainment [21,64]. However, some investigations supported the notion of aerobic fitness as a predictor of academic attainment [12,65], in contrast to our report.
Obese adolescents have lower intelligence quotient (IQ) and poorer memory, attention, and executive function in comparison with that of normal weight contemporaries [18]. Recently, research regarding relationships between academic attainment and body mass, physical activity, and physical fitness proliferated [17]. However, evidence supporting an omnipresent positive linear relationship between body composition and academic attainment remains inconclusive as [65,66] inverse relationships were also reported [67,68].
Whilst a substantial body of literature centers on the degree to which educational achievement forecasts body mass in adulthood, an increasing amount of research focuses on the reverse causality (i.e., whether body mass determines educational outcomes) [33]. Results suggest obesity is not associated with lower test scores [69] but does associate with lower GPA [70]. This is puzzling, as one may assume lower test scores would result in lower GPA; the reason is likely multifactorial, caused by several psychosocial constraints within the classroom setting.

4.3. Limitations

A sexual maturity indicator for participants was not performed in this study; this is a limitation as growth spurt timing differences could influence %BF and relationships between %BF and fitness. In addition, each body composition component (muscle, bone, etc.) have their own temporal changes. Nevertheless, participants were within a narrow age range, which conceivably ameliorated this effect. Regardless, for scientific rigor, future investigations should incorporate sexual maturation assessment when examining relationships between anthropometry and physical performance in adolescents. A secondary limitation is that since the study was cross-sectional, it is difficult to attribute causality. The main methodological limitation here, however, was the absence of a nonathletic control group.

5. Conclusions

The present investigation examined physical fitness and academic attainment in %BF-diagnosed obese and non-obese adolescent handball players. The non-obese group possessed better jumping ability and agility and superior academic achievement than the obese group. These data suggest poor physical fitness and obese levels of %BF in boys could negatively influence academic achievement, independent of training habits. Future studies with additional parameters (e.g., lean mass and sexual maturation status) are required to confirm our preliminary observations.
With the backdrop of the current COVID-19-induced reduction in physical activity and limited school operation in this age group, these results may have social relevance which will probably become evident later in life, as legacy effects manifest.

Author Contributions

Conceptualization, S.H.; methodology, S.H.; software, S.H.; validation, R.S., L.D.H. and S.H.; formal analysis, L.D.H.; investigation, S.H.; resources, S.H.; data curation, R.S. and L.D.H.; writing—original draft preparation, S.H., L.D.H. and R.S.; writing—review and editing, S.H., L.D.H. and R.S.; visualization, R.S.; supervision, L.D.H.; project administration, S.H.; funding acquisition, S.H. All authors have read and agreed to the published version of the manuscript.

Funding

This publication was supported by Qatar University Student Grant QUST-1-CAS-2020-33. Findings reported herein are solely the responsibility of the authors.

Institutional Review Board Statement

The study was conducted according to the guidelines of the Declaration of Helsinki and approved by the Institutional Review Board of QATAR UNIVERSITY (protocol code QU-IRB 1163-EA/19 and date of approval 6 November 2019).

Informed Consent Statement

Informed consent was obtained from all subjects involved in the study.

Data Availability Statement

The raw data supporting the conclusions of this article will be made available by the authors, without undue reservation.

Acknowledgments

The authors would also like to thank the coaches and handball players who participated in this study during the 2020/2021 season.

Conflicts of Interest

The authors declare no conflict of interest.

References

  1. Páez-Maldonado, J.A.; Reigal, R.E.; Morillo-Baro, J.P.; Carrasco-Beltrán, H.; Hernández-Mendo, A.; Morales-Sánchez, V. Physical Fitness, Selective Attention and Academic Performance in a Pre-Adolescent Sample. Int. J. Environ. Res. Public Health 2020, 17, 6216. [Google Scholar] [CrossRef] [PubMed]
  2. Adelantado-Renau, M.; Jiménez-Pavón, D.; Beltran-Valls, M.R.; Ponce-González, J.G.; Chiva-Bartoll, Ó.; Moliner-Urdiales, D. Fitness and academic performance in adolescents. The mediating role of leptin: DADOS study. Eur. J. Pediatr. 2018, 177, 1555–1563. [Google Scholar] [CrossRef] [PubMed]
  3. Herold, F.; Törpel, A.; Hamacher, D.; Budde, H.; Gronwald, T. A discussion on different approaches for prescribing physical interventions—Four roads lead to Rome, but which one should we choose? J. Pers. Med. 2020, 10, 55. [Google Scholar] [CrossRef]
  4. Westfall, D.R.; Gejl, A.K.; Tarp, J.; Wedderkopp, N.; Kramer, A.F.; Hillman, C.H.; Bugge, A. Associations between aerobic fitness and cognitive control in adolescents. Front. Psychol. 2018, 9, 1298. [Google Scholar] [CrossRef] [Green Version]
  5. Marques, A.; Santos, D.A.; Hillman, C.H.; Sardinha, L.B. How does academic achievement relate to cardiorespiratory fitness, self-reported physical activity and objectively reported physical activity: A systematic review in children and adolescents aged 6-18 years. Br. J. Sports Med. 2018, 52, 1039. [Google Scholar] [CrossRef] [PubMed] [Green Version]
  6. Barth Vedøy, I.; Skulberg, K.R.; Anderssen, S.A.; Tjomsland, H.E.; Thurston, M. Physical activity and academic achievement among Norwegian adolescents: Findings from a longitudinal study. Prev. Med. Rep. 2021, 21, 101312. [Google Scholar] [CrossRef] [PubMed]
  7. Van Dijk, M.L.; De Groot, R.H.; Savelberg, H.H.; Van Acker, F.; Kirschner, P.A. The association between objectively measured physical activity and academic achievement in Dutch adolescents: Findings from the GOALS study. J. Sport Exerc. Psychol. 2014, 36, 460–473. [Google Scholar] [CrossRef] [Green Version]
  8. El Ansari, W.; Stock, C. Is the health and wellbeing of university students associated with their academic performance? Cross sectional findings from the United Kingdom. Int. J. Environ. Res. Public Health. 2010, 7, 509–527. [Google Scholar] [CrossRef] [Green Version]
  9. Bass, R.W.; Brown, D.D.; Laurson, K.R.; Coleman, M.M. Physical fitness and academic performance in middle school students. Acta Paediatr. 2013, 102, 832–837. [Google Scholar] [CrossRef]
  10. Anderson, Y.C.; Kirkpatrick, K.; Dolan, G.M.S.; Wouldes, T.A.; Grant, C.C.; Cave, T.L.; Wild, C.E.K.; Derraik, J.G.B.; Cuffield, W.S.; Hofman, P.L. Do changes in weight status affect cognitive function in children and adolescents with obesity? A secondary analysis of a clinical trial. Bmj Open 2019, 9, e021586. [Google Scholar] [CrossRef] [Green Version]
  11. Ding, W.; Lehrer, S.F.; Rosenquist, J.N.; Audrain-McGovern, J. The impact of poor health on academic performance: New evidence using genetic markers. J. Health Econ. 2009, 28, 578–597. [Google Scholar] [CrossRef] [PubMed]
  12. Donnelly, J.E.; Greene, J.L.; Gibson, C.A.; Sullivan, D.K.; Hansen, D.M.; Hillman, C.H.; Poggio, J.; Mayo, M.S.; Smith, B.K.; Lambourne, K.; et al. Physical activity and academic achievement across the curriculum (A + PAAC): Rationale and design of a 3-year, cluster-randomized trial. BMC Public Health 2013, 13, 307. [Google Scholar] [CrossRef] [PubMed] [Green Version]
  13. Donnelly, J.E.; Hillman, C.H.; Castelli, D.; Etnier, J.L.; Lee, S.; Tomporowski, P.; Lambourne, K.; Szabo-Reed, A.N. Physical activity, fitness, cognitive function, and academic achievement in children: A systematic review. Med. Sci. Sport Exerc. 2016, 48, 1197–1222. [Google Scholar] [CrossRef] [PubMed] [Green Version]
  14. Reinert, K.R.; Po’e, E.K.; Barkin, S.L. The relationship between executive function and obesity in children and adolescents: A systematic literature review. J. Obes. 2013, 2013, 820956. [Google Scholar] [CrossRef] [PubMed]
  15. Veronese, N.; Facchini, S.; Stubbs, B.; Luchini, C.; Solmi, M.; Manzato, E.; Sergi, G.; Maggi, S.; Cosco, T.; Fontana, L. Weight loss is associated with improvements in cognitive function among overweight and obese people: A systematic review and meta-analysis. Neurosci. Biobehav. Rev. 2017, 72, 87–94. [Google Scholar] [CrossRef]
  16. Malecka-Tendera, E.; Mazur, A. Childhood obesity: A pandemic of the twenty-first century. Int. J. Obes. 2006, 30 (Suppl. 2), S1–S3. [Google Scholar] [CrossRef] [Green Version]
  17. Davis, C.L.; Cooper, S. Fitness, fatness, cognition, behavior, and academic achievement among overweight children: Do cross-sectional associations correspond to exercise trial outcomes? Prev. Med. 2011, 52, 65–69. [Google Scholar] [CrossRef] [Green Version]
  18. Ruiz, J.R.; Ortega, F.B.; Castillo, R.; Martin-Matillas, M.; Kwak, L.; Vicente-Rodríguez, G. Physical activity, fitness, weight status, and cognitive performance in adolescents. J. Pediatr. 2010, 157, 917–922. [Google Scholar] [CrossRef]
  19. Aadland, E.; Andersen, L.B.; Skrede, T.; Ekelund, U.; Anderssen, S.A.; Resaland, G.K. Reproducibility of objectively measured physical activity and sedentary time over two seasons in children; comparing a day-by-day and a week-by-week approach. PLoS ONE 2017, 12, e0189304. [Google Scholar] [CrossRef]
  20. Esteban-Cornejo, I.; Tejero-Gonzalez, C.M.; Martinez-Gomez, D.; Cabanas Sanchez, V.; Fernandez-Santos, J.R.; Conde-Caveda, J.; Sallis, J.F.; Veiga, O.L.; UP & Down Study Group. Objectively measured physical activity has a negative but weak association with academic performance in children and adolescents. Acta Paediatr. 2014, 103, e501–e506. [Google Scholar] [CrossRef]
  21. Kao, S.C.; Westfall, D.R.; Parks, A.C.; Pontifex, M.B.; Hillman, C.H. Muscular and aerobic fitness, working memory, and academic achievement in children. Med. Sci. Sports Exerc. 2017, 49, 500–508. [Google Scholar] [CrossRef]
  22. Chomitz, V.R.; Slining, M.M.; McGowan, R.J.; Mitchell, S.E.; Dawson, G.F.; Hacker, K.A. Is there a relationship between physical fitness and academic achievement? Positive results from public school children in the northeastern United States. J. Sch. Health 2009, 79, 30–37. [Google Scholar] [CrossRef]
  23. Kwak, L.; Kremers, S.P.; Bergman, P.; Ruiz, J.R.; Rizzo, N.S.; Sjöström, M. Associations between physical activity, fitness, and academic achievement. J. Pediatr. 2009, 155, 914–918. [Google Scholar] [CrossRef]
  24. Wittberg, R.A.; Northrup, K.L.; Cottrell, L.A. Children’s aerobic fitness and academic achievement: A longitudinal examination of students during their fifth and seventh grade years. Am. J. Public Health 2012, 102, 2303–2307. [Google Scholar] [CrossRef]
  25. Cadenas-Sanchez, C.; Migueles, J.H.; Esteban-Cornejo, I.; Mora-Gonzalez, J.; Henriksson, P.; Rodriguez-Ayllon, M.; Molina-Garcia, P.; Löf, M.; Labayen, I.; Hillmann, C.H.; et al. Fitness, physical activity and academic achievement in overweight/obese children. J. Sports Sci. 2020, 38, 731–740. [Google Scholar] [CrossRef]
  26. Fedewa, A.L.; Ahn, S. The effects of physical activity and physical fitness on children’s achievement and cognitive outcomes: A meta-analysis. Res. Q. Exerc. Sport. 2011, 82, 521–535. [Google Scholar] [CrossRef]
  27. Etchison, W.C.; Bloodgood, E.A.; Minton, C.P.; Thompson, N.J.; Collins, M.A.; Hunter, S.C.; Dai, H. Body mass index and percentage of body fat as indicators for obesity in an adolescent athletic population. Sports Health 2011, 3, 249–252. [Google Scholar] [CrossRef] [PubMed] [Green Version]
  28. Walsh, M.; Cartwright, L.; Corish, C.; Sugrue, S.; Wood-Martin, R. The body composition, nutritional knowledge, attitudes, behaviors, and future education needs of senior schoolboy rugby players in Ireland. Int. J. Sport Nutr. Exerc. Metab. 2011, 21, 365–376. [Google Scholar] [CrossRef] [PubMed]
  29. Moreno, L.A.; Leon, J.F.; Seron, R.; Mesana, M.I.; Fleta, J. Body composition in young male football (soccer) players. Nutr. Res. 2004, 24, 235–242. [Google Scholar] [CrossRef]
  30. Cöte, J.; Baker, J.; Abernethy, B. Practice and play in the development of sport expertise. In Handbook of Sport Psychology, 3rd ed.; Eklund, R.C., Tenenbaum, G., Eds.; Wiley & Sons: Hoboken, NJ, USA, 2007; pp. 184–202. [Google Scholar] [CrossRef]
  31. Lloyd, R.S.; Oliver, J.L.; Faigenbaum, A.D.; Howard, R.; De Ste Croix, M.B.; Williams, C.A.; Best, T.M.; Alvar, B.A.; Micheli, L.J.; Thomas, D.P.; et al. Long-term athletic development- part 1: A pathway for all youth. J. Strength Cond. Res. 2015, 29, 1439–1450. [Google Scholar] [CrossRef]
  32. Martinez-Mesa, J.; Gonzales-Chica, D.A.; Duquia, R.P.; Bonamigo, R.R.; Bastos, J.L. Sampling: How to select participants in my research study? An. Bras. Dermatol. 2016, 91, 326–330. [Google Scholar] [CrossRef] [PubMed]
  33. Hermassi, S.; Hayes, L.D.; Bragazzi, N.L.; Schwesig, R. Physical fitness and academic performance in normal weight, overweight and obese schoolchild handball players in Qatar: A pilot study. Front. Psychol. 2021, 11, 616671. [Google Scholar] [CrossRef]
  34. Hermassi, S.; Laudner, K.G.; Schwesig, R. Playing level and position differences in body characteristics and physical fitness performance among male team handball players. Front. Bioeng. Biotechnol. 2019, 21, 149. [Google Scholar] [CrossRef] [PubMed]
  35. Womersley, J.; Durnin, J.V. An experimental study on variability of measurements of skinfold thickness on young adults. Hum. Biol. 1973, 2, 281–292. [Google Scholar]
  36. Heyward, V.H.; Gibson, A.L. Assessing body composition. In Advanced Fitness Assessment and Exercise Prescription, 7th ed.; Human Kinetics: Champaign, IL, USA, 2018; pp. 219–266. [Google Scholar]
  37. Sassi, R.H.; Dardouri, W.; Yahmed, M.H.; Gmada, N.; Mahfoudhi, M.E.; Gharbi, Z. Relative and absolute reliability of a modified agility t-test and its relationship with vertical jump and straight sprint. J. Strength Cond. Res. 2009, 23, 1644–1651. [Google Scholar] [CrossRef]
  38. Negrete, R.J.; Hanney, W.J.; Kolber, M.J.; Davies, G.J.; Ansley, M.K.; McBride, A.B.; Overstreet, A.L. Reliability, minimal detectable change, and normative values for tests of upper extremity function and power. J. Strength Cond. Res. 2010, 24, 3318–3325. [Google Scholar] [CrossRef]
  39. Krustrup, P.; Mohr, M.; Amstrup, T.; Rysgaard, T.; Johansen, J.; Steensberg, A.; Pedersen, P.K.; Bangsbo, J. The yo-yo intermittent recovery test: Physiological response, reliability, and validity. Med. Sci. Sports Exerc. 2003, 35, 697–705. [Google Scholar] [CrossRef]
  40. Hsieh, S.S.; Tsai, J.R.; Chang, S.H.; Ho, J.Y.; Chen, J.F.; Chen, P.H.; Sung, Y.T.; Hung, T.M. The subject-dependent, cumulative, and recency association of aerobic fitness with academic performance in Taiwanese junior high school students. BMC Pediatr. 2019, 19, 25. [Google Scholar] [CrossRef]
  41. Schrama, P.P.; Stenneberg, M.S.; Lucas, C.; van Trijffel, E. Intraexaminer reliability of hand-held dynamometry in the upper extremity: A systematic review. Arch. Phys. Med. Rehabil. 2014, 95, 2444–2469. [Google Scholar] [CrossRef]
  42. Portney, L.G.; Watkins, M.P. Foundations of Clinical Research: Applications to Practice, 3rd ed.; Pearson Prentice Hall: Upper Saddle River, NJ, USA, 2009. [Google Scholar]
  43. Shrout, P.E.; Fleiss, J.L. Intraclass correlations: Uses in assessing rater reliability. Psychol. Bull. 1979, 86, 420–428. [Google Scholar] [CrossRef]
  44. Hopkins, W. Measures of reliability in sports medicine and science. Sports Med. 2000, 30, 1–15. [Google Scholar] [CrossRef] [PubMed] [Green Version]
  45. Hopker, J.; Myers, S.; Jobson, S.A.; Bruce, W.; Passfield, L. Validity and reliability of the Wattbike cycle ergometer. Int. J. Sports Med. 2010, 31, 731–736. [Google Scholar] [CrossRef] [PubMed] [Green Version]
  46. Bortz, J. Basic Principle of One-Factorial Analysis of Variance, in Statistics for Social Scientists; Springer: New York, NY, USA, 1999; pp. 237–249. [Google Scholar]
  47. Richardson, J.T.E. Eta squared and partial eta squared as measures of effect size in educational 416 research. Educ. Res. Rev. 2011, 6, 135–147. [Google Scholar] [CrossRef]
  48. Cohen, J. The effect size. In Statistical Power Analysis for the Behavioural Sciences; Taylor & Francis: Abingdon, UK, 1988; pp. 77–83. [Google Scholar]
  49. Hermassi, S.; van den Tillaar, R.; Bragazzi, N.L.; Schwesig, R. The Associations between physical performance and anthropometric characteristics in obese and non-obese schoolchild handball players. Front. Physiol. 2021, 11, 580991. [Google Scholar] [CrossRef]
  50. Kruschitz, R.; Wallner-Liebmann, S.J.; Hamlin, M.J.; Moser, M.; Ludvik, B.; Schnedl, W.J.; Tafeit, E. Detecting body Fat–A weighty problem BMI versus subcutaneous fat patterns in athletes and non-athletes. PLoS ONE 2013, 8, e72002. [Google Scholar] [CrossRef] [Green Version]
  51. Hermassi, S.; Chelly, M.S.; Bragazzi, N.L.; Shephard, R.J.; Schwesig, R. In-season weightlifting training exercise in healthy male handball players: Effects on body composition, muscle volume, maximal strength, and ball-throwing velocity. Int. J. Environ. Res. Public Health 2019, 16, 4520. [Google Scholar] [CrossRef] [Green Version]
  52. Vänttinen, T.; Blomqvist, M.; Nyman, K.; Häkkinen, K. Changes in body composition, hormonal status, and physical fitness in 11-, 13-, and 15-year-old Finnish regional youth soccer players during a two-year follow up. J. Strength Cond. Res. 2011, 25, 3342–3351. [Google Scholar] [CrossRef] [PubMed]
  53. Mak, K.K.; Ho, S.Y.; Lo, W.S.; Thomas, G.N.; McManus, A.M.; Day, J.R.; Lam, T.H. Health-related physical fitness and weight status in Hong Kong adolescents. BMC Public Health 2010, 10, 88. [Google Scholar] [CrossRef] [PubMed] [Green Version]
  54. Artero, E.G.; Espana-Romero, V.; Ortega, F.B.; Jimenez-Pavon, D.; Ruiz, J.R.; Vicente-Rodriguez, G.; Bueno, M.; Marcos, A.; Gomez-Martinez, S.; Urzanqui, A.; et al. Health-related fitness in adolescents: Underweight, and not only overweight, as an influencing factor. The AVENA study. Scand. J. Med. Sci. Sports 2010, 20, 418–427. [Google Scholar] [CrossRef] [PubMed]
  55. Butte, N.F.; Puyau, M.R.; Vohra, F.A.; Adolph, A.L.; Mehta, N.R.; Zakeri, I. Body size, body composition, and metabolic profile explain higher energy expenditure in overweight children. J. Nutr. 2007, 137, 2660–2667. [Google Scholar] [CrossRef]
  56. Salvadori, A.; Fanari, P.; Fontana, M.; Buontempi, L.; Saezza, A.; Baudo, S.; Miserocci, G.; Longhini, E. Oxygen uptake and cardiac performance in obese and normal subjects during exercise. Respiration 1999, 66, 25–33. [Google Scholar] [CrossRef]
  57. Hraste, M.; De Giorgio, A.; Jelaska, P.M.; Padulo, J.; Granić, I. When mathematics meets physical activity in the school-aged child: The effect of an integrated motor and cognitive approach to learning geometry. PLoS ONE 2018, 13, e0196024. [Google Scholar] [CrossRef] [Green Version]
  58. Burkhalter, T.M.; Hillman, C.H. A narrative review of physical activity, nutrition, and obesity to cognition and scholastic performance across the human lifespan. Adv. Nutr. 2011, 2, 201S–206S. [Google Scholar] [CrossRef] [Green Version]
  59. Wu, N.; Chen, Y.; Yang, J.; Li, F. Childhood obesity and academic performance: The role of working memory. Front. Psychol. 2017, 19, 611. [Google Scholar] [CrossRef] [Green Version]
  60. Kamijo, K.; Khan, N.A.; Pontifex, M.B.; Scudder, M.R.; Drollette, E.S.; Raine, L.B.; Evans, E.M.; Castelli, D.M.; Hillman, C.H. The relation of adiposity to cognitive control and scholastic achievement in preadolescent children. Obesity 2012, 20, 2406–2411. [Google Scholar] [CrossRef]
  61. Liang, J.; Matheson, B.E.; Kaye, W.H.; Boutelle, K.N. Neurocognitive correlates of obesity and obesity-related behaviors in children and adolescents. Int. J. Obes. 2014, 38, 494–506. [Google Scholar] [CrossRef] [Green Version]
  62. Barrigas, C.; Fragoso, I. Obesity, academic performance and reasoning ability in Portuguese students between 6 and 12 years old. J. Biosoc. Sci. 2012, 44, 165–179. [Google Scholar] [CrossRef]
  63. Van Dusen, D.P.; Kelder, S.H.; Kohl, H.W., 3rd; Ranjit, N.; Perry, C.L. Associations of physical fitness and academic performance among schoolchildren. J. Sch. Health 2011, 81, 733–740. [Google Scholar] [CrossRef]
  64. Alswat, K.A.; Al-Shehri, A.D.; Aljuaid, T.A.; Alzaidi, B.A.; Alasmari, H.D. The association between body mass index and academic performance. Saudi Med. J. 2017, 38, 186–191. [Google Scholar] [CrossRef]
  65. Rauner, R.R.; Walters, R.W.; Avery, M.; Wanser, T.J. Evidence that aerobic fitness is more salient than weight status in predicting standardized math and reading outcomes in fourth- through eighth-grade students. J. Pediatr. 2013, 163, 344–348. [Google Scholar] [CrossRef] [Green Version]
  66. Bisset, S.; Foumier, M.; Pagani, L.; Janosz, M. Predicting academic and cognitive outcomes from weight status trajectories during childhood. Int. J. Obes. 2013, 37, 154–159. [Google Scholar] [CrossRef] [PubMed] [Green Version]
  67. Krukowski, R.A.; West, D.S.; Perez, A.P.; Bursac, Z.; Phillips, M.M.; Raczynski, J.M. Overweight children, weight-based teasing and academic performance. Int. J. Pediatr. Obes. 2009, 4, 274–280. [Google Scholar] [CrossRef] [PubMed]
  68. Torrijos-Nino, C.; Martinez-Vizcaino, V.; Pardo-Guijarro, M.J.; Garcia-Prieto, J.C.; Arias-Palencia, N.M.; Sánchez-López, M. Physical fitness, obesity, and academic achievement in schoolchildren. J. Pediatr. 2014, 65, 104–109. [Google Scholar] [CrossRef] [PubMed]
  69. Datar, A.; Sturm, R. Childhood overweight and elementary school outcomes. Int. J. Obes. 2006, 30, 1449–1460. [Google Scholar] [CrossRef] [Green Version]
  70. Li, Y.; Dai, Q.; Jackson, J.C.; Zhang, J. Overweight is associated with decreased cognitive functioning among school-age children and adolescents. Obesity 2008, 16, 1809–1815. [Google Scholar] [CrossRef]
Figure 1. Relationship between (a) height and squat jump (SJ) and (b) Yo-Yo IR1 and weight. Please note that one dot can represent several subjects.
Applsci 11 04185 g001
Figure 2. Relationship between (a) percentage body fat (%BF) and mathematics and (b) %BF and science. Please note that one dot can represent several subjects.
Applsci 11 04185 g002
Figure 3. Relationship between (a) agility T-half test and mathematics and (b) agility T-half test and science. Please note that one dot can represent several subjects.
Applsci 11 04185 g003
Table 1. Physical fitness tests obtained from two sessions two weeks apart (n = 31). Descriptive statistics (mean ± standard deviation (SD)) and intrarater reliability are presented for each test. Intraclass correlation coefficient (ICC) ≥ 0.75 and coefficient of variation (CV) ≤ 10% are highlighted in bold.
TestSession One Mean ± SDSession Two Mean ± SDICC (95% CI)CV (%) (95% CI)
15 m sprint (s)2.75 ± 0.292.81 ± 0.290.98 (0.82–0.99)1.9 (1.4–2.8)
30 m sprint (s)5.07 ± 0.755.03 ± 0.770.94 (0.88–0.97)6.9 (5.4–10.7)
Agility T-half test (s)7.10 ± 0.587.13 ± 0.581.00 (0.99–1.00)0.4 (0.3–0.5)
CMJ (cm)34.8 ± 5.3233.6 ± 5.330.99 (0.31–1.00)1.4 (1.1–2.1)
SJ (cm)30.8 ± 7.4330.1 ± 7.310.98 (0.96–0.99)1.1 (0.8–1.6)
Medicine ball throw (m)7.92 ± 0.907.76 ± 0.930.98 (0.89–1.00)1.2 (0.9–1.8)
Table 2. Comparison of age and anthropometric parameters between two groups. Data are presented as mean ± standard deviation. Meaningful effects (criteria: p < 0.05 and ηp2 > 0.15 and observed power >0.60) marked in bold.
Non-Obese
(n = 17)
Obese
(n = 14)
Observed PowerANOVA
pηp2
Age (years)15.4 ± 1.3315.5 ± 0.940.0550.8360.002
Anthropometric parameters
Body height (m)1.73 ± 0.111.69 ± 0.080.1380.3820.027
Body mass (kg)70.3 ± 13.486.9 ± 18.40.8020.0070.226
BMI (kg/m2)23.8 ± 5.0630.5 ± 7.180.8380.0050.243
Body fat (%)21.5 ± 3.8132.4 ± 1.961.000<0.0010.766
Bicipital skinfold (mm)12.8 ± 5.7332.6 ± 11.41.000<0.0010.575
Tricipital skinfold (mm)15.9 ± 5.5334.1 ± 6.831.000<0.0010.697
Subscapular (mm)16.1 ± 6.7439.5 ± 6.361.000<0.0010.770
Suprailiac (mm)15.4 ± 6.6739.5 ± 6.361.000<0.0010.770
Table 3. Comparison of physical and academic performance parameters between two groups. Data are presented as mean ± SD. Meaningful effects (criteria: p < 0.05 and ηp2 > 0.15 and observed power >0.60) and performance maxima marked in bold.
Non-obese
(n = 17)
Obese
(n = 14)
Observed PowerANOVA
pηp2
Physical performance parameters
15 m sprint (s)2.64 ± 0.282.88 ± 0.260.6680.0190.175
30 m sprint (s)4.89 ± 0.625.28 ± 0.870.2820.1630.066
Agility T-half test (s)6.82 ± 0.527.45 ± 0.460.9310.0010.305
CMJ (cm)37.9 ± 3.8031.0 ± 4.450.994<0.0010.425
SJ (cm)32.7 ± 8.8528.5 ± 4.530.3390.1210.081
Yo-Yo IR1 distance (m)824 ± 293686 ± 2250.2870.1600.067
Medicine ball overhead throw (m)7.75 ± 0.938.12 ± 0.860.2000.2580.044
Academic performance parameters
Science87.4 ± 11.075.9 ± 13.20.7260.0130.195
Mathematics91.4 ± 9.9871.4 ± 16.80.977<0.0010.367
Publisher’s Note: MDPI stays neutral with regard to jurisdictional claims in published maps and institutional affiliations.

