Featured Application
In competitive sports, excellent posture and stability are required for competitive performance and are largely dependent on the level of sport participation and the specific movements and forces created by the individual kind of sport. In this study, we compared different sports using multiple posturographic tests under four bipedal conditions among women. Significant differences were observed between technical sports (ski jumping, diving, and gymnastics) and basketball and recreational athletes. These results provide coaches and athletes with a more sport-specific view and may potentially identify deficits in posture regulation to improve athletic performance and reduce the risk of injury.
Abstract
The aim of this study was to evaluate the postural regulation of female athletes who participate in different sports under normal and high-demand conditions. Fifty-nine female athletes were classified into four specific groups based on their individual sport, which included basketball (n = 16), gymnastics (n = 10), ski jumping (n = 13), diving (n = 8), and one group of recreational athletes (n = 12). These groups were then compared using several posturographic tests under four bipedal conditions: eyes open or closed and on a stable surface or foam pad. While there were some differences between groups standing in the less demanding positions (stable surface), the higher demanding positions (unstable surface-foam pads) showed significant differences between the technical sports (ski jumping, diving, and gymnastics) and basketball and recreational athletes. Most (50%, 6/12) of significant differences were provided by sports. In contrast, the predictors age, weight, and height played only a minor role within the covariance analysis. The largest effect by sports was detected for the anterior-posterior weight distribution standing on foam pads with closed eyes (p = 0.015, ηp2 = 0.211). Ski jumping and recreational athletes showed the largest (p = 0.011) partial difference by sports for this parameter and test position. According to the parameters, the weight distribution index (WDI) was the variable with the most significant effects (50%, 6/12). These results provide coaches and athletes with a more sport specific view on postural regulation and potentially assist in identifying deficits to improve sports performance and reduce the risk of injury.
1. Introduction
Sufficient posture regulation and stability are important factors for activities of daily living and physical activity [1]. In competitive sports, exceptional postural regulation and stability are necessary to perform at the highest performance levels [2,3] and are dependent on the specific movements and forces required by different sports. Postural regulation is defined as the ability to monitor body position and alignment in space, and involves multimodal interactions of the musculoskeletal and neural systems. Postural stability predominantly incorporates somatosensory information to control an individual’s center of mass (CoM) in relationship to their base of support [4]. Furthermore, postural stability is a crucial determinant of functional movement reflecting interaction of different postural subsystems (visual, nigrostriatal, vestibular, somatosensory, and cerebellar).
Postural regulation plays an important role in both team sports (e.g., basketball, handball) [2,5,6,7], technical sports (e.g., diving, ski jumping, and gymnastics) [3,8,9,10], different styles of riding [11], or the impact of therapeutic riding on gait and posture regulation [12]. For example, posture can be decisive for the starting position of high movements, such as in diving and gymnastic movements, as well as at the end of movements, such as in ski jumping and (again) gymnastics. In contrast, the posture required in team sports may play a smaller role because the level of posture regulation and stability is not as crucial for match performance compared to the technical evaluation in competitions determined by judges (e.g., basketball vs. diving).
From a practical point of view, many coaches almost exclusively use subjective and semi-empirical impressions and considerations. Consequently, athletes may not be able to reach their maximum performance level based on these subjective assessments. An additional assessment of training and competition performances using an objective diagnostic tool would empirically support the coach and potentially confirm or otherwise correct his/her subjective evaluation. This would be beneficial during pre-season preparation, technical training, immediate competition preparation, and during the recovery or off-season phases [13].
The aim of the study was to evaluate the postural control and stability in athletes from different sports using posturography under increasing levels of difficulty. We hypothesized that athletes in technical sports, such as gymnastics, ski jumping, and diving, would show a higher level of postural control and stability than athletes in team sports or recreational athletes.
2. Materials and Methods
2.1. Subjects
A total of 59 female subjects volunteered to participate in this study. Test persons had both national level (basketball, gymnastics) and international level (diving, ski jumping). The recreational athletes trained 2–3 times a week (e.g., jogging, cycling, and swimming) and did not take part in competitions. All subjects provided informed written consent to participate prior to data collection. The study was approved by the local ethics committee (reference number: 2016-70).
2.2. Study Design and Methodology
For analysis of postural control, the female athletes were tested using a posturographic measurement system (SensoDiaTrain (SDT), Haynl Elektronik, Schönebeck, Germany) based on the interactive balance system (IBS, neurodata GmbH, Vienna, Austria) (Figure 1a,b). This system consists of four independent force plates supporting the heels and forefeet in order to measure postural control at a sampling rate of 32 Hz.
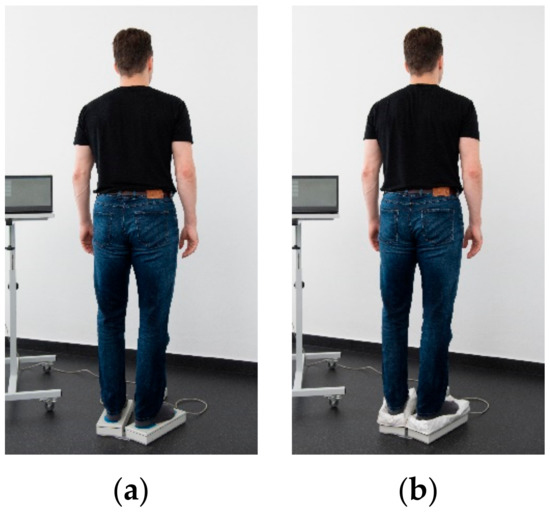
Figure 1.
(a) Subject on stable force plates, (b) subject on force plates with foam pads. Source: Andreas Lauenroth (person is one of the authors).
Testing consisted of four different balance tasks of increasing difficulty (Figure 1a,b). Subjects were instructed to stand as still as possible for a duration of 32 s during each task. General instructions included standing erect and as still as possible, but without rigidity, while looking at a fixed target (eyes open condition only). The sensorimotor subsystems were selectively targeted by the different tasks, including eyes open and closed (visual system) and the use of stable and foam pads (somatosensory system). All tasks were conducted with the subjects head in a neutral alignment (vestibular).
Detailed information about the calculated parameters and used test positions can be found in previous research [14,15,16,17]. All measurements were conducted at the same time of day and in a quiet room without any distractions.
The test positions of eyes open, looking forward, and without foam pads (NO), and eyes closed, looking forward, and without foam pads (NC) (Figure 1a), represent the classic Romberg test widely used in medical practice. By closing the eyes in the NC position and thus eliminating the visual information, the information components coming from other sensory organs and processing in the brain substantially increase. This effect is exacerbated by the use of foam pads and the concomitant reduction in somatosensory input, so that the eyes closed, head straight, and foam pads (PC) test position (Figure 1b) overwhelms the vestibular system as the only reliable source of information.
2.3. Statistics
All data were reported as means and standard deviations. Prior to inference statistical analyses, all variables were tested for normal distribution (Shapiro–Wilk Test) and the assumption of variance homogeneity (Levene Test for equality of variances). Mean differences between sports were tested using a one-factorial univariate general linear model. Based on the (expected) significant group differences concerning age, weight, and height, we used these variables as covariates to evaluate the “pure” differences in postural performance. Bonferroni tests were used for pairwise analysis to analyse differences between the sports (basketball, gymnastics, ski jumping, diving, and recreational athletes).
Differences between means were considered as statistically significant if p values were <0.05. To estimate practical relevance and to quantify the postural performance differences between sports, effect size (partial eta squared, ηp2) [18] was calculated for the ANOVA main effects (ηp2). To evaluate effect size, ηp2 was classified as ηp2 ≥ 0.01, ηp2 ≥ 0.06, or ηp2 ≥ 0.14 indicating small, medium, or large effects, respectively [19].
Pearson’s product moment correlations were calculated in order to evaluate the relationship between anthropometric/demographic parameters and posturographic parameters to detect dependencies between these parameters. The magnitude of correlations (r) between measures was interpreted as follows: <0.1 = trivial; 0.1–0.3 = small; 0.3–05 = moderate; 0.5–0.7 = large; 0.7–0.9 = very large; and 0.9–1.0 = almost perfect [19].
All statistical analyses were conducted using the SPSS version 25.0 for Windows (IBM, Armonk, NY, USA).
3. Results
3.1. Normal Distribution and Variance Homogeneity
The variables age (p = 0.001), ST_NO (p = 0.001), ST_NC (p < 0.001), ST_PO (p = 0.012), WDI_NO (p = 0.043), WDI_NC (p = 0.004), WDI_PO (p = 0.002), and WDI_PC (p = 0.006) were not normally distributed.
Regarding variance homogeneity, the parameters age (p = 0.002), WDI_PO (p = 0.016), medio-lateral load distribution (LEFT)_NC (p = 0.042), anterior-posterior load distribution (HEEL)_NO (p = 0.040), and HEEL_NC (p = 0.028) displayed a significant difference as a sign of variance inhomogeneity.
3.2. Anthropometric and Demographic Data
The ages of gymnasts (14.2 ± 2.88 years) and recreational athletes (24.8 ± 7.47 years) showed the largest significant difference (p < 0.001; Table 1). No significant differences (p = 1.000) were calculated between basketball (20.6 ± 3.20 years), ski jumping (21.7 ± 4.31 years), and diving (21.3 ± 3.35 years).

Table 1.
Anthropometrics (mean ± standard deviation) of subjects in relation to different sports.
Gymnasts had the lowest body weight (46.1 ± 9.56 kg), and basketball players had the highest body weight (72.2 ± 9.04 kg; p < 0.001). In contrast, recreational athletes (61.4 ± 6.31 kg), ski jumpers (58.1 ± 6.10 kg), and divers (58.9 ± 3.64 kg) displayed only small differences (p = 1.000).
The greatest main effect was detected for body height (ηp2 = 0.631). Body height differed from 1.78 m (basketball) to 1.54 m (gymnastics).
3.3. Postural Performance Data
50% (6/12) of significant differences (predictors: sports, age, height, and weight) were provided by sports (Table 2). The largest effect was detected for HEEL_PC (p = 0.015, ηp2 = 0.211). According to the parameters, the weight distribution index (WDI) was the variable with the most significant effects (50%, 6/12). The parameter medio-lateral load distribution (LEFT) was the only parameter without any significant effects (Table 2).
Table 2.
Analysis of variance (covariates: age, weight, and height) between groups by test positions (eyes open, looking forward, and without foam pads (NO), eyes closed, looking forward, and without foam pads (NC), eyes open, head straight, and without foam pads (PO), and eyes closed, head straight, and foam pads (PC)) and parameters (stability indicator (ST), weight distribution index (WDI), heel, left). Meaningful differences (ηp2 > 0.10) between sports marked in bold.
Significant partial effects between different sports were calculated for the following parameters and positions:
- WDI: NO (Gym. vs. Bas.: p = 0.025), PO (Ski jump. vs. Recreat.: p = 0.011),
- HEEL: PO (Ski jump. vs. Recreat.: p = 0.020), PC (Ski jump. vs. Bas.: p = 0.014).
3.3.1. Stability Indicator (ST)
There were negligible stability differences between the sports during the stable ground tests (NO, NC) (Figure 2A,B). Differences were only observed with increasing test difficulty (position PC; Figure 2D). During these tests, the gymnasts had the best performance and the basketball players had the lowest level of postural stability (Gym: 35.9 ± 10.9 vs. Bas: 55.9 ± 13.4; Figure 2D).
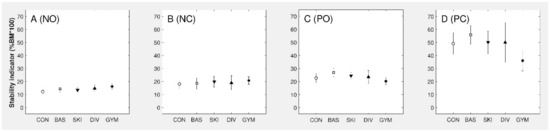
Figure 2.
Parameter stability indicator (ST) for different sports in positions NO (A), NC (B), PO (C), and PC (D). CON—recreational athletes, BAS—Basketball, SKI—Ski Jumping, DIV—Diving, GYM—Gymnastics. Values are given as mean and standard deviation.
3.3.2. Weight Distribution Index (WDI)
In contrast to the stability indicator, the weight distribution index during the more demanding positions on the foam pads (PO, PC; Figure 3C,D) showed a clear difference between the technical sports (gymnastics, diving, and ski jumping) and the team sports (basketball). A significant difference (p = 0.025) was observed for the position NO between the gymnasts (6.09 ± 2.85) and the basketball players (4.75 ± 2.49; Figure 3A).
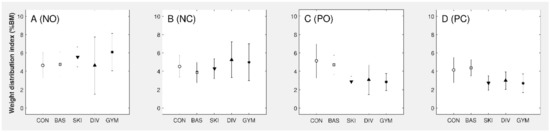
Figure 3.
Weight distribution index (WDI) for different sports in positions NO (A), NC (B), PO (C), and PC (D). CON—recreational athletes, BAS—Basketball, SKI—Ski Jumping, DIV—Diving, GYM—Gymnastics. Values are given as mean and standard deviation.
3.3.3. Anterior-Posterior Load Distribution (HEEL)
When assessing the percentage distribution of heel strain, divers had the greatest deviation across all positions. In the positions PO and PC, the technical sports, such as gymnastics, ski jumping, and diving, were closest to the same anterior-posterior distribution. Basketball players showed a decreased heel load, especially in the unstable test situations (PO: 42%, Figure 4C; PC: 44%, Figure 4D). In contrast, the diving group was balanced in the anterior-posterior direction (Heel-PO: 50%; Heel-PC: 50%). A significant partial effect (p = 0.014) was calculated for the position PC between the ski jumpers (50.3 ± 4.72) and the basketball players (43.5 ± 4.66) (Figure 4D).
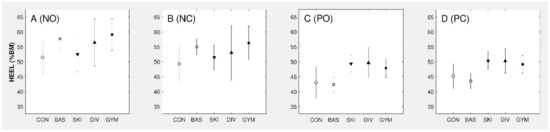
Figure 4.
Anterior-posterior load distribution (HEEL) for different sports in positions in positions NO (A), NC (B), PO (C), and PC (D). CON—recreational athletes, BAS—Basketball, SKI—Ski Jumping, DIV—Diving, GYM—Gymnastics. Values are given as mean and standard deviation.
3.3.4. Medio-Lateral Load Distribution (LEFT)
The medio-lateral load distribution (LEFT) was the most unaffected parameter (p ≥ 0.594). Both groups adjusted to similar levels with increasing difficulty of positions (Figure 5A–D).
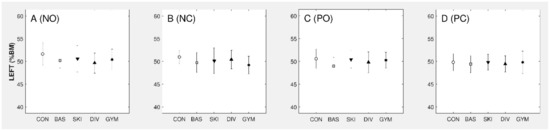
Figure 5.
Parameter medio-lateral load distribution (LEFT) for different sports in positions in positions NO (A), NC (B), PO (C), and PC (D). CON—recreational athletes, BAS—Basketball, SKI—Ski Jumping, DIV—Diving, GYM—Gymnastics. Values are given as mean and standard deviation.
3.4. Dependences between Anthropometric/Demographic and Postural Performance Data
For a better understanding regarding the interactions between anthropometric/demographic parameters and postural performance data depending on positions, bivariate correlations were calculated (Table 3). Only two relevant correlations were detected for the parameter ST in the position PC concerning height (r = 0.50) and weight (r = 0.55). The age did not show any dependences to postural parameters (Table 3).
Table 3.
Bivariate correlations (r) between anthropometric/demographic and interactive balance system (IBS) parameter depending on positions. Relevant correlations (r ≥ 0.5) marked in bold.
4. Discussion
In this study, we observed the postural stability in female athletes from different sports with very different balance requirements. Basketball players as well as recreational athletes had poorer posturographic performance compared to gymnasts or ski jumping athletes. This was particularly visible in the more demanding (peripheral-vestibular system) postural positions (PO, PC). In contrast to the positions NO and NC, for the positions PO (disruption of the somatosensory system using pads) and PC (disruption of the somatosensory system using pads and elimination of the visual system using eyes closed), we detected a significant lower level of postural stability for basketball players than for gymnasts. It seems that the performance of the peripheral-vestibular system is much lower for basketball players than for gymnasts. This result was expected, because the exercises of gymnasts are much more demanding in this direction (e.g., rotations, vertical and horizontal accelerations). Furthermore, this finding is an important proof for the validity of the IBS. At the same time, this is an example of the simulation of pathological situations by different positions (NO, NC, PO, and PC) and conditions (e.g., using pads, eyes closed). According to the strategy “testing- the-limits” [20], only the most demanding test positions (PO and PC) and conditions (e.g., using pads, eyes closed) are able to provide significant group differences.
Comparable with the predictor sports, the variables age, weight, and height played only a minor role with regard to the postural parameters.
These results support those of Bressel et al. [2] who investigated the static and dynamic postural control among athletes in different sports. They observed that gymnasts showed better balance compared to female basketball players. Davlin [21] examined the dynamic balance of gymnasts compared to swimmers and soccer players via a stabilometer with gymnasts displaying better balance compared to the other groups [3].
The basketball players in our study, as well as the recreational athletes, had increasing forefoot weight distribution during the most difficult test position (PC). In this position, both the basketball and recreational athletes changed their strategy compared to the positions without foam pads, while the more technical sports athletes kept their forefoot/heel ratio close to 50%.
In order to accurately compare the postural stability of different sports, it is theoretically necessary to compare athletes at similar levels of competition. Paillard et al. [22] pointed out that the assessment of postural regulation depends on the level of athletes within a sport. Accordingly, the results of top athletes in a sport are hardly comparable to recreational athletes of the same sport. Within this consideration, only the highest national level athletes were examined in the technical-coordinative sports of ski jumping, diving, and gymnastics. In the team sport of basketball, our subjects trained at least within professional structures (first national league). Era et al. [23] reported that the level of postural control depends significantly on the qualification level (national vs. international). Consequently, it can be assumed that the technical-coordinative sports have a better internal representation of their posture as well as a more efficient cerebellar integration of the different afferent subsystems (visual, peripheral-vestibular, and somatosensory) than the athletes of the team sports.
Gymnasts were one of the most powerful groups in terms of postural control. This group demonstrated the highest performance level for stability indicator in the more demanding test positions. Similar findings were reported by Davlin [21] and Bressel et al. [2], particularly when compared to team sports (basketball, soccer). A possible explanation for these findings is that a key physical characteristic of these team sports is strong dynamic performance, and the test conditions applied in this study were more static and may not have accurately replicated their more sport specific conditions.
This is mainly done by flexing the knee and hip joints and is a strategy to lower the body’s center of gravity. Body height and weight are well known to be factors affecting Center-Of-Pressure (COP) parameters [21,24]. In this respect, Chiari et al. [24] observed a significant correlation between these physical characteristics during more challenging test conditions among young adults (eyes open (EO) eyes closed (EC)). In comparison, the divers showed greater heterogeneity in the test positions that did not require the visual system (NO vs. NC, PO vs. PC).
More specifically, the sway path in anterior-posterior direction was influenced by the aforementioned anthropometric parameters (body height: EO: r = 0.39, EC: r = 0.70; body weight: EO: r = 0.44, EC: r = 0.67). Furthermore, Kim et al. [25] reported that the physique in women, but not in men, correlates with the area of sway. Riemann et al. [26] suggested adjusting factors like activity level, injury, and health history, for better comparability of individuals with different anthropometric characteristics. Therefore, the interpretation of absolute values has to be done with caution. However, the ski jumpers showed little differences in postural regulation during positions with eyes open or closed and seemed largely homogeneous.
Limitations
The age differences between the groups can be explained by the different maximum performance ages in the respective sports. For recreational athletes, the type of sport, scope, and intensity vary widely. This group should therefore be considered less homogeneous than the highly specialised professional athletes from the other groups. It may also to meaningful to distinguish between platform divers and spring board divers due to the different demands of these tasks. While the platform divers use “solid” ground as a starting condition, the spring board diver have to use the dynamic movement of the board to launch the next phase of the flight. As a result, a spring board diver could use visual information for correction much more frequently than a platform diver (constant conditions). These differences between platform and spring board divers could explain the large standard deviation in some posturographic parameters (e.g., HEEL, WDI) compared to the other groups.
The more balanced weight distribution and postural stability can also be affected by the different training regimes (team sport vs. individual training). In this way, it is easier for coaches to create an optimal exercise program for every athlete in technical sports. Moreover, practical experiences have shown that training in team sports is very one-sided and only designed for sporting success. Additionally, this one-sidedness is often forced by the position specifics. Very often, core stability and flexibility exercises are underrepresented in team sports compared with technical sports. This often leads to muscular imbalances and a greater susceptibility to injury.
5. Conclusions
The aim of this study was to compare the postural control of subjects involved in different sports. The technical sports (ski jumping, diving, and gymnastics) showed a higher level of postural control compared to basketball and recreational athletes. This became particularly obvious for the stability indicator and forefoot-hindfoot ratio in higher demanding positions. No differences in postural control were found during any test position and between sports for left side weight distribution. The athletes of the technical disciplines (ski jumping, diving, and gymnastics) kept their postural control constant across all test positions. The high level of postural stability and the performance difference of the gymnasts compared with all other athletes was remarkable, especially for diving and ski jumping under reduced visual and somatosensoric input. The transfer from training content from gymnasts to diving or ski jumping could be beneficial for competitive performance.
Based on these results, posturography should be recommended as a regularly used assessment to map progress and, if necessary, to identify causes or tendencies for changes in postural performances. These results may assist trainers, coaches, and athletes to tailor training protocols and to identify postural deficits to assist in performance and injury risk screening.
Practical Implications
The different requirement profiles in the individual sports have an increased influence on postural outcomes. The results of this research may assist trainers, coaches, and athletes to train with a more sport specific view in order to meet the requirements for selected skills in different sports. Additionally, this measurement can be used to identify specific deficits of postural regulation in order to improve performance and reduce the risk of injury. For example, under reduced visual and somatosensoric input (PO, PC), all technical sports (ski jumping, diving, gymnastics) consistently showed a better anterior-posterior weight distribution than under normal (not/little disturbed) conditions (NO, NC). Obviously, this training in such sports is able to generate a more balanced weight distribution and to reduce muscle imbalances. Both aspects are very important for injury prevention.
Next, it should be investigated to what extent an additional performance gain in team sports is useful with respect to injury frequencies and postural control.
Author Contributions
Conceptualization, A.L., L.R. and R.S.; methodology, A.L., L.R., K.G.L., and R.S.; formal analysis, A.L., L.R., S.S., and R.S.; investigation, A.L., L.R., S.S., and R.S.; resources, A.L.; data curation, A.L. and L.R.; writing—original draft preparation, A.L., L.R., and R.S.; writing—review and editing, A.L., L.R., S.S., and R.S.; visualization, L.R. and S.S.; supervision, K.-S.D., R.S.; project administration, A.L. and R.S.; All authors have read and agreed to the published version of the manuscript.
Funding
This study was funded by a grant (number: 1604/00017) from the federal state of Saxony-Anhalt and the “European Regional Development Fund” (ERDF 2014-2020). We acknowledge the financial support within the funding program Open Access Publishing by the German Research Foundation (DFG).
Institutional Review Board Statement
The study was conducted according to the guidelines of the Declaration of Helsinki and approved by the local Ethics Committee of the Martin-Luther-University Halle-Wittenberg (reference number: 2016-70; date of approval: 12.10.2016). All procedures performed in studies involving human participants or on human tissue were in accordance with the ethical standards of the institutional and/or national research committee and with the 1975 Helsinki declaration and its later amendments or comparable ethical standards.
Informed Consent Statement
Informed consent was obtained from all subjects involved in the study.
Data Availability Statement
The raw data supporting the conclusions of this article will be made available by the authors, without undue reservation.
Acknowledgments
The authors would like to thank the athletes of all teams and groups used in this study, as well as their coaches, for their co-operation and outstanding efforts.
Conflicts of Interest
The authors declare no conflict of interest.
References
- Horak, F.B. Postural orientation and equilibrium: What do we need to know about neural control of balance to prevent falls? Age Ageing 2006, 35 (Suppl. 2), ii7–ii11. [Google Scholar] [CrossRef]
- Bressel, E.; Yonker, J.C.; Kras, J.; Heath, E.M. Comparison of static and dynamic balance in female collegiate soccer, basketball, and gymnastics athletes. J. Athl. Train. 2007, 42, 42. [Google Scholar] [PubMed]
- Hrysomallis, C. Balance ability and athletic performance. Sports Med. 2011, 41, 221–232. [Google Scholar] [CrossRef] [PubMed]
- Shumway-Cook, A.; Woollacott, M.H. Motor Control: Translating Research into Clinical Practice; Lippincott Williams & Wilkins: Philadelphia, PA, USA, 2011. [Google Scholar]
- Lehmann, T.; Paschen, L.; Baumeister, J. Single-leg assessment of postural stability after anterior cruciate ligament injury: A systematic review and meta-analysis. Sports Med. Open 2017, 3, 32. [Google Scholar] [CrossRef] [PubMed]
- Plisky, P.J.; Rauh, M.J.; Kaminski, T.W.; Underwood, F.B. Star Excursion Balance Test as a predictor of lower extremity injury in high school basketball players. J. Orthop. Sports Phys. Ther. 2006, 36, 911–919. [Google Scholar] [CrossRef] [PubMed]
- Tsang, W.W.; Fong, S.S.; Cheng, Y.T.; Daswani, D.D.; Lau, H.Y.; Lun, C.K.; Ng, S.S. The effect of vestibular stimulation on eye-hand coordination and postural control in elite basketball players. Am. J. Sports Sci. 2014, 2, 17–22. [Google Scholar] [CrossRef]
- Schwesig, R.; Kluttig, A.; Leuchte, S.; Becker, S.; Schmidt, H.; Esperer, H.D. The impact of different sports on posture regulation. Sportverletz. Sportschaden 2009, 23, 148–154. [Google Scholar] [CrossRef] [PubMed]
- Garcia, C.; Barela, J.A.; Viana, A.R.; Barela, A.M.F. Influence of gymnastics training on the development of postural control. Neurosci. Lett. 2011, 492, 29–32. [Google Scholar] [CrossRef]
- Sloanhoffer, H.; Harrison, K.; Jean, L. Dynamic Stability in Gymnasts, Non-Balance Athletes, and Active Controls. Int. J. Exerc. Sci. 2018, 11, 1–12. [Google Scholar]
- Schwesig, R.; Sannemüller, K.; Kolditz, R.; Hottenrott, K.; Becker, S.; Esperer, H.D. Specific riding styles are associated with specific effects on bodily posture control. Sportverletz. Sportschaden 2008, 22, 93–99. [Google Scholar] [CrossRef]
- Schwesig, R.; Neumann, S.; Richter, D.; Kauert, R.; Esperer, H.D.; Leuchte, S. Impact of therapeutic riding on gait and posture regulation. Sportverletz. Sportschaden 2009, 23, 84–94. [Google Scholar] [CrossRef]
- Kenttä, G.; Hassmén, P. Overtraining and recovery. Sports Med. 1998, 26, 1–16. [Google Scholar] [CrossRef]
- Bartels, T.; Brehme, K.; Pyschik, M.; Schulze, S.; Delank, K.S.; Fieseler, G.; Laudner, K.G.; Hermassi, S.; Schwesig, R. Pre-and postoperative postural regulation following anterior cruciate ligament reconstruction. J. Exerc. Rehabil. 2018, 14, 143. [Google Scholar] [CrossRef]
- Reinhardt, L.; Heilmann, F.; Teicher, M.; Lauenroth, A.; Delank, K.S.; Schwesig, R.; Wollny, R.; Kurz, E. Comparison of posturographic outcomes between two different devices. J. Biomech. 2019, 86, 218–224. [Google Scholar] [CrossRef]
- Brehme, K.; Bartels, T.; Pyschik, M.; Jenz, M.; Delank, K.S.; Laudner, K.G.; Schwesig, R. Postural stability and regulation before and after high tibial osteotomy and rehabilitation. Appl. Sci. 2020, 10, 6517. [Google Scholar] [CrossRef]
- Schneider, I.; Zierz, S.; Schulze, S.; Delank, K.S.; Laudner, K.G.; Brill, R.; Schwesig, R. Characterization of gait and postural regulation in late-onset Pompe disease. Appl. Sci. 2020, 10, 7001. [Google Scholar] [CrossRef]
- Richardson, J.T.E. Eta squared and partial eta squared as measures of effect size in educational research. Educ. Res. Rev. 2011, 6, 135–147. [Google Scholar] [CrossRef]
- Cohen, J. Statistical Power Analysis for the Behavioural Sciences, 2nd ed.; Lawrence Erlbaum: Hillsdale, NJ, USA, 1998. [Google Scholar]
- Kliegl, R.; Smith, J.; Baltes, P.B. Testing-the-limits and the study of adult age differences in cognitive plasticity of a mnemonic skill. Dev. Psychol. 1989, 25, 247–256. [Google Scholar] [CrossRef]
- Davlin, C.D. Dynamic balance in high level athletes. Percept. Mot. Ski. 2004, 98, 1171–1176. [Google Scholar] [CrossRef]
- Paillard, T. Relationship between sport expertise and postural skills. Front. Psychol. 2019, 10, 1428. [Google Scholar] [CrossRef]
- Era, P.; Konttinen, N.; Mehto, P.; Saarela, P.; Lyytinen, H. Postural stability and skilled performance-a study on top-level and naive rifle shooters. J. Biomech. 1996, 29, 301–306. [Google Scholar] [CrossRef]
- Chiari, L.; Rocchi, L.; Cappello, A. Stabilometric parameters are affected by anthropometry and foot placement. Clin. Biomech. 2002, 17, 666–677. [Google Scholar] [CrossRef]
- Kim, J.; Kwon, Y.; Chung, H.Y.; Kim, C.S.; Eom, G.M.; Jun, J.H.; Park, B.K. Relationship between body factors and postural sway during natural standing. Int. J. Precis. Eng. Manuf. 2012, 13, 963–968. [Google Scholar] [CrossRef]
- Riemann, B.L.; Lininger, M.; Kirkland, M.K.; Petrizzo, J. Age related changes in balance performance during self-selected and narrow stance testing. Arch. Gerontol. Geriatr. 2018, 75, 65–69. [Google Scholar] [CrossRef] [PubMed]


Publisher’s Note: MDPI stays neutral with regard to jurisdictional claims in published maps and institutional affiliations. |
© 2021 by the authors. Licensee MDPI, Basel, Switzerland. This article is an open access article distributed under the terms and conditions of the Creative Commons Attribution (CC BY) license (https://creativecommons.org/licenses/by/4.0/).