Article

Hyperspectral Chemical Imaging of Single Bacterial Cell Structure by Raman Spectroscopy and Machine Learning

1
Quantum Metrology and Nano Technologies Division, Istituto Nazionale di Ricerca Metrologica (INRiM), Strada delle Cacce, 91, 10135 Turin, Italy
2
Department of Electronics and Telecommunications, Politecnico di Torino, Corso Duca degli Abruzzi, 24, 10129 Turin, Italy
*
Author to whom correspondence should be addressed.
Appl. Sci. 2021, 11(8), 3409; https://doi.org/10.3390/app11083409
Submission received: 22 March 2021 / Revised: 8 April 2021 / Accepted: 8 April 2021 / Published: 10 April 2021
(This article belongs to the Special Issue Novel Spectroscopy Applications in Food Detection)

Abstract

:
In this work, biomolecules, such as membrane proteins, lipids, and DNA, were identified and their spatial distribution was mapped within a single Escherichia coli cell by Raman hyperspectral imaging. Raman spectroscopy allows direct, nondestructive, rapid, and cost-effective analysis of biological samples, minimizing the sample preparation and without the need of chemical label or immunological staining. Firstly, a comparison between an air-dried and a freeze-dried cell was made, and the principal vibrational modes associated to the membrane and nucleic acids were identified by the bacterium’s Raman chemical fingerprint. Then, analyzing the Raman hyperspectral images by multivariate statistical analysis, the bacterium biological status was investigated at a subcellular level. Principal components analysis (PCA) was applied for dimensionality reduction of the spectral data, then spectral unmixing was performed by multivariate curve resolution–alternating least squares (MCR-ALS). Thanks to multivariate data analysis, the DNA segregation and the Z-ring formation of a replicating bacterial cell were detected at a sub-micrometer level, opening the way to real-time molecular analysis that could be easily applied on in vivo or ex vivo biological samples, avoiding long preparation and analysis process.

Graphical Abstract

1. Introduction

Vibrational spectroscopy offers the opportunity for revolutionary innovation in the life sciences and shows high potential as a rapid, culture-independent, cost-effective, and label-free technique for the characterization of biological samples, compared to conventional time-consuming methods, such as microbiological and molecular techniques, which usually require expensive equipment, highly trained staff, and complicated sample preparation [1,2]. Unlike infrared spectroscopy (FT-IR) [3], Raman spectroscopy is more suited for biological investigations because it allows real-time analysis of living samples in their natural environmental conditions [4], either dispersed in aqueous media or deposited on commercial microscope glass slides. Indeed, signals from both water and glass are very weak in the Raman spectrum [5] and do not interfere with those from biocomponents. In particular, Raman spectroscopy is widely used in microbiology as a direct and noninvasive technique that requires a minimum amount of sample and avoids long preparation processes [6] (pp. 919–935). Moreover, it offers the possibility to obtain simultaneously spatial information with high resolution of many constituents at single cell level, which can be resolved in postprocessing by multivariate statistical methods [7]. The overall biochemical profile results in a characteristic spectral fingerprint that reflects the sample chemical composition, metabolic information, biological conditions, and history [8]. Recently, some promising analytical approaches have been forwarded for the rapid and specific monitoring of cell status [9,10,11]. However, spectroscopic technology can generate an enormous amount of data in a short time, and due to the complexity of biological samples, Raman spectra raises several interpretation difficulties. To overcome this issue , disciplines such as image processing, statistical analysis, chemometrics, machine learning, and computational intelligence techniques are needed [12,13].
Hyperspectral imaging technology, combining conventional spectroscopy and imaging techniques, enables to acquire both spectral and spatial information from an object at the same time [14]. Molecules leave unique chemical “fingerprints” in the electromagnetic spectrum, which are recorded, pixel by pixel, forming the resulting image. These spectral signatures enable identification of the materials that make up a scanned object, detection of inhomogeneity, and recognition of characteristic spatial features. The Raman spectra complexity requires automated methods that can remove qualitative interpretation in spectroscopy analysis. Therefore, mathematical methods for data processing are fundamental to manage the big amount of physical and chemical information resulting from hyperspectral Raman images of the samples. In this context, it is evident how machine learning and chemometrics assumed great importance to reduce the dimensionality of the spectral data, retain essential information, and classify or quantify important areas of a sample during postprocessing [15]. Thus, these techniques for biological samples data analysis offer a great potential for the automation of control methodologies. Immediate and accurate information at different stages of the cell cycles can be obtained and processed in a very short time [16].
The potential of Raman hyperspectral chemical imaging to provide not only spectral information but also the spatial distribution of the components in sub-micron biological objects on the basis of their different Raman spectrums is demonstrated in this work. Using this technique, we investigated the cell status of a single E. coli cell, which was collected in its mid-exponential growth phase to explore the possibility of identifying different phases of the cell replication cycle thanks to the high resolution and molecular specificity offered by Raman imaging. In particular, the spatial distribution of the main molecular constituents of bacterial cells, such as membrane proteins and DNA components, were monitored using a Raman microscope, without any immunological staining or chemical labelling. E. coli ATCC 8739 was used for this purpose as a Gram-negative representative bacterial model, and its chemical Raman fingerprint was taken. First, a comparison between a freeze-dried and an air-dried sample was performed at single-cell level to compare the preservation state of the cell structure in the case of a sudden thermal shock or not. Raman hyperspectral imaging maps of the cell were acquired and analyzed using multivariate statistical analysis of the images. Exploratory principal components analysis (PCA) was used for dimensionality reduction and then spectral unmixing was performed by multivariate curve resolution–alternating least squares (MCR-ALS). MCR-ALS is a method useful to solve the mixture analysis problem, that is, it is able to provide a chemically meaningful additive bilinear model of pure contributions from the sole information of an original data matrix including a mixed measurement [7]. From the Raman chemical map, the DNA segregation of a replicating bacterial cell was detected at a sub-micrometer level.

2. Materials and Methods

2.1. Bacterial Strains and Cultivation

A frozen stock culture of E. coli ATCC 8739 was revitalized and let grow overnight in 5 mL of LB (Luria Bertani) broth, purchased by Sigma Aldrich, at (37 ± 1) °C under agitation (150 rpm). Then, it was plated on LB agar to obtain isolated colonies and incubated overnight at (37 ± 1) °C. Using a sterile inoculating loop, bacteria from a single colony were transferred from the stock agar culture into 5 mL of LB culture medium and incubated at (37 ± 1) °C overnight under agitation (150 rpm). The optical density at 600 nm (OD600) of the bacterial suspension was measured using UV-VIS spectrophotometer (Lange DR500) in the single-wavelength mode. LB without bacteria inoculated was employed as a blank, and the OD600 was adjusted to 0.05 then let grow for 2 h until the start of the test. This cultivation time is necessary for the bacterium to reach approximately the middle of its exponential growth phase. Then, 1 mL of the culture was taken, and the cells were purified from the nutrient broth with a centrifugation at 6000 rpm for 6 min, two washes were applied using sterilized MilliQ® water by centrifugations at 15,000 rpm for 1.5 min. The new OD600 was measured using pure sterilized MilliQ water as blank and adjusted to an OD600 of 0.1 by diluting with fresh sterilized MilliQ water.

2.2. Sample Preparation for Raman Analysis

Reflective substrates made of silicon wafer coated with a layer of 5 nm of Ti covered by a 60 nm layer of pure gold were prepared with the same method described by Sacco et al. [17] to avoid Raman enhancement from the surface. Gold was chosen because it is inert and does not have Raman signal in the molecular fingerprint region of E. coli. The substrates were cleaned with acetone under sonication for 10 min, followed by a bath of absolute ethanol for another 10 min. An amount of 20 µL of the bacterial suspension was spotted on the substrates, and some samples were let to air-dry under the bio-safety cabinet while other samples were freeze-dried without adding any cryoprotective substances. The freeze-dried samples were produced using a K775X Liquid Nitrogen Cooled, Turbo-Pumped EM Freeze Dryer, freezing the drop of bacteria directly on the precooled gold slice surface before putting them in the machine (10 temperature steps in 8 h, from −115 to 25 °C).

2.3. Bacterial Characterization by Raman Imaging

Bacterial samples of E. coli ATCC 8739 prepared as described in paragraph 2.3 were analyzed with a DXR™xi confocal Raman microscope (Thermo Scientific). Measurements were performed with a laser excitation wavelength of 532 nm. Each spectrum was acquired at a laser power of 8 mW with an exposure time of 0.033 s for 100 scans using a confocal pinhole aperture of 50 µm diameter. Maps of single bacterial cells were collected in the range 3300–650 cm−1 with a spectral resolution of 5 cm−1 using a 100× objective with a numerical aperture of 0.9 (Figure 1). Before every measurement, calibration of the instrument was achieved with a neon lamp and white LED lamp [18] and verified with monocrystalline silicon and a polystyrene standard. The frequency uncertainty was determined by the grating resolution of 5 cm−1; the intensity uncertainty was demonstrated to be lower than 5% using the polystyrene standard. A spectrum of monocrystalline silicon used as standard was taken and compared with a reference spectrum acquired in the same conditions to verify the success of the process (the 520 cm−1 characteristic Raman band of silicon is taken into consideration for this procedure). Proper calibrations are beneficial in the scope of this work in order to identify chemical compounds using reference and literature data, and to compare measurements acquired in different conditions (which could arise, for example, from the changes in environmental and instrumental parameters), in particular for the comparisons between freeze-dried and air-dried cells. Of course, the total uncertainty includes systematic biases that can manifest between measurements as well as random contributions affecting each spectrum, hence the intra-image variability is lower than the total one: multivariate analysis on single Raman maps is not affected by the former, and is inherently robust against the latter. For the bacteria band assignment, a polynomial fit at 6th order was applied to the average spectra of each sample in order to delete the fluorescence effects. Each spectral region of interest was analyzed, peaks were deconvolved in order to obtain the wavenumber of each maximum, and chemical meaning was assigned. Raman chemical images were collected with an image lateral resolution of 0.1 µm, provided by the step size of the sample stage. Then, the resolution is greater than the laser spot-size of approximately 0.45 µm.

2.4. Data Analysis and Multivariate Modelling

The Hypertools open-source interface for hyperspectral image analysis was used for data mining and analysis. To remove the noisy background around the bacterial cell, an image masking was created on the basis of k-means clustering with k = 6. The 4 k-means classes related to the background were removed as belonging to the mask, and an image composed by the pixels belonging to the bacterium only was generated.
Spectra preprocessing for PCA consisted in baseline correction (least squares fitting with a 2nd-order polynomial) and smoothing (2nd-order Savitsky–Golay method with 41 points window), the range between 666 cm−1 and 3120 cm−1 was considered. The spectra were mean-centered before PCA analysis.
Since PCA revealed two relevant PCs, the MCR-ALS method was set to resolve 2 components based on the recovery of a bilinear model D = CST + E, where D is the raw measurement, C is the matrix of concentration profiles, and ST the matrix of related pure spectra. E contains the experimental error of raw measurement. Because the Raman image dataset is structured as a data cube (3D), where two dimensions (x and y) are the pixel coordinates and the third is the spectral dimension, the data cube needs to be unfolded into a data matrix D, where the rows are the pixel spectra and the columns are related to the frequency (Raman shift) or, in general, spectral channels. The matrix D contains the raw pixel spectra, which will be decomposed into the concentration profiles (C matrix) and pure spectra (ST matrix) of the constituents present in the hyperspectral image. Every row of ST represents the pure spectrum of one of the image constituents. By taking a row of the C matrix, information on the chemical composition of the related pixel can be obtained, whereas by taking a column, the pixel-to-pixel variation of the concentration of a particular image constituent can be seen. Then, by folding back each C column to recover the original two-dimensional (2D) or 3D image configuration, the distribution map of each particular image constituent can be obtained [19]. The number of image constituents was determined by PCA on the whole image. The alternating optimization started by using the original preprocessed measurement, D, and an initial guess of either the C or the ST matrices. Non-negativity constraint was imposed for the two model components (MCR1 and MCR2).

3. Results and Discussion

3.1. Sub-Diffraction Raman Imaging on Single Cells of E. coli

In order to determine the spatial distribution of biocomponents of an E. coli ATCC 8739 cell Raman imaging was performed on a randomly selected isolated bacterial cell found in a drop of E. coli with a concentration of 1 × 10⁸ Colony-forming Units(CFU)/mL deposited on a golden substrate. Firstly, the mean Raman spectrum of E. coli was acquired (Figure 1) to present the complete chemical fingerprint of the bacterium. A tentative assignment of the main Raman bands to the molecular functional groups and the corresponding biomolecules is reported in Table 1.
Then, an air-dried (Figure 2A(α)) and a freeze-dried (Figure 2A(φ)) E. coli sample were compared to determine the different distribution of biological components, as captured by sub-micrometrical Raman imaging, in differently treated cells. This provides the possibility to perform an intracellular investigation of the spatial distribution of biological components using a hyperspectral technique without staining. The image of the single E. coli cell was obtained in a scanning area of about 6 × 5 μm. For both samples, the collection conditions were optimized, maximizing the most intense Raman signal at 2940 cm−1. The maps were colored according to the intensity of the peak of interest from blue to red as the Raman signal increased, to easily localize the corresponding biomolecules within the cell area.
In Figure 2B, Raman images colored with respect to the intensity of the most intense band in the Raman spectra of bacteria at 2940 cm−1 are shown, this signal corresponds to CH2/CH3 stretching [20,21]. These images attest that the cell is mostly intact after drying and that the biomaterial is uniformly distributed into the cell both in the air-dried and in the freeze-dried cells, even though a higher intensity can be noticed for the air-dried cell. Greater differences between the air-dried and the freeze-dried cells were revealed when focusing the attention on the peak at 1449 cm−1 (Figure 2C) that is related to δ(CH2/CH3) modes of C–H functional groups present in lipids, amino acid side chains of the proteins, and carbohydrates, which are all mostly located on the bacterial membrane region [24]. Differences in the integrity of the membrane were expected since bacteria subjected to freeze-dry process were instantly frozen in liquid nitrogen without the addition of any cryoprotective agent in this study, while air-dried bacteria did not experience any thermal shock and preserve a more intact membrane. In Figure 2A(φ), we show a freezed cell, which looks optically intact. Nevertheless, the distribution of the biocomponents revealed by Raman imaging (Figure 2B–E(φ)) witnesses membrane damage due to the sudden freeze shock. Even though freeze-drying method in the presence of a cryoprotectant could lead to a highly preserved cell structure, as it will be probably explored in a future research work, this first experiment was useful to demonstrate that Raman images capture the real distribution of molecular species within the sample, revealing differences in the case of proper or poor preparation method. It can be noticed that in the air-dried sample (Figure 2C(α)), the highest Raman intensity areas (red to yellow) are more homogeneously spread throughout the whole bacterial cell than in the freeze-dried sample (Figure 2C(φ)), where the membrane seems to have been damaged and the shape of the bacterial membrane results less defined. The line profiles of intensity across the cell (both longitudinal and transversal) for the same signals were extracted and normalized. They are plotted together in Figure S1 in supplementary information (SI) for an alternative visualization of the differences in the spatial distribution of the considered molecules.
Complementary analysis was done, recoloring the Raman images based on the signal intensity at 1243 cm−1 (Figure 2D) and 780 cm−1 (Figure 2E), which refer specifically to nucleic acids vibrations [21,23,24], a similar statement would be probably possible considering also the vibrational modes around 1000–1100 cm−1, but its less specific assignation and the possible overlapping with saccharide components led us to conveniently consider the 780 cm−1 peak for DNA mapping. As it is shown in Figure 2D and 2E, the spatial separation of the regions of the E. coli cell, in which the signal related to DNA vibrational modes shows relatively high intensity, is different from those characterized by the higher C–H signals of the membrane. Also in this case, it is clear that the air-dried sample (Figure 2D(α),E(α)) presents a more homogeneous distribution of the high-intensity regions than the freeze-dried sample (Figure 2D(φ),E(φ), respectively). Moreover, while in the air-dried cell the signal is condensed in the center of the cell, which is in accordance with the biological distribution of genetic material, in the freeze-dried sample it is not well confined by an intact membrane but it is inhomogeneously spread around, as it happens after membrane disruption. Furthermore, in the freeze-dried sample, the less intense but specific peak at 780 cm−1 of nucleic acids is nearly undetectable, whereas it can be mapped in the air-dried cell. These findings are supported by the observation of many other samples of air-dried and freeze-dried cells that were found to follow the same behavior; examples of these are shown in SI (Figure S2).
In order to further investigate the differences in the spatial distribution of the macromolecules in bacterial cells, we decided to apply multivariate analysis to the chemical Raman maps to consider the entire vibrational fingerprint of different biomolecules instead of the intensity of one peak at a time, which is not always very specific.

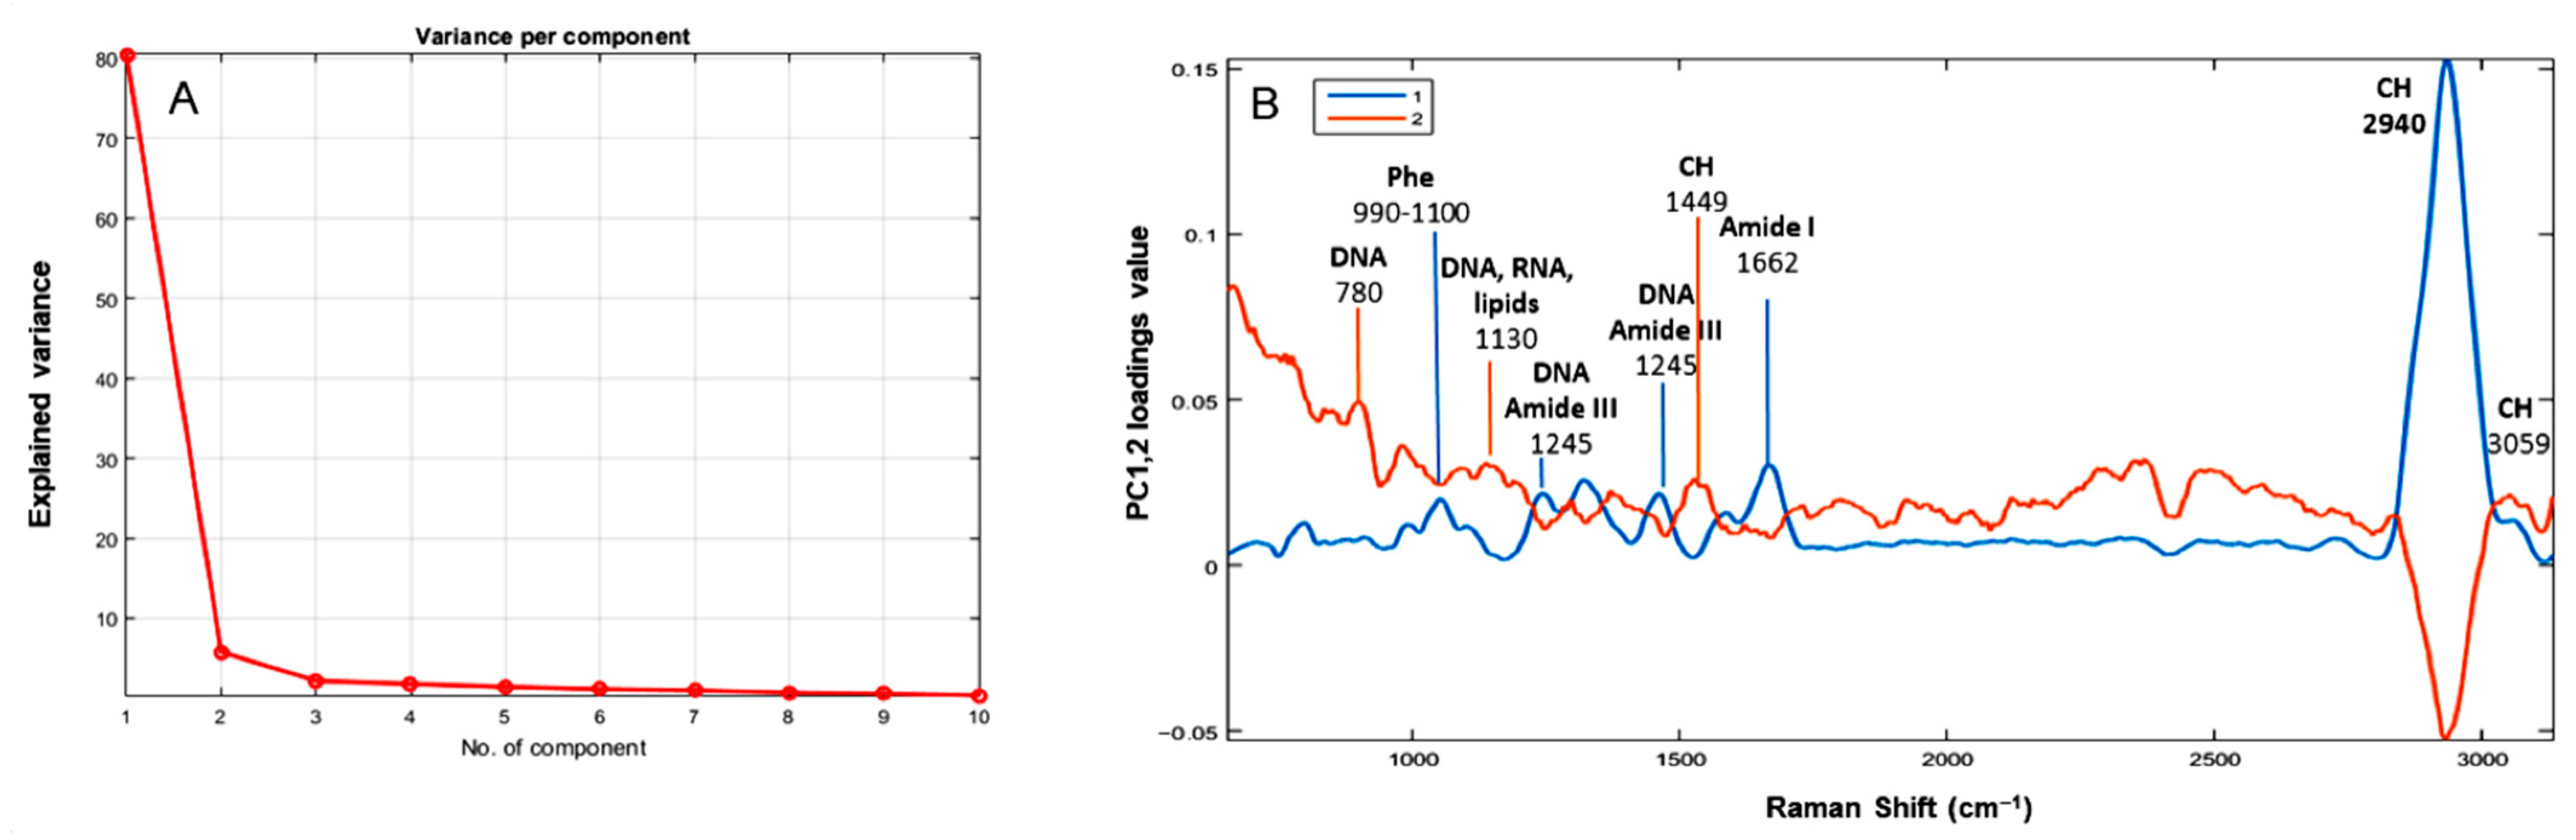
3.2. Principal Components Analysis

A new E. coli cell was selected from the air-dried samples (Figure 3A). As described in Section 2.1, bacteria were let grow to reach their mid-exponential growth phase. In this stage of growth, bacteria are replicating exponentially, thus the probability to find bacterial cells that are duplicating is maximized. Figure 3B shows the Raman chemical map of the sample taken into consideration, it is easy to notice that the dimensions of this cell are bigger than those of the cells observed before, in particular, its length is nearly double with respect to the cells shown in Figure 2. Furthermore, the intensity of the Raman signal at 2940 cm−1, which corresponds to CH stretching modes of proteins, nucleic acids, carbohydrates, and lipids, highlights an accumulation of biomaterials at the two poles of the cell with a very small amount of signal in the center. All this information supports the hypothesis that we are focusing on an actually duplicating bacterial cell. The principal component analysis (PCA) of the Raman spectra of the map was performed in order to visualize similarities between spectra and to identify unsupervised grouping of image pixels on the basis of their Raman signature, which reflects the chemical composition in that location. PCA allows an easier visualization of the variance of spectral profile in different regions of the bacterial cell and helps to focus the attention in the spectral regions containing nonrandom variation. The maps of the scores revealing the spatial distribution of the two first components are shown in Figure 3C,D. The significant variance of the Raman spectra that compose the chemical images was modelled by the first two principal components (PCs), which explain 86.2% of total variance (see the plot of the explained variance by each PC in Figure 4A). PC1 and PC2 loadings allowed to interpret the chemical meaning of compositional differences within the image (Figure 4B). Pixels from yellow to red represent regions where the scores of the selected PC have the higher value, meaning that in that region, the collected Raman spectra mainly show the spectral features captured by that PC. The loadings profiles in Figure 4B allow to determine the Raman signals represented by each component (PC1 in blue and PC2 in orange), revealing which chemical species are more represented in each PC (see Table 1 as reference for the chemical meaning assignment of the main Raman signals) and more abundant in the regions where the PC has higher scores (red regions in Figure 4B,C), providing the chemical information associated to the maps of the scores. In particular, it can be noticed that the main feature of both PCs is represented by the C–H stretching signal at 2940 cm−1, reflecting the nonhomogeneous distribution of biomaterial within the considered cell. Indeed, PC1 and PC2 scores maps show two different distributions based on the intensity of the scores, which are not homogeneously spread in the whole cell but seem to concentrate in different regions of the bacterium. The chemical map in Figure 4A, built on the Raman signal at 2940 cm−1, which corresponds to C–H stretching modes, shows a distribution along the cell similar to that revealed by PC1. Since C–H bonds are the most frequent in each biomolecule present in the cell (e.g., lipids, protein, and DNA), this distribution indicates that there is a higher density of biomaterial at the cell edges, suggesting that the cell is undergoing replication. However, it can be noticed that DNA related bands (780, 1000–1100, and 1243 cm−1), already commented on in the discussion of the Raman maps in a univariate way, are captured by the first two PCs, attesting to their importance in the spectral variance and therefore for the description of the biological system under analysis.
Although PCA is useful to visualize regions with different chemical composition, a detailed interpretation of chemical information brought by the PCs is not always successful since the vibrational modes of the chemical compounds are not always represented in the PCs loadings maintaining the same profile of the chemical Raman spectra, for example, negative peaks can appear since the shape of the bands are the results of the mathematical elaboration and do not reflect the exact vibrational spectral bands. For this reason, an exhaustive interpretation of PCA loadings in relation to respective Raman signals might lead to some difficulties. In PCA, the importance of a principal component is assessed by its eigenvalue or contribution. Eigenvalues represent the amount of information explained in each component. Components explaining large amounts of information are preferentially chosen over components with less information. Although it is well known that in biological systems, large changes may be triggered by small changes [25]. Thus, we analyzed data with MCR, which has no relation to the amount of information and can identify more components with low information than PCA can [26].

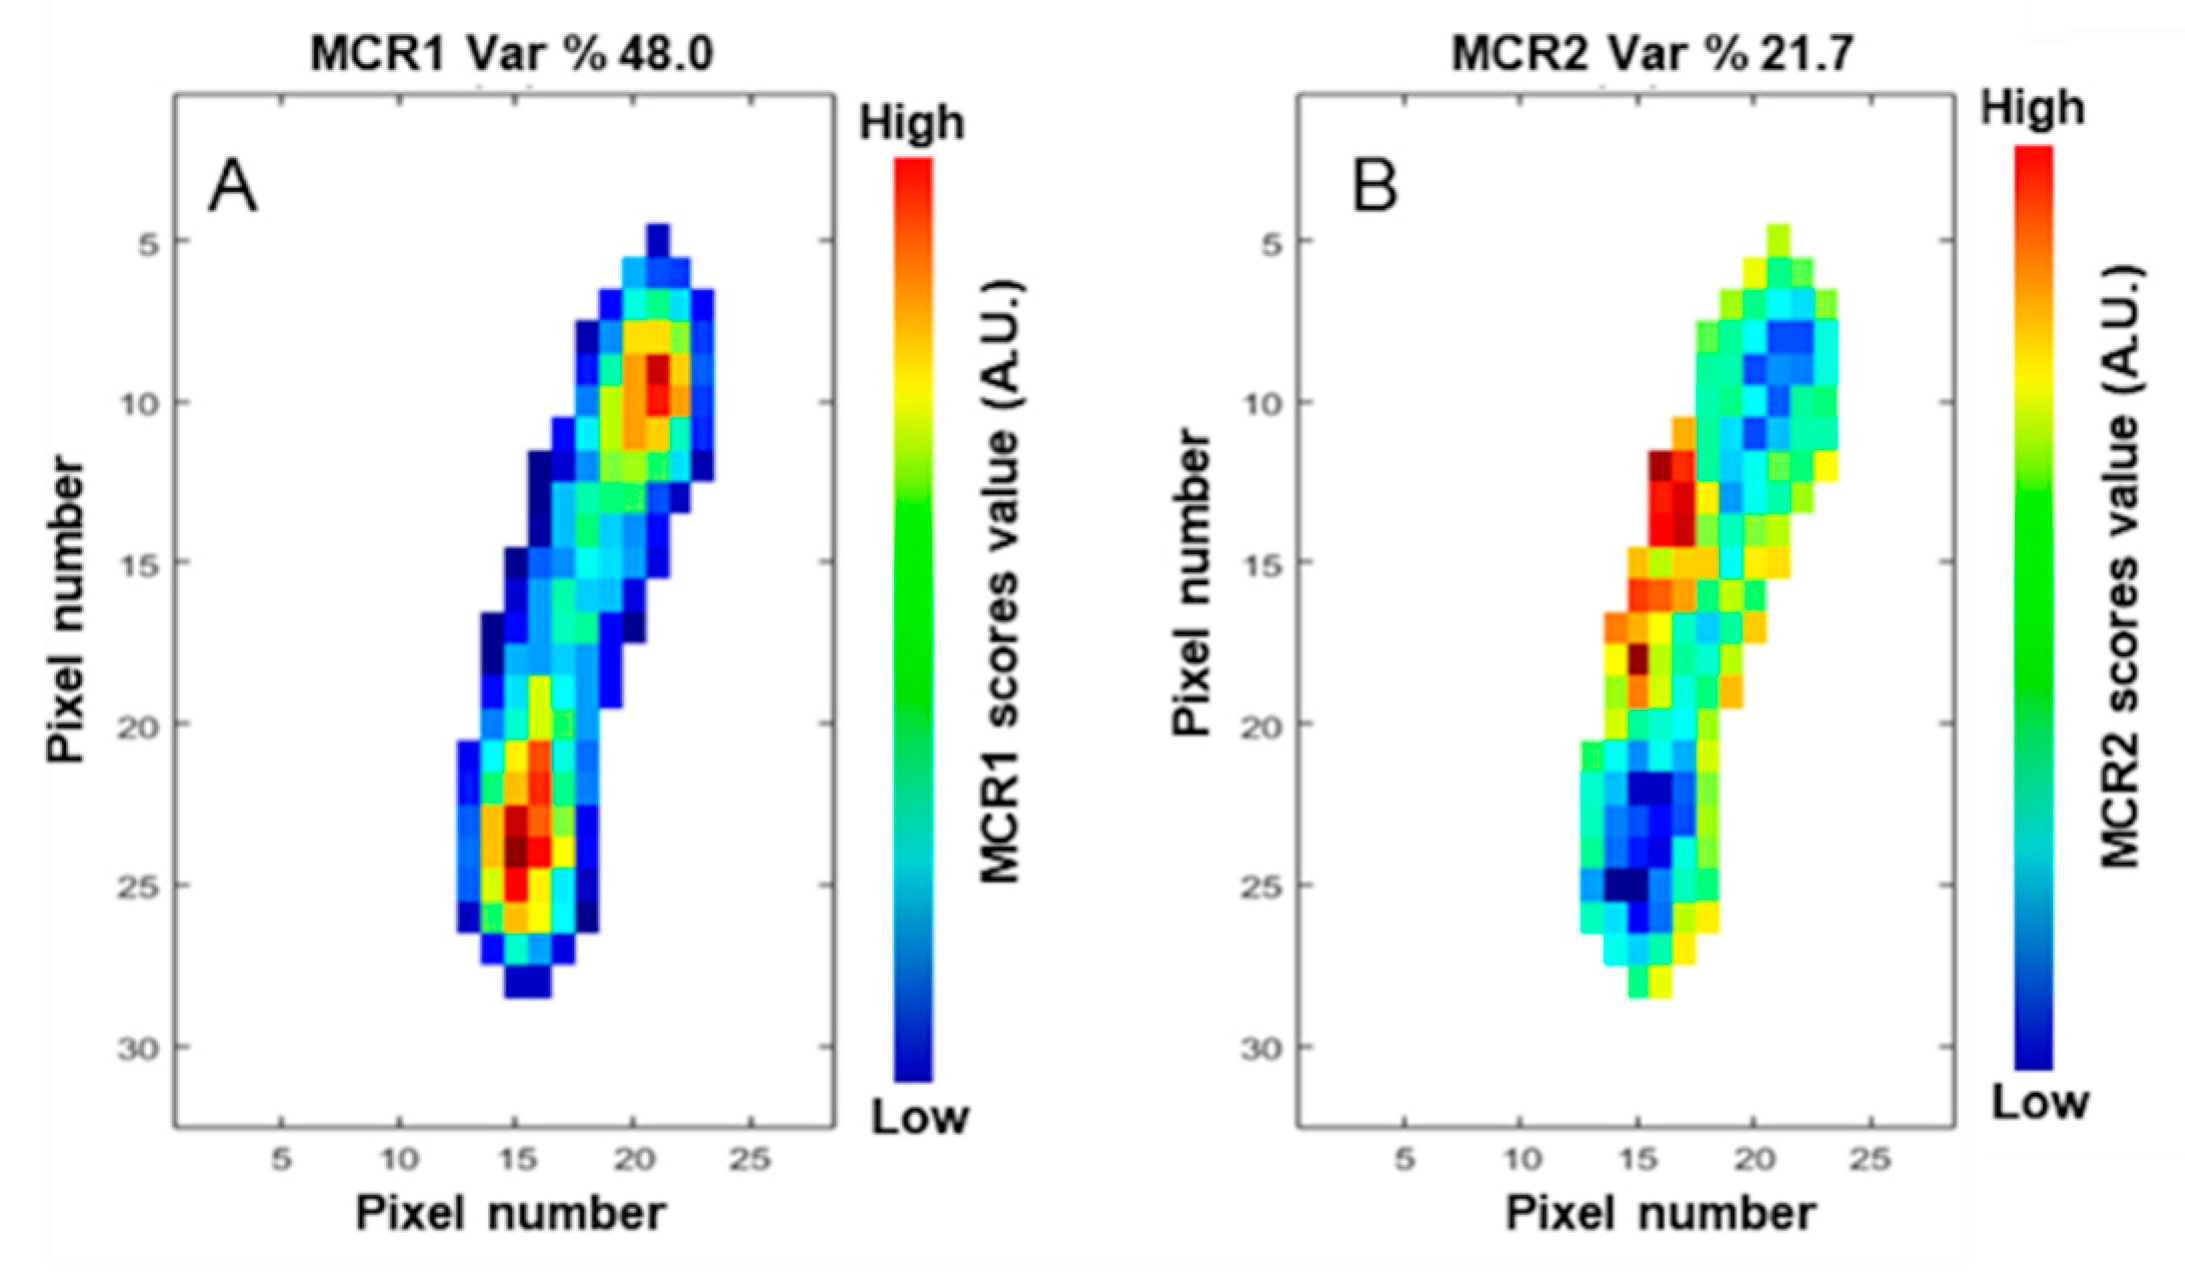
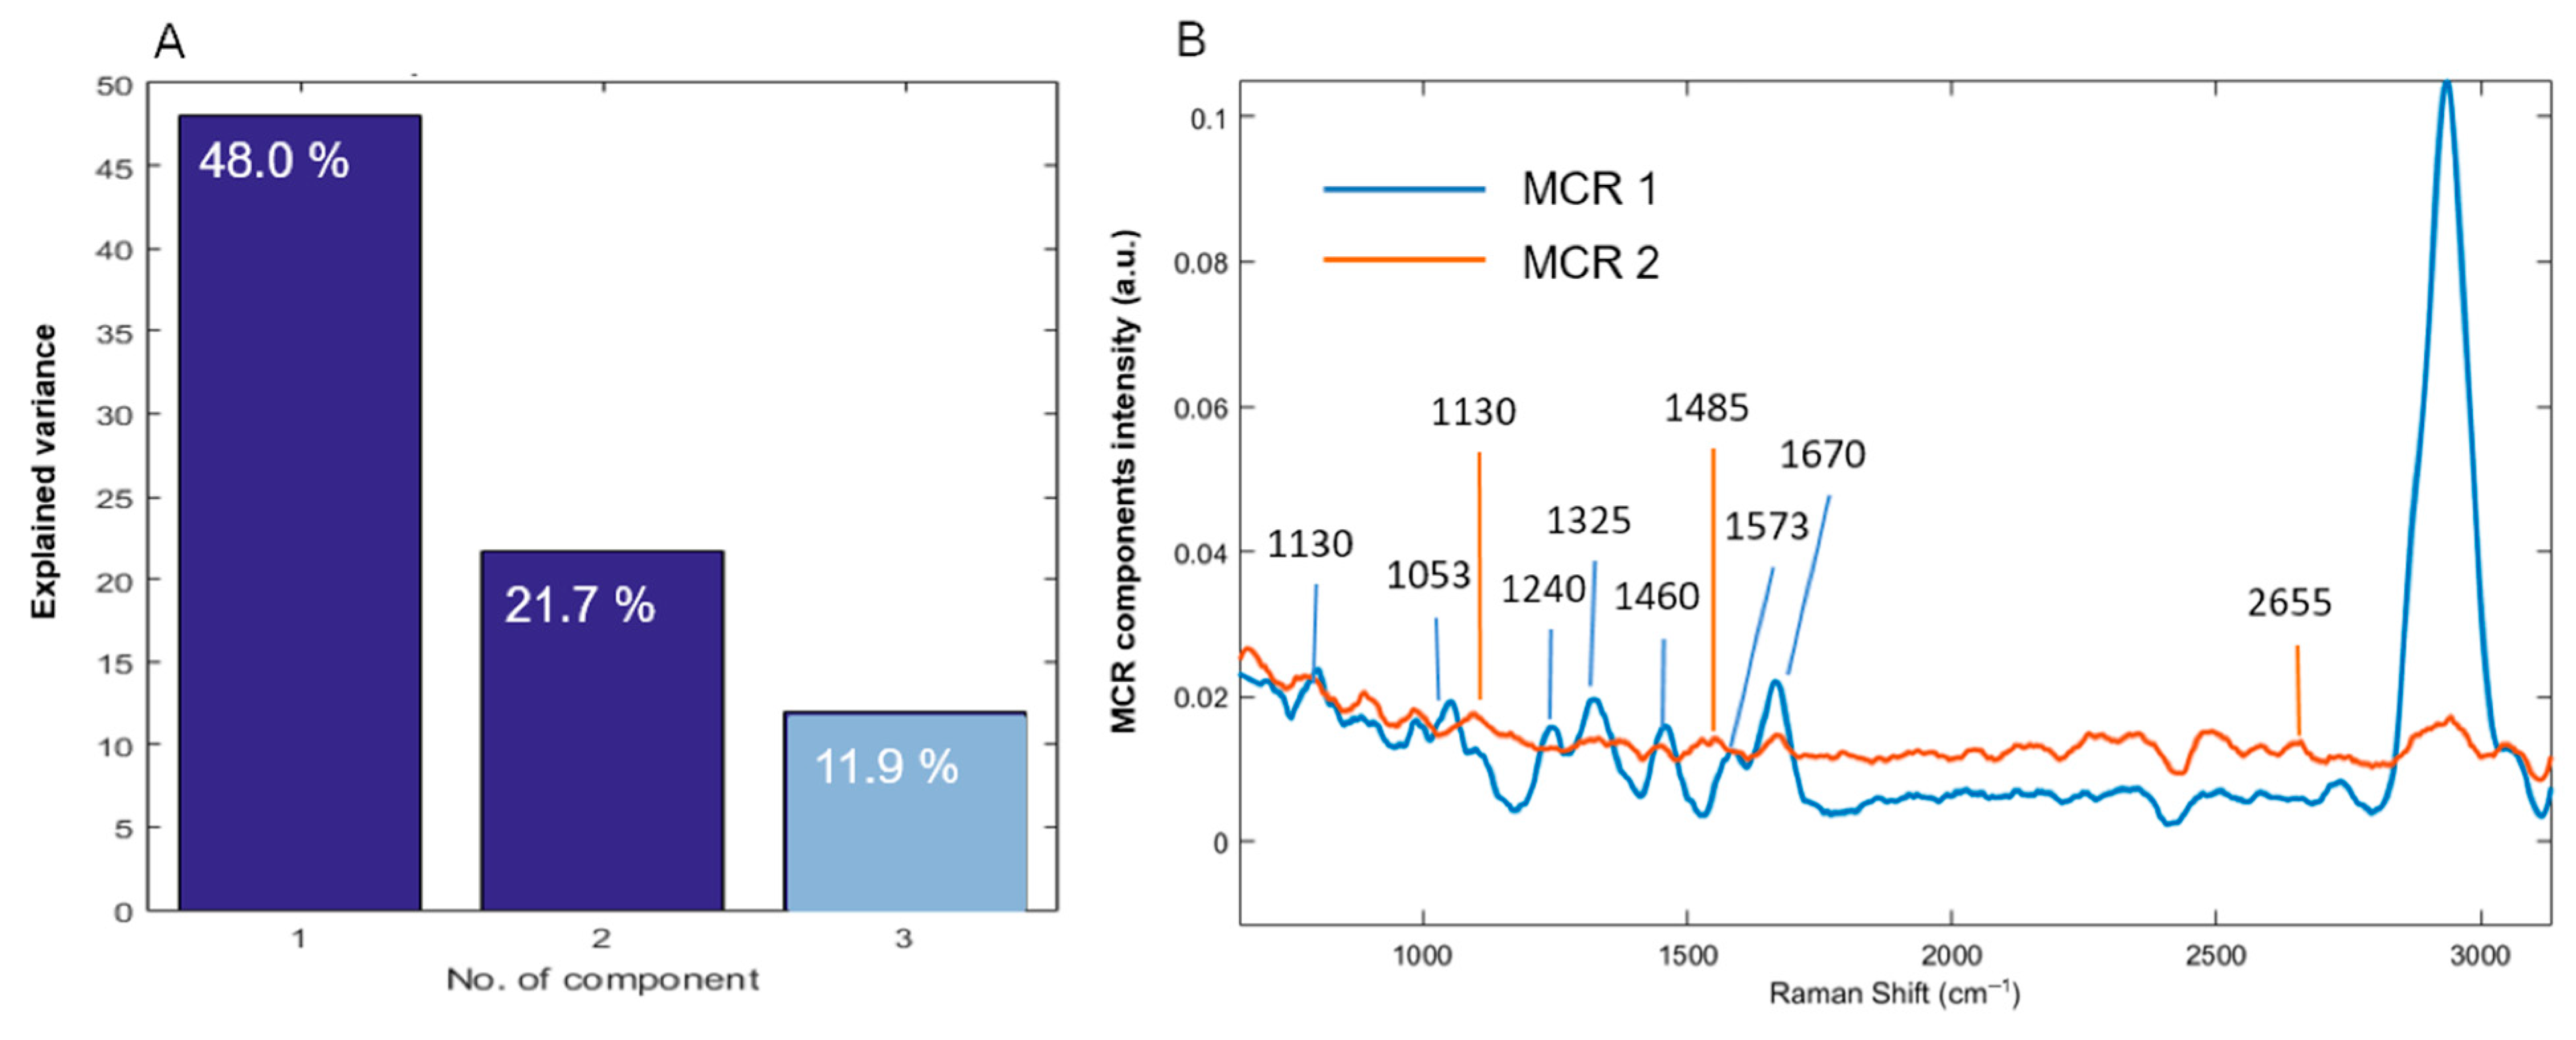
3.3. Multivariate Curve Resolution–Alternating Least Squares

MCR-ALS is an iterative modelling method that provides the optimized estimates of pure deconvolved spectral shapes (i.e., the loadings which maintain a profile with a chemical meaning of the original spectrum) and score matrix (representing the concentrations of each pure component in one single image pixel) to resolve mixed spectra, conserving the chemical meaning of each component.
Figure 5 shows the MCR pattern of the two components that were found to contain major information in the MCR analysis. It is easy to notice that the MCR1 (Figure 5A) and MCR2 (Figure 5B) patterns are in accordance with PC1–PC2 score plot of PCA, but allow further interpretation of biomolecules distribution. As for what we have observed from the score plots, also in this case the spectral regions evidenced by MCR components have a high correspondence to that emerged from univariate analysis, but with higher specificity, since a spectral pattern is considered instead of one single peak at a time. Indeed, a spectral band analysis was possible on the MCR loadings plot, which allows easier comprehension with respect to PCA loadings. The MCR components indeed maintain a profile, which can be chemically interpreted thanks to the non-negativity constraint (Figure 6). Two MCR components were considered for the biochemical description of the system. Even though MCR3 explains 11.9% of variance, it was not considered since it is not related to meaningful spectral bands but to the baseline trend due to fluorescence compensation performed by the acquisition software and it is not relevant for the discussion.
The MCR1 component shows spectral features mainly found in the spectra at the two poles of the bacterial cell, while the contribution of MCR2 is mainly revealed in the central region of the cell. Furthermore, higher MCR2 scores seem to concentrate on the border of the cell, indicating the correlation of those signals to the bacterial membrane. Moreover, the high contribution of CH band at 2940 cm−1 in MCR1 suggests that there is a higher density of biomaterial in general, at the two poles of the cell (as previously mentioned), suggesting that the cell is undergoing replication. Cell division must be coordinated with the faithful segregation of the newly duplicated genetic material to each daughter cell.
Precedent studies of the dynamic localization of proteins and genetic materials, conducted with fluorescence microscopy techniques in E. coli cells [27], have shown that in the earliest stage of segregation, after origin duplication at the cell center, sister origins move rapidly toward opposite cell poles and remain there, which establishes polarity. Subsequent replication and DNA condensation result in the bulk of the chromosomes moving towards their respective origins [28]. In brief, during DNA replication, newly duplicated daughter chromosomes separate from each other, forming two large masses known as nucleoids with a DNA-free zone in between. Then, a cytokinesis ring made of tubulin-like proteins (FtsZ), called Z-ring, assembles approximately in the center of the cell; this ring is fundamental for bacterial replication because it recruits in an ordered sequence a series of additional proteins that mediate division. The nucleoids appear to interfere with Z-ring assembly, perhaps by close contact with the inside surface of the cytoplasmic membrane, where the nucleation of FtsZ polymerization is believed to take place [29]. The polymerization of the Z-ring protein is then favored in the cell middle, where chromosome segregation has created a space between the DNA masses. Thus, dynamic protein and nucleic acid determinants work together to ensure that the cell finds its precise mid-point when it undergoes binary fission [30] (pp. 89–98). Therefore, during cellular division, a bacterial cell’s pole can be the target for chromosome regions as well as for proteins, motivating the higher concentration of biological material in these regions, attested by intense C–H stretching signals.
In addition, if we consider the secondary chemical bands represented in the MCR loadings associated with nucleic acids, beyond the CH stretching band that is clearly dominating MCR1, the hypothesis that the bacterial cell is dividing is supported. The major peaks associated with this MCR component refer to vibrational modes of proteins and nucleic acids (780, 1000–1100, and 1243 cm−1), supporting the theory that the chromosome is segregated at the two opposite sides of the cell with the two replication origins and the proteins needed for the division. Therefore, here Raman signals due to the two nucleoids are captured.
On the other hand, MCR2, in orange in Figure 6, shows highest scores in the center of the cell. It seems to refer to the cellular membrane composed of proteins, lipids, and carbohydrates. This interpretation is in agreement with the fact that the center of the divisional bacterial cell, between the two nucleosomes, is a DNA-free zone (Figure 5B). In this region, the cellular membrane-associated signals concentrate due to accumulation of the Z-ring proteins that mediate the cytokinesis, as said before.

4. Conclusions

Raman chemical imaging was used to investigate single bacterial cells at sub-micrometrical level and identify macromolecules, which have a different distribution throughout the cell.
Our study on E. coli demonstrated that Raman signals due to genetic material can be distinguished from those due to the bacterial membrane. Bacterial samples that were subjected to different drying procedures (air-drying or freeze-drying) showed different chemical map patterns related to the integrity conditions of the bacterial membrane. Furthermore, performing statistical multivariate analysis on the data obtained from the maps, we were able to confirm that Raman imaging allows the visualization of the DNA segregation and the Z-ring formation during the cellular division. In particular, MCR components’ color patterns are complementary to the results of PCA because, based on the previous analysis of the loadings, the cluster of spectra dominated by MCR1 is more related to DNA components and the other, dominated by MCR2, captures the Z-ring proteins and other cellular membrane components. This image analysis technique confirmed that Raman spectroscopy guarantees sufficient specificity and sensitivity to catch cell division, which is coordinated with the faithful segregation of the newly duplicated genetic material to each daughter cell. This could open the doors to real-time molecular analysis at a sub-micrometer level also on living cells without the necessity of any labelling or sample preparation procedure.

Supplementary Materials

The following are available online at https://www.mdpi.com/article/10.3390/app11083409/s1.

Author Contributions

G.B., A.S., L.M., and A.M.G., conceptualization; G.B. and A.S., data curation; L.M. and A.S., formal analysis; C.P. and A.M.R., funding acquisition; G.B., L.M., and A.M.G., investigation; G.B., A.S., L.M., and A.M.G., methodology; A.M.R. and A.M.G., project administration; A.M.R., A.M.G., and C.P., resources; L.M. and A.S., software; A.M.R. and A.M.G., supervision; G.B. and A.M.G., validation; all, visualization; G.B. and L.M., writing—original draft; all authors, writing—review and editing. All authors have read and agreed to the published version of the manuscript.

Funding

The present work has been supported by the ViraDEP project “Spettroscopia Raman accoppiata con dielettroforesi (Raman-DEP) per l’identificazione di virus e la valutazione di molecole antivirali”, which has received funding from the CRT foundation (Fondazione Cassa di Risparmio di Torino), Reference number: 2020.0598.

Data Availability Statement

The data presented in this study are available on request from the corresponding author.

Conflicts of Interest

The authors declare no conflict of interest. The funders had no role in the design of the study; in the collection, analyses, or interpretation of data; in the writing of the manuscript, or in the decision to publish the results.

References

  1. Uzunbajakava, N.; Lenferink, A.; Kraan, Y.; Volokhina, E.; Vrensen, G.; Greve, J.; Otto, C. Nonresonant confocal Raman imaging of DNA and protein distribution in apoptotic cells. Biophys. J. 2003, 84, 368–3981. [Google Scholar] [CrossRef] [Green Version]
  2. Li, M.; Xu, J.; Romero-Gonzalez, M.; Banwart, S.A.; Huang, W.E. Single cell Raman spectroscopy for cell sorting and imaging. Curr. Opin. Biotechnol. 2012, 23, 56–63. [Google Scholar] [CrossRef]
  3. Wenning, M.; Scherer, S. Identification of microorganisms by FTIR spectroscopy: Perspectives and limitations of the method. Appl. Microbiol. Biotechnol. 2013, 97, 7111–7120. [Google Scholar] [CrossRef]
  4. Palonpon, A.F.; Ando, J.; Yamakoshi, H.; Dodo, K.; Sodeoka, M.; Kawata, S.; Fujita, K. Raman and SERS microscopy for molecular imaging of live cells. Nat. Protoc. 2013, 8, 677–692. [Google Scholar] [CrossRef] [PubMed]
  5. Mandrile, L.; Zeppa, G.; Giovannozzi, A.M.; Rossi, A.M. Controlling protected designation of origin of wine by Raman spectroscopy. Food Chem. 2016, 244, 16–24. [Google Scholar] [CrossRef]
  6. Lu, X.; Al-Qadiri, H.M.; Lin, M.; Rasco, B.A. Application of mid-infrared and Raman Spectroscopy to the study of bacteria. Food Bioproc. Technol. 2011, 4, 919–935. [Google Scholar] [CrossRef]
  7. de Juan, A.; Tauler, R. Multivariate curve resolution (MCR) from 2000: Progress in concepts and applications. Crit. Rev. Anal. Chem. 2006, 36, 163–176. [Google Scholar] [CrossRef]
  8. Piqueras, S.; Duponchel, L.; Tauler, R.; De Juan, A. Resolution and segmentation of hyperspectral biomedical images by Multivariate Curve Resolution-Alternating Least Squares. Anal. Chim. Acta 2011, 36, 163–176. [Google Scholar] [CrossRef]
  9. Barzan, G.; Sacco, A.; Mandrile, L.; Giovannozzi, A.M.; Brown, J.; Portesi, C.; Alexander, M.R.; Williams, P.; Hardie, K.R.; Rossi, A.M. New frontiers against antibiotic resistance: A Raman-based approach for rapid detection of bacterial susceptibility and biocide-induced antibiotic cross-tolerance. Sens. Actuat. B Chem. 2020, 309, 127774. [Google Scholar] [CrossRef]
  10. Münchberg, U.; Rösch, P.; Bauer, M.; Popp, J. Raman spectroscopic identification of single bacterial cells under antibiotic influence. Anal. Bioanal. Chem. 2014. [Google Scholar] [CrossRef]
  11. Polisetti, S.; Bible, A.N.; Morrell-Falvey, J.L.; Bohn, P.W. Raman chemical imaging of the rhizosphere bacterium Pantoea spp. YR343 and its co-culture with Arabidopsis thaliana. Analyst 2016, 141, 2175–2182. [Google Scholar] [CrossRef] [PubMed]
  12. Mandrile, L.; Amato, G.; Marchis, D.; Martra, G.; Rossi, A.M. Species-specific detection of processed animal proteins in feed by Raman spectroscopy. Food Chem. 2017, 229, 268–275. [Google Scholar] [CrossRef] [PubMed]
  13. Mandrile, L.; Rotunno, S.; Miozzi, L.; Vaira, A.M.; Giovannozzi, A.M.; Rossi, A.M.; Noris, E. Nondestructive Raman spectroscopy as a tool for early detection and discrimination of the infection of tomato plants by two economically important viruses. Anal. Chem. 2019, 91, 9025–9031. [Google Scholar] [CrossRef] [PubMed]
  14. Mandrile, L.; Fusaro, I.; Amato, G.; Marchis, D.; Martra, G.; Rossi, A.M. Detection of insect′s meal in compound feed by Near Infrared spectral imaging. Food Chem. 2018, 267, 240–245. [Google Scholar] [CrossRef] [PubMed] [Green Version]
  15. Amigo, J.M.; Martí, I.; Gowen, A. Hyperspectral Imaging and Chemometrics. A Perfect Combination for the Analysis of Food Structure, Composition and Quality. In Data Handling in Science and Technology; Elviser: Amsterdam, The Netherlands, 2013. [Google Scholar]
  16. Eriksson, L.; Antti, H.; Gottfries, J.; Holmes, E.; Johansson, E.; Lindgren, F.; Long, I.; Lundstedt, T.; Trygg, J.; Wold, S. Using chemometrics for navigating in the large data sets of genomics, proteomics, and metabonomics (gpm). Anal. Bioanal. Chem. 2004, 380, 419–429. [Google Scholar] [CrossRef]
  17. Sacco, A.; Imbraguglio, D.; Giovannozzi, A.M.; Portesi, C.; Rossi, A.M. Development of a candidate reference sample for the characterization of tip-enhanced Raman spectroscopy spatial resolution. RSC Adv. 2018, 8, 27863–27869. [Google Scholar] [CrossRef] [Green Version]
  18. Cara, E.; Mandrile, L.; Sacco, A.; Giovannozzi, A.M.; Rossi, A.M.; Celegato, F.; De Leo, N.; Hönicke, P.; Kayser, Y.; Beckhoff, B.; et al. Towards a traceable enhancement factor in surface-enhanced Raman spectroscopy. J. Mater. Chem. C 2020, 8, 16513–16519. [Google Scholar] [CrossRef]
  19. De Juan, A.; Jaumot, J.; Tauler, R. Multivariate Curve Resolution (MCR). Solving the mixture analysis problem. Anal. Methods 2014, 6, 4964–4976. [Google Scholar] [CrossRef]
  20. Harz, M.; Rösch, P.; Peschke, K.D.; Ronneberger, O.; Burkhardt, H.; Popp, J. Micro-Raman spectroscopic identification of bacterial cells of the genus Staphylococcus and dependence on their cultivation conditions. Analyst 2005, 130, 1543–1550. [Google Scholar] [CrossRef]
  21. Movasaghi, Z.; Rehman, S.; Rehman, I.U. Raman spectroscopy of biological tissues. Appl. Spectrosc. Rev. 2007, 42, 493–541. [Google Scholar] [CrossRef]
  22. Harz, M.; Kiehntopf, M.; Stöckel, S.; Rösch, P.; Straube, E.; Deufer, T.; Popp, J. Direct analysis of clinical relevant single bacterial cells from cerebrospinal fluid during bacterial meningitis by means of micro-Raman spectroscopy. J. Biophotonics 2009, 2, 70–80. [Google Scholar] [CrossRef]
  23. Socrates, G. Infrared and Raman Characteristic Group Frequencies. Tables and Charts; John Wiley & Sons, Ltd.: Hoboken, NJ, USA, 2001. [Google Scholar]
  24. Kloß, S.; Kampe, B.; Sachse, S.; Rösch, P.; Straube, E.; Pfister, W.; Kiehntopf, M.; Popp, J. Culture independent Raman spectroscopic identification of urinary tract infection pathogens: A proof of principle study. Anal. Chem. 2013, 85, 9610–9616. [Google Scholar] [CrossRef]
  25. Tamotsu, K.; Shinji, F.; Akemi, F.; Wataru, S.; Masahira, H.; Jun, K.; Hiroshi, O.; Ohara, O. Multiple omics uncovers host-gut microbial mutualism during prebiotic fructooligosaccharide supplementation. DNA Res. 2014, 21, 469–480. [Google Scholar] [CrossRef] [Green Version]
  26. Motegi, H.; Tsuboi, Y.; Saga, A.; Kagami, T.; Inoue, M.; Toki, H.; Minowa, O.; Noda, T.; Kikuchi, J. Identification of Reliable Components in Multivariate Curve Resolution-Alternating Least Squares (MCR-ALS): A Data-Driven Approach across Metabolic Processes. Sci. Rep. 2015, 5, 1–12. [Google Scholar] [CrossRef] [PubMed] [Green Version]
  27. Niki, H.; Yamaichi, Y.; Hiraga, S. Dynamic organization of chromosomal DNA in Escherichia coli. Genes Dev. 2000, 14, 212–223. [Google Scholar] [CrossRef] [PubMed]
  28. Gordon, G.S.; Wright, A. DNA Segregation in Bacteria. Annu. Rev. Microbiol. 2000, 54, 681–708. [Google Scholar] [CrossRef] [PubMed]
  29. Woldringh, C.L.; Mulder, E.; Huls, P.G.; Vischer, N. Toporegulation of bacterial division according to the nucleoid occlusion model. Res. Microbiol. 1991, 142, 309–320. [Google Scholar] [CrossRef]
  30. Shapiro, L.; Losick, R. Dynamic spatial reglation in the bacterial cell. Cell 2000, 100, 89–98. [Google Scholar] [CrossRef]
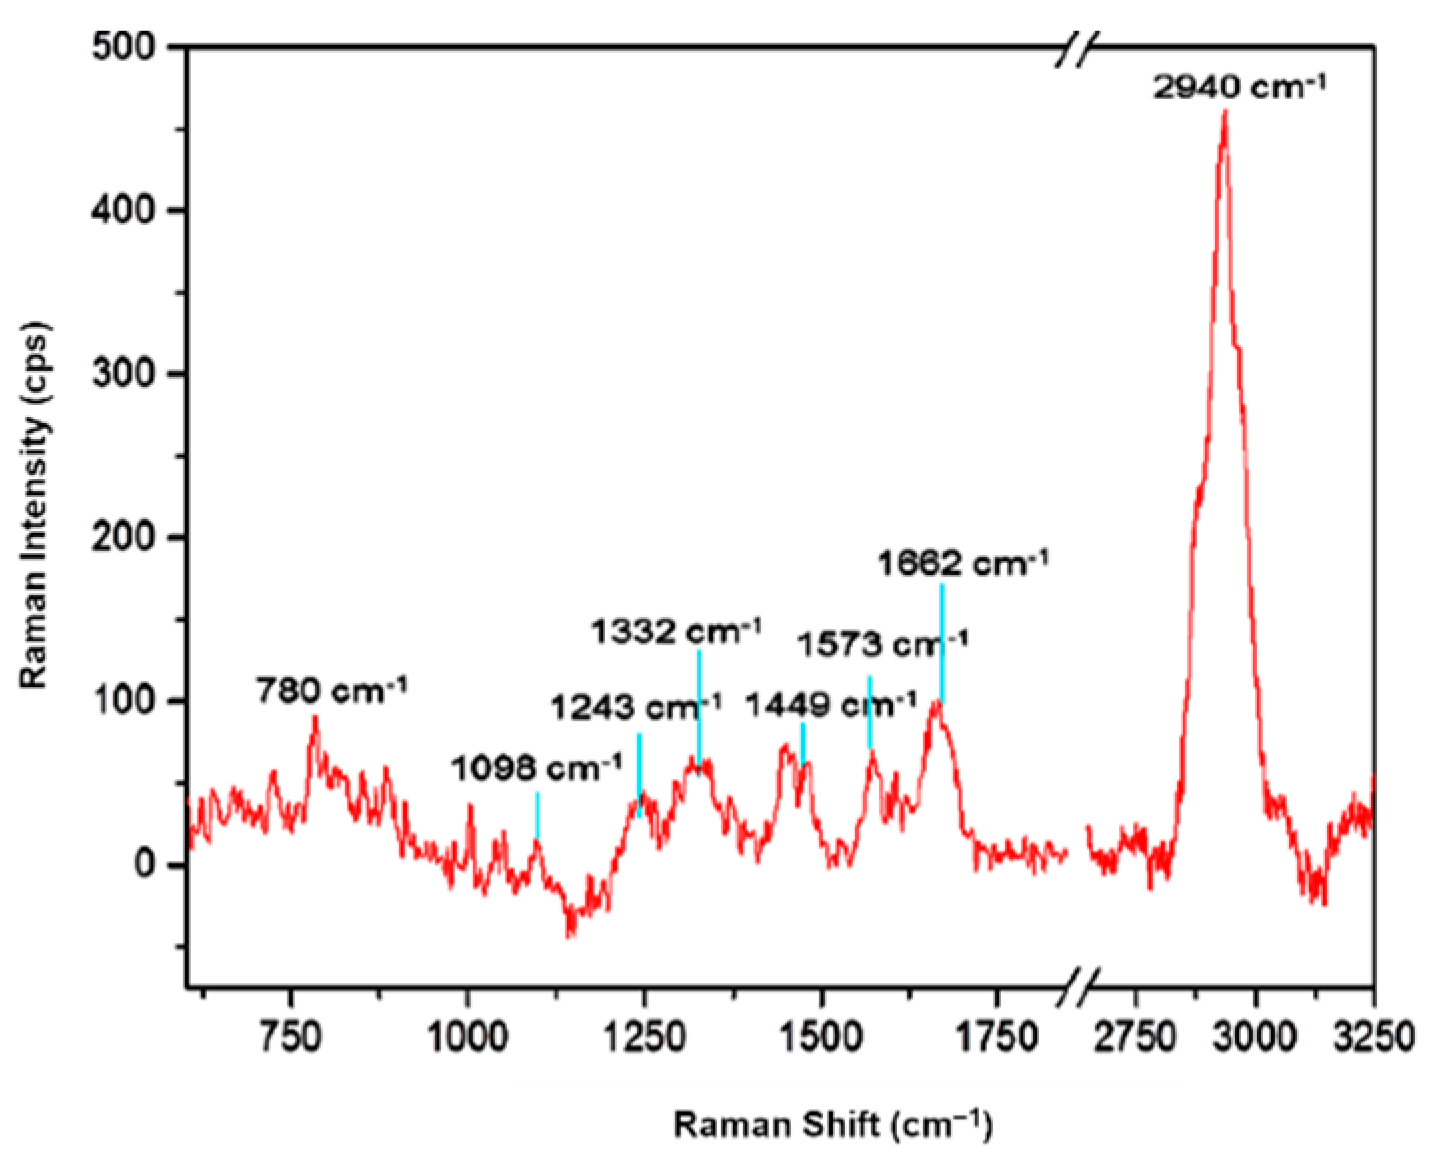
 [Green Version]
Figure 1. Raman spectra of a single cell of E. coli spotted on a golden substrate with respective band assignment.
Applsci 11 03409 g001
Figure 2. (A) Confocal Microscope image of a sample of E. coli spotted on a gold surface taken with a 100× microscope objective. (B) Chemical Raman map obtained on the single bacterial cell; the color scale is based on the intensity of the Raman signal at 2940 cm−1 of generic biomaterial. (C) Chemical Raman map at 1449 cm−1 representing cell membrane. (D) Chemical Raman map at 1243 cm−1 representing nucleic acids. (E) Chemical Raman map at 780 cm−1 representing nucleic acids; (α) air-dried cell, (φ) freeze-dried cell.
Applsci 11 03409 g002
Figure 3. (A) Confocal Microscope image of a replicating E.coli cell spotted on a gold surface taken with a 100× microscope objective obtained in dark field. (B) Raman chemical map of a replicating E. coli cell colored on the basis of the Raman Intensity at 2940 cm−1. (C) Scores’ intensity of PC1 distribution. The color scale is based on PC1 scores’ intensity, from lowest (blue) to highest (red). (D) Score intensity of PC2 distribution. The color scale is based on PC2 scores’ intensity, from lowest (blue) to highest (red).
Applsci 11 03409 g003
Figure 4. (A) Explained variance by the first 10 PCs. (B) Loadings profile of PC1 (blue) and PC2 (orange) in the range between 666 and 3120 cm−1 with corresponding chemical band assignment.
Applsci 11 03409 g004
Figure 5. (A) Score plot of MCR1. The color scale is based on MCR1 intensity, from lowest (blue) to highest (red). (B) Score plot of MCR2. The color scale is based on MCR2 intensity, from lowest (blue) to highest (red).
Applsci 11 03409 g005
Figure 6. (A) Explained variance by the first 10 MCR components. (B) Loadings plot of MCR1 (blue) and MCR2 (orange) in the range between 666 and 3120 cm−1. Chemical band assignment is reported (see Table 1 for details).
Applsci 11 03409 g006
Table 1. Raman bands assignments to functional groups and corresponding biomolecules.
Raman Shift (cm−1)Assignment 1Chemical Compound 1Reference
2940νCH2 asymmetric
νCH3 symmetric
carbohydrates, amino acids, proteins, lipids2935 [20]
2935 [21]
1662amide I band
νC=C
nucleic acids1666 [22]
1663 [21]
1573amide II band
δNH; νCN
nucleic acids (G, A)1565 [23]
1575 [20]
1440–1480δ(CH2/CH3)lipids, amino acid, side chains of proteins and carbohydrates1440–1460 [20]; 1450 [22]
1332ring vibration
δCH2
nucleic acids (G, A) and tryptophan
proteins
1337 [20]
1337 [20]
1243νC–C, νC–O
amide III band
ν(PO2) asymmetric
νC–O–S
nucleic acids (A, T)

DNA bases
sulpholipids
1250–1000 [23]
1245 [20]
1243 [20]
1240 [23]
1098ring stretching

νC–O–C symmetric glycosidic link; νC–N; νC–C
saccharide components (lipid, DNA and RNA backbone); phenylalanine1115–1005 [23]

1104 [21]
1125 [20]; 1099 [21]
780ring breathing modesnucleic acids (C, T, U), phenylalanine, pyranose compounds786–780 [21]
1 ν: stretching mode, δ: deformation mode, G: guanine, A: adenine, T: thymine, C: cytosine, U: uracil.
Publisher’s Note: MDPI stays neutral with regard to jurisdictional claims in published maps and institutional affiliations.

