
Seismic Response of Skewed Integral Abutment Bridges under Near-Fault Ground Motions, Including Soil–Structure Interaction


Abstract
1. Introduction
2. Modeling of Skewed Integral Abutment Bridges
2.1. Three Dimensional Bridge Model
2.2. Nonlinear Soil Springs
2.2.1. Soil Springs behind the Abutment
2.2.2. Soil Springs around the Piles
2.3. Modal Analysis and Sensitivity Studies
3. Nonlinear Time-History Analyses on Skewed Integral Abutment Bridges
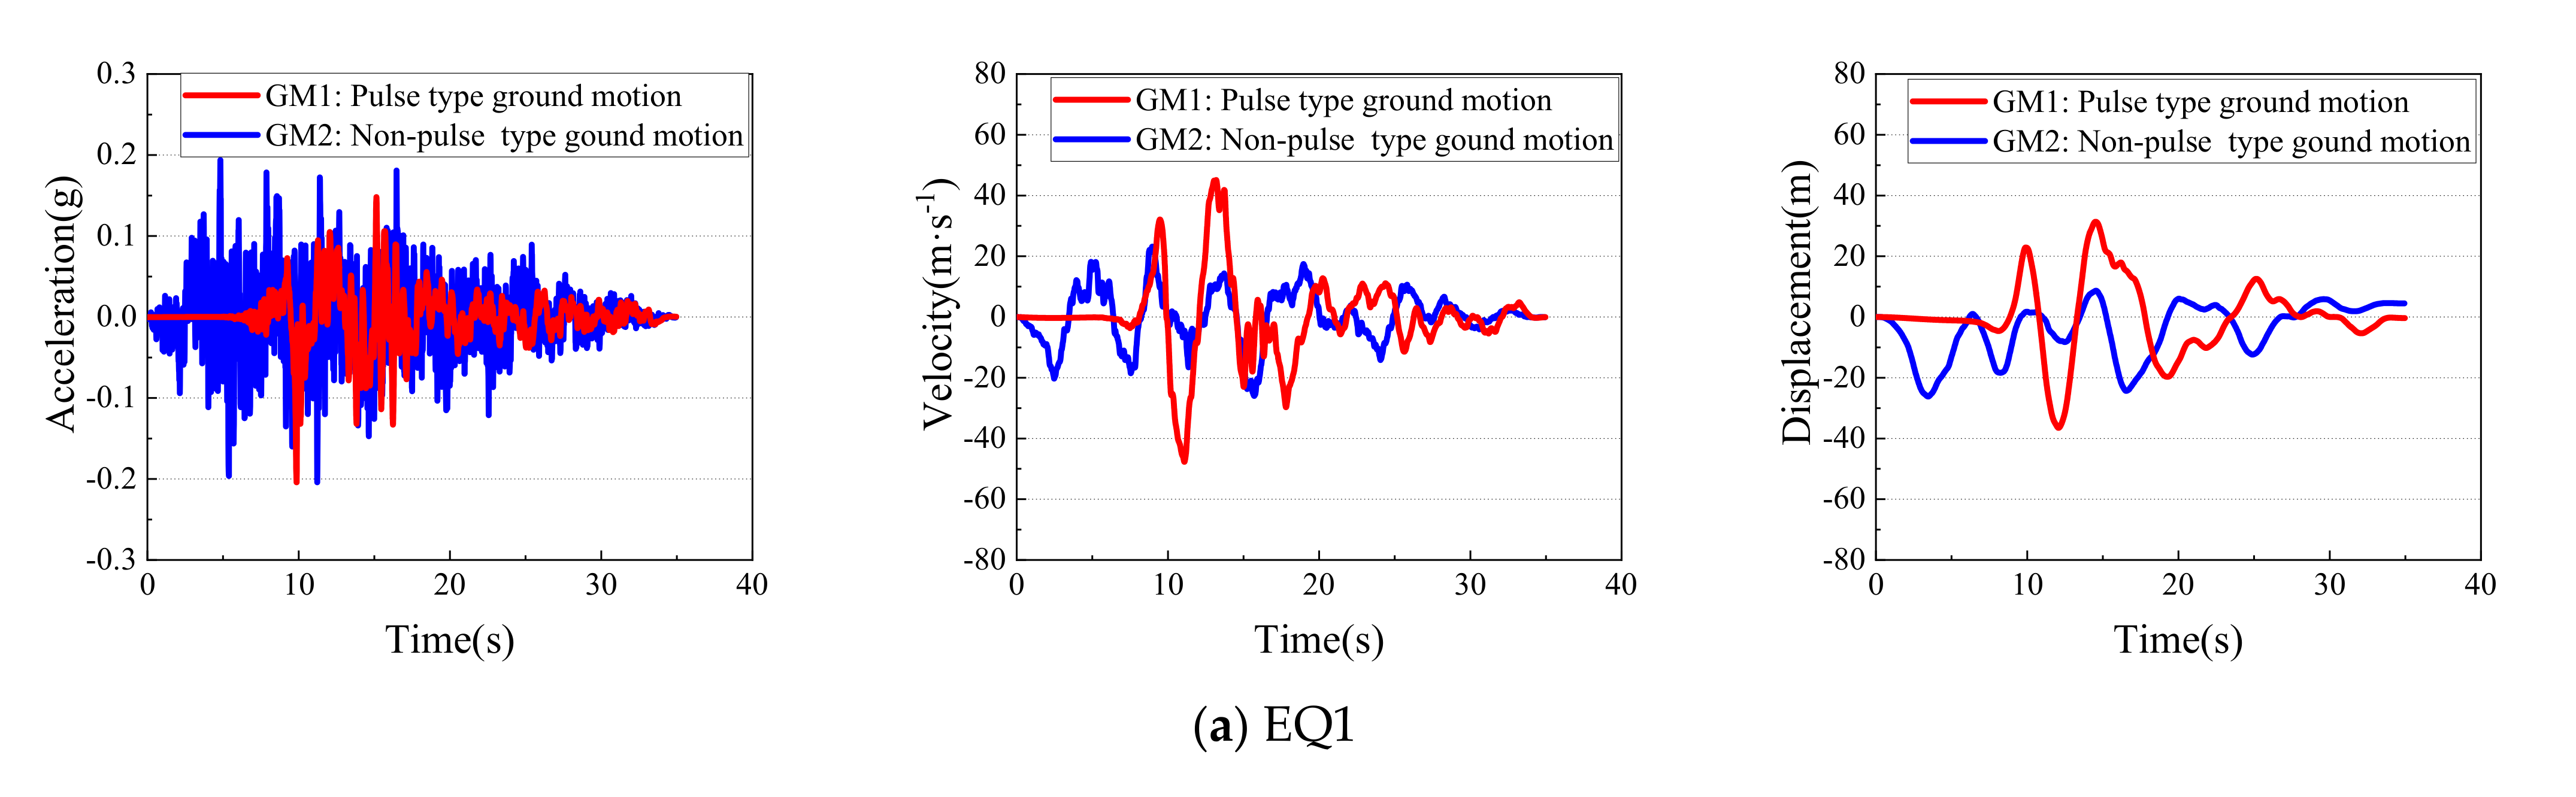
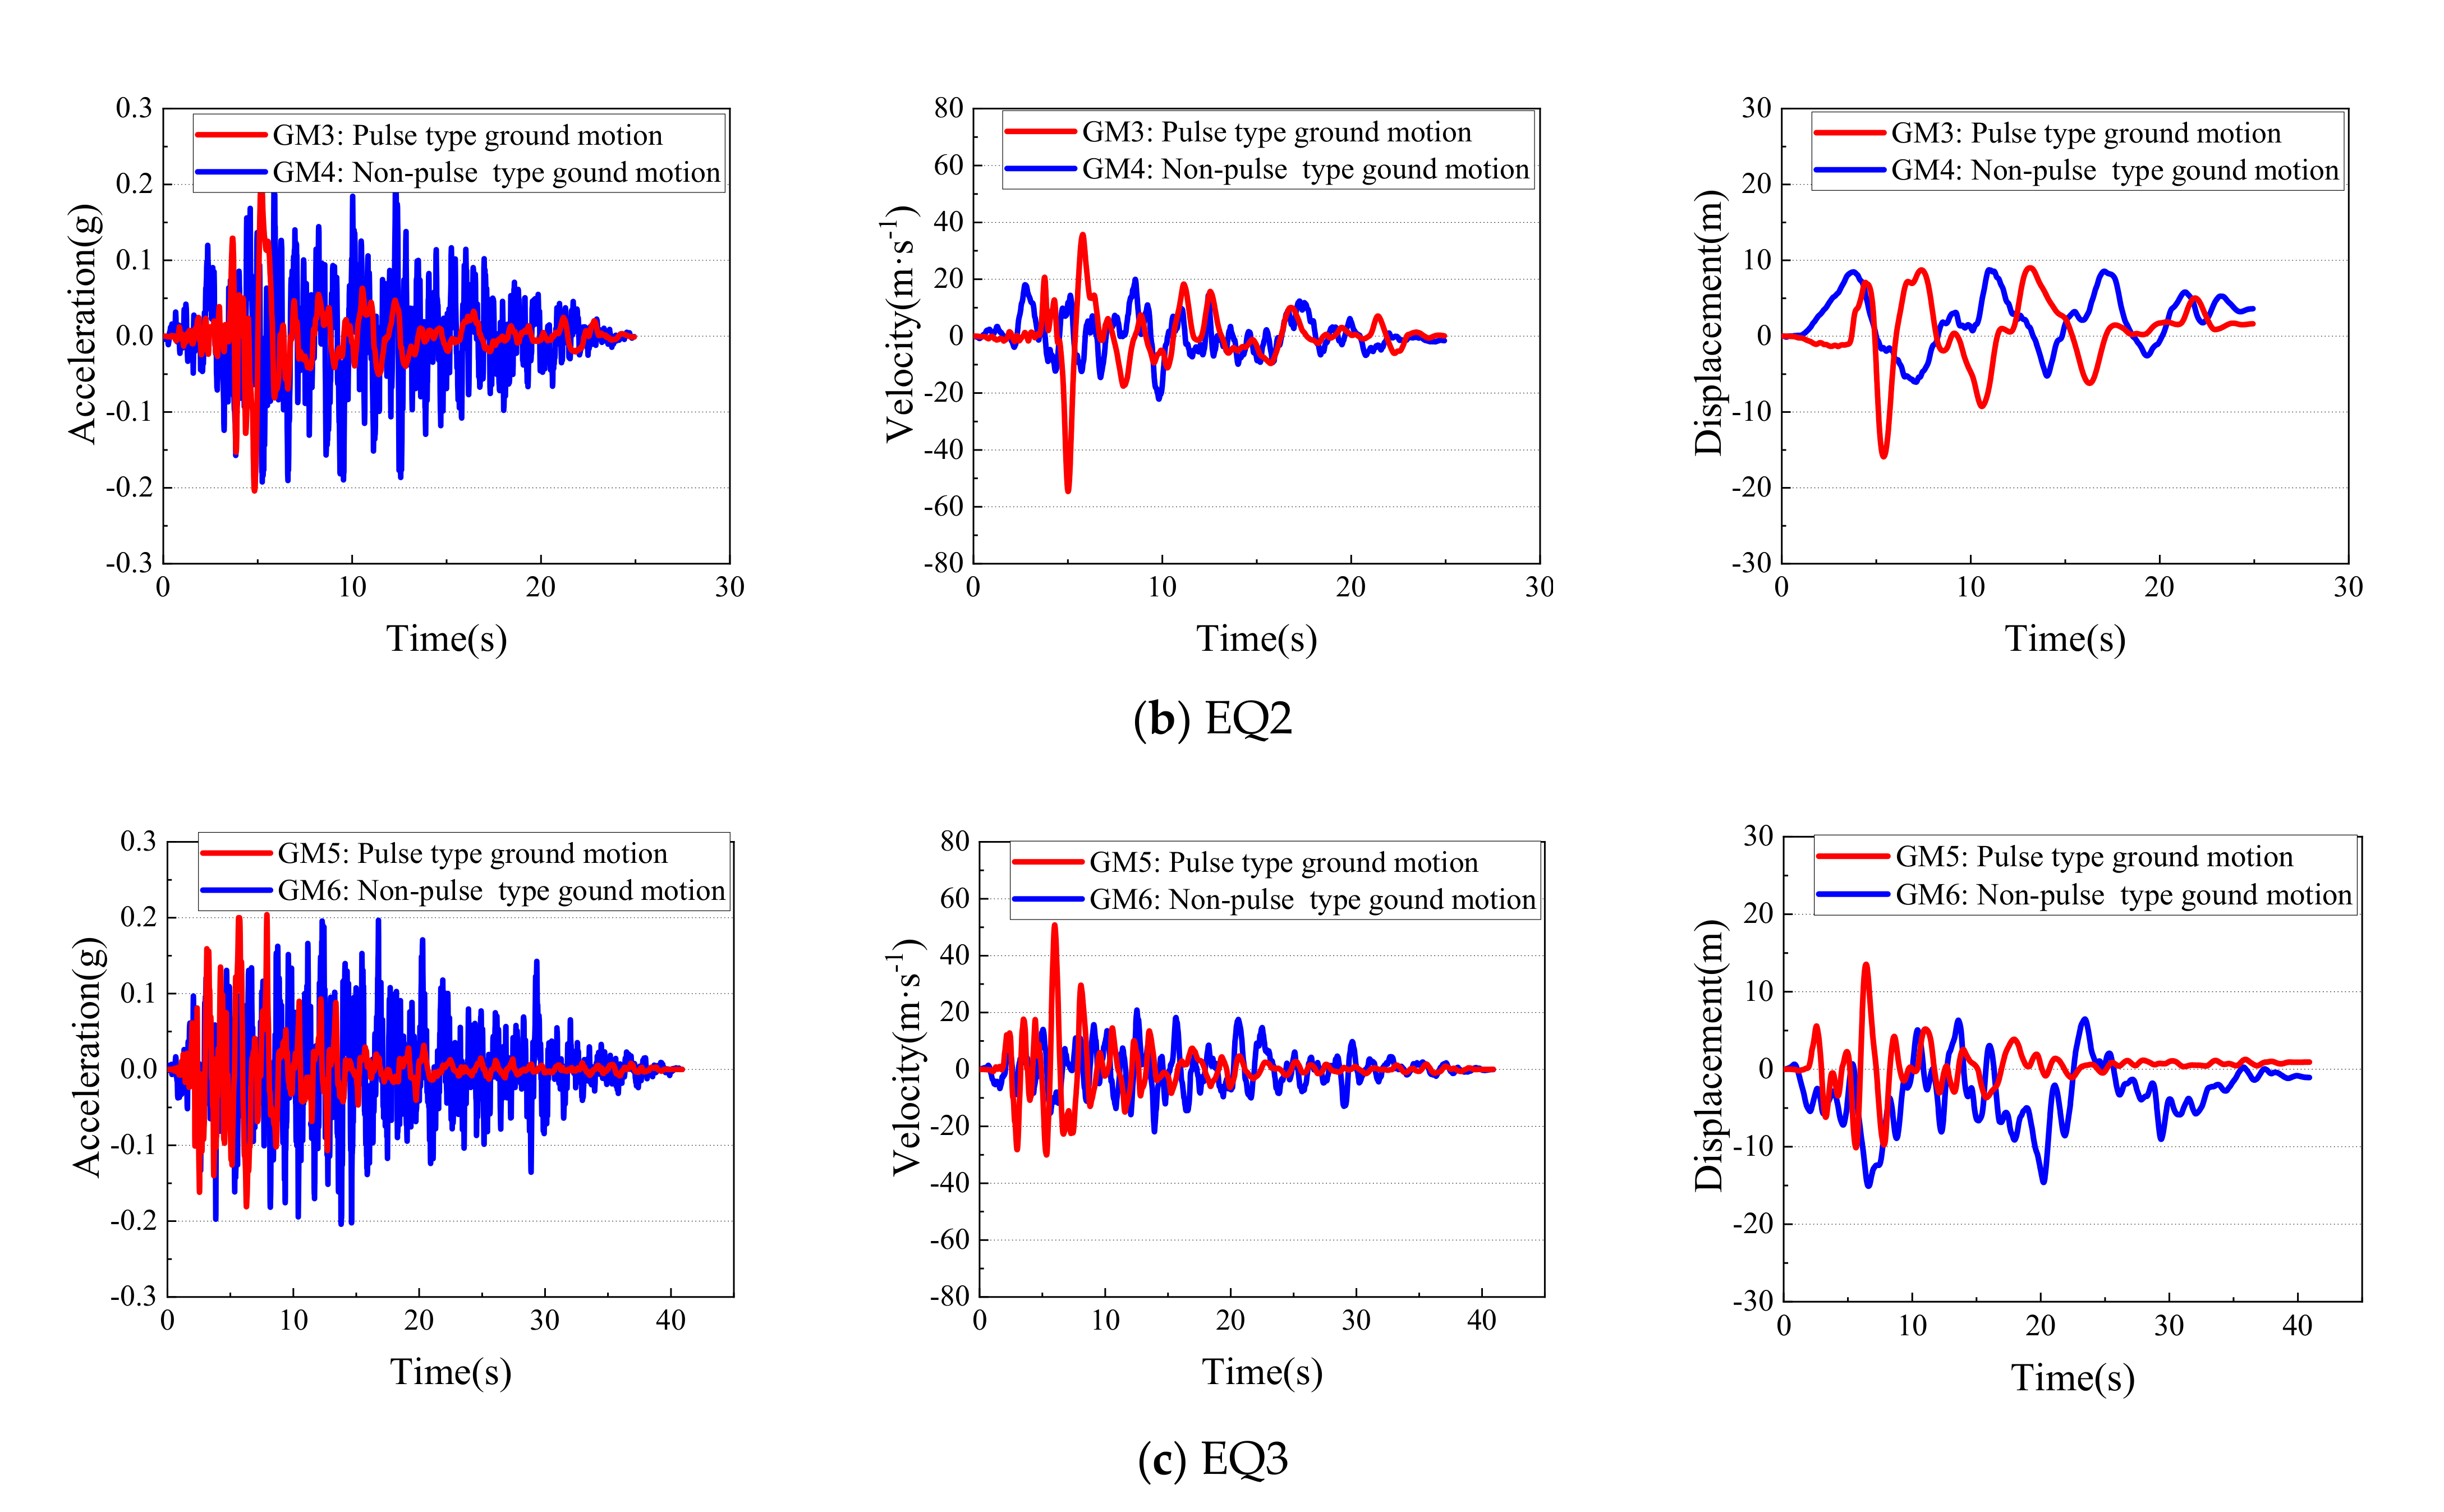
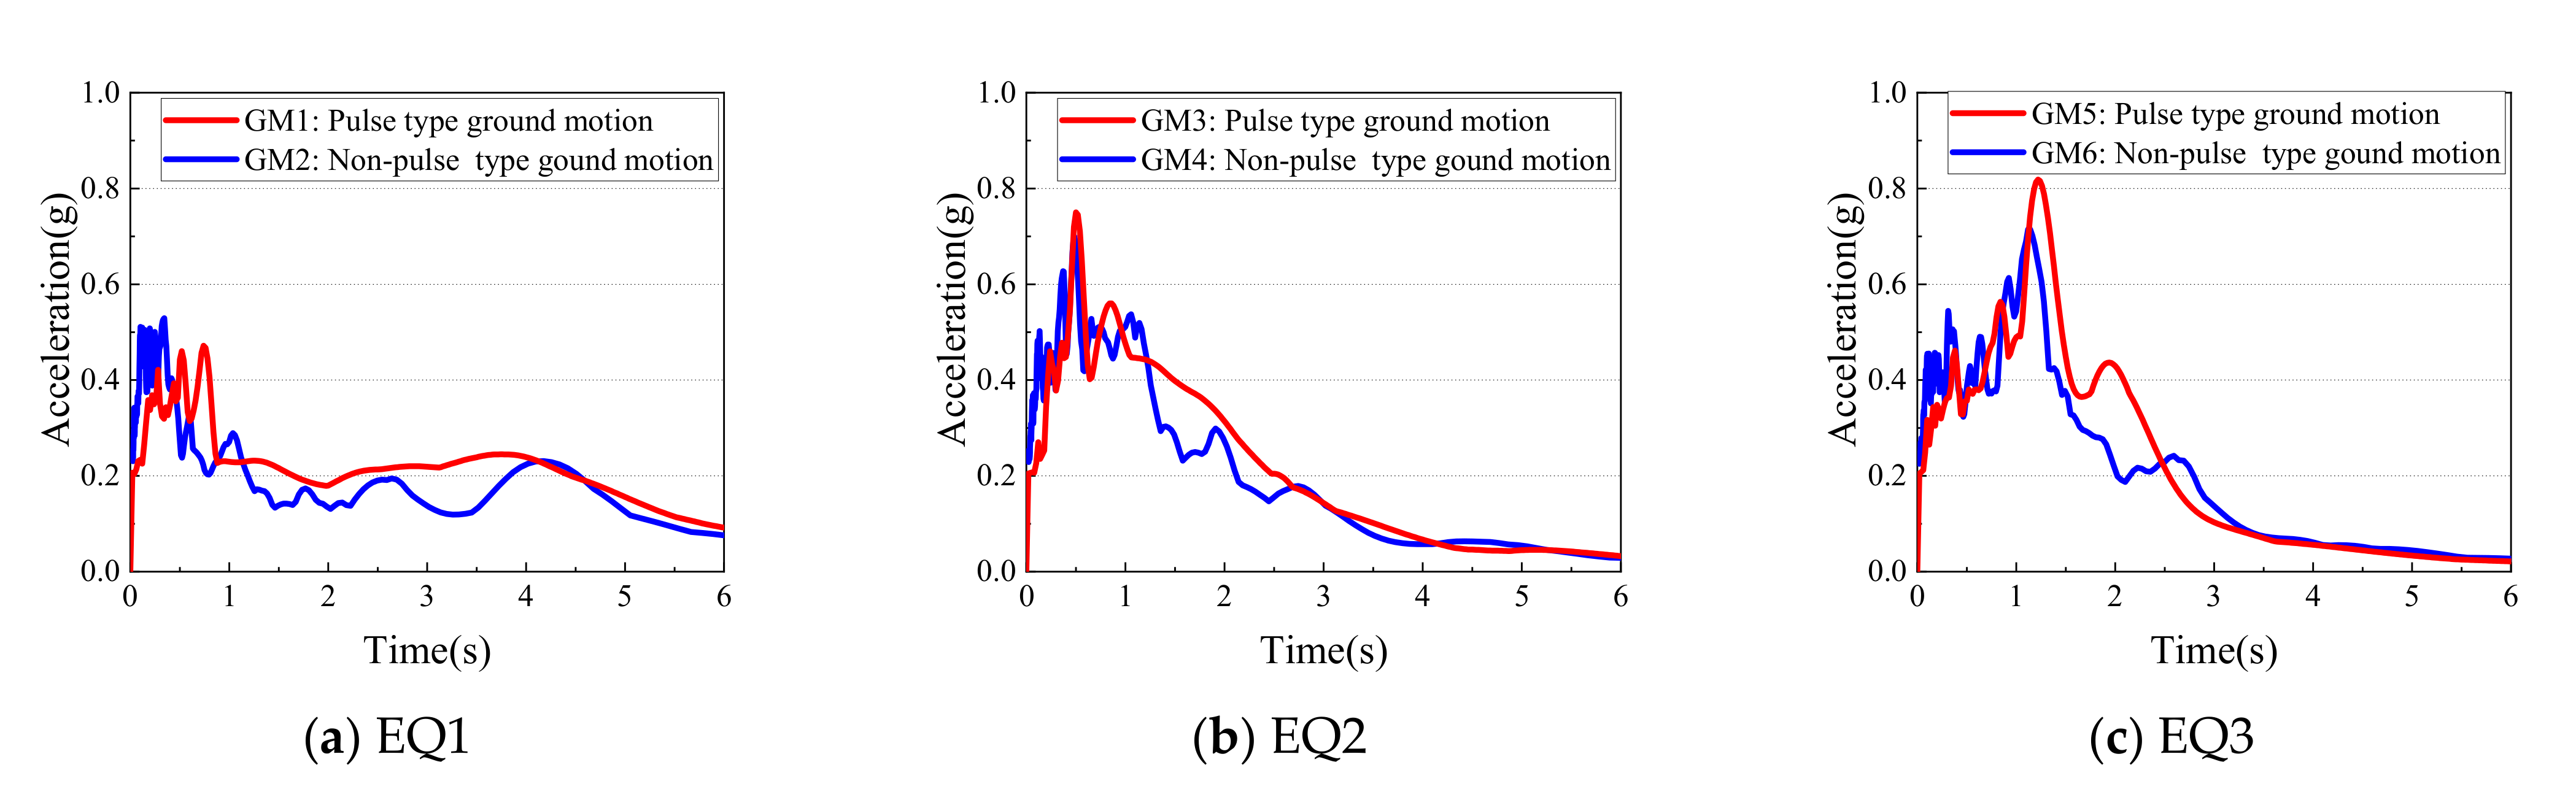
3.1. Selection of Near-Fault Ground Motions
3.2. Nonlinear Time History Analyses
4. Results and Discussion
4.1. Displacement of Abutments
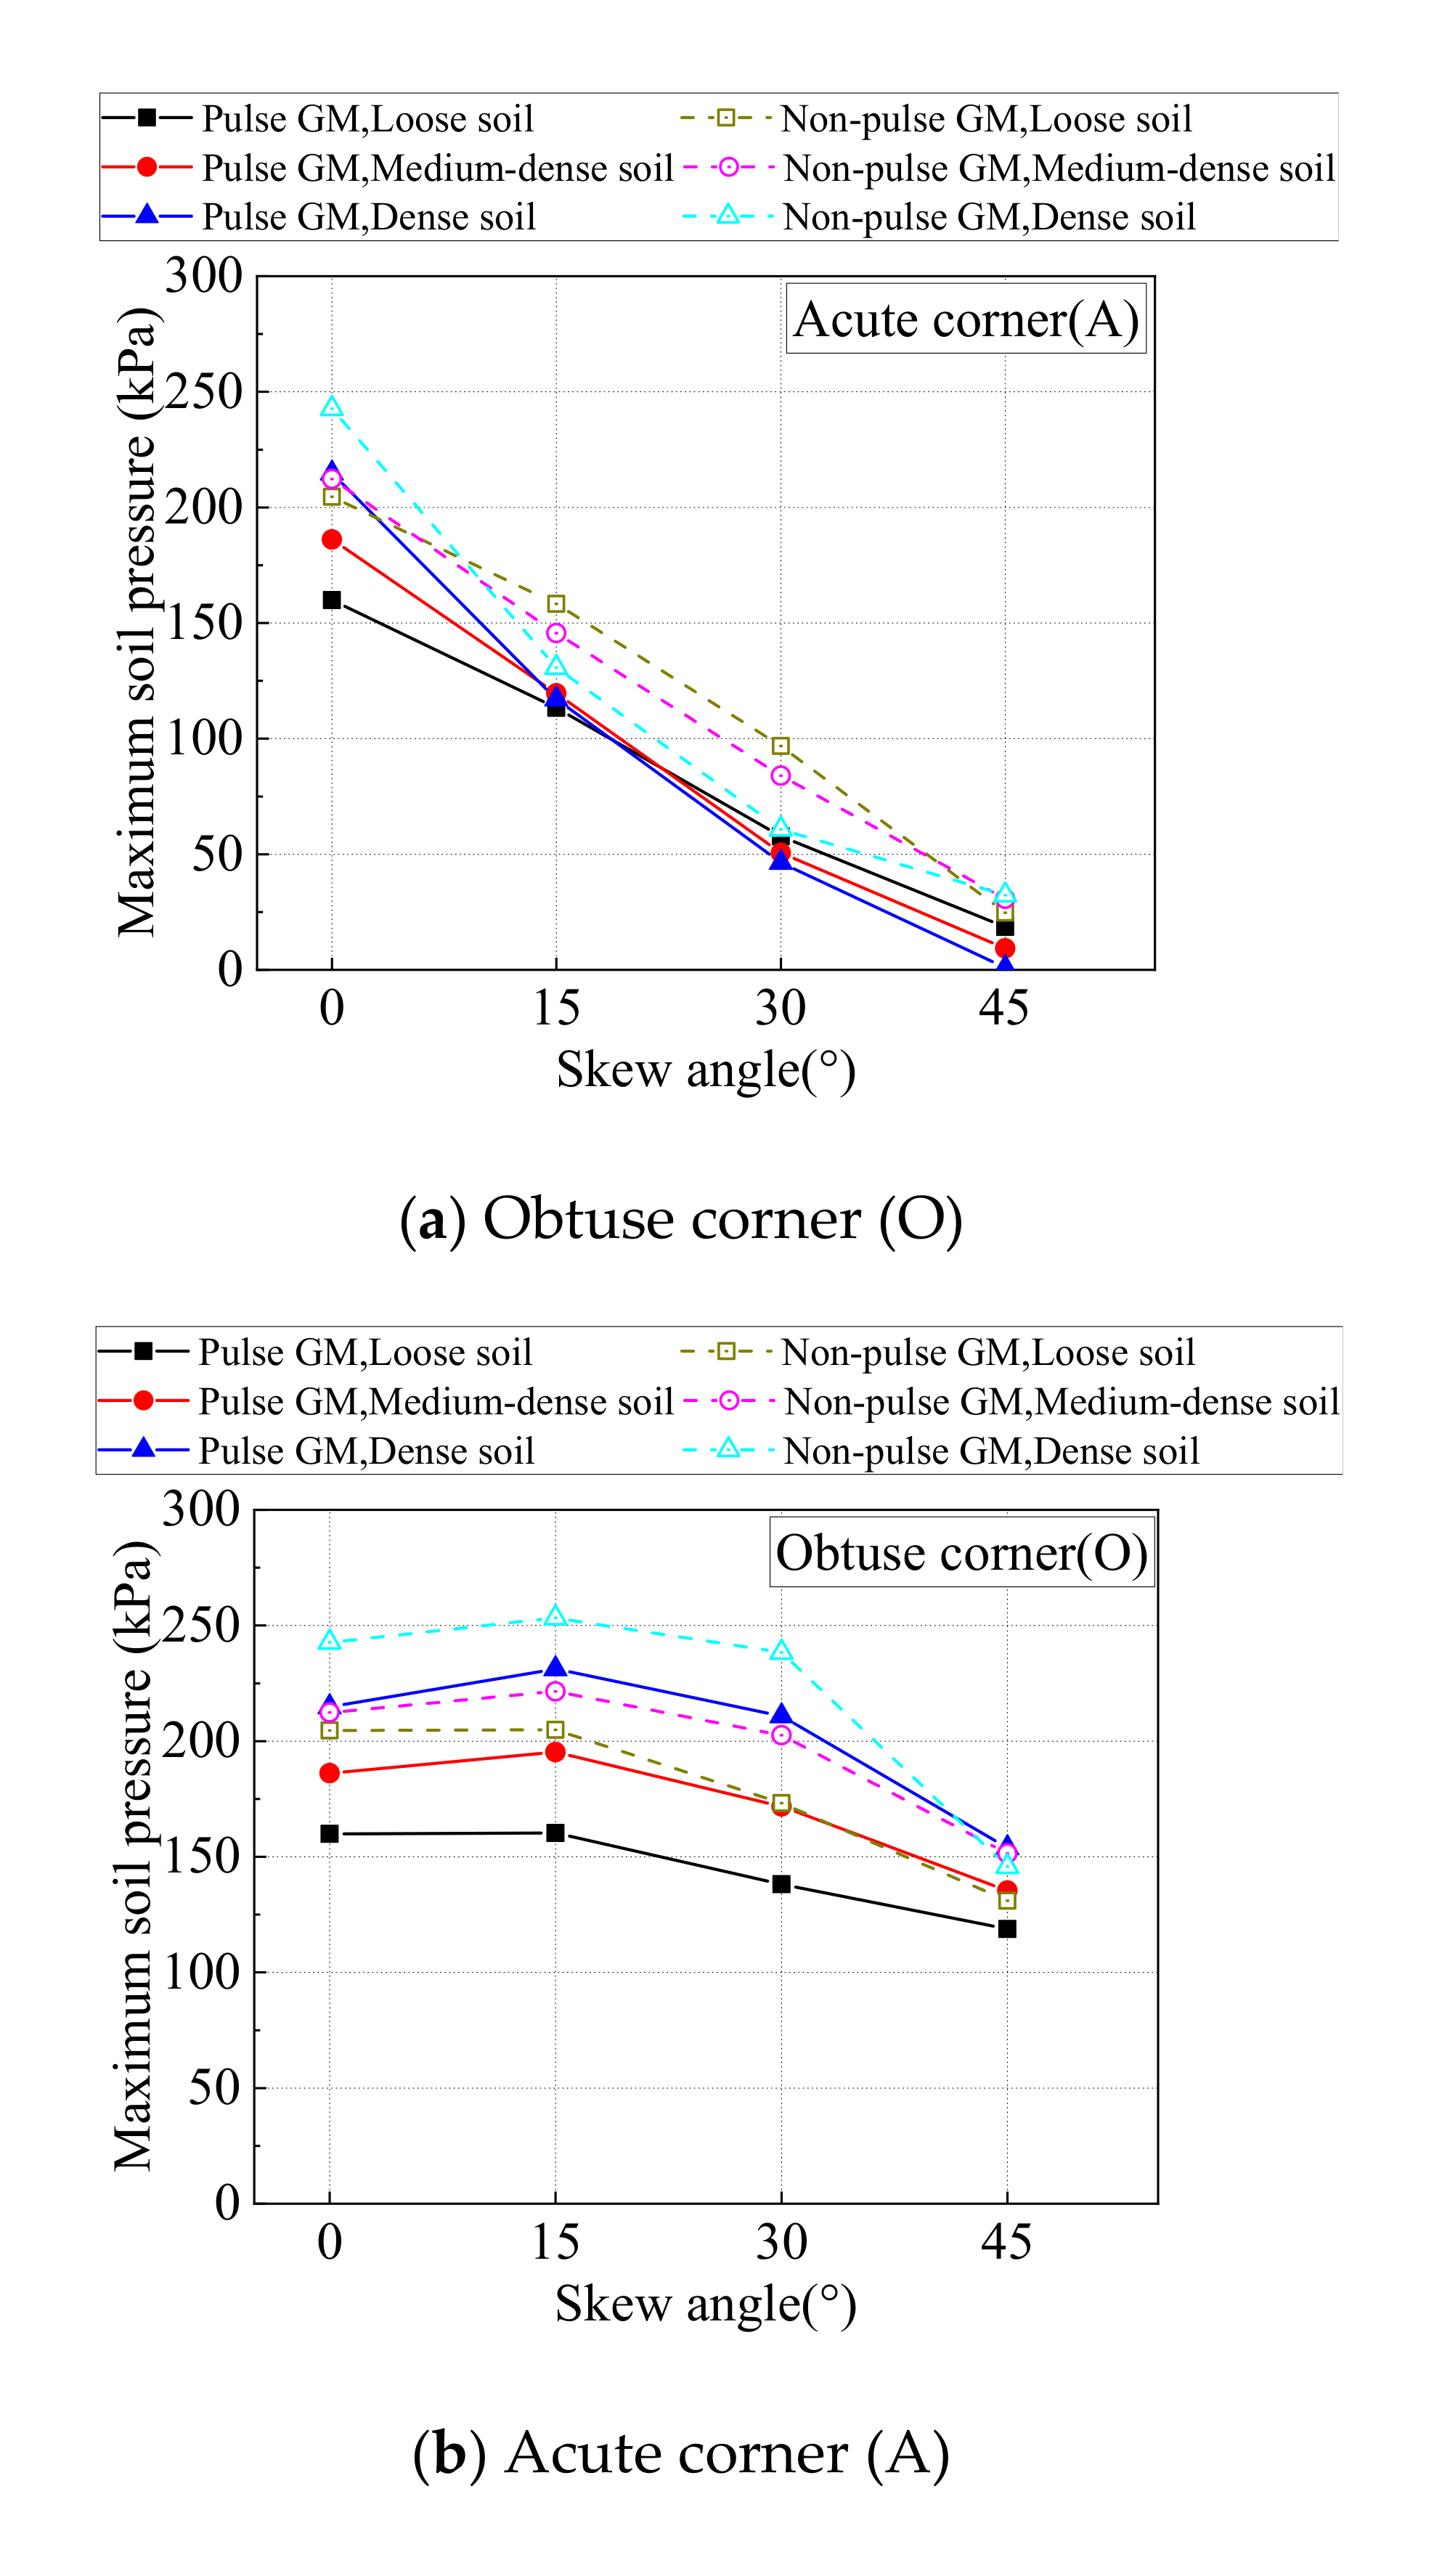
4.2. Soil Pressure Distribution of Abutment Backfill
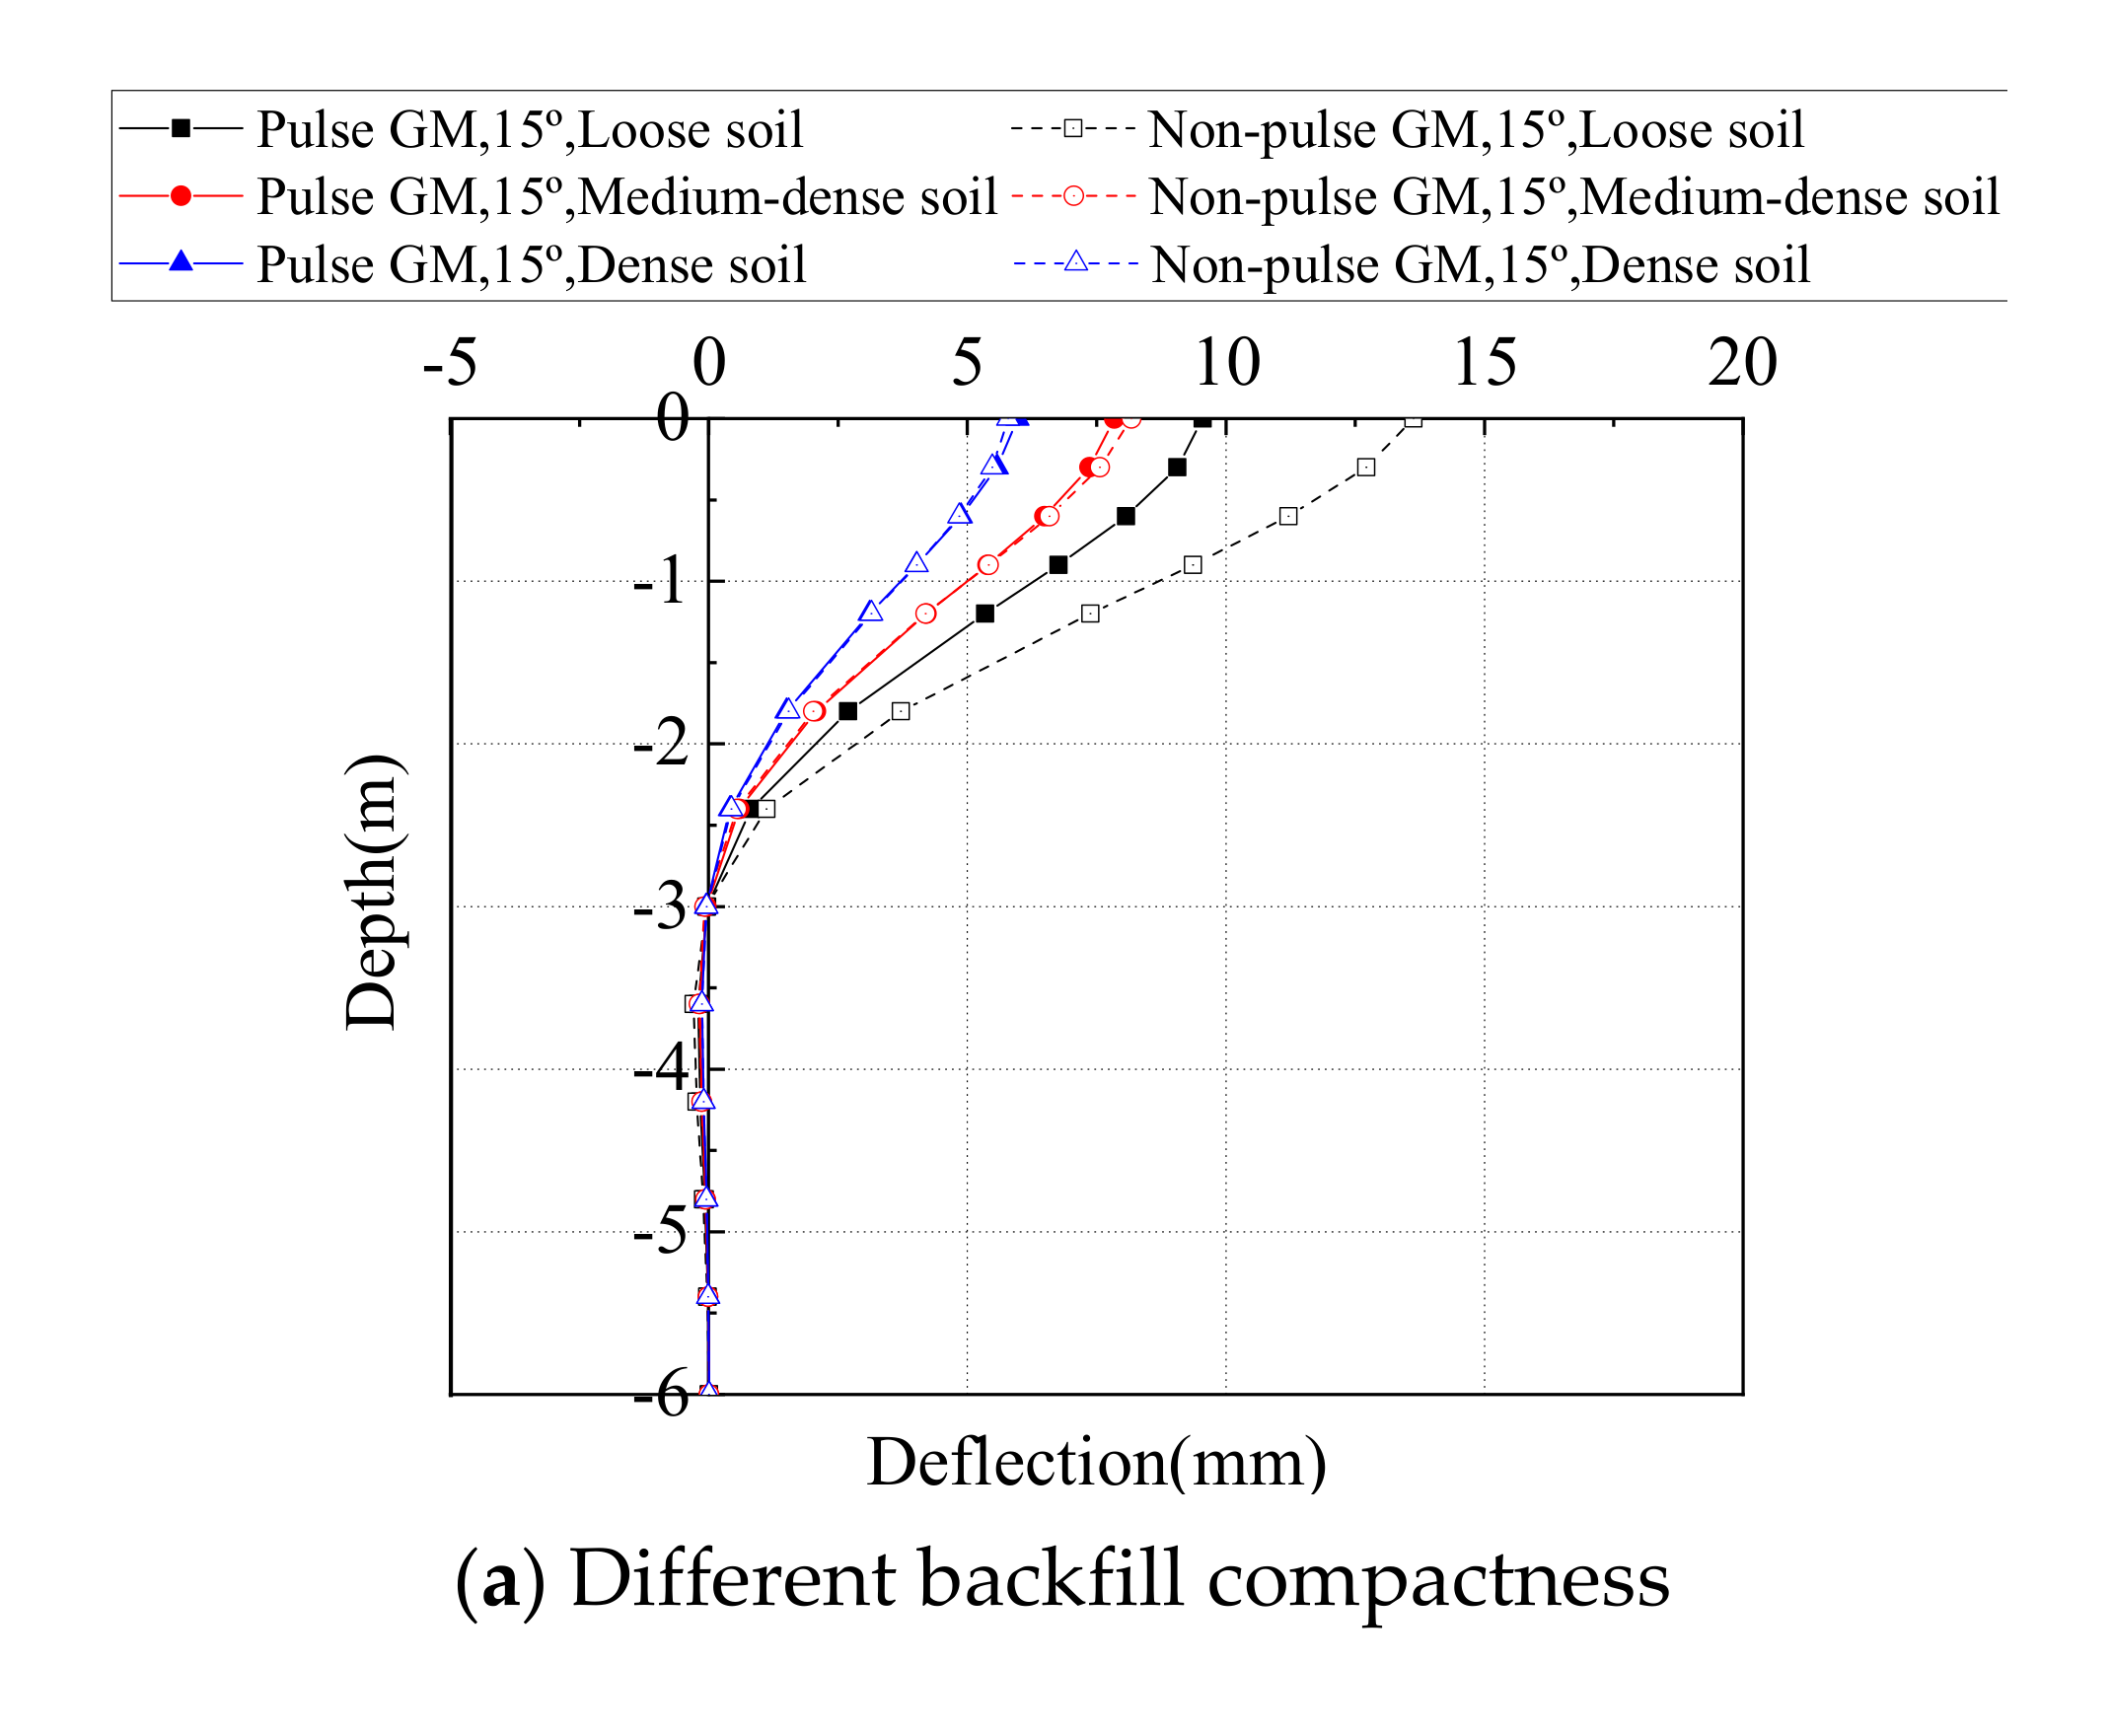
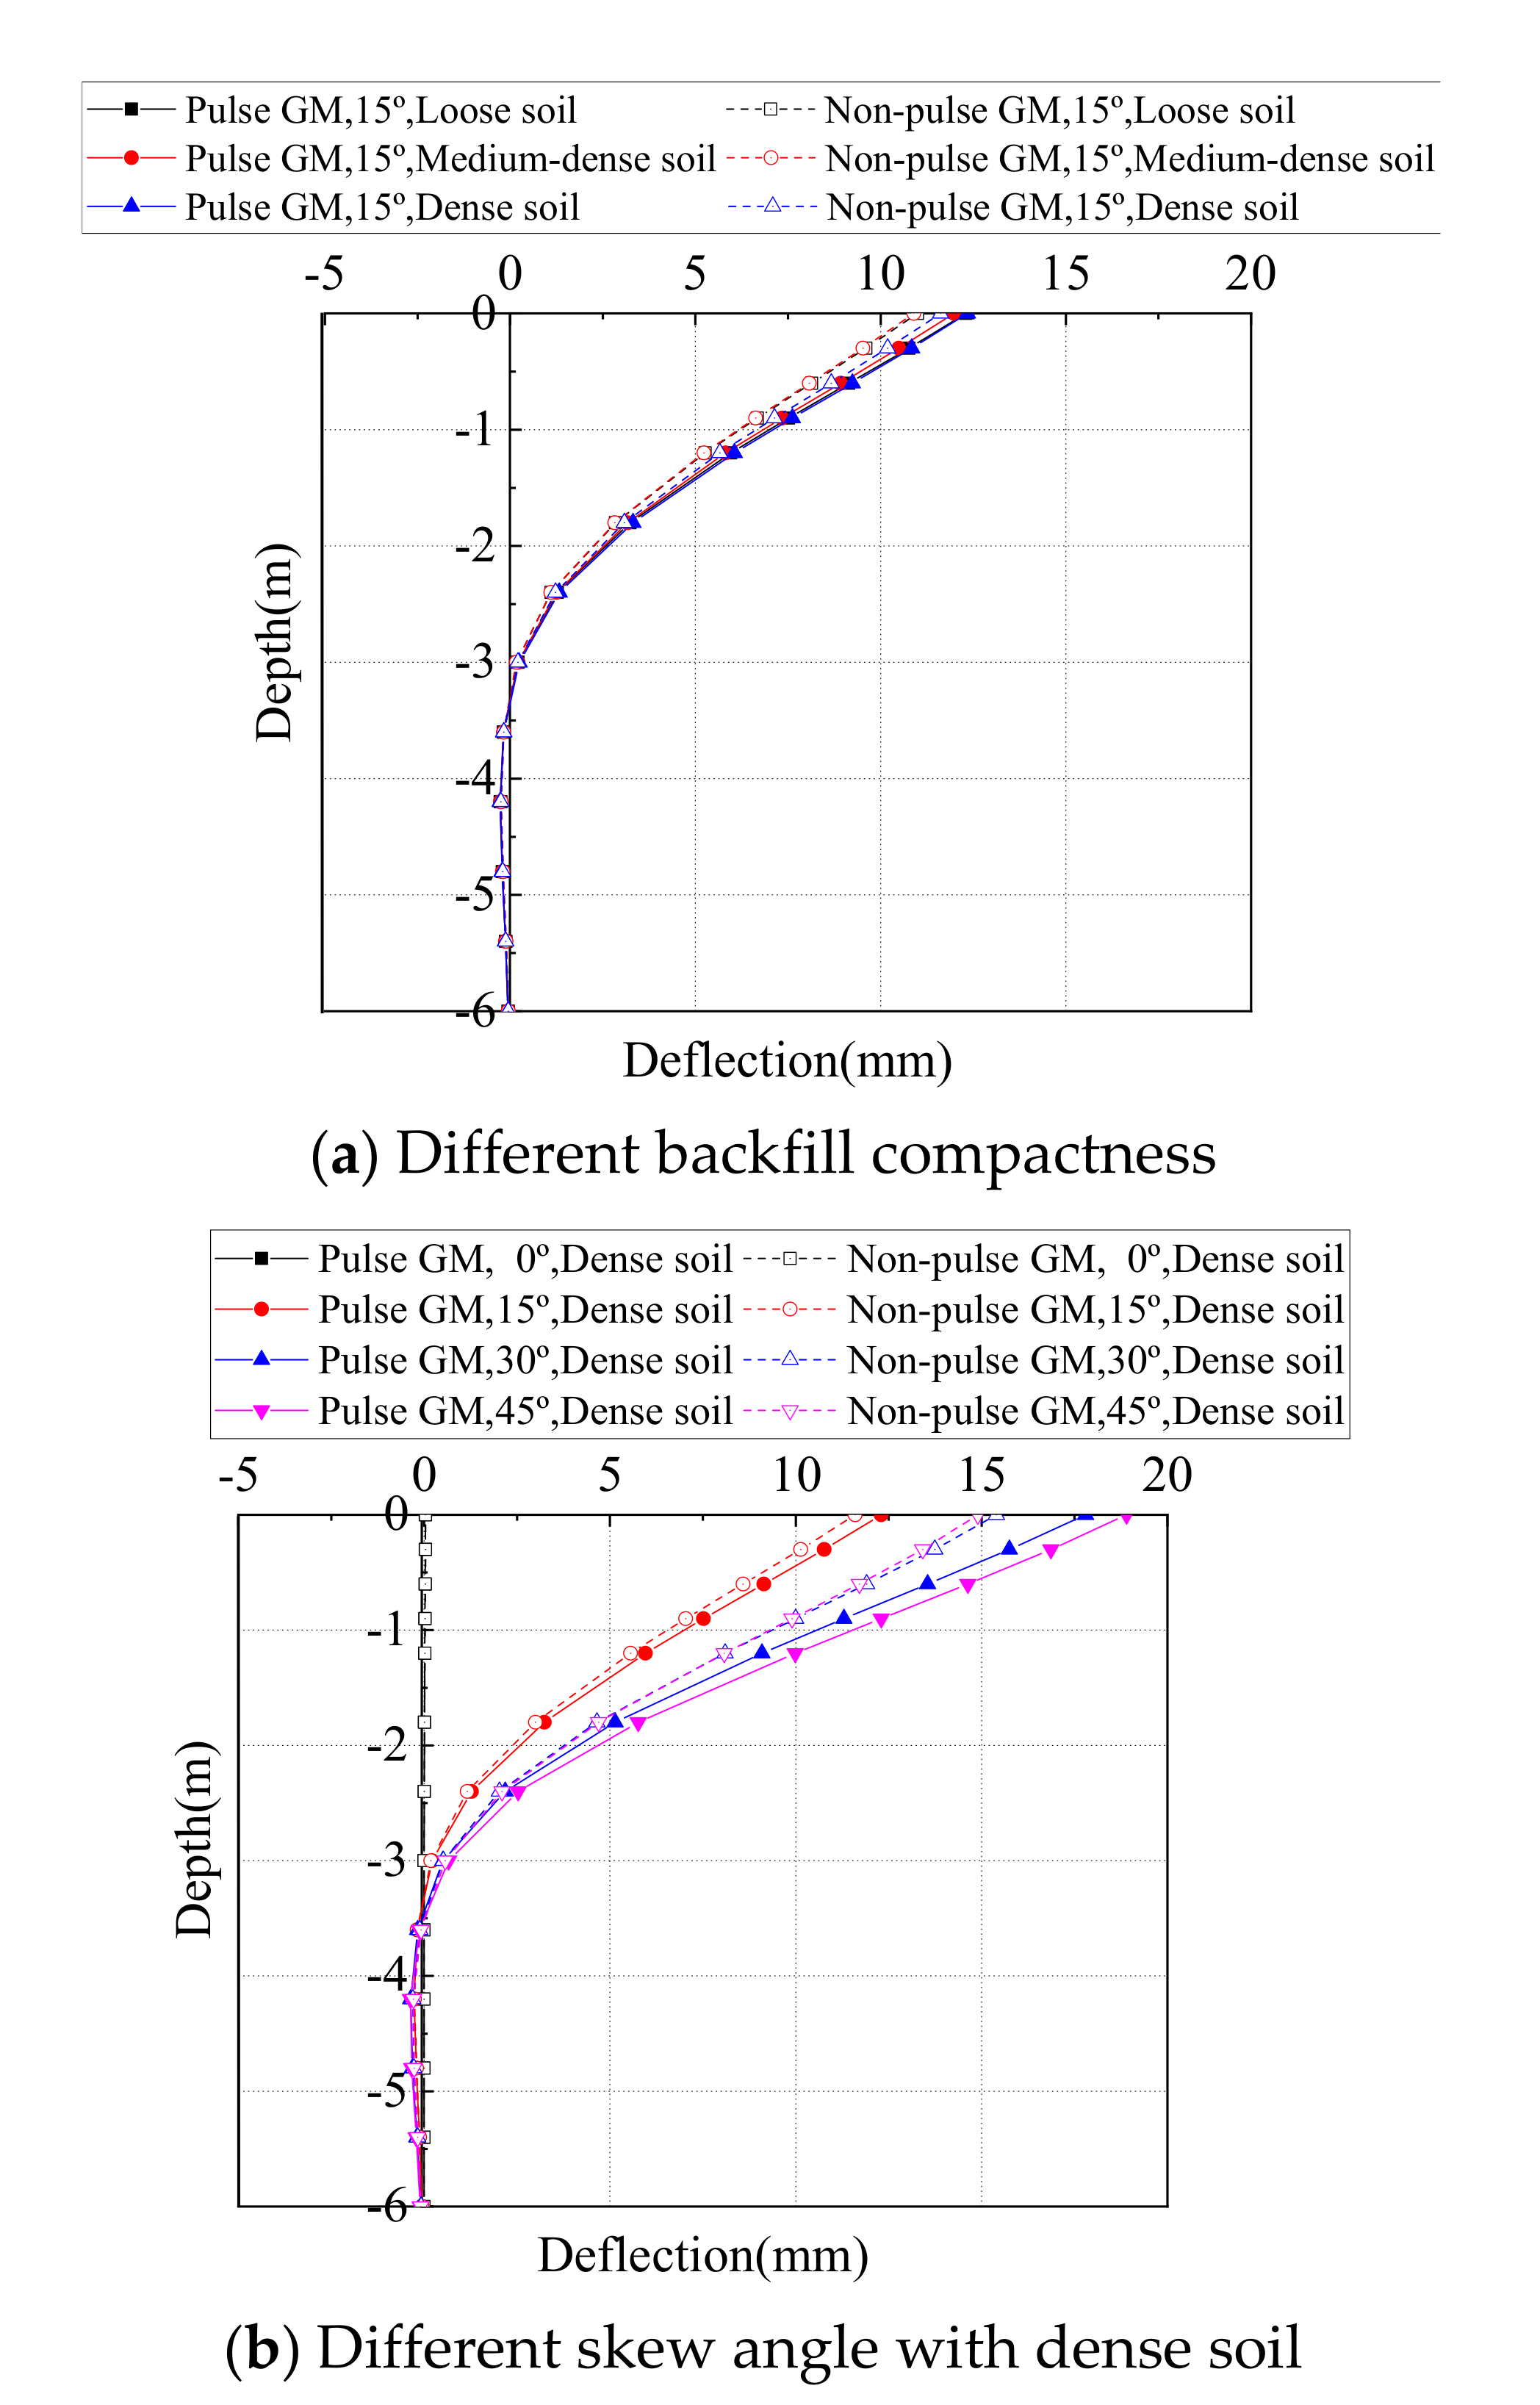
4.3. Deflection of Steel H Piles
4.4. Moment and Yield Surface Function of Steel H Piles
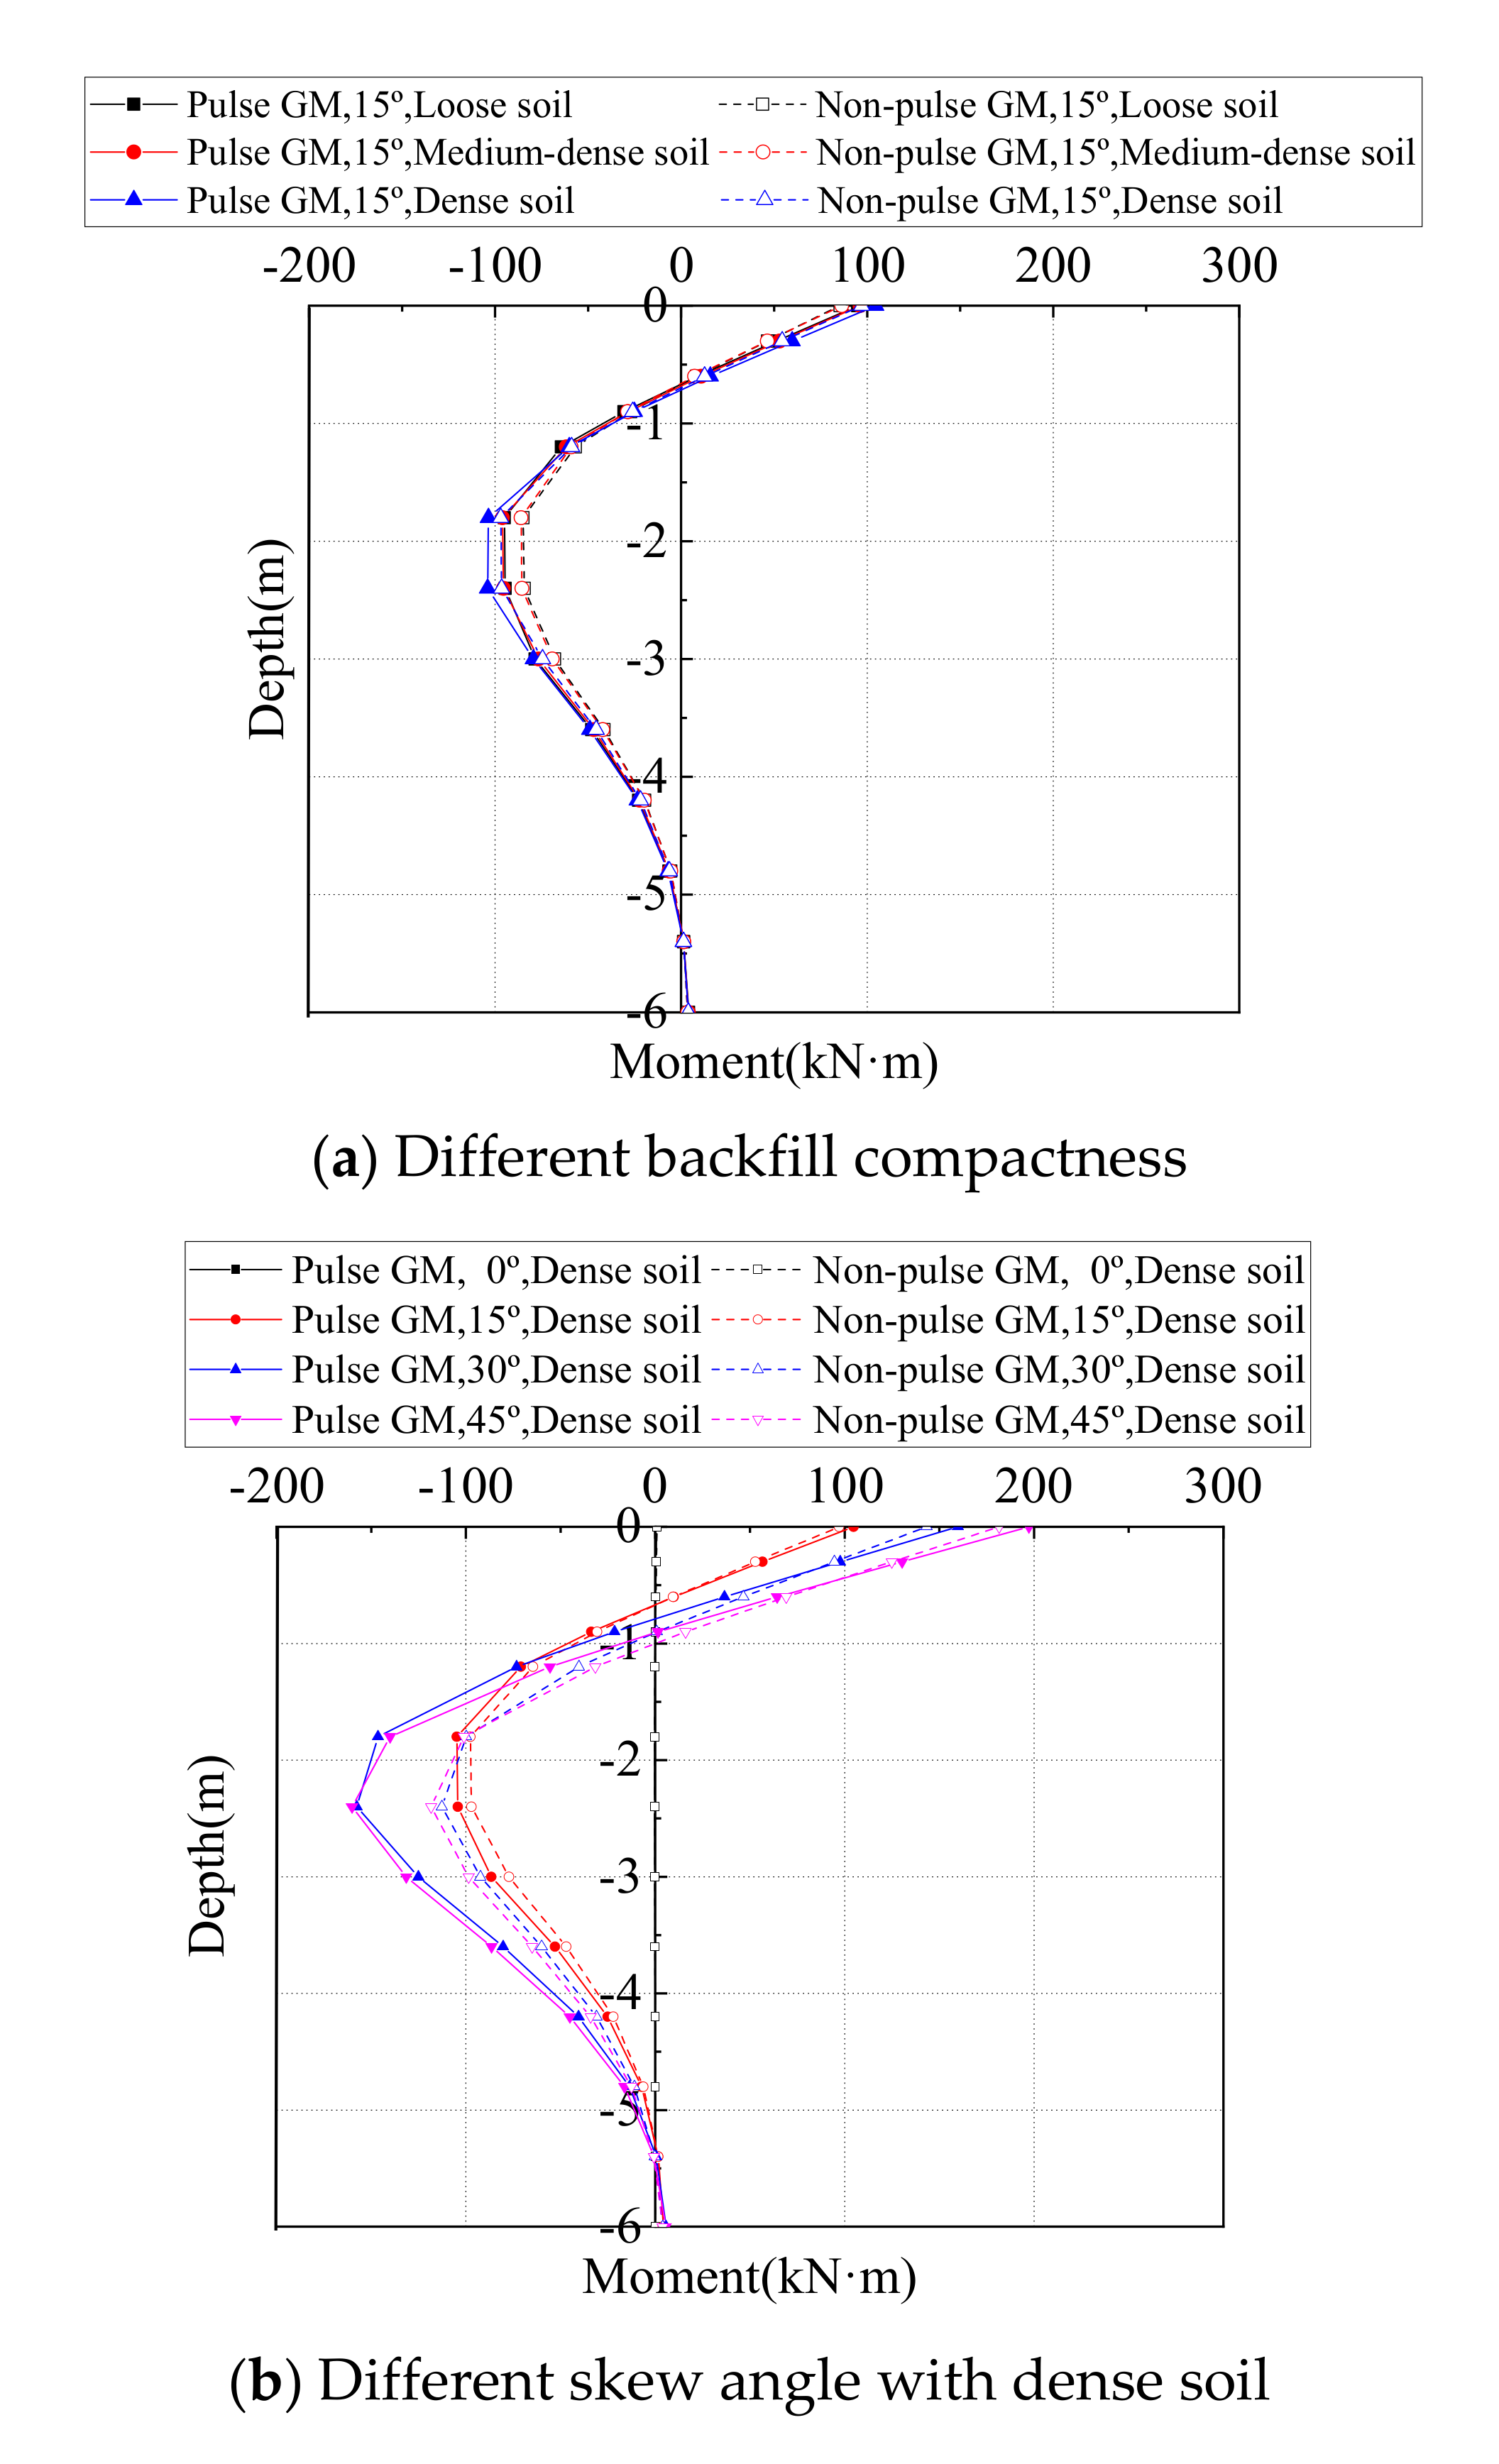
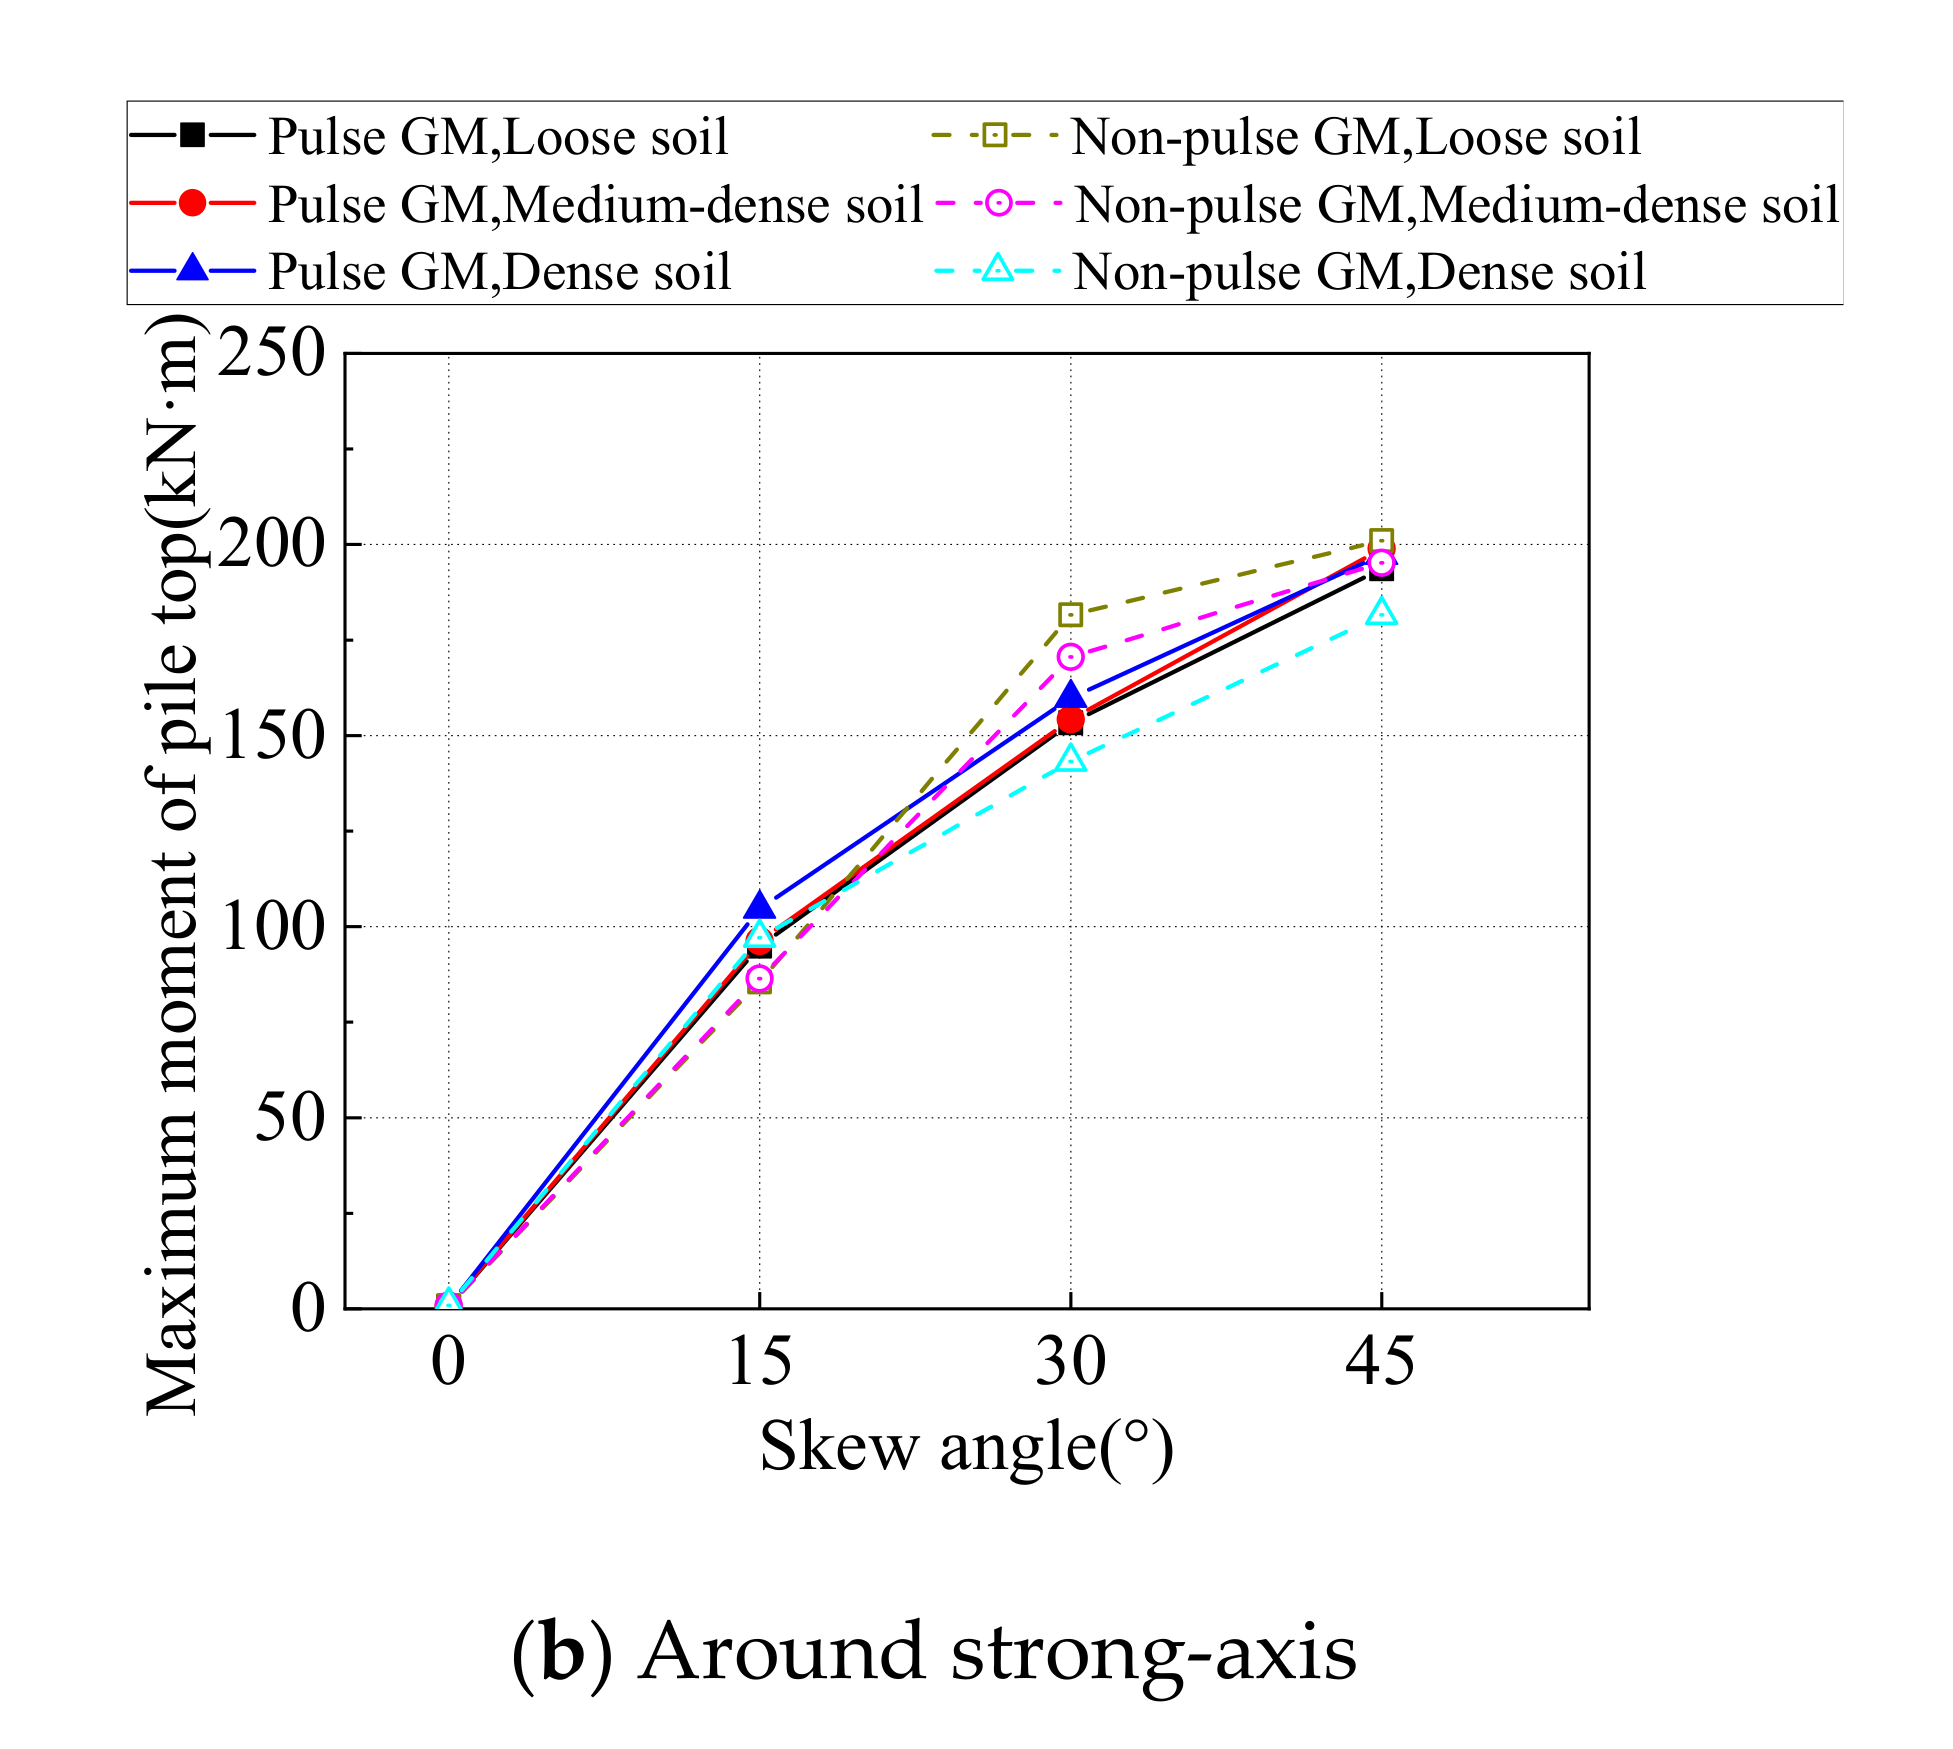
4.4.1. Moment in Steel Piles
4.4.2. Yield Surface Function Value of Steel Piles
5. Conclusions
- (1)
- The longitudinal and transverse displacement of the abutment generally increases with the skew angle, mainly due to the decreased constraints of the backfill on abutment longitudinal displacements and the increased coupling between the longitudinal and transverse displacements of the bridge deck. The longitudinal and transverse displacement of the abutment generally decreases with the abutment backfill compactness. Under pulse type ground motions, the longitudinal and the transverse abutment displacement are obviously higher than the abutment displacements under non-pulse type ground motions, and the differences increase with the skew angle.
- (2)
- The bridge deck rotation generally increases with the skew angle due to the coupling between the longitudinal and transverse displacements, especially with densely compacted backfill. The deck rotation generally decreases with the abutment backfill compactness. Under pulse type ground motions, the bridge deck rotations are close and sometimes lower than the deck rotations under non-pulse type ground motions, except when the skew angle is 45° and with medium densely and loosely compacted backfill.
- (3)
- For SIAB, the resultant force from soil pressure does not pass through the mass center of the bridge, so the superstructure twists and leads to a non-uniform distribution of soil pressure behind the abutments. The pressure at the obtuse corner is always higher than the acute corner, and the ratio increases with the skew angle as well as the backfill compactness. The ratio is even higher under the pulse type ground motions.
- (4)
- The longitudinal deflection of the pile top first decreases and then increases with the skew angle, while the transverse deflection of the pile top always increases with the skew angle. The longitudinal deflection decreases with the abutment backfill compactness, and so does the transverse deflection, but to a lesser extent. When the skew angle is larger than 15°, both the longitudinal and the transverse deflection of the pile is higher under pulse type ground motions.
- (5)
- The moment around the weak-axis first decreases and then increases with the skew angle, while moment around the strong-axis always increases with the skew angle. The moment around the weak-axis and the strong-axis decrease with the abutment backfill compactness. When the skew angle is larger than 15°, the moment at the pile top is higher under pulse type ground motions, especially with densely compacted backfill.
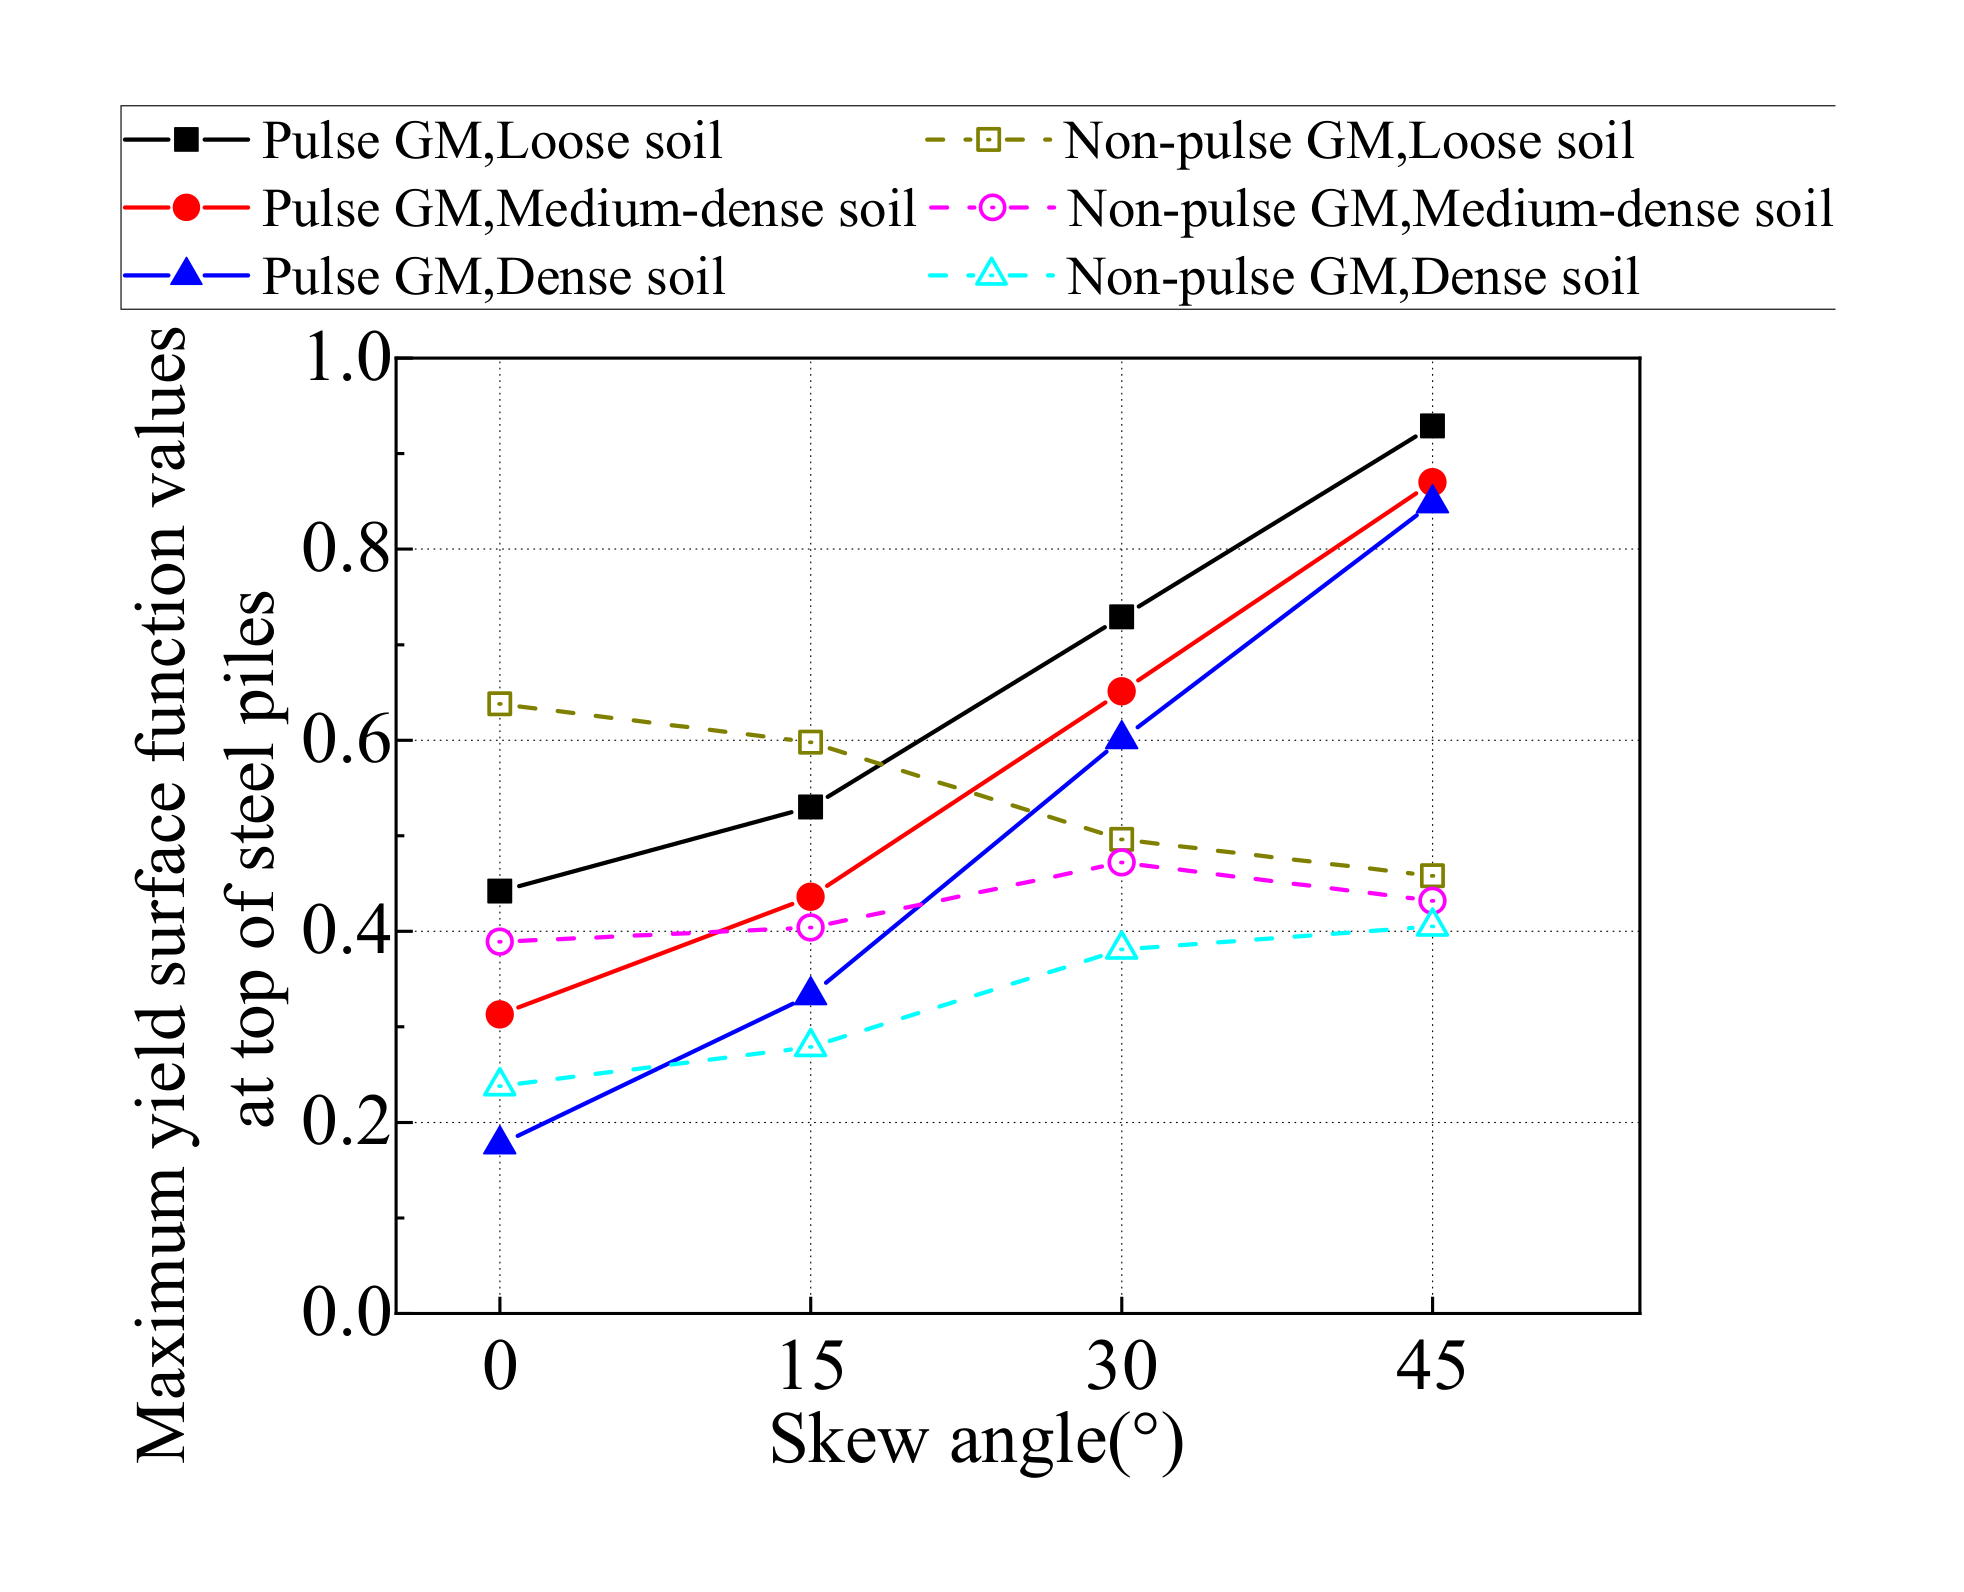
- (6)
- Under non-pulse type ground motions, the yield surface function value as well as the maximum normal stress on the steel pile cross-section decrease with the backfill compactness, and increase with the skew angle for densely compacted backfill. Under pulse type ground motions, the value still decreases with the backfill compactness, but it consistently and sharply increases with the skew angle for all types of backfill. The near-fault effects significantly increase the yield surface function value as well as maximum normal stress in steel piles, and amplify the influence of the skew angle.
Author Contributions
Funding
Conflicts of Interest
References
- Basöz, N.; Kiremidjian, A.S. Evaluation of Bridge Damage Data from the Loma Prieta and Northridge, California Earthquakes; Tech. Rep. Mceer-98-0004; MCEER: Buffalo, NY, USA, 1998; pp. 46–53. [Google Scholar]
- Wang, Z.Q.; George, C.L. A comparative study of bridge damage due to the Wenchuan, Northrige, Loma Prieta and San Fernando earthquakes. Earthq. Eng. Vib. 2009, 8, 251–261. [Google Scholar] [CrossRef]
- Elnashai, A.S.; Sarno, L.D. Fundamentals of Earthquake Engineering‖ Appendix A: Structural Configurations and Systems for Effective Earthquake Resistance; John Wiley and Sons: Hoboken, NJ, USA, 2008. [Google Scholar]
- Yang, D.; Wang, W. Nonlocal period parameters of frequency content characterization for near-fault ground motions. Earthq. Eng. Struct. Dyn. 2012, 41, 1793–1811. [Google Scholar] [CrossRef]
- Shahbazi, S.; Karami, A.; Hu, J.W.; Mansouri, I. Seismic response of steel moment frames (SMFs) considering simultaneous excitations of vertical and horizontal components, including fling-step ground motions. Appl. Sci. 2019, 9, 2079. [Google Scholar] [CrossRef]
- Xia, C.; Liu, C. Identification and representation of multi-pulse near-fault strong ground motion using adaptive wavelet transform. Appl. Sci. 2019, 9, 259. [Google Scholar] [CrossRef]
- Somerville, P.G.; Smith, N.F.; Graves, R.W.; Abrahamson, N.A. Modification of empirical strong ground motion attenuation relations to include the amplitude and duration effects of rupture directivity. Seism. Res. Lett. 1997, 68, 199–222. [Google Scholar] [CrossRef]
- Liao, W.I.; Loh, C.H.; Wan, S. Earthquake responses of RC moment frames subjected to near-fault ground motions. Struct. Des. Tall Build. 2001, 10, 219–229. [Google Scholar] [CrossRef]
- Alavi, B.; Krawinkler, H. Behavior of moment-resisting frame structures subjected to near-fault ground motions. Earthq. Eng. Struct. Dyn. 2004, 33, 687–760. [Google Scholar] [CrossRef]
- Mavroeidis, G.P.; Dong, G.; Papageorgiou, A.S. Near-fault ground motions and the response of elastic and inelastic single-degree-of-freedom (SDOF) systems. Earthq. Eng. Struct. Dyn. 2004, 33, 1023–1049. [Google Scholar] [CrossRef]
- Kalkan, E.; Kunnath, S.K. Effects of fling step and forward directivity on seismic response of buildings. Earthq. Spectra. 2006, 22, 367–390. [Google Scholar] [CrossRef]
- Yang, D.X.; Pan, J.W.; Li, G. Interstory drift ratio of building structures subjected to near-fault ground motions based on generalized drift spectral analysis. Soil Dyn. Earthq. Eng. 2010, 30, 1182–1197. [Google Scholar] [CrossRef]
- Mavroeidis, G.P.; Papageorgiou, A.S. Effect of fault rupture characteristics on nearfault strong ground motions. Bull. Seism. Soc. Am. 2010, 100, 37–58. [Google Scholar] [CrossRef]
- Fang, C.; Zhong, Q.M.; Wang, W.; Hu, S.L.; Qiu, C.X. Peak and residual responses of steel moment-resisting and braced frames under pulse-like near-fault earthquakes. Eng. Struct. 2018, 177, 579–597. [Google Scholar] [CrossRef]
- Hall, J.F.; Heaton, T.H.; Halling, M.W.; Wald, D.J. Near-source ground motion and its effects on flexible buildings. Earthq. Spectra 1995, 11, 569–605. [Google Scholar] [CrossRef]
- Li, X.L.; Jiang, H.; Shen, D. Study on seismic safety performance for continuous girder bridge based on near-fault strong ground motions. Procedia Eng. 2012, 45, 916–922. [Google Scholar] [CrossRef]
- Zhang, F.; Li, S.; Wang, J.Q.; Zhang, J. Effects of fault rupture on seismic response of fault-crossing simply-supported highway bridges. Eng. Struct. 2020, 206, 110104. [Google Scholar] [CrossRef]
- Zheng, S.X.; Shi, X.H.; Jia, H.Y.; Zhao, C.H.; Qu, H.L.; Shi, X.L. Seismic response analysis of long-span and asymmetrical suspension bridges subjected to near-fault ground motion. Eng. Fail. Anal. 2020, 115, 104615. [Google Scholar] [CrossRef]
- Xin, L.F.; Li, X.Z.; Zhang, Z.T.; Zhao, L.F. Seismic behavior of long-span concrete-filled steel tubular arch bridge subjected to near-fault fling-step motions. Eng. Struct. 2019, 180, 148–159. [Google Scholar] [CrossRef]
- Li, S.; Zhang, F.; Wang, J.Q.; Alam, M.S.; Zhang, J. Effects of near-fault motions and artificial pulse-type ground motions on super-span cable-stayed bridge systems. J. Bridge Eng. 2016, 22, 04016128. [Google Scholar] [CrossRef]
- Erhan, S.; Dicleli, M. Comparative Assessment of the Seismic Performance of Integral and Conventional Bridges with Respect to the Differences at the Abutments. Bull. Earthq. Eng. 2015, 13, 653–677. [Google Scholar] [CrossRef]
- Farahani, R.V.; Zhao, Q.H.; Burdette, E.G. Seismic analysis of integral abutment bridges including Soil-Structure Interaction. Transp. Res. Rec. J. Transp. Res. Board 2011, 2201, 289–303. [Google Scholar]
- Wasserman, E.P.; Walker, J.H. Integral Abutments for Steel Bridges; Tennessee Department of Transportation: Nashville, TN, USA, 1996; pp. 1–18.
- Fiorentino, G.; Cengiz, C.; Luca, F.D.; Mylonakis, G.; Karamitros, D.; Dietz, M.; Nuti, C. Integral abutment bridges: Investigation of seismic soil-structure interaction effects by shaking table testing. Earthq. Eng. Struct. Dyn. 2020, 1–22. [Google Scholar] [CrossRef]
- Zordan, T.; Briseghella, B.; Cheng, L. Parametric and pushover analyses on integral abutment bridge. Eng. Struct. 2011, 33, 502–515. [Google Scholar] [CrossRef]
- Sandberg, J.; Argyle, T.; Petty, R.; Patel, B.; Nowak, P. The design of integral bridges with bankseat, half-height and full-height abutments on the a14, UK. Proc. Inst. Civ. Eng. Bridge Eng. 2018, 171, 222–234. [Google Scholar] [CrossRef]
- Dicleli, M.; Erhan, S. Low cycle fatigue effects in integral bridge steel H-piles under seismic displacement reversals. Bridge Struct. 2013, 9, 185–190. [Google Scholar] [CrossRef]
- Spyrakos, C.; Loannidis, G. Seismic behavior of a post-tensioned integral bridge including soil–structure interaction (SSI). Soil Dyn. Earthq. Eng. 2003, 23, 53–63. [Google Scholar] [CrossRef]
- Lafave, J.M.; Riddle, J.K.; Jarrett, M.W.; Wright, B.A.; Svatora, J.S.; An, H.; Fahnestock, L.A. Numerical Simulations of Steel Integral Abutment Bridges under Thermal Loading. J. Bridge Eng. 2016, 21, 04016061. [Google Scholar] [CrossRef]
- David, T.K.; Forth, J.P. Modeling of soil structure interaction of integral abutment bridges. World Acad. Sci. Eng. Technol. 2011, 78, 754–769. [Google Scholar]
- Erhan, S.; Dicleli, M. Effect of dynamic soil–bridge interaction modeling assumptions on the calculated seismic response of integral bridges. Soil Dyn. Earthq. Eng. 2014, 66, 42–55. [Google Scholar] [CrossRef]
- Brooke, H.Q.; Scott, A.C. Parametric Study on Effects of Pile Orientation in Integral Abutment Bridges. J. Bridge Eng. 2017, 22, 04016132. [Google Scholar]
- Kozak, D.L.; LaFave, J.M.; Fahnestock, L.A. Seismic modeling of integral abutment bridges in Illinois. Eng. Struct. 2018, 165, 170–183. [Google Scholar] [CrossRef]
- SAP2000. Integrated Finite Element Analysis and Design of Structures; Computers and Structures Inc.: Berkeley, CA, USA, 1998. [Google Scholar]
- Coduto, D.P.; Yeung, M.C.R.; Kitch, W.A. Geotechnical Engineering Principles and Practice; Prentice-Hall: Saddle River, NJ, USA, 1999; pp. 121–158. [Google Scholar]
- Shamsabadi, A.; Rollins, K.M.; Kapuskar, M. Nonlinear Soil-Abutment-Bridge Structure Interaction for Seismic Performance-Based Design. J. Geotech. Geoenviron. 2007, 133, 707–720. [Google Scholar] [CrossRef]
- Caltrans. Seismic Design Criteria, Version 1.6; California Department of Transportation: Sacramento, CA, USA, 2010.
- American Petroleum Institute (API). Recommended Practice for Planning, Designing and Constructing Fixed Offshore Platforms-Working Stress Design; API Publishing Services: Washington, DC, USA, 2000. [Google Scholar]
- Cummins, C.R. Behavior of a Full-Scale Pile Cap with Loosely and Densely-Compacted Clean Sand Backfill under Cyclic and Dynamic Loadings; Brigham Young University: Provo, UT, USA, 2009. [Google Scholar]
- Pacific Earthquake Engineering Research Center (PEER). PEER Strong Motion Database. Available online: http://ngawest2.berkeley.edu/search.html (accessed on 1 May 2020).
- William, B.; Joyner, D.M.B. Peak horizontal acceleration and velocity from strong-motion records including records from the 1979 Imperial Valley, California, earthquake. Bull. Seismol. Soc. Am. 1981, 71, 2011–2038. [Google Scholar]


| Case | Abutment Backfill |
|---|---|
| 1 | Loosely compacted sand () |
| 2 | Medium-densely compacted sand () |
| 3 | Densely compacted sand () |
| Model | Abutment Backfill | Skew Angle (°) | Period (s) | Mode Shape | X Dir | Y Dir |
|---|---|---|---|---|---|---|
| Mass (%) | ||||||
| 1 | Loosely compacted sand | 0 | 0.351 | LT | 92.0 | 0.0 |
| 2 | Loosely compacted sand | 15 | 0.338 | LT | 87.0 | 6.7 |
| 3 | Loosely compacted sand | 30 | 0.326 | LT + TT | 69.0 | 24.0 |
| 4 | Loosely compacted sand | 45 | 0.308 | LT + TT | 47.0 | 46.0 |
| 5 | Medium-densely compacted sand | 0 | 0.311 | LT | 88.0 | 0.0 |
| 6 | Medium-densely compacted sand | 15 | 0.298 | LT | 85.0 | 6.1 |
| 7 | Medium-densely compacted sand | 30 | 0.287 | LT + TT | 69.0 | 23.0 |
| 8 | Medium-densely compacted sand | 45 | 0.271 | LT + TT | 45.0 | 40.0 |
| 9 | Densely compacted sand | 0 | 0.272 | LT | 77.0 | 0.0 |
| 10 (Prototype) | Densely compacted sand | 15 | 0.256 | LT | 80.0 | 5.4 |
| 11 | Densely compacted sand | 30 | 0.248 | LT + TT | 67.0 | 21.0 |
| 12 | Densely compacted sand | 45 | 0.234 | LT + TT | 43.0 | 40.0 |
| 13 | Soil-free | 0 | 0.606 | LT | 97.0 | 0.0 |
| 14 | Soil-free | 15 | 0.593 | LT | 97.0 | 0.0 |
| 15 | Soil-free | 30 | 0.587 | LT | 95.0 | 2.0 |
| 16 | Soil-free | 45 | 0.589 | LT | 89.0 | 8.4 |
| Parameters | EQ1 | EQ2 | EQ3 | |||
|---|---|---|---|---|---|---|
| GM1 | GM2 | GM3 | GM4 | GM5 | GM6 | |
| Ground motion type | Pulse | Non-pulse | Pulse | Non-pulse | Pulse | Non-pulse |
| Fault Type | Strike-Slip | Reverse | Strike-Slip | |||
| Earthquake event | Kocaeli | Northridge | Kobe | |||
| Station name | Yarimca | Newhall-W_Pico_Canyon_Rd. | Takatori | |||
| Earthquake magnitude | 7.5 | 6.7 | 6.9 | |||
| (km) | 1.4 | 2.1 | 1.5 | |||
| Duration (s) | 35.00 | 35.00 | 24.98 | 24.98 | 40.95 | 40.95 |
| (s) | 4.6 | 0 | 2.2 | 0 | 1.6 | 0 |
| PGA (g) | 0.2 | 0.2 | 0.2 | 0.2 | 0.2 | 0.2 |
| PGV (cm/s) | 47.66 | 21.75 | 54.57 | 20.48 | 50.69 | 22.11 |
| PGV/PGA (s) | 0.238 | 0.109 | 0.273 | 0.102 | 0.253 | 0.110 |
| Abutment | Lateral Displacement | Location | Pulse Ground Motion (mm) | Non-Pulse Motion (mm) | ||||
|---|---|---|---|---|---|---|---|---|
| GM1 | GM3 | GM5 | GM2 | GM4 | GM6 | |||
| Abutment 1 | Longitudinal | Acute | 9.1 | 9.3 | 8.7 | 8.5 | 8.9 | 11.2 |
| Obtuse | 4.6 | 6.8 | 6.1 | 6.0 | 6.3 | 8.8 | ||
| Transverse | Acute | 15.5 | 21.8 | 15.5 | 12.9 | 14.1 | 15.4 | |
| Obtuse | 13.9 | 20.0 | 14.0 | 11.4 | 12.5 | 13.7 | ||
| Abutment 2 | Longitudinal | Acute | 7.4 | 9.6 | 8.9 | 8.6 | 8.9 | 11.3 |
| Obtuse | 6.3 | 6.7 | 5.9 | 5.8 | 6.1 | 8.4 | ||
| Transverse | Acute | 14.3 | 15.0 | 14.5 | 12.8 | 15.0 | 14.1 | |
| Obtuse | 12.6 | 13.3 | 12.9 | 11.2 | 13.4 | 12.4 | ||
Publisher’s Note: MDPI stays neutral with regard to jurisdictional claims in published maps and institutional affiliations. |
© 2021 by the authors. Licensee MDPI, Basel, Switzerland. This article is an open access article distributed under the terms and conditions of the Creative Commons Attribution (CC BY) license (https://creativecommons.org/licenses/by/4.0/).
Share and Cite
Zhao, Q.; Dong, S.; Wang, Q. Seismic Response of Skewed Integral Abutment Bridges under Near-Fault Ground Motions, Including Soil–Structure Interaction. Appl. Sci. 2021, 11, 3217. https://doi.org/10.3390/app11073217
Zhao Q, Dong S, Wang Q. Seismic Response of Skewed Integral Abutment Bridges under Near-Fault Ground Motions, Including Soil–Structure Interaction. Applied Sciences. 2021; 11(7):3217. https://doi.org/10.3390/app11073217
Chicago/Turabian StyleZhao, Qiuhong, Shuo Dong, and Qingwei Wang. 2021. "Seismic Response of Skewed Integral Abutment Bridges under Near-Fault Ground Motions, Including Soil–Structure Interaction" Applied Sciences 11, no. 7: 3217. https://doi.org/10.3390/app11073217
APA StyleZhao, Q., Dong, S., & Wang, Q. (2021). Seismic Response of Skewed Integral Abutment Bridges under Near-Fault Ground Motions, Including Soil–Structure Interaction. Applied Sciences, 11(7), 3217. https://doi.org/10.3390/app11073217